Article

The Impact of Fulvic Acids on Cotton Growth, Yield and Phosphorus Fertilizer Use Efficiency Under Different Phosphorus Fertilization Rates in Xinjiang, China

1
College of Resources and Environment, Xinjiang Agricultural University, Urumqi 830052, China
2
Department of Soil Science, University of Manitoba, Winnipeg, MB R3T 2N2, Canada
3
Xinjiang Xinlianxin Energy Chemical Co., Ltd., Manas 832200, China
*
Author to whom correspondence should be addressed.
Agronomy 2025, 15(4), 992; https://doi.org/10.3390/agronomy15040992
Submission received: 23 March 2025 / Revised: 11 April 2025 / Accepted: 17 April 2025 / Published: 21 April 2025
(This article belongs to the Section Soil and Plant Nutrition)

Abstract

:
Chemical phosphorus (P) fertilizer is often overused in arid regions with alkaline soils due to soil fixation. Fulvic acid (FA) can increase soil P availability, enhancing crop yield and P use efficiency, but its interaction with P fertilization rates and potential to reduce P fertilizer application remains unclear. A 2-year (2019–2020) field experiment was conducted in Xinjiang, China, to study the impact of FA addition (45 kg ha−1) on cotton yield and P use efficiency under different P fertilization rates (0, 50, 100 and 150 kg P2O5 ha−1). Our results showed that P fertilization significantly enhanced cotton biomass, P uptake and seed cotton yields by 17–37%, but the partial nutrient balance (PNB), agronomic efficiency (AE) and partial factor productivity (PFP) decreased with increasing P fertilization rates. FA addition did not change cotton biomass and P uptake, but significantly enhanced seed cotton yield, AE and PFP by increasing bolls per plant. No significant interactions between FA addition and P fertilization rates were observed for cotton biomass, P uptake, seed cotton yield and P use efficiencies. These findings suggest that FA can improve cotton productivity, AE and PPF of P fertilizers, helping to keep the P balance in the cotton field.

1. Introduction

Cotton is one of the most important fiber crops in the world and is vital for global textile production, rural livelihoods and economic development [1]. China is the world’s largest cotton producer (https://www.fao.org (accessed on 23 February 2025)), with the Xinjiang Uyghur Autonomous Region the primary cotton-growing region. According to data from the National Bureau of Statistics (data.stats.gov.cn (accessed on 23 February 2025)), in 2023, the planting area and the total lint yield of cotton in Xinjiang were about 2.37 million hectares and 5.11 million tons, accounting for 85% of China’s total cotton planting area and 91% of its total yield. Such extensive cultivation and high yields are mainly attributed to the widespread adoption of drip irrigation under plastic film mulching and the intensive use of chemical fertilizers, both of which have significantly increased water use efficiency and soil nutrient availability, thus promoting cotton yield [2,3]. However, to sustain the high cotton yield, excessive chemical fertilizers are often applied, especially phosphorus (P), due to its generally lower use efficiency [4,5]. Soils in Xinjiang are generally alkaline with high calcium concentrations, and this region is typically arid with limited water availability for most of the time during the growing season. These factors cause rapid P fixation through adsorption and precipitation of calcium phosphate, in addition to the low diffusion rates in soils [6,7]. According to Tang et al. [5], the seed cotton yield was about 5544 kg ha−1, and the corresponding above-ground plant P uptake was 55.86 kg·ha−1 in most cotton fields in Xinjiang. However, the amount of applied chemical P fertilizer was between 150 and 207 kg P2O5 ha−1, which is significantly higher than the requirement for cotton and results in a low P use efficiency of only 15%. The overapplication of P fertilizer leads to not only a waste of P resources but also several environmental risks, such as the eutrophication of water bodies.
Humic substances, like humic acid and fulvic acid (FA), have been reported to increase soil P availability [8,9], promote crop P uptake and use efficiency [10] and enhance crop yield [11,12,13]. Several reviews have summarized the underlying mechanisms for these effects [14,15,16,17]. Firstly, humic substances can improve soil P mobility and availability by chelating cations, thus reducing their adsorption on phosphate, changing soil pH and stimulating microbial activities. Secondly, they can enhance plant nutrient uptake by increasing root growth or rhizosphere microbial activity. Thirdly, some humic substances exhibit auxin-like functions to regulate plant growth and development. Lastly, humic substances can modify plant secondary metabolism to alleviate drought or salt stresses. However, most of these studies have been conducted under controlled environmental conditions in the greenhouse, limiting their applications to field practice [18]. Additionally, some field studies have reported no significant effects or even negative outcomes from humic substance application [19,20,21], suggesting more field experiments are needed to demonstrate their effectiveness across different crops and environmental conditions [22], which is essential for the real processes of agricultural production.
In this study, FA was selected as the target humic substance due to its high solubility, making it suitable for the fertigation systems in arid regions. To assess the effects of FA addition on cotton fields and its potential to reduce the application rates of chemical P fertilizers, we conducted a 2-year field experiment and investigated the cotton growth, yield, P uptake and use efficiency as influenced by FA addition under different P fertilization rates. We hypothesized that FA addition would increase soil P availability and enhance cotton P uptake, thus promoting the cotton yield and P fertilizer use efficiency, especially under the lower application rates of P fertilizers.

2. Materials and Methods
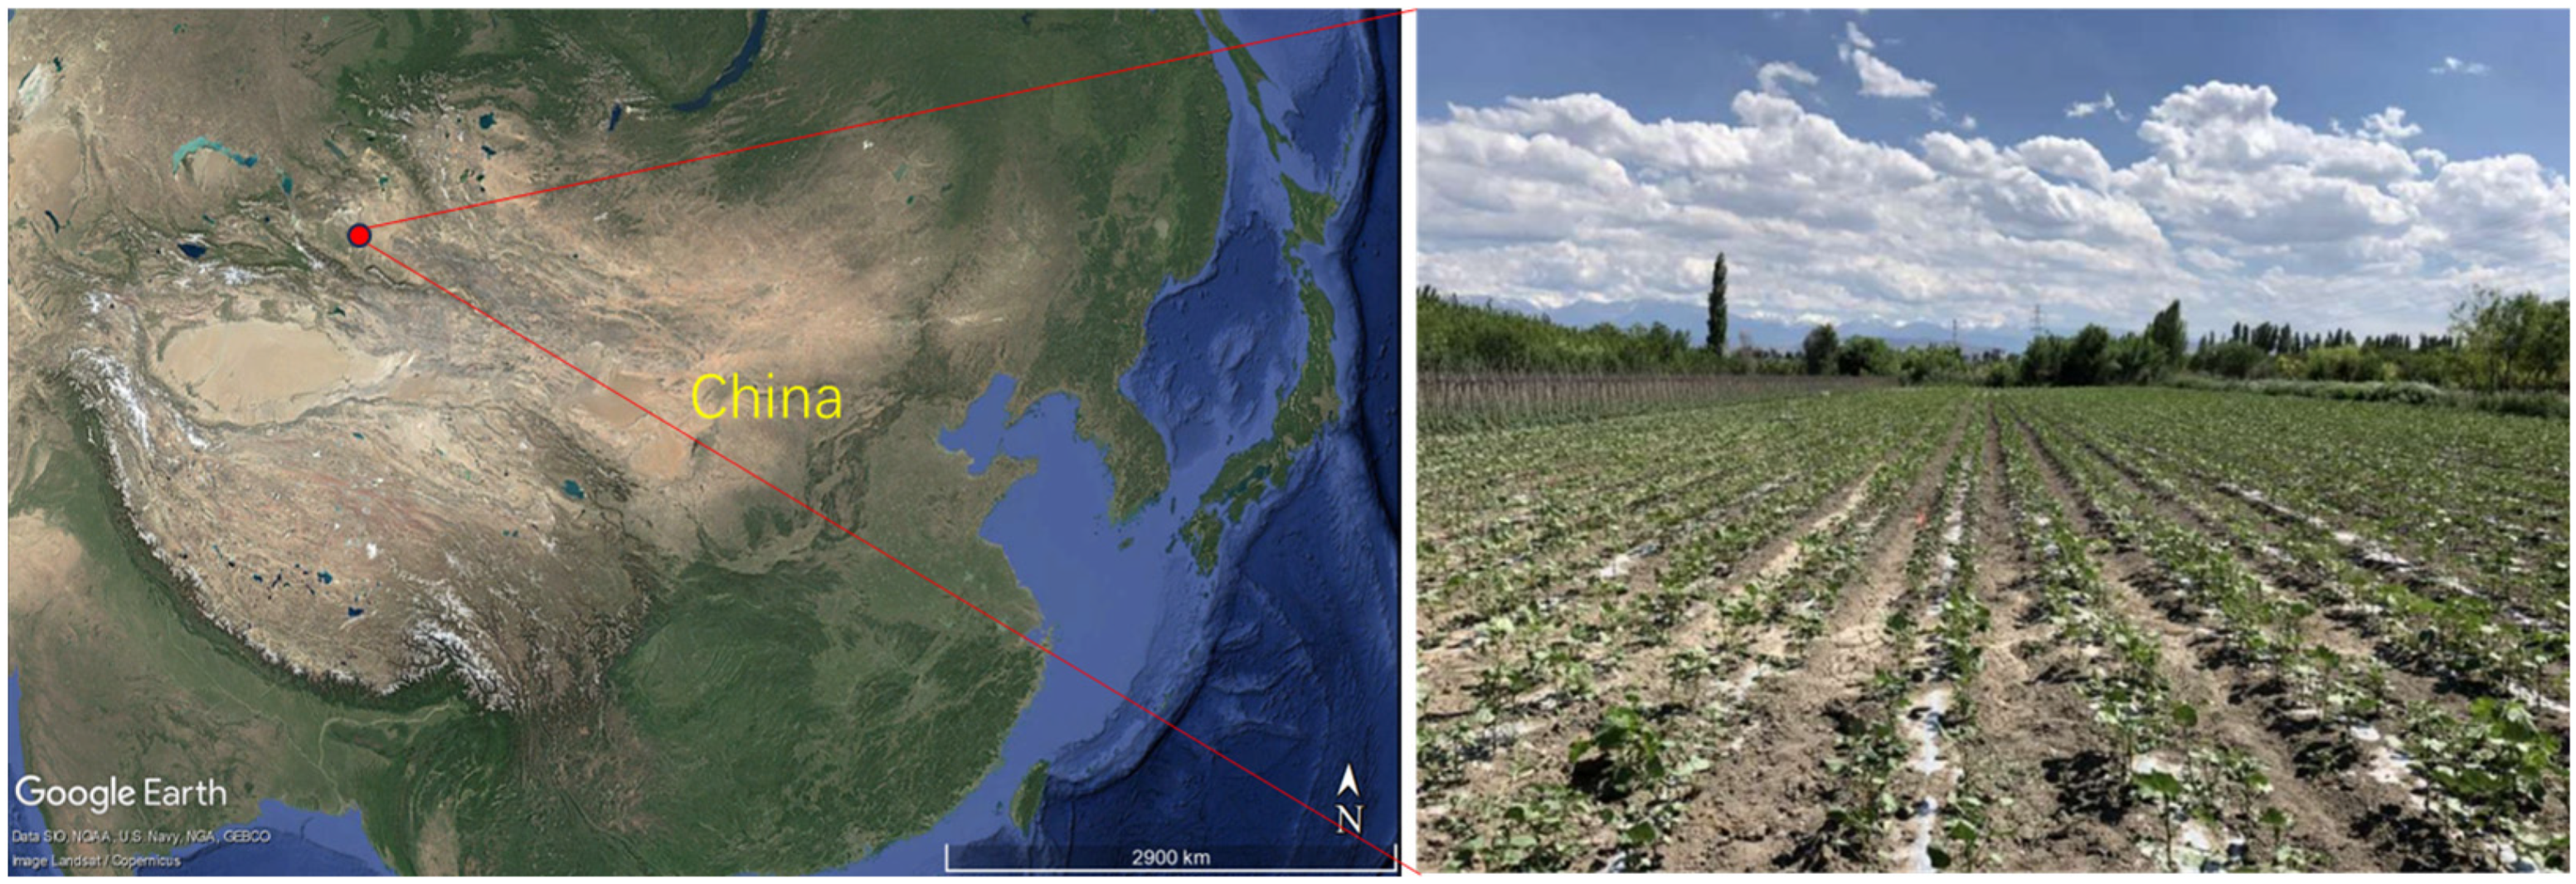
2.1. Study Site

This experiment was conducted in a cotton field in Fukang City, Xinjiang, China (88°00′44.30″ E, 44°10′21.05″ N) (Figure 1). This region has a continental arid climate, with an annual mean temperature of 6.6 °C and annual precipitation of 186 mm. The frost-free period averages 174 days per year. Cotton is the primary cash crop in this region, and the soil in the region is classified as Aridisols in Chinese soil taxonomy, equivalent to Calcisol in the FAO classification. Before the field trial, surface soil (top 20 cm) core samples were collected and analyzed (the detailed methods are described in Section 2.3). The surface soil had a pH of 8.1 (water to soil = 5:1), electrical conductivity of 226 mS·cm−1, organic matter content of 18.1 g·kg−1, available nitrogen content of 46.2 mg·kg−1 (low level), available phosphorus content of 13.6 mg·kg−1 (medium level) and available potassium of 454.8 mg kg−1 (extremely high level) [23].

2.2. Experimental Design

This field trial was conducted on a cotton farm with drip fertigation under plastic film. The experiment consisted of eight treatments in a factorial design of four P fertilization rates (0, 50, 100 and 150 kg P2O5 ha−1, designated as P0, P50, P100 and P150) and two FA addition levels (45 kg fulvic acid ha−1, designated as FA, and no fulvic acid addition, serving as control, CK). The applied nitrogen and potassium fertilizers were the same among the different treatments, 250 kg N ha−1 and 30 kg K2O ha−1. The treatments were arranged in a randomized complete block design with four replicates, resulting in a total number of 32 plots. The area of each plot was 20 m2 (5 m × 4 m).
Before seeding, the surface soil (approximately 20 cm depth) was tilled and leveled. An 80 cm wide plastic film was laid on the ground with a spacing of 20 cm between rows, and one drip irrigation tape was placed beneath the center of each film. On 8 May 2019 and 20 April 2020, cotton (Gossypium hirsutum) “XinLuZao64” was seeded on both sides of the irrigation tape (20 cm away from the tape) under the plastic film. Each plot had a water meter, valve and fertilization tank to monitor the amount of fertilizer and irrigation. Fertilization was applied via irrigation, with the total amount of fertilizers evenly distributed across six irrigation events during the growing season (Table 1). Urea (46-0-0, Kuitun Jinjiang Chemical Co., Ltd., Kuitun, China), monoammonium phosphate (12-61-0, Yunnan Zhongzheng Chemical Industry Co., Ltd., Kunming, China), potassium sulfate (0-0-50, Laishuo Technology Co., Ltd., Hangzhou, China) and fulvic acid (powder from plant material, Xinjiang Huier Agriculture Co., Ltd., Xinjiang Uyghur Autonomous Region, China) were used as fertilizers in this study (Table 2). Other management practices followed the local agronomic standards.

2.3. Measurement and Calculation

Soil sampling and analysis: At the boll opening stage (17 September 2019 and 7 September 2020), five soil cores of 0–20 cm depth were randomly collected from each plot and thoroughly mixed to create a composite soil sample weighing approximately 1.5 kg. Approximately 50 g of each soil sample was separated and stored at 4 °C to analyze the soil alkaline phosphatase activity. The remaining portion was air-dried and ground, then sieved through a 1 mm screen for chemical analysis. Soil pH and electrical conductivity (soil-to-water ratio of 1:5) were determined using a pH meter (PHS-3C, Shanghai Shengci Instrument Co., Ltd., Shanghai, China) and an electrical conductivity meter (DDS-307A, INASE Scientific Instrument Co., Ltd., Shanghai, China). Soil organic carbon (SOC) was measured using the Walkley and Black wet oxidation method [24]. Soil available nitrogen was measured according to Bao [24]. A total of 1 g of air-dried soil was incubated in 5 mL sodium hydroxide solution (1.2 M) in the outside ring of an airtight Conway diffusion cell, with 3 mL boric acid (0.3 M) added to the inner well at 40 °C for 24 h. With methyl red-bromocresol green as an indicator, 0.01 M hydrochloric acid was used to titrate ammonia absorbed in the boric acid. The soil available P was extracted using 0.5 mol L−1 NaHCO3 (2.5 g soil, 50 mL solution and 25 °C, shaken for 30 min) and measured using the molybdate–ascorbic acid method with a spectrophotometer (UV-1780, Shimadzu Corporation, Kyoto, Japan) [24]. The soil alkaline phosphatase activity was analyzed by the method using p-nitrophenyl phosphate (p-NPP) as substrate (1 g soil, 4 mL modified universal buffer and 1 mL p-nitrophenyl phosphate solution, incubated at 37 °C for 1 h), according to Tabatabai [25].
Cotton biomass and nutrient uptake: At the boll opening stage, 15 cotton plants were randomly sampled from each plot. Each plant was separated into different organs (shoot, leaf, shell, fiber and seed) and dried in an oven at 110 °C for 30 min, followed by drying at 80 °C until a constant weight. The dry matter weight of each organ was measured using an electronic scale with a precision of 0.01 g. The plant samples were then ground and digested with H2SO4–H2O2, and the total phosphorus concentration was determined using the molybdenum antimony colorimetric method [24]. Total plant P uptake was calculated as the sum of P uptake in each organ, determined by multiplying its dry weight by its P concentration.
Yield components: At the harvesting stage, the number of plants and bolls were counted manually based on a 1 m length film in each plot to calculate the indices of plants per hectare (plant density) and bolls per plant. Sixty bolls of seed cotton were collected from the bottom, middle and top of the plants and weighed to calculate the index of single boll weight. The theoretical yield was calculated as the product of plant density, number of bolls per plant and single boll weight.
Phosphorus use efficiency: The apparent recovery efficiency (RE), partial nutrient balance (PNB), agronomic efficiency (AE) and partial factor productivity (PFP) of P fertilizer were calculated using the following equations:
RE = (U − Uo)/F
PNB = Uh/F
AE = (Y − Yo)/F
PFP = Y/F
where U and Uo refer to the plant total P uptake with and without P fertilization; F refers to the amount of P fertilizer applied; Uh refers to the P content of the harvested portion (in this study, the straw was removed post-harvest, so Uh = U) and Y and Yo refer to the seed cotton yield with and without P fertilization.

2.4. Statistical Analysis

A three-way analysis of variance (ANOVA) was conducted to assess the effects of P fertilization rates, FA addition, year and their interactions on soil and plant variables. The least significant difference (LSD) method was used for multiple comparisons of means where the main or interactive effect was significant. Statistical analysis and plotting were performed using SPSS 16.0 (SPSS Inc., Chicago, IL, USA)) and SigmaPlot 12.5 (Systat Software Inc., Palo Alto, CA, USA) software.

3. Results

3.1. Soil pH, Olsen P and Alkaline Phosphatase Activity
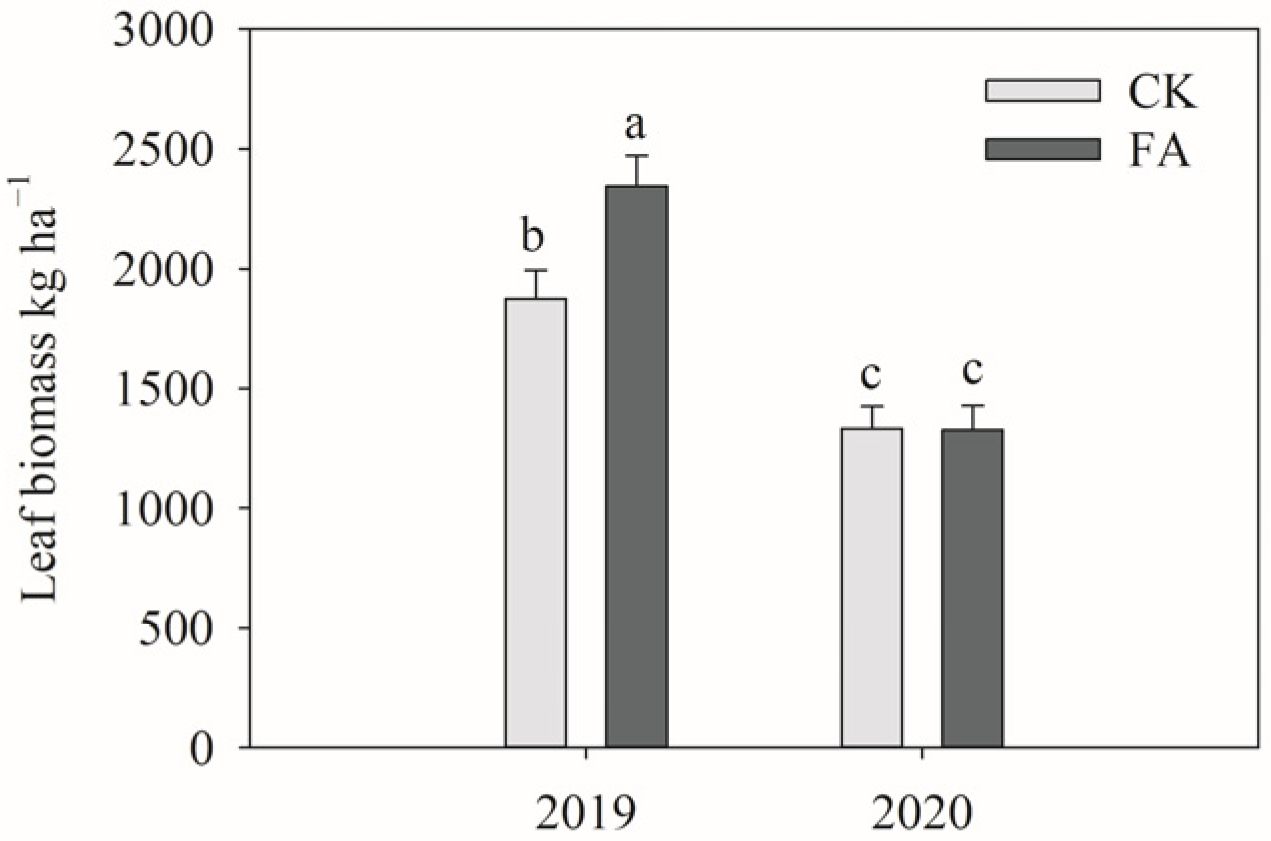
P fertilization significantly reduced the soil pH value. Soil pH decreased progressively with increasing P fertilization rates, with a significantly lower value observed under the P150 treatment compared to the P0 treatment. The P fertilization significantly increased the soil available P levels. Compared to the P0, the soil available P content was significantly higher under the P50, P100 and P150 treatments, with the highest value observed under the P50 and P150 treatments. Additionally, the FA addition significantly increased the soil available P by 4%. Neither the P fertilization nor FA addition affected the soil alkaline phosphatase activity. There was no significant interaction between the P fertilization and FA addition on soil pH, available P and alkaline phosphatase activity (Table 3).

3.2. Cotton Biomass

The cotton shoot, leaf, shell, fiber, seed and total biomasses increased with the increasing P fertilization rates, with significantly higher values observed under the P150 treatment compared to the P0 treatment. The FA addition significantly increased the cotton leaf and shell biomass (Table 4).
There was a significant interaction of FA addition treatments and year on leaf biomass. In 2019, the FA addition significantly increased leaf biomass, but in 2020, there was no significant difference in the leaf biomass between the FA and CK treatments (Figure 2).

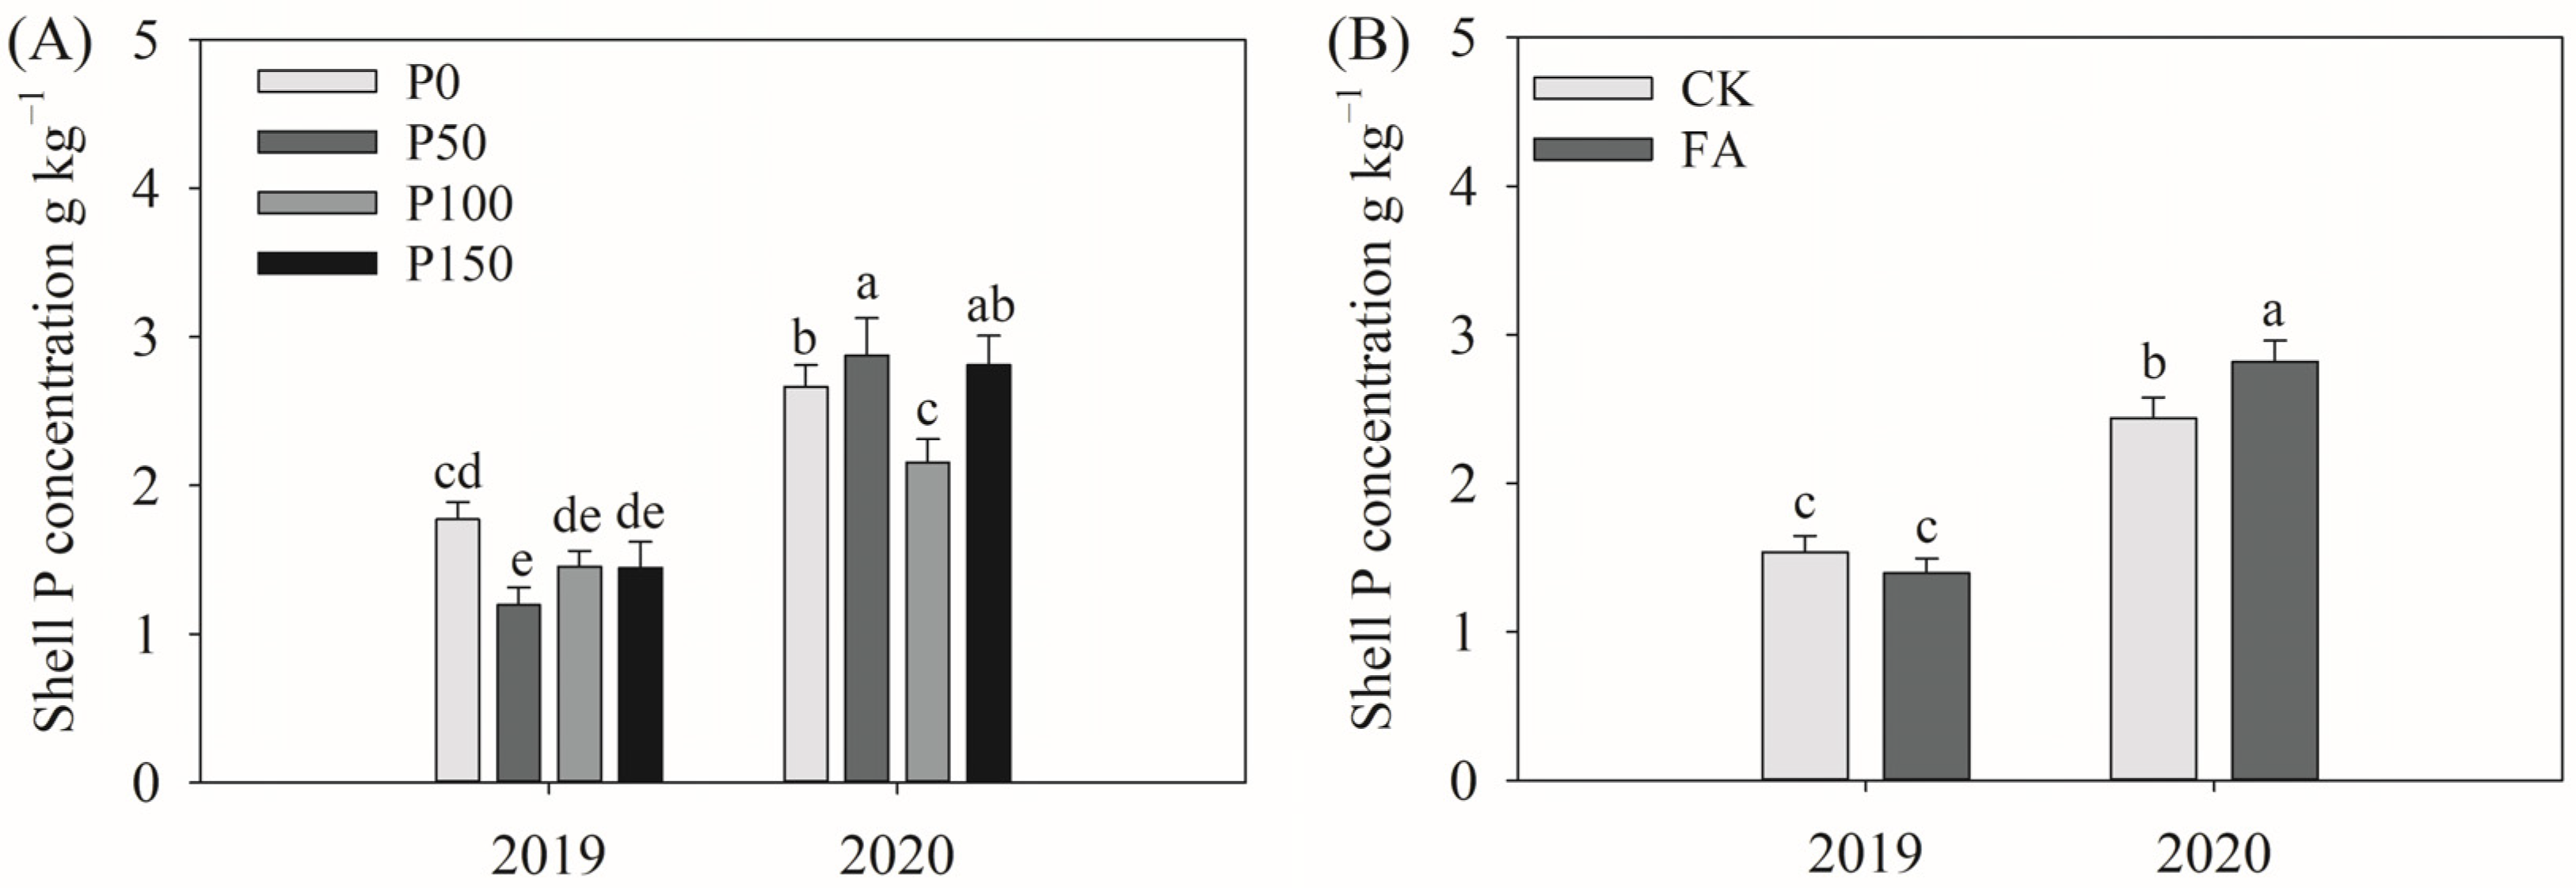
3.3. Cotton P Concentration

Neither P fertilization nor FA addition affected the P concentrations of different cotton organs (Table 5). The shoot, leaf, shell and seed P concentrations in 2019 were significantly higher than those measured in 2020.
The significant interaction between the year and P fertilization or FA addition was detected for the shell P concentration. In 2019, the highest shell P concentration was found in the P0 treatment, but in 2020, the highest value was found in the P50 and P150 treatments. FA addition significantly increased the shell P concentration in 2020, but not in 2019 (Figure 3).

3.4. Cotton P Uptake

The P fertilization significantly increased the cotton P uptake (Table 6). With the increasing P fertilization rates, the shoot, leaf, shell, seed and total P uptake showed an increasing trend, with significantly higher values observed under the P100 or P150 treatments. The shoot, shell, seed and total P uptake were significantly higher in 2020 than those in 2019. No significant effects of FA addition and its interaction with P fertilization were detected for cotton P uptake.

3.5. Yield and Components

The seed cotton yield increased with increasing P fertilization rates, with the highest value observed under the P100 and P150 treatments (Table 7). The FA addition significantly increased the seed cotton yield by 9%. The seed cotton yield was significantly higher in 2019 than in 2020. No significant interaction between the P fertilization and FA addition was detected in the seed cotton yield.
Analyzing yield components provides insights into the factors driving yield change. These results showed that P fertilization significantly increased plant density and single boll weight, with the highest value observed under the P150 treatment, and increased bolls per plant, with the highest value under the P100 treatment. FA addition significantly increased bolls per plant but did not affect the density and single boll weight. The density and single boll weight were significantly higher in 2020, but the bolls per plant were significantly higher in 2019.
There was a significant interaction between year and P fertilization on single boll weight. In 2019, there were no significant differences among the P fertilization rate treatments; however, in 2020, the single boll weight increased with increasing P fertilization rates, with the highest value observed under the P150 treatment (Figure 4).

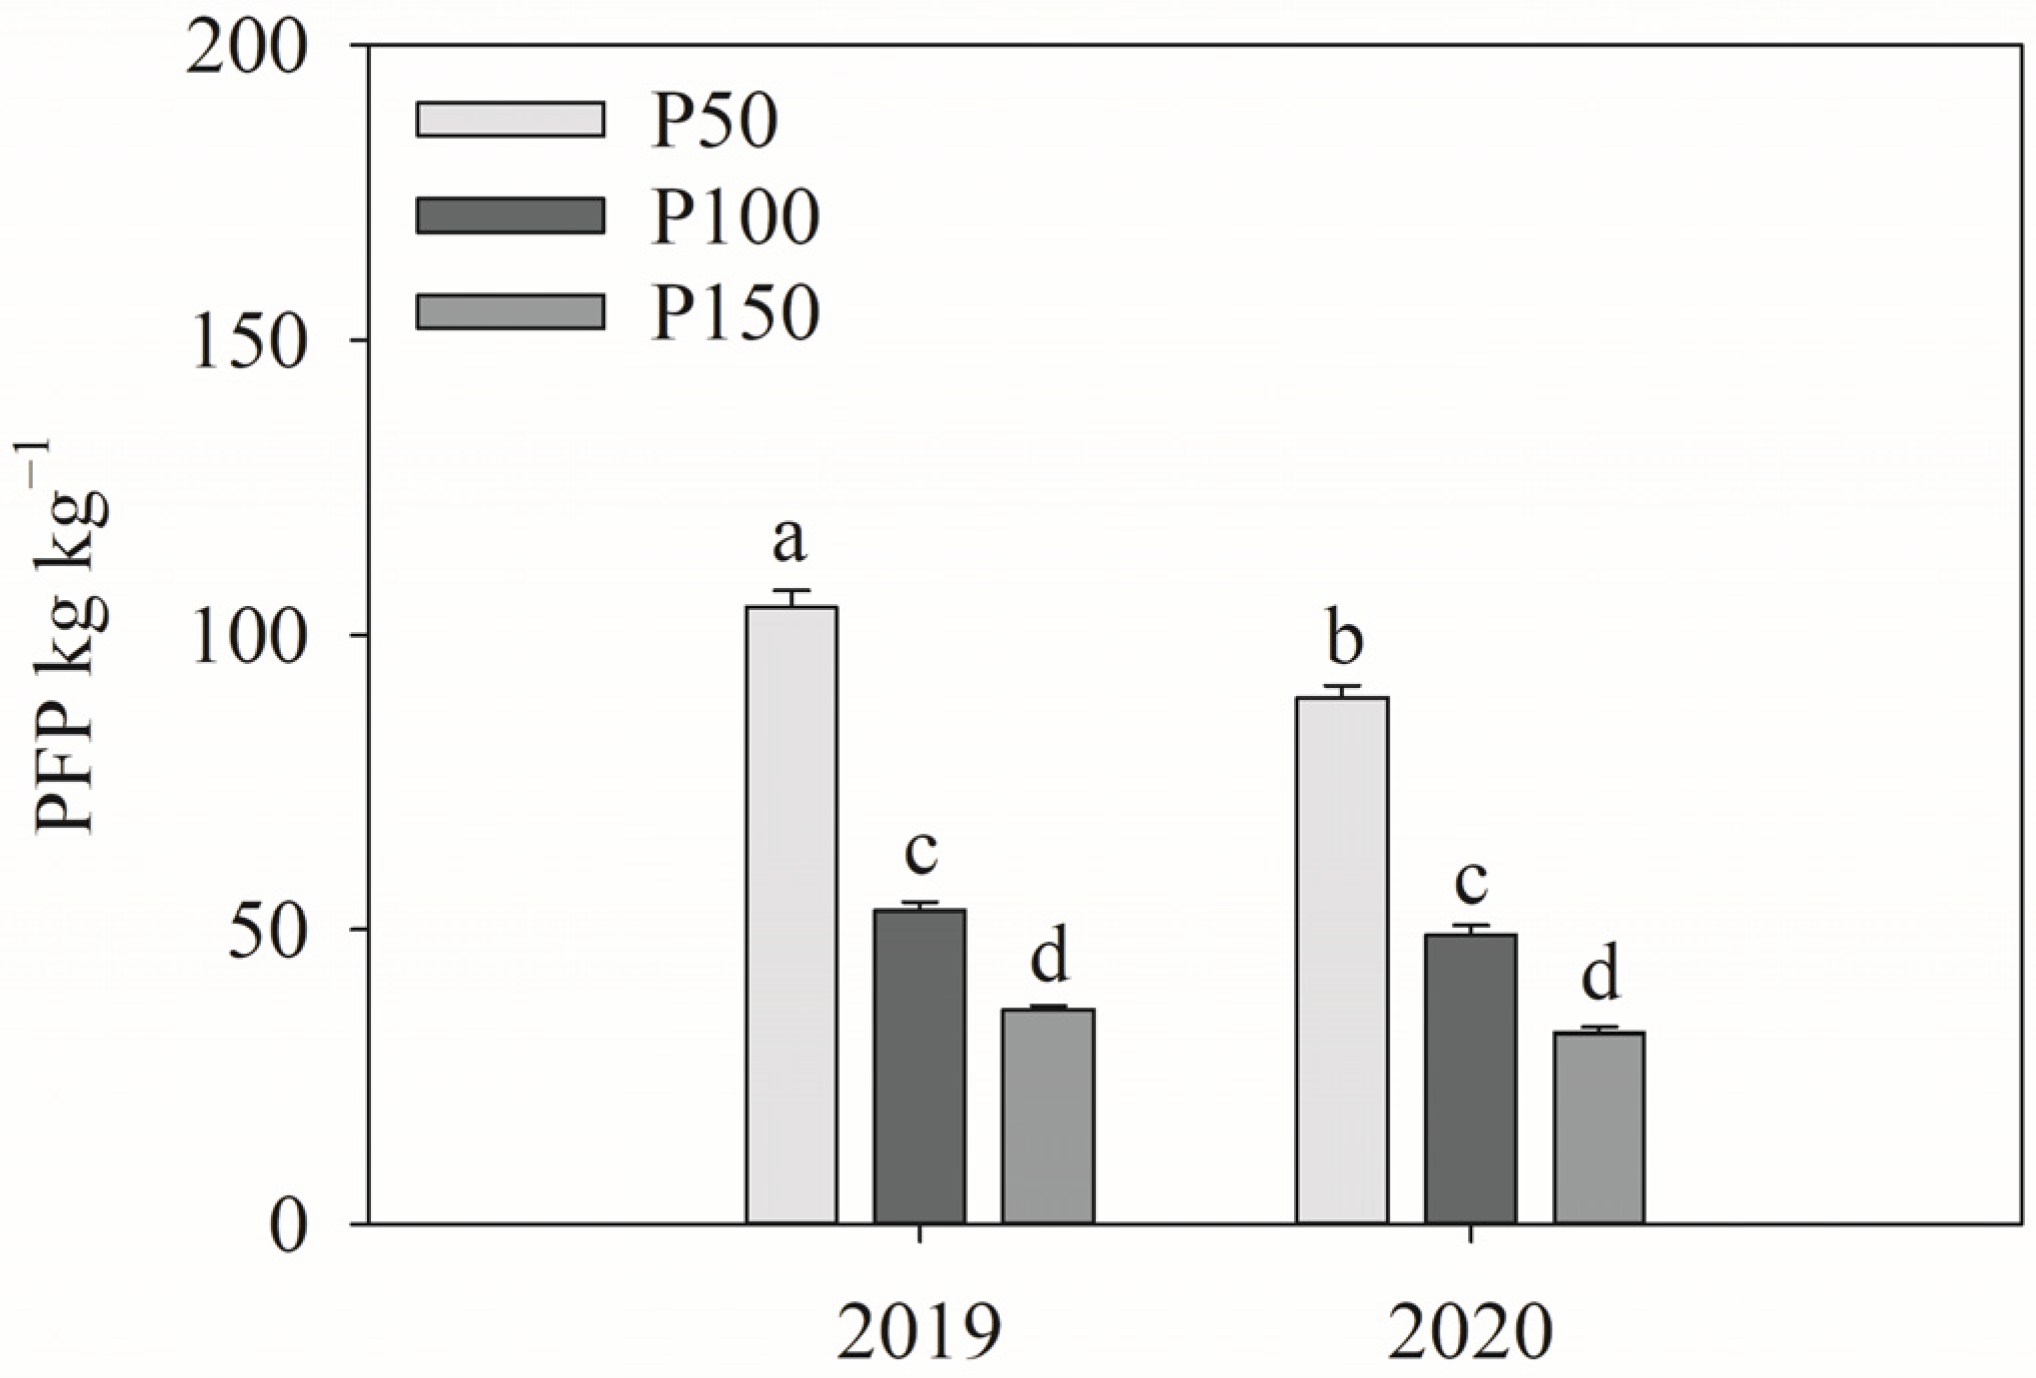
3.6. Phosphorus Use Efficiency

PNB, AE and PFP decreased with increasing P fertilization rates and were significantly higher in 2020 than in 2019 (Table 8). FA addition significantly increased AE and PFP. No significant interaction between P fertilization and FA addition was detected for RE, PNB, AE and PFP.
There was a significant interaction between year and P fertilization rates on PFP. The PFP under the P100 and P150 treatments was no different between 2019 and 2020, but that under the P50 treatment was significantly higher in 2019 than in 2020 (Figure 5).

4. Discussion

Soil available P is an important indicator of P that can be absorbed by plants. In this study, the P fertilization significantly increased soil available P, which is consistent with previous studies [26,27]. The increased soil available P might be caused by added P to the soil through fertilization. Additionally, soil pH decreased with increasing application of monoammonium phosphate (acidic) in this study, suggesting soil acidification caused by fertilization might be the other mechanism promoting soil P availability [7].
It has been widely reported that FA can increase soil P availability through mechanisms like acidification, chelating cations, or increasing microbial activity [9,10,28,29,30]. In this study, there was a significant increase in soil available P caused by FA addition. Concurrently, there was a slight decrease in soil pH under the FA addition treatment, although it was not significant. The changes in soil available P and pH suggest that FA addition might enhance soil P availability by promoting acidification.
Lots of studies have reported that FA could stimulate plant root growth and rhizosphere microbial activity, increase plant nutrient uptake and promote plant growth [9,15,16,31,32]. However, in this study, we did not find a significant effect of FA on cotton P uptake and growth, except for increased leaf and shell biomass. It might be caused by the complicated impact factors in the field condition, which overwhelmed the effects of FA acid addition [18]. Additionally, the dosage effect might influence the response of plant growth to FA addition. The appropriate amount of FA can stimulate seed germination, root growth and nutrient uptake, but lower or higher amounts of FA have no positive effect or may even have negative effects [31,32].
In this study, P fertilization significantly promoted seed cotton yield, which was consistent with previous studies [26,33,34]. The increasing harvest plant density, bolls per plant or single boll weight might explain the higher seed cotton yield under P fertilization treatment (Table 7). P is a crucial nutrient for seedling emergence rate, because at that stage, plants grow fast and cell division happens frequently, which requires more P for cell membranes and the energy transfer system [35]. Additionally, P has the functions of stimulating crop development and enhancing carbohydrate transportation from the leaves to the bolls [36], which results in more bolls per plant and higher single boll weight.
The seed cotton yield and bolls per plant were significantly higher under the FA addition treatment (Table 7), suggesting that FA addition might have promoted seed cotton yield through increasing bolls per plant in this study. It is common in arid regions that extreme drought and heat cause the shedding of cotton bolls during the flowering boll stage and significantly reduce cotton yield [37]. FA has the function of increasing plant resistance to drought and other environmental stresses [16,17,38], which might reduce boll shedding and result in more bolls per plant and higher seed cotton yield.
In this study, PNB, AE and PFP decreased with the increasing P fertilization rates, which was consistent with most previous studies [39,40,41,42] and can be explained by the law of diminishing returns to fertilizer [43]. P fertilization can enhance crop P uptake and yield; however, with the increasing rates of P fertilization, the growth rates of cotton P uptake and seed cotton yield became slower. That resulted in the reduced PNB, AE and PFP with the increasing P fertilization rates. FA addition significantly increased AE and PFP in this study, but not AE and PNB. These indicate that the main mechanism of FA addition on P fertilizer use efficiency was to promote cotton yield through increasing bolls per plant, compared with enhancing plant P uptake.

5. Conclusions

Our study showed that the soil P availability, cotton biomass, uptake and yield increased with the increasing P fertilization rates, but the PNB, AE and PFP decreased with increasing P fertilization rates. Considering the seed cotton yield and field P balance, the P fertilization rate was recommended to be around 100 kg P2O5 ha−1 to get a higher seed cotton yield and keep the balance of P in this field. FA addition significantly increased seed cotton yield through increasing bolls per plant, thus promoting AE and PFP. Therefore, FA can be applied to enhance cotton yield by ensuring P balance in the cotton field in arid regions.

Author Contributions

Conceptualization, K.Z., X.G., B.C. and J.S.; methodology, C.M. and F.Y.; software, C.M. and F.Y.; validation, C.M., F.Y. and K.Z.; formal analysis, K.Z.; investigation, C.M. and F.Y.; resources, K.Z.; data curation, C.M. and K.Z.; writing—original draft preparation, K.Z., C.M. and F.Y.; writing—review and editing, K.Z., X.G., B.C. and J.S.; visualization, K.Z.; supervision, J.S.; project administration, K.Z.; funding acquisition, K.Z. All authors have read and agreed to the published version of the manuscript.

Funding

This research was funded by the Key Research and Development Project of Xinjiang Uygur Autonomous Region (Grant No. 2022B02020-2), the Science and Technology Major Project of Xinjiang Uygur Autonomous Region (Grant No. 2022A02003-2) and the National Natural Science Foundation of China (Grant No. 41761067).

Data Availability Statement

The original contributions presented in the study are included in the article; further inquiries can be directed to the corresponding or first author.

Conflicts of Interest

Chao Ma is an employee of Xinjiang Xinlianxin Energy Chemical Co., Ltd. The remaining authors declare that the research was conducted in the absence of any commercial or financial relationships that could be construed as a potential conflict of interest.

References

  1. Khan, M.A.; Wahid, A.; Ahmad, M.; Tahir, M.T.; Ahmed, M.; Ahmad, S.; Hasanuzzaman, M. World cotton production and consumption: An overview. In Cotton Production and Uses: Agronomy, Crop Protection, and Postharvest Technologies; Shakeel, A., Mirza, H., Eds.; Springer Nature Singapore Pte Ltd.: Singapore, 2020; pp. 1–7. [Google Scholar]
  2. Bai, Y.; Mao, S.; Tian, L.; Li, L.; Dong, H. Advances and prospects of high-yielding and simplified cotton cultivation technology in Xinjiang cotton-growing area. Sci. Agric. Sin. 2017, 50, 38–50. [Google Scholar] [CrossRef]
  3. Feng, L.; Wan, S.; Zhang, Y.; Dong, H. Xinjiang cotton: Achieving super-high yield through efficient utilization of light, heat, water, and fertilizer by three generations of cultivation technology systems. Field Crops Res. 2024, 312, 109401. [Google Scholar] [CrossRef]
  4. Chen, J.; Guan, Y.; Wang, J.; Chu, G. The long-term evolution of phosphate fertilizer application amount, efficiency and types on main crops in Xinjiang. Xinjiang Agric. Sci. 2016, 53, 1858–1866. [Google Scholar]
  5. Tang, M.; Shen, C.; Zhang, Y.; Yan, C.; Fu, G.; Xu, Y.; Tang, G.; Geng, Q. Investigation of fertilizer use efficiency for cotton in Xinjiang. Soil Fertil. Sci. China 2022, 4, 161–168. [Google Scholar] [CrossRef]
  6. Muindi, E.D.M. Understanding soil phosphorus. Int. J. Plant Soil Sci. 2019, 31, 1–18. [Google Scholar] [CrossRef]
  7. Penn, C.J.; Camberato, J.J. A critical review on soil chemical processes that control how soil pH affects phosphorus availability to plants. Agriculture 2019, 9, 120. [Google Scholar] [CrossRef]
  8. Merwad, A.R.M.A. Effect of humic and fulvic substances and Moringa leaf extract on Sudan grass plants grown under saline conditions. Can. J. Soil Sci. 2017, 97, 703–716. [Google Scholar] [CrossRef]
  9. Shi, X.; Gu, D.; Yang, H.; Li, Y.; Jiang, Y.; Zhan, N.; Cui, X. Effect of exogenous organic matter on phosphorus forms in middle-high fertility cinnamon soil. Plants 2024, 13, 1313. [Google Scholar] [CrossRef]
  10. Liu, X.; Yang, J.; Tao, J.; Yao, R. Integrated application of inorganic fertilizer with fulvic acid for improving soil nutrient supply and nutrient use efficiency of winter wheat in a salt-affected soil. Appl. Soil Ecol. 2022, 170, 104255. [Google Scholar] [CrossRef]
  11. Alsudays, I.M.; Alshammary, F.H.; Alabdallah, N.M.; Alatawi, A.; Alotaibi, M.M.; Alwutayd, K.M.; Alharbi, M.M.; Alghanem, S.M.S.; Alzuaibr, F.M.; Gharib, H.S.; et al. Applications of humic and fulvic acid under saline soil conditions to improve growth and yield in barley. BMC Plant Biol. 2024, 24, 191. [Google Scholar] [CrossRef]
  12. Bustos, I.; Schoebitz, M.; Zagal, E.; Muñoz, C. Evaluation of liquid phosphorus fertilizers and fulvic acids in a potato crop in an Andisol type soil. Int. J. Agric. Nat. Resour. 2022, 49, 123–129. [Google Scholar] [CrossRef]
  13. Hareem, M.; Danish, S.; Al Obaid, S.; Ansari, M.J.; Datta, R. Mitigation of drought stress in chili plants (Capsicum annuum L.) using mango fruit waste biochar, fulvic acid and cobalt. Sci. Rep. 2024, 14, 14270. [Google Scholar] [CrossRef] [PubMed]
  14. Ampong, K.; Thilakaranthna, M.S.; Gorim, L.Y. Understanding the role of humic acids on crop performance and soil health. Front. Agron. 2022, 4, 848621. [Google Scholar] [CrossRef]
  15. Bezuglova, O.; Klimenko, A. Application of humic substances in agricultural industry. Agronomy 2022, 12, 584. [Google Scholar] [CrossRef]
  16. Canellas, L.P.; Olivares, F.L.; Aguiar, N.O.; Jones, D.L.; Nebbioso, A.; Mazzei, P.; Piccolo, A. Humic and fulvic acids as biostimulants in horticulture. Sci. Hortic. 2015, 196, 15–27. [Google Scholar] [CrossRef]
  17. Rathor, P.; Gorim, L.Y.; Thilakarathna, M.S. Plant physiological and molecular responses triggered by humic based biostimulants-A way forward to sustainable agriculture. Plant Soil 2023, 492, 31–60. [Google Scholar] [CrossRef]
  18. Olk, D.C.; Dinnes, D.L.; Scoresby, J.R.; Callaway, C.R.; Darlington, J.W. Humic products in agriculture: Potential benefits and research challenges-a review. J. Soils Sed. 2018, 18, 2881–2891. [Google Scholar] [CrossRef]
  19. Jordan, D.L.; Hare, A.T.; Wells, R. Peanut response to a commercial blend of nitrogen, phosphorus, potassium, and fulvic acid. Crop Forage Turf. Man. 2022, 8, e20180. [Google Scholar] [CrossRef]
  20. Kumar Sootahar, M.; Zeng, X.; Su, S.; Wang, Y.; Bai, L.; Zhang, Y.; Li, T.; Zhang, X. The effect of fulvic acids derived from different materials on changing properties of albic black soil in the Northeast Plain of China. Molecules 2019, 24, 1535. [Google Scholar] [CrossRef]
  21. Santos, M.D.; Cavalcanti, M.T.; Pessoa, L.N.; Silva, Z.G.D.; da Silva, A.M.; Souza, T.; Henschel, J.M.; Pereira, E.M.; Neto, M.A.D.; Diniz, B.L.M.T. Exploring the impact of humic biostimulants on cassava yield and nutrition in Northeast Brazil. Sustainability 2024, 16, 4088. [Google Scholar] [CrossRef]
  22. Rose, M.T.; Patti, A.F.; Little, K.R.; Brown, A.L.; Jackson, W.R.; Cavagnaro, T.R. A meta-analysis and review of plant-growth response to humic substances: Practical implications for agriculture. Adv. Agron. 2014, 124, 37–89. [Google Scholar] [CrossRef]
  23. Yuan, F.; Zhang, K.; Ma, C.; Zhang, N.; Sheng, J.; Zhang, W. Effect of organic fertilizer addition on field phosphorus status and yield under different amounts of phosphorus fertilization in cotton field in Xinjiang, China. J. Agric. Resour. Environ. 2022, 39, 118–128. [Google Scholar] [CrossRef]
  24. Bao, S. Soil Agro-Chemistrical Analysis, 3rd ed.; China Agriculture Press: Beijing, China, 2000. [Google Scholar]
  25. Tabatabai, M. Soil enzymes. In Methods of Soil Analysis: Part 2 Microbiological and Biochemical Properties; Weaver, R.W., Angle, S., Bottomley, P., Bezdicek, D., Smith, S., Tabatabai, A., Wollum, A., Eds.; Soil Science Society of America, Inc.: Madison, WI, USA, 1994; Volume 5, pp. 775–833. [Google Scholar]
  26. Chen, B.; Sheng, J.; Jiang, P.; Liu, Y. Effect of applying different forms and rates of phosphoric fertilizer on phosphorus efficiency and cotton yield. Cotton Sci. 2010, 22, 49–56. [Google Scholar]
  27. Liu, T.; Dong, X.; Guo, K.; Wang, J.; Liu, X.; Sun, H. Effects of fertilizer types and application levels on phosphorus availability of saline soils and crops: A meta-analysis. Land Degrad. Dev. 2024, 35, 4068–4080. [Google Scholar] [CrossRef]
  28. Delgado, A.; Madrid, A.; Kassem, S.; Andreu, L.; del Campillo, M.D. Phosphorus fertilizer recovery from calcareous soils amended with humic and fulvic acids. Plant Soil 2002, 245, 277–286. [Google Scholar] [CrossRef]
  29. Shen, Y.; Ma, Z.; Chen, H.; Lin, H.; Li, G.; Li, M.; Tan, D.; Gao, W.; Jiao, S.; Liu, P.; et al. Effects of macromolecular organic acids on reducing inorganic phosphorus fixation in soil. Heliyon 2023, 9, e14892. [Google Scholar] [CrossRef]
  30. Yuan, Y.; Tang, C.; Jin, Y.; Cheng, K.; Yang, F. Contribution of exogenous humic substances to phosphorus availability in soil-plant ecosystem: A review. Crit. Rev. Environ. Sci. Technol. 2023, 53, 1085–1102. [Google Scholar] [CrossRef]
  31. Rauthan, B.S.; Schnitzer, M. Effects of a soil fulvic-acid on the growth and nutrient content of cucumber (Cucumis sativus) plants. Plant Soil 1981, 63, 491–495. [Google Scholar] [CrossRef]
  32. Zhang, P.; Zhang, H.; Wu, G.; Chen, X.; Gruda, N.; Li, X.; Dong, J.; Duan, Z. Dose-dependent application of straw-derived fulvic acid on yield and quality of tomato plants grown in a greenhouse. Front. Plant Sci. 2021, 12, 736613. [Google Scholar] [CrossRef]
  33. Dorahy, C.G.; Rochester, I.J.; Blair, G.J. Response of field-grown cotton (Gossypium hirsutum L.) to phosphorus fertilisation on alkaline soils in eastern Australia. Aust. J. Soil Res. 2004, 42, 737–746. [Google Scholar] [CrossRef]
  34. Iqbal, B.; Kong, F.; Ullah, I.; Ali, S.; Li, H.; Wang, J.; Khattak, W.A.; Zhou, Z. Phosphorus application improves the cotton yield by enhancing reproductive organ biomass and nutrient accumulation in two cotton cultivars with different phosphorus sensitivity. Agronomy 2020, 10, 153. [Google Scholar] [CrossRef]
  35. Malhotra, H.; Vandana; Sharma, S.; Pandey, R. Phosphorus nutrition: Plant growth in response to deficiency and excess. In Plant Nutrients and Abiotic Stress Tolerance; Mirza, H., Masayuki, F., Hirosuke, O., Kamrun, N., Barbara, H.-N., Eds.; Springer Nature Singapore Pte Ltd.: Singapore, 2018; pp. 171–190. [Google Scholar]
  36. Khan, F.; Siddique, A.B.; Shabala, S.; Zhou, M.; Zhao, C. Phosphorus plays key roles in regulating plants’ physiological responses to abiotic stresses. Plants 2023, 12, 2861. [Google Scholar] [CrossRef] [PubMed]
  37. Rehman, A.; Farooq, M. Morphology, physiology and ecology of cotton. In Cotton Production; Khawar, J., Bhagirath, S.C., Eds.; John Wiley & Sons Ltd.: Hoboken, NJ, USA, 2019; pp. 23–46. [Google Scholar] [CrossRef]
  38. Anjum, S.A.; Wang, L.; Farooq, M.; Xue, L.; Ali, S. Fulvic acid application improves the maize performance under well-watered and drought conditions. J. Agron. Crop Sci. 2011, 197, 409–417. [Google Scholar] [CrossRef]
  39. Mai, W.; Xue, X.; Feng, G.; Yang, R.; Tian, C. Can optimization of phosphorus input lead to high productivity and high phosphorus use efficiency of cotton through maximization of root/mycorrhizal efficiency in phosphorus acquisition? Field Crops Res. 2018, 216, 100–108. [Google Scholar] [CrossRef]
  40. Wang, H.; Wu, L.; Wang, X.; Zhang, S.; Cheng, M.; Feng, H.; Fan, J.; Zhang, F.; Xiang, Y. Optimization of water and fertilizer management improves yield, water, nitrogen, phosphorus and potassium uptake and use efficiency of cotton under drip fertigation. Agric. Water Manage. 2021, 245, 106662. [Google Scholar] [CrossRef]
  41. Yuan, F.; Ma, D.; Zhao, K.; Zhang, K. Effect of phosphorus fertilization rate on cotton field phosphorus condition, yield and phosphorus balance in Xinjiang. Southwest China J. Agric. Sci. 2021, 34, 1033–1041. [Google Scholar] [CrossRef]
  42. Zhang, Y.; Yao, Y.; Hu, W.; Gao, Y.; Tang, M. Effects of phosphate fertilizer application on P accumulation, distribution, utilization and yield of cotton. Xinjiang Agric. Sci. 2020, 57, 2004–2011. [Google Scholar]
  43. de Wit, C.d. Resource use efficiency in agriculture. Agric. Syst. 1992, 40, 125–151. [Google Scholar] [CrossRef]
Figure 1. Location and view of the study site.
Agronomy 15 00992 g001
Figure 2. Leaf biomass under FA addition treatments in 2019 and 2020. Note: Means followed by the same letter are not significantly different across all treatments at p < 0.05.
Agronomy 15 00992 g002
Figure 3. Shell P concentration under different P fertilization rates (A) and FA addition treatments (B) in 2019 and 2020. Note: Means followed by the same letter are not significantly different across all treatments at p < 0.05.
Agronomy 15 00992 g003
Figure 4. Single boll weight under different P fertilization rate treatments in 2019 and 2020. Note: Means followed by the same letter are not significantly different across all treatments at p < 0.05.
Agronomy 15 00992 g004
Figure 5. Partial factor productivity under different P fertilization rate treatments in 2019 and 2020. Note: Means followed by the same letter are not significantly different across all treatments at p < 0.05.
Agronomy 15 00992 g005
Table 1. Irrigation scheme in 2019 and 2020.
Time
(Day Month Year)
Irrigation Amount
m3 ha−1
Time
(Day Month Year)
Irrigation Amount
m3 ha−1
10 May 201965628 April 2020623
5 July 201957814 June 2020600
16 July 201923726 June 2020293
25 July 201932015 July 2020387
5 August 20195542 August 2020453
15 August 201949217 August 2020476
24 August 201935926 August 2020452
Total irrigation amount in 20193196Total irrigation amount in 20203284
Table 2. Amount of fertilizers applied in different treatments every year.
TreatmentUrea
kg ha−1
Monoammonium Phosphate
kg ha−1
Potassium Sulfate
kg ha−1
Fulvic Acid
kg ha−1
P0 + CK5430600
P0 + FA54306045
P50 + CK52282600
P50 + FA522826045
P100 + CK501164600
P100 + FA5011646045
P150 + CK479246600
P150 + FA4792466045
Note: P0, P50, P100 and P150 mean P fertilization rates of 0, 50, 100 and 150 kg P2O5 ha−1; FA means fulvic acid addition of 45 kg fulvic acid ha−1; CK means no fulvic acid addition as the control.
Table 3. Soil pH, available P and alkaline phosphatase activity under different P fertilization rates and FA addition treatments in 2019 and 2020.
pHAvailable P
mg kg−1
Alkaline Phosphatase Activity
mg kg−1 h−1
P fertilization rates
P08.63 ± 0.03 a19.20 ± 0.91 c200.73 ± 14.14
P508.61 ± 0.03 a22.94 ± 0.93 a175.65 ± 13.40
P1008.59 ± 0.06 ab21.43 ± 0.76 b167.57 ± 13.82
P1508.52 ± 0.05 b22.07 ± 0.64 ab172.46 ± 12.19
FA addition
CK8.61 ± 0.0321.06 ± 0.57 b179.28 ± 9.46
FA8.57 ± 0.0321.89 ± 0.67 a178.09 ± 9.81
Year
20198.71 ± 0.02 a19.40 ± 0.36 b140.78 ± 4.54
20208.46 ± 0.02 b24.30 ± 0.49 a227.78 ± 5.04
ANOVA (p values)
P fertilization rates0.038<0.0010.022
FA addition0.1070.04440.582
Year<0.001<0.001<0.001
P × FA0.3620.9060.693
P × Year0.0820.8330.976
FA × Year0.9450.8780.966
P × FA × Year0.4990.9460.926
Note: P0, P50, P100 and P150 mean P fertilization rates of 0, 50, 100 and 150 kg P2O5 ha−1; FA means fulvic acid addition of 45 kg fulvic acid ha−1; CK means no fulvic acid addition as the control. Means ± SE followed by the same letter are not significantly different at the p < 0.05 level. The same applies to the following.
Table 4. Cotton biomass under different P fertilization rates and FA addition treatments at the boll opening stage in 2019 and 2020.
Shoot
kg ha−1
Leaf
kg ha−1
Shell
kg ha−1
Fiber
kg ha−1
Seed
kg ha−1
Total
kg ha−1
P fertilization rates
P01968 ± 104 c1408 ± 142 c1925 ± 158 b1667 ± 74 b2501 ± 107 c9469 ± 484 c
P502443 ± 147 b1613 ± 150 bc2320 ± 155 ab1901 ± 91 ab2802 ± 129 bc11,079 ± 541 b
P1002470 ± 142 b1784 ± 159 b2530 ± 141 a2049 ± 106 a3074 ± 159 ab11,907 ± 583 ab
P1502951 ± 112 a2074 ± 114 a2606 ± 134 a2164 ± 77 a3191 ± 120 a12,985 ± 381 a
FA addition
CK2391 ± 1181604 ± 88 b2184 ± 112 b1927 ± 772890 ± 11410,996 ± 432
FA2525 ± 971836 ± 122 a2507 ± 107 a1963 ± 612893 ± 8911,724 ± 394
Year
20192444 ± 1102110 ± 96 a2229 ± 1261942 ± 742885 ± 10911,608 ± 469
20202473 ± 1071330 ± 67 b2462 ± 931945 ± 652898 ± 9511,111 ± 356
ANOVA (p values)
P fertilization rates<0.001<0.0010.0090.0030.003<0.001
FA addition0.2950.0230.0320.6950.9850.173
Year0.822<0.0010.1180.9390.9200.349
P × FA0.3380.7580.9490.4950.4620.808
P × Year0.9050.7030.8210.7460.7170.619
FA × Year0.6890.0200.0710.9460.9270.311
P × FA × Year0.8460.7490.8340.5720.3070.985
Note: P0, P50, P100 and P150 mean P fertilization rates of 0, 50, 100 and 150 kg P2O5 ha−1; FA means fulvic acid addition of 45 kg fulvic acid ha−1; CK means no fulvic acid addition as the control. Means ± SE followed by the same letter are not significantly different at the p < 0.05 level.
Table 5. Cotton P concentration under different P fertilization rates and FA addition treatments in 2019 and 2020.
Shoot
g kg−1
Leaf
g kg−1
Shell
g kg−1
Fiber
g kg−1
Seed
g kg−1
P fertilization rates
P01.34 ± 0.111.94 ± 0.122.22 ± 0.151.28 ± 0.069.80 ± 0.40
P501.27 ± 0.111.71 ± 0.112.04 ± 0.251.15 ± 0.0510.11 ± 0.29
P1001.24 ± 0.091.84 ± 0.131.80 ± 0.131.10 ± 0.0510.72 ± 0.36
P1501.22 ± 0.101.82 ± 0.152.13 ± 0.221.08 ± 0.0510.10 ± 0.40
FA addition
CK1.31 ± 0.081.87 ± 0.091.99 ± 0.121.15 ± 0.0410.16 ± 0.24
FA1.23 ± 0.071.78 ± 0.092.10 ± 0.151.16 ± 0.0410.21 ± 0.28
Year
20190.95 ± 0.03 b1.45 ± 0.05 b1.46 ± 0.07 b1.12 ± 0.049.46 ± 0.20 b
20201.59 ± 0.06 a2.20 ± 0.07 a2.63 ± 0.10 a1.19 ± 0.0410.91 ± 0.24 a
ANOVA (p values)
P fertilization rates0.5080.3420.0630.0580.224
FA addition0.1970.3140.2900.8390.854
Year<0.001<0.001<0.0010.244<0.001
P × FA0.1450.2870.1160.6850.199
P × Year0.5790.5100.0120.2640.370
FA × Year0.1970.3690.0220.7100.916
P × FA × Year0.3800.5390.7440.6620.514
Note: P0, P50, P100 and P150 mean P fertilization rates of 0, 50, 100 and 150 kg P2O5 ha−1; FA means fulvic acid addition of 45 kg fulvic acid ha−1; CK means no fulvic acid addition as the control. Means ± SE followed by the same letter are not significantly different at the p < 0.05 level.
Table 6. Cotton P uptake under different P fertilization rates and FA addition treatments in 2019 and 2020.
Shoot
kg ha−1
Leaf
kg ha−1
Shell
kg ha−1
Fiber
kg ha−1
Seed
kg ha−1
Total
kg ha−1
P fertilization rates
P02.62 ± 0.25 b2.60 ± 0.23 b4.40 ± 0.55 b2.15 ± 0.1624.35 ± 1.26 c36.12 ± 1.99 c
P503.14 ± 0.32 ab2.65 ± 0.20 b4.75 ± 0.70 ab2.16 ± 0.1128.18 ± 1.26 bc40.88 ± 2.12 bc
P1002.98 ± 0.21 b3.10 ± 0.23 ab4.53 ± 0.39 ab2.24 ± 0.1533.09 ± 2.11 a45.94 ± 12.68 ab
P1503.68 ± 0.39 a3.64 ± 0.27 a5.55 ± 0.68 a2.34 ± 0.1331.94 ± 1.42 ab47.28 ± 2.20 a
FA addition
CK3.11 ± 0.242.91 ± 0.174.46 ± 0.422.20 ± 0.1129.28 ± 1.3041.95 ± 1.80
FA3.10 ± 0.203.08 ± 0.195.16 ± 0.412.25 ± 0.0929.50 ± 1.1943.16 ± 1.71
Year
20192.33 ± 0.14 b3.04 ± 0.163.14 ± 0.18 b2.15 ± 0.1027.23 ± 1.16 b37.8 ± 1.49 b
20203.88 ± 0.20 a2.95 ± 0.206.48 ± 0.37 a2.30 ± 0.0931.56 ± 1.20 a47.23 ± 1.61 a
ANOVA (p values)
P fertilization rates0.0100.0140.1620.7650.0010.002
FA addition0.9840.4750.0780.6870.8900.569
Year<0.0010.727<0.0010.3180.009<0.001
P × FA0.0650.4460.1710.3280.7910.993
P × Year0.2840.3650.0570.6230.9710.782
FA × Year0.2320.4100.4870.8160.9700.940
P × FA × Year0.2400.9920.7350.3970.8920.952
Note: P0, P50, P100 and P150 mean P fertilization rates of 0, 50, 100 and 150 kg P2O5 ha−1; FA means fulvic acid addition of 45 kg fulvic acid ha−1; CK means no fulvic acid addition as the control. Means ± SE followed by the same letter are not significantly different at the p < 0.05 level.
Table 7. Seed cotton yields and components under different P fertilization rates and FA addition treatments in 2019 and 2020.
Density
×103 Plant ha−1
Bolls per PlantSingle Boll Weight
g
Seed Cotton Yield
kg ha−1
P fertilization rates
P0122.90 ± 1.38 c6.20 ± 0.27 c5.29 ± 0.08 b4019 ± 176 c
P50130.66 ± 2.07 b6.65 ± 0.21 b5.61 ± 0.05 a4851 ± 130 b
P100130.65 ± 1.92 b6.99 ± 0.24 a5.65 ± 0.09 a5117 ± 115 a
P150135.68 ± 5.07 a6.63 ± 0.24 b5.79 ± 0.09 a5161 ± 123 a
FA addition
CK129.10 ± 1.816.39 ± 0.18 b5.59 ± 0.074592 ± 120 b
FA130.84 ± 1.876.84 ± 0.16 a5.58 ± 0.054982 ± 123 a
Year
2019127.13 ± 1.80 b7.44 ± 0.09 a5.43 ± 0.05 b5143 ± 94 a
2020132.82 ± 1.64 a5.79 ± 0.10 b5.74 ± 0.07 a4431 ± 123 b
ANOVA (p values)
P fertilization rates<0.001<0.001<0.001<0.001
FA addition0.264<0.0010.829<0.001
Year0.001<0.001<0.001<0.001
P × FA0.3760.3230.5820.990
P × Year0.8960.4840.0020.068
FA × Year0.3710.3900.4980.332
P × FA × Year0.1990.0590.3500.208
Note: P0, P50, P100 and P150 mean P fertilization rates of 0, 50, 100 and 150 kg P2O5 ha−1; FA means fulvic acid addition of 45 kg fulvic acid ha−1; CK means no fulvic acid addition as the control. Means ± SE followed by the same letter are not significantly different at the p < 0.05 level.
Table 8. P fertilizer use efficiencies under different P fertilization rates and FA addition treatments, 2019.
RE
%
PNB
%
AE
kg kg−1
PFP
kg kg−1
P fertilization rates
P0----
P5026.73 ± 6.97186 ± 10 a20.36 ± 1.77 a97.02 ± 2.61 a
P10024.86 ± 5.72104 ± 6 b12.84 ± 1.23 b51.17 ± 1.15 b
P15018.42 ± 2.1071 ± 3 c8.85 ± 0.71 c34.40 ± 0.82 c
FA addition
CK22.25 ± 4.27119 ± 1111.56 ± 1.10 b58.41 ± 5.42 b
FA23.43 ± 4.47122 ± 1216.48 ± 1.57 a63.32 ± 5.91 a
Year
201921.60 ± 4.49106 ± 10 b12.14 ± 1.43 b64.76 ± 6.14 a
202025.08 ± 3.77135 ± 12 a15.89 ± 1.37 a56.97 ± 5.06 b
ANOVA (p values)
P fertilization rates0.581<0.001<0.001<0.001
FA addition0.7490.749<0.001<0.001
Year0.611<0.0010.004<0.001
P × FA0.9840.9840.1620.162
P × Year0.6420.0520.593<0.001
FA × Year0.8950.8950.3860.386
P × FA × Year0.9990.9990.3100.310
Note: P0, P50, P100 and P150 mean P fertilization rates of 0, 50, 100 and 150 kg P2O5 ha−1; FA means fulvic acid addition of 45 kg fulvic acid ha−1; CK means no fulvic acid addition as the control. Means ± SE followed by the same letter are not significantly different at the p < 0.05 level.
Disclaimer/Publisher’s Note: The statements, opinions and data contained in all publications are solely those of the individual author(s) and contributor(s) and not of MDPI and/or the editor(s). MDPI and/or the editor(s) disclaim responsibility for any injury to people or property resulting from any ideas, methods, instructions or products referred to in the content.

