Error in Figure
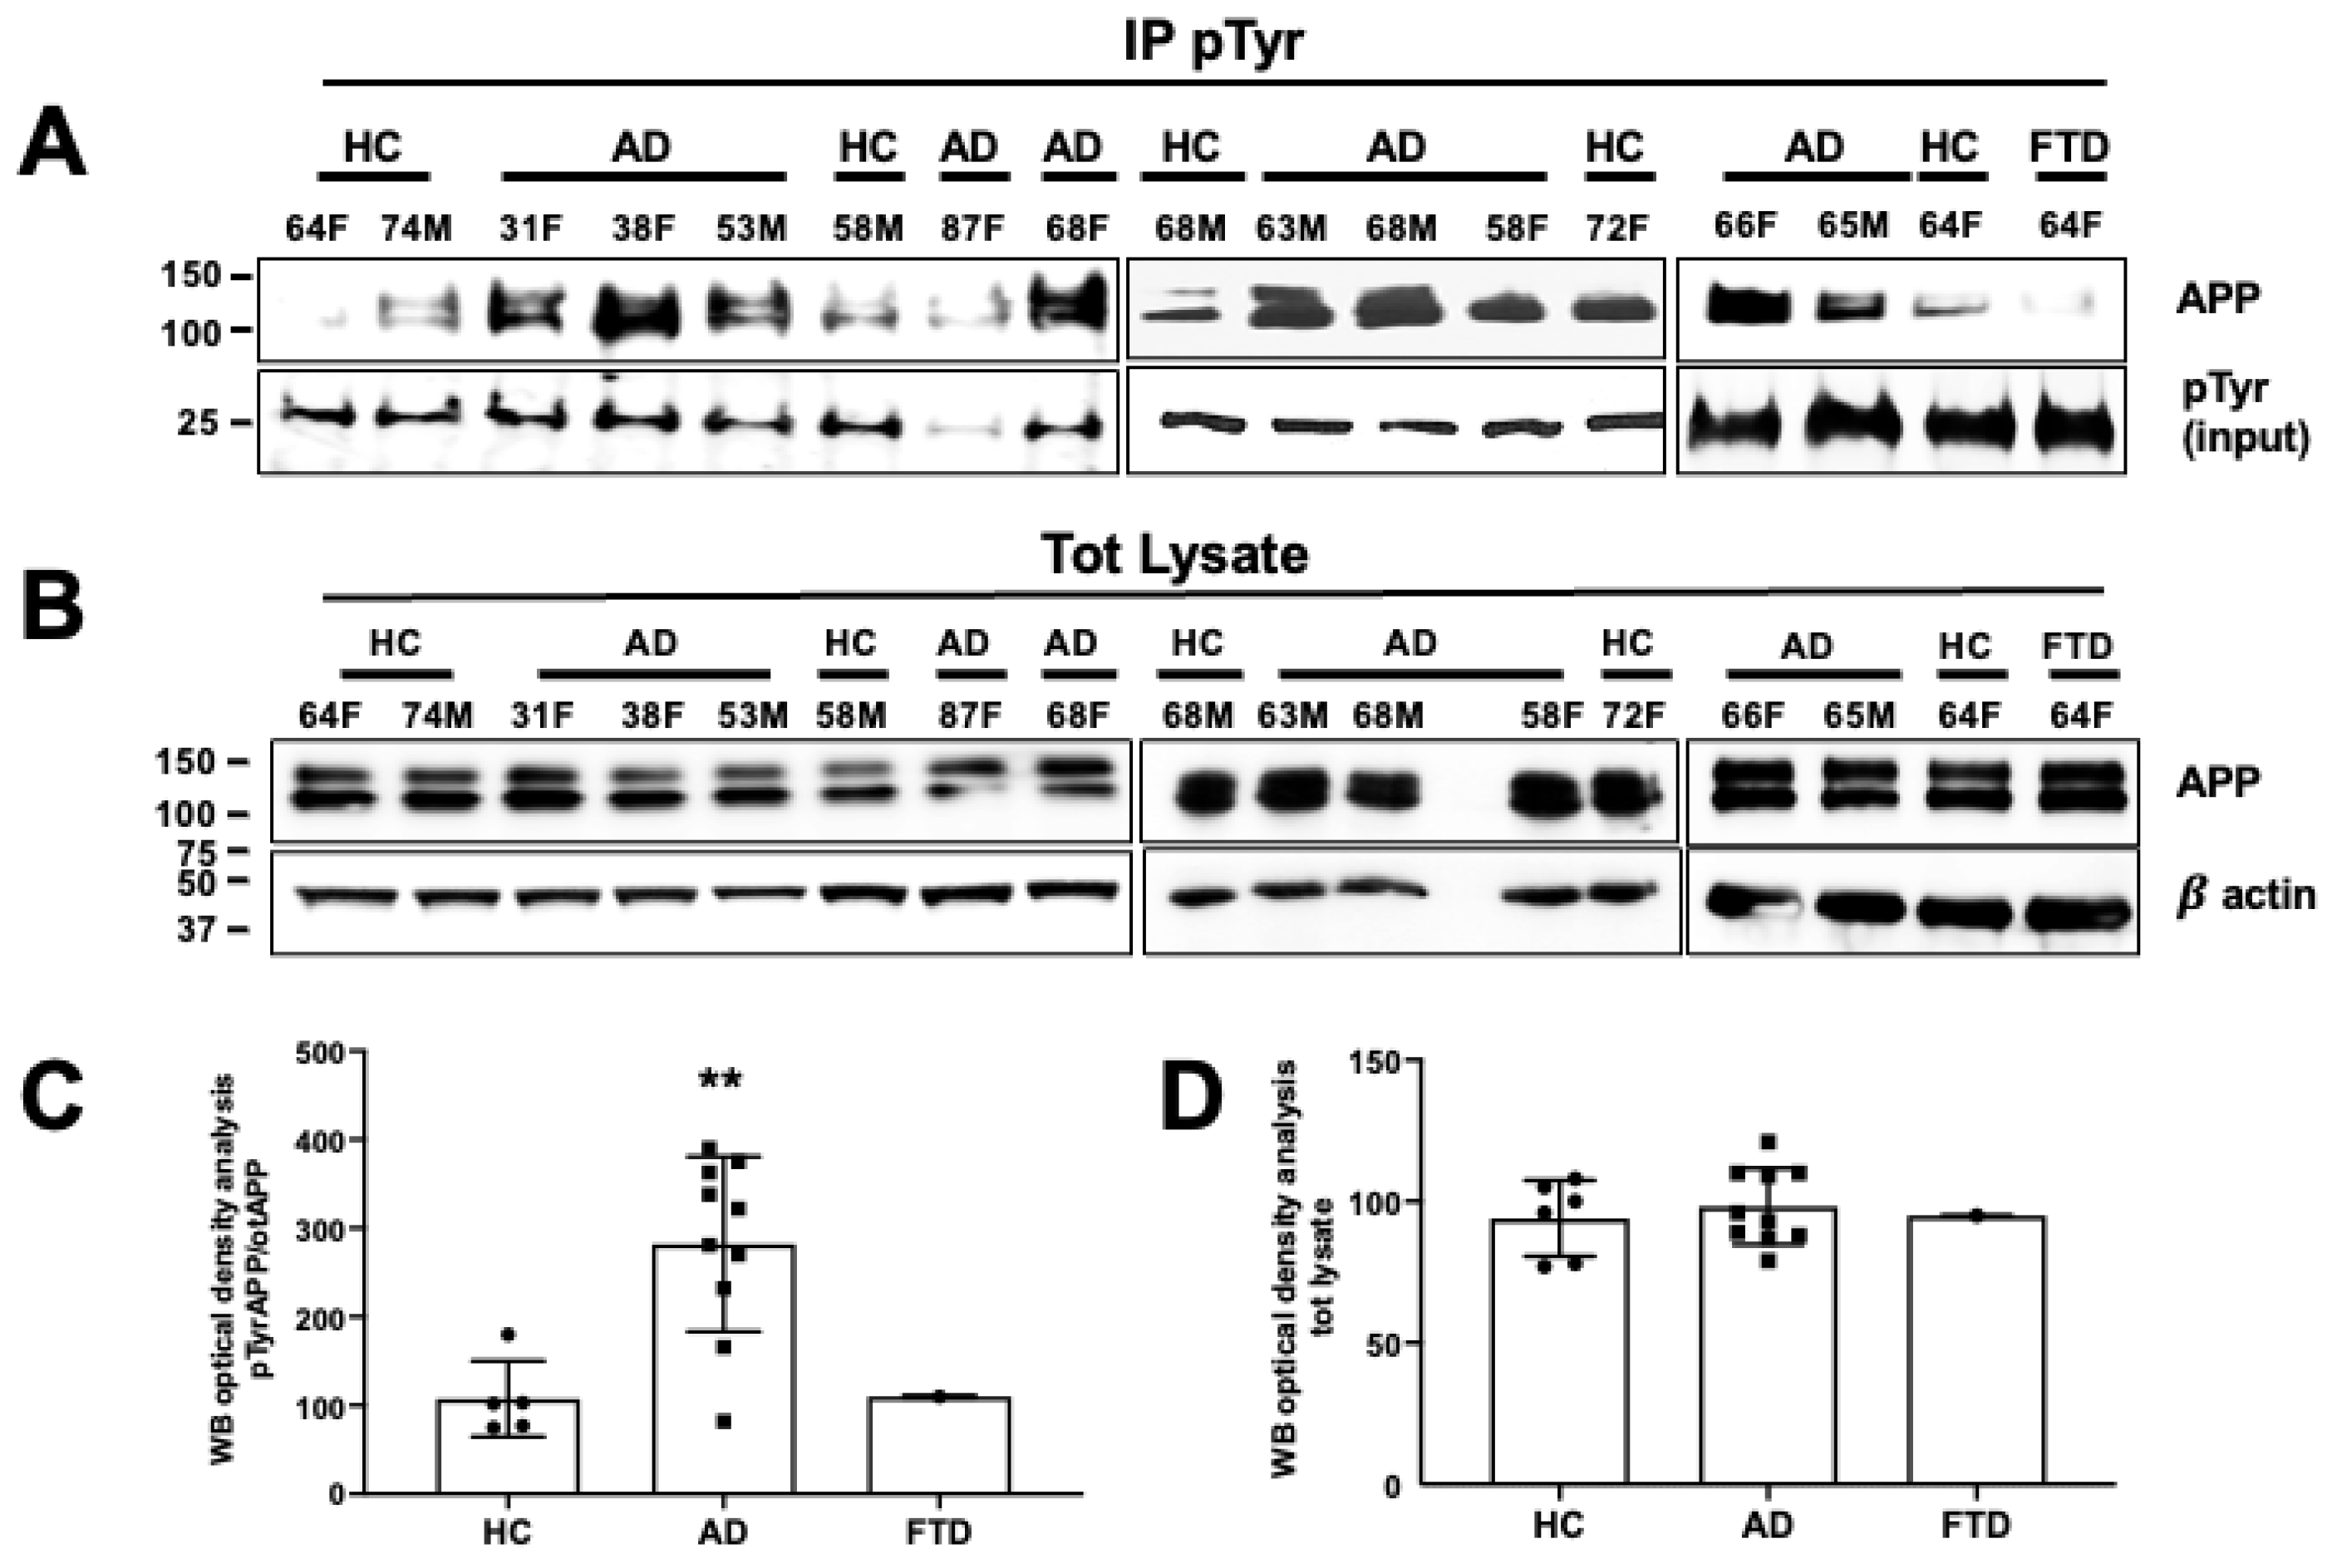
In the original publication [1], there was a mistake in Figure 5 as published. Specifically, Western blots labeled with β-actin in the middle and right panels of 5 B and APP in the middle panel of 5 B were placed incorrectly during assembly. In addition, the Western blot labeled with pTyr (Figure 5A, left) was mistakenly flipped horizontally. The corrected panels and the corresponding optical density analyses are shown below. The authors apologize for the inconvenience and state that the scientific conclusions are unaffected. This correction was approved by the Academic Editor. The original publication has also been updated.
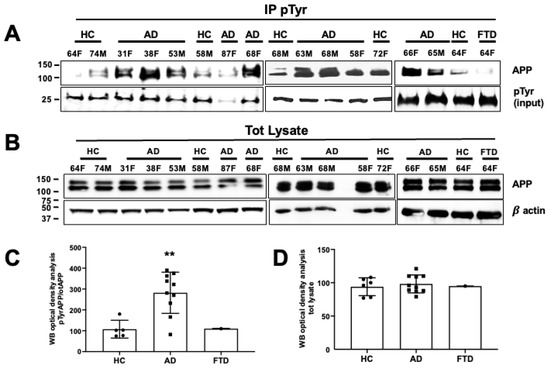
Figure 5.
The amyloid precursor protein was phosphorylated at the Tyr residue in neurons from AD patients. (A) After 5 weeks in differentiating media, neurons from healthy controls (HCs) and AD patients and one FTD patient were processed for pTyr IP using mouse anti-pTyr magnetic beads- conjugated antibody (4G10) and analyzed by WB using rabbit anti-APP antibody (Y188). Membranes were blotted with anti-mouse IgG, and the pTyr band (input) migrating at 25 kDa was used as a loading control. (B) WB analysis of basal APP levels using the rabbit anti-APP antibody (Y188). β-actin was used as a loading control. (C,D) Densitometric analysis of pAPP-Tyr levels in AD patients vs. HCs (C) and total APP levels expressed as a percentage of HCs (D). Mean optical density values were calculated as the ratio of pAPP-Tyr levels relative to basal APP levels (after normalization to β-actin) from each sample (experiments from each sample were repeated three times, n = 3). Statistically significant differences were calculated using Student’s t-test. ** p < 0.01 vs. HCs.
Reference
- Iannuzzi, F.; Sirabella, R.; Canu, N.; Maier, T.J.; Annunziato, L.; Matrone, C. Fyn Tyrosine Kinase Elicits Amyloid Precursor Protein Tyr682 Phosphorylation in Neurons from Alzheimer’s Disease Patients. Cells 2020, 9, 1807. [Google Scholar] [CrossRef] [PubMed]
Disclaimer/Publisher’s Note: The statements, opinions and data contained in all publications are solely those of the individual author(s) and contributor(s) and not of MDPI and/or the editor(s). MDPI and/or the editor(s) disclaim responsibility for any injury to people or property resulting from any ideas, methods, instructions or products referred to in the content. |
© 2024 by the authors. Licensee MDPI, Basel, Switzerland. This article is an open access article distributed under the terms and conditions of the Creative Commons Attribution (CC BY) license (https://creativecommons.org/licenses/by/4.0/).