Article

Concentrations and Sources of Atmospheric PM, Polycyclic Aromatic Hydrocarbons and Nitropolycyclic Aromatic Hydrocarbons in Kanazawa, Japan

1
Low Level Radioactivity Laboratory, Institute of Nature and Environmental Technology, Kanazawa University, O-24 Wake-machi, Nomi, Ishikawa 923-1224, Japan
2
Institute of Nature and Environmental Technology, Kanazawa University, Kakuma-machi, Kanazawa, Ishikawa 920-1192, Japan
3
Pharmaceutical and Health Sciences, Graduate School of Medical Sciences, Kanazawa University, Kakuma-machi, Kanazawa, Ishikawa 920-1192, Japan
4
Medical Sciences, Graduate School of Medical Sciences, Kanazawa University, 13-1, Takara-machi, Kanazawa 920-8640, Japan
*
Author to whom correspondence should be addressed.
Atmosphere 2021, 12(2), 256; https://doi.org/10.3390/atmos12020256
Submission received: 6 January 2021 / Revised: 5 February 2021 / Accepted: 8 February 2021 / Published: 15 February 2021
(This article belongs to the Special Issue Air Pollution in Japan)

Abstract

:
PM2.5 (fine particles with diameters 2.5 micrometers and smaller) and PM>2.5 were separately collected in Kanazawa, Japan in every season, from the spring of 2017 to the winter of 2018, and nine polycyclic aromatic hydrocarbons (PAHs) and six nitropolycyclic aromatic hydrocarbons (NPAHs) were respectively determined using high-performance liquid chromatography (HPLC) with fluorescence and chemiluminescence detections. The atmospheric concentrations of both the PAHs and NPAHs showed seasonal changes (highest in the winter and lowest in the summer), which differed from the variations in the total suspended particulate matter (TSP) and PM2.5 amounts (which were highest in the spring). The contributions of major sources to the combustion-derived particulate (Pc) in the PM2.5 were calculated using the 1-nitropyrene-pyrene (NP) method, using pyrene and 1-nitropyrene as the representative markers of PAHs and NPAHs, respectively. The annual average concentration of Pc accounted for only 2.1% of PM2.5, but showed the same seasonal variation as PAHs. The sources of Pc were vehicles (31%) and coal heating facilities/industries (69%). A backward trajectory analysis showed that the vehicle-derived Pc was mainly from Kanazawa and its surroundings, and that coal heating facilities/industry-derived Pc was transported from city areas in central and northern China in the winter, and during the Asian dust event in the spring. These results show that large amounts of PAHs were transported over a long range from China during the winter. Even in the spring, after the coal heating season was over in China, PAHs were still transported to Japan after Asian dust storms passed through Chinese city areas. By contrast, the main contributors of NPAHs were vehicles in Kanazawa and its surroundings. The recent Pc concentrations were much lower than those in 1999. This decrease was mostly attributed to the decrease in the contribution of vehicle emissions. Thus, the changes in the atmospheric concentrations of Pc, PAHs and NPAHs in Kanazawa were strongly affected not only by the local emissions but also by long-range transport from China.

1. Introduction

Air pollution caused by particulate matter (PM) is a growing global concern. The World Health Organization (WHO) reported that air pollution kills seven million people annually, and that it enhances health risks, especially in children [1,2]. Among the different sizes of PM, PM2.5 (PM with diameters of no more than 2.5 µm) is carcinogenic and increases the risk of respiratory and cardiovascular diseases, including asthma [3]. PM2.5 contains several hazardous chemicals associated with these diseases. Among them, polycyclic aromatic hydrocarbons (PAHs) and their derivatives—such as nitropolycyclic aromatic hydrocarbons (NPAHs)—are known as carcinogens and/or mutagens. In many countries, vehicles are considered the major source of PAHs and NPAHs. PM2.5 air pollution caused by coal heating and slash and burn agriculture are serious in China and developing countries, respectively. Therefore, the reduction of the PM2.5 generated from the combustion of fossil fuels and biomass is an important global issue. Recently, air quality standards and guidelines for PM2.5 emissions have been set by several countries and international organizations. However, the present air quality standards measure the atmospheric concentration of PM based on particle size, and not on the toxic chemical contained within. The atmospheric behavior and sources of PAHs and NPAHs in particular are poorly understood, despite their human health hazards.
East Asia is a hot spot for air pollution, and Asian dust storms (yellow sand) are frequent events not only in China but also in Korea and Japan. An international monitoring network of more than ten cities in Japan, China, Russia and Korea was started in the 1990s for the continual surveillance of the atmospheric concentrations of total suspended particulate matter (TSP)-bound PAHs and NPAHs [4]. Chinese and Russian cities, especially in the central and northern parts of China, showed extremely high concentrations of PAHs and NPAHs in winter. This was attributed mainly to emissions from coal heating facilities. By contrast, Japanese cities showed a constant decrease in their concentrations of PAHs and NPAHs, and an especially significant decrease in the concentration of NPAHs in the 2000s. This was attributed to effective measures against vehicular PM and NOx emissions [5,6].
The Wajima air monitoring station (WAMS) of Kanazawa University is located on the Noto peninsula on the west coast of the main Japanese island (Honshu). The concentrations of PAHs decreased slowly but steadily from 2009, with a seasonal pattern, peaking highest during the winter and dropping during the summer [7,8]. A backwards trajectory analysis showed that the air masses travelled over mega city areas in central and northern China [9]. This suggests that the emissions of PAHs and NPAHs in China may also have an impact on Kanazawa, because Kanazawa is only about 100 km south of the WAMS (Figure S1). However, the contribution of vehicles to PM2.5 was not known in Kanazawa, although vehicles were considered to be the major contributor of PAHs and NPAHs. It was not easy to distinguish the effects of domestic emissions from the trans-boundary transport, because the concentrations of pollutants transported from China might not be high enough relative to those of domestic Japanese emissions. Moreover, a suitable method is necessary in order to distinguish between major sources like vehicles and coal combustion.
Recently, a new method was developed (the NP method) to calculate the contributions of major sources to the atmospheric PM2.5, using pyrene (Pyr) and 1-nitropyrene (1-NP) as markers [10]). In this report, this method is applied in order to calculate the contributions of vehicles and coal combustion to atmospheric PM2.5 in Kanazawa. Based on this method, the seasonal changes in vehicular and coal combustion contributions to combustion-derived particulates in Kanazawa, and the impact of trans-boundary transport from China are further clarified.

2. Experimental

2.1. Sampling of PM2.5 and PM>2.5

A high-volume air sampler (HR-RW, Shibata, Soka, Japan) equipped with a PM2.5 cut-off quartz fiber filter was installed close to a main road in a residential area of Kanazawa city (136.40° E, 36.33° N) (Figure S1). Kanazawa is a commercial city in Japan, with a population of approximately 464,000. There are no obvious sources of combustion PM2.5 near the monitoring station except for traffic. TSP samples were collected daily (24 h) for one week each season: spring (from 24 to 30 April), summer (from 21 to 27 August) and autumn (from 6 to 12 November) in 2017, and winter (from 19 to 25 February) in 2018. The PM2.5 and PM>2.5 concentrations were calculated from the difference of the filter weights before and after use. The filters were kept in a freezer at −20 °C until the analysis of the PAHs and NPAHs [11].

2.2. Determination of the PAHs and NPAHs

The sample treatment and analytical methods for PAHs and NPAHs are described in the Supplementary Materials (Text S1). Briefly, nine PAHs, fluoranthene (FR), Pyr, benz[a]anthracene (BaA), chrysene (Chr), benzo[b]fluoranthene (BbF), benzo[k]fluoranthene (BkF), benzo[a]pyrene (BaP), benzo[ghi]perylene (BghiPe), and indeno[1,2,3-cd]pyrene (IDP), were quantified using a high-performance liquid chromatograph (HPLC) equipped with a fluorescence detector, which was operated according to the United States Environmental Protection Agency methods [12]. Six NPAHs—9-nitroanthracene (9-NA), 1-NP, 6-nitrocrysene (6-NC), 7-nitrobenz[a]anthracene (7-NBaA), 3-nitroperylene (3-NPer), and 6-nitrobenzo[a]pyrene (6-NBaP)—were quantified using an HPLC equipped with a reducing column packed with platinum/rhodium, and a chemiluminescence detector. Several deuterated PAHs and NPAHs were used as surrogates and internal standards for the quantification. More detailed conditions were described in the previous reports, along with the limits of quantification [13,14,15].

2.3. Calculation of Source Contributions

The NP method for the calculation of the contributions of vehicles and coal heating facilities/industries to Pc in the atmospheric PM2.5 are described in Supplementary Materials (Text S2) [10]. Briefly, PM2.5 is described as being comprised of combustion-derived particulates (Pc) and non-combustion-derived particulates (Po), and Pc is further divided into particulates emitted from combustion with high-temperature (Ph) and particulates from combustion with low-combustion temperature (Pl).
When the proportion of Ph in Pc is x (0 < x < 1) and the proportion of Pc in P is y (0 < y < 1), the following Equations are expressed using x and y.
[1 − NP] = [1 − NPh][Pc]x + [1 − NPl][Pc](1 − x) (i)
[Pyr] = [Pyrh][Pc]x + [Pyrl][Pc](1 − x) (ii)
[1 − NP] = {[1 − NPh]x + [1 − NPl](1 − x)}[P]y (iii)
Using the values of [1 − NPh] (=65.5 pmol mg−3) and [Pyrh] (=180 pmol mg−3) in particulates from vehicles, and the atmospheric concentrations of 1-NP ([1-NPl]) (=4.6 pmol mg−3) and Py ([Pyrl] (=3400 pmol mg−3) in particulates from coal combustion [5], and [Pyr] and [1-NP] at the monitoring site, values of x and y can be calculated from equations (i–iii). Then, the concentrations of Pc, Po, Ph and Pl are obtained.

2.4. Lidar Observation

The lidar observation data for the vertical and temporal distributions of Asian dust particles were obtained from the Asian dust and aerosol lidar observation network (https://www-lidar.nies.go.jp/AD-Net) (accessed on 6 January 2021). The lidar is stationed in Imizu city, Toyama prefecture (137.10° E, 36.70° N, 28 m ASL), located 45 km east-north-east of Kanazawa. The attenuated backscatter coefficients (532 nm and 1064 nm) and volume depolarization ratio (532 nm) were recorded with a time-height resolution of 6 m and 15 min [16].

2.5. Backward Trajectory and Weather Map

Three-day backward trajectories, every six hours, were calculated using the Hybrid Single-Particle Lagrangian Integrated Trajectory model developed by National Oceanic and Atmospheric Administration, Washington, DC [17]. The starting height was set to 500 m. The daily weather maps of North East Asia were provided by the Japan Meteorological Agency [18].

2.6. Health Risk Assessment

In order to assess the carcinogenic risk posed by atmospheric PAHs, the concentrations of six PAHs—BaP, BaA, BbF, BkF, Chr and IDP—were expressed using the relative potency factors (TEFPAH) shown in Table S2 [19] as BaP equivalent concentrations (BaPeq). The direct-acting mutagenic activities of NPAHs were assayed using the Ames test with the Salmonella typhimurium YG1024 strain without S9mix [20]. The relative potency factors (TEFNPAH) of four NPAHs—1-NP, 6-NC, 6-NBaP and 3-Nper—with regard to that of 1-NP were calculated (Table S3). The TEFNPAH values were used for the estimation of 1-NP equivalent concentrations (1-NPeq) in this study.

3. Results and Discussion

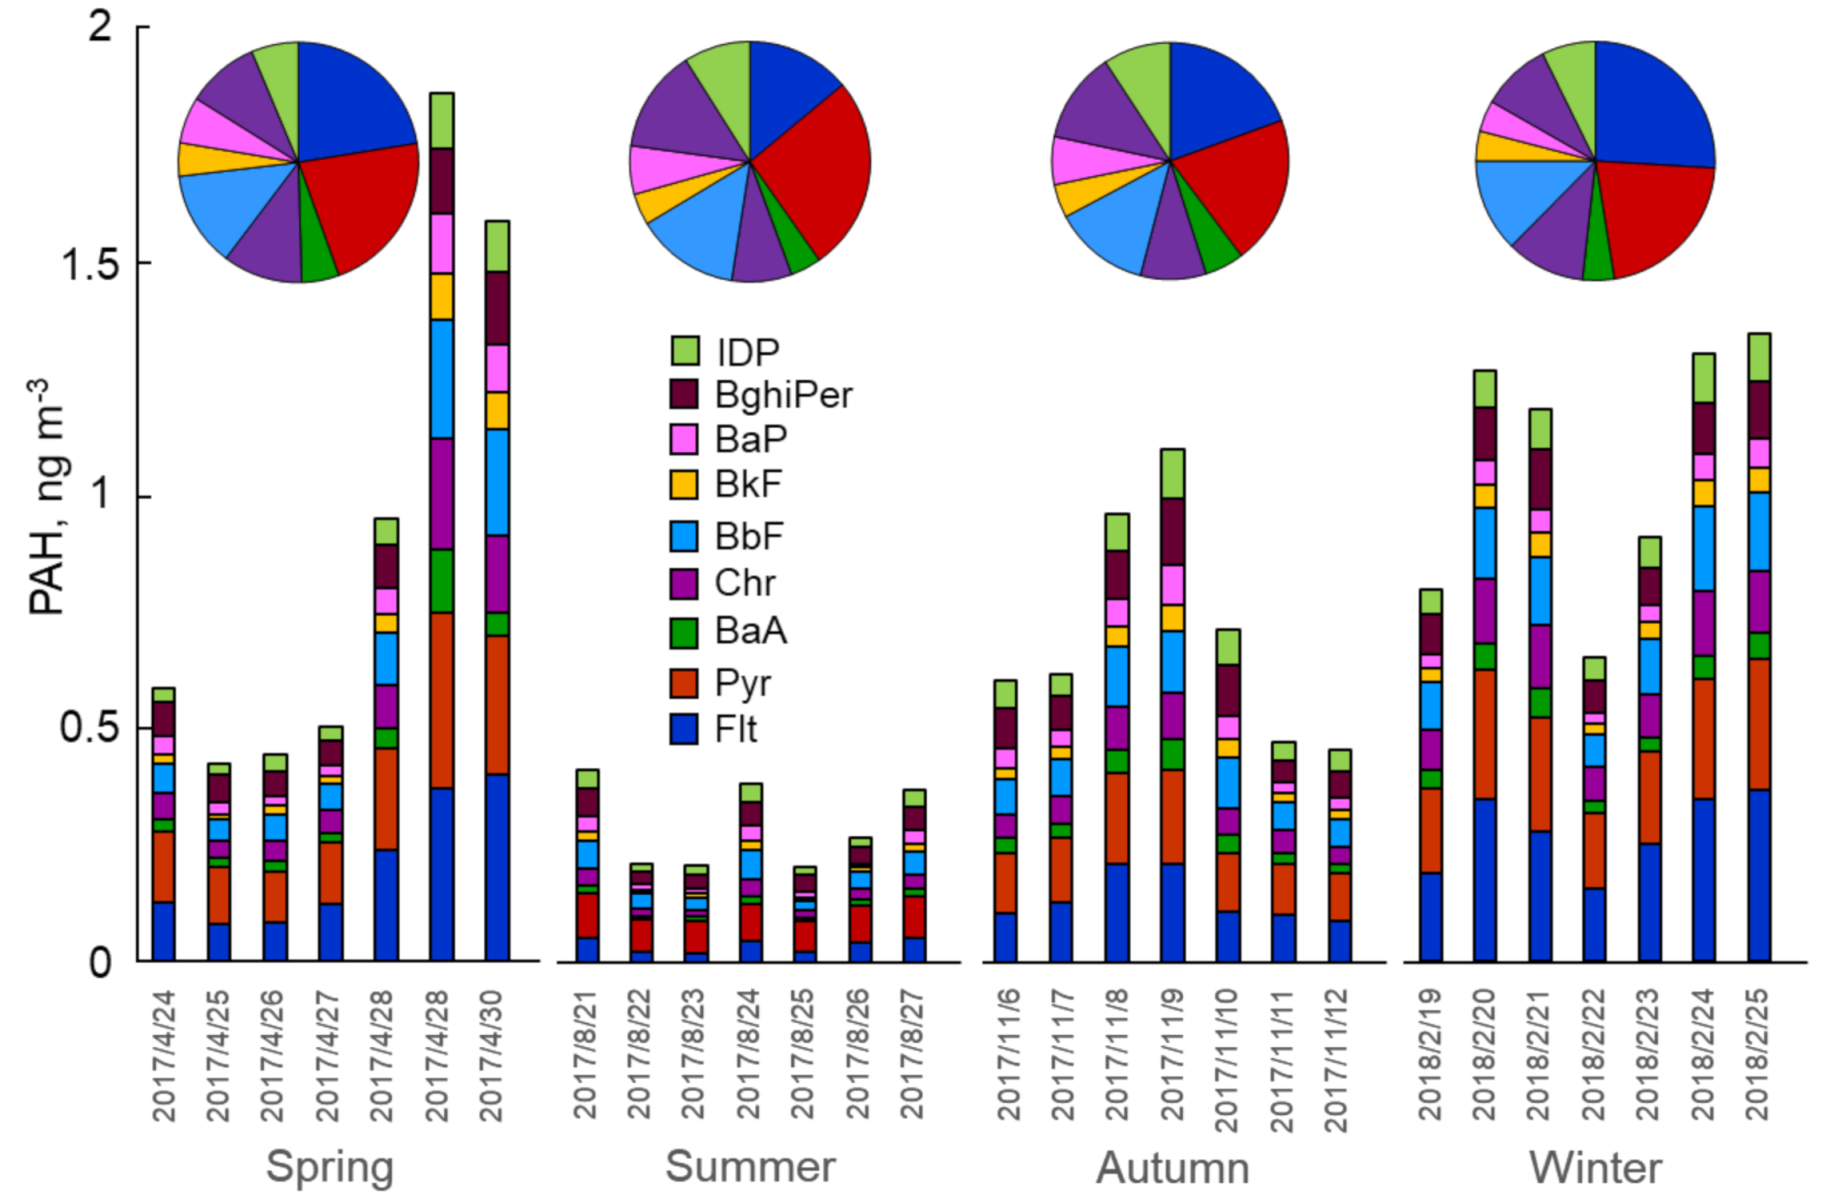
3.1. Seasonal Variations of PM, PAH and NPAH Concentrations

Figure 1 shows the daily atmospheric concentration of TSP (=PM2.5 + PM>2.5) in four successive seasons in Kanazawa. Cumulatively, the highest average concentration of PM2.5 was in the order spring > winter > autumn > summer (Table 1). A similar trend was observed in past monitoring campaigns in Kanazawa, from 1997 to 2014 [4], and also at the WAMS over the last 10 years [7]. In the present study, the highest TSP concentrations were observed in the period 28–30 April. The percentage of PM2.5 in the TSP (PM2.5/ TSP) of the spring (69.6%) was larger than the annual average (64.6%) (Table 1). The lidar detected an increase in the concentration of Asian dust in the three days. The daily weather map showed a typical pattern in which the wind flowed from the Asian Continent towards the Islands of Japan after a cold front passed over the Sea of Japan. These results strongly suggest that the increase of TSP in the three days was caused by an Asian dust event. Moreover, the back trajectory of the air mass during this period came through central and northern China, including Beijing and Shenyang.
Figure 2 shows the daily atmospheric concentrations of nine PAHs (=ΣPAH) in the four seasons in Kanazawa. Pyr and Flt showed the highest concentrations among the nine PAHs. The average concentrations of ΣPAH were in the order winter > spring > autumn > summer (Table 2), which was different form the order of the TSP. The seasonal PAH compositions (pie charts) show that the fraction of Flt was the smallest in the summer. The reason for this is that Flt with four rings has the largest vapor pressure among the nine PAHs; thus, the distribution of Flt in the particle phase decreases with the increasing temperature. Other than this, there was no significant difference in the seasonal composition of PAHs, and the composition of the PAHs did not vary significantly over the last twenty years [5]. Thus, both the winter monsoon and spring Asian dust storm increase the concentration of PAHs, but do not have any effects on their composition. Huge amounts of coal are used for heating purposes in central and northern China every winter, but are not used in Japan. As the result, the atmospheric concentrations of PAHs were several tens of times higher in Beijing and Shenyang than in Japanese cities [5,21,22]. These PAHs emitted in China were transported over a long range to Japan by the predominant northwest monsoon. Hence, the concentration of ΣPAH in Kanazawa was the highest in the winter (Table 2).
Figure 3 shows the atmospheric concentrations of six NPAHs (=ΣNPAH) during the four seasons in Kanazawa. Among the six NPAHs, 1-NP and 6-NC showed the highest concentrations. The average concentrations of ΣNPAH showed the same order as those of ΣPAH (Table 2). The major NPAH was 6-NC, followed by 1-NP, and these two NPAHs attributed more than 70% of the total NPAHs in all of the seasons. The fraction of 9-NA was the smallest in the summer. With three rings, 9-NA has the highest vapor pressure among the six NPAHs. The low distributions of 9-NA in the particulate phase may be due to its volatility, especially so with increasing temperatures. The concentration ratio of 1-NP to 6-NC was the largest in the winter. In this study, the air sampler was close to a major road, 2–4 km south of downtown Kanazawa. The winter monsoon brings polluted air from downtown to the sampling site. Moreover, the emissions from vehicles are trapped near the surface of the road by the first inversion boundary layer over the ground. This might be the reason for the highest concentration of ΣNPAH in the winter.
In the spring of 2017, the concentrations of both ΣPAH and ΣNPAH were higher in the last three days (28–30 April) than they were in the first four days (24–27 April) (p < 0.008 and < 0.04, respectively, t-test). The concentration of PM2.5 was higher in the second period (p < 0.0007). These coinciding results suggest the effect of the Asian dust event. There were relationships between ΣPAH and ΣNPAH (correlation coefficient R = 0.7520), and between ΣPAH and PM2.5 (R = 0.6811), but not between ΣNPAH and PM2.5 (Table S1).

3.2. Source Analysis of PM2.5, PAHs and NPAHs

The NP method differentiates between combustion sources with high-and low-temperatures [10]. We reported that, in Kanazawa, vehicles and coal combustion facilities/industries were major sources of high- and low-combustion temperatures, respectively [5]. The contributions of vehicles and coal combustion facilities/industries to PM2.5 and Pc were estimated in this study. Figure 4 shows the daily atmospheric concentrations of PM2.5 in the four seasons. The percentages of Pc and Po were calculated by the NP-method. The annual average percentage of Pc in PM2.5 is very small (2.1%), and the relationship between Pc and PM2.5 is weak (R = 0.5585) (Table S1). However, the average concentration of Pc showed a clear seasonal change in the order winter > spring > autumn > summer. This order was the same as of the orders of ΣPAH and ΣNPAH. The Pc concentration had relationships with those of ΣPAH (R = 0.8661) and ΣNPAH (R = 0.8211) (Table S1).
Po is mostly composed of suspended soil particles, road surface/tire-derived particles, sea salt, and plant-derived particles such as pollen. The concentrations of Po from 28 to 30 April, when Asian dust came to Kanazawa, were about two times higher than those from 24 to 27 April (Figure 4). This suggests that Asian dust storms might increase the concentrations of soil minerals in Po.
Figure 5 shows the daily atmospheric concentration of Pc in the four seasons, in which the percentages of Ph and Pl were also calculated by the NP-method. The percentage of Ph in Pc was smaller than that of Pl over the year, except for 23 August 2017, when it was 67%. The annual percentage of Ph in Pc was 31% (Table 3), suggesting that the source of Pc was a mixture of coal heating facilities/industries (2/3) and vehicles (1/3). After the heating season in China, the Pl concentration increased dramatically at the end of April (Figure 5). It increased from 0.165 ± 0.022 μg m−3 (24–27 April) to 0.393 ± 0.103 μg m−3 (28–30 April), a 238% increase, while the Ph concentration did not increase. Considering that the backward trajectory of the air mass came over Chinese mega city areas in the latter period, this event was attributed to the increase in the Pl amount transported from China. The relationship was very strong between PM2.5 and Po (R = 0.9999), but not so strong between PM2.5 and Pc (R = 0.5585) (Table S1). This difference might depend on the very small percentage of Pc in PM2.5.
The relationship between ΣPAH and Pc was strong (R = 0.8661 in Table S1). This suggests that the increase in the ΣPAH concentration in the winter (Figure 2) is affected by emissions from coal heating facilities in China. The significant increase of the ΣPAH concentration was observed in the spring (28 to 30 April 2017). This was also attributed to the long-range transport of PAHs from combustion sources in China.
As described in Figure 4, the increased Po in the spring may be mainly attributed to Asian dust storm events. It has been reported that natural dust is long-range transported from the Sahara, Africa to Europe, and from central Australia to New Zealand and Antarctica over the seas [23,24], but the long-range transport of soot-bound PAHs has not been proved in these areas. The above result showed that Asian dust, and also Pc, PAHs and NPAHs, were transported long-range from China to Kanazawa, Japan. This report provides evidence for the long-range transport of combustion-derived particles which affect the urban air quality in city areas.
The Pc concentration in the summer of 2017 (0.33 μg m3 in Table 3) was 1/13 of the concentration in the summer of 1999 (2.96 μg m3) [10]. Moreover, the Pc concentration in the winter of 2018 (0.47 μg m3) was 1/24 of the concentration in the winter of 1999 (11.14 μg m3). The Ph concentration in the summer of 2017 (0.07 μg m3) was 1/39 of the concentration in the summer of 1999 (2.75 μg m3), and the Ph concentration in the winter of 2018 (0.16 μg m3) was 1/66 of the concentration in the winter of 1999 (10.63 μg m3). It is surprising that the Ph concentration, which was more than 94% of Pc in 1999, decreased dramatically in the following 18 years. In the 1990s, the major source of PAHs and NPAHs was vehicles in Kanazawa, but the atmospheric concentrations of NPAHs decreased significantly—to less than 1/60—in the 2000s [5]. Based on the change in the [1-NP]/[Pyr] ratio, the authors reported that the above changes were attributable to the regulations on vehicular PM/NOx emissions [25]. The decreases in PAH and NPAH emissions from vehicles clearly explain the way in which the changes in the Pc concentration were mostly due to Ph. Unlike Ph, Pl (0.21μg m3 in the summer and 0.51 μg m3 in the winter of 1999) decreased much more slowly during this period, by factors of 1/1.2 and 1/1.1, respectively. The decrease in the atmospheric concentrations of PAHs at the WAMS was also much slower than those in Kanazawa [7]. This result suggests that there was a slow decrease in the Pl amount transported from China.

3.3. Health Risk Assessment

Recently, the urban atmospheric concentrations of PAHs and NPAHs were studied in many countries [21,26,27,28,29,30,31,32,33]. The concentrations of PAHs in Kanazawa are as low as those in several cities in the EU and the United States, and much lower than those in central and northern Chinese cities. In order to estimate the cancer risks of PAHs, BaP, which has a relatively strong carcinogenic potential, has often been used as the marker in PAH monitoring. Several countries and organizations have set BaP concentration limits, and the WHO recommends atmospheric BaP concentrations below 0.12 ng m−3 [34]. However, the annual mean concentrations at many monitoring stations in the world were still over this reference level [35]. The annual atmospheric concentration (mean ± SD) of BaP in Kanazawa was 0.040 ± 0.026 ng m−3, with a maximum concentration of 0.12 ng m−3, which is not over the WHO reference level. Moreover, it should be emphasized that the average percentage of Pc in PM in Kanazawa was not more than 7.5%, which is much smaller than the values of Beijing and Shenyang, where the percentages of Pc in the TSP were over 40% in the winter [5]. These results suggest that the present air quality of Kanazawa is clean enough with regard to combustion-derived pollution.
The order of the BaPeq concentration of the six PAHs in Kanazawa, calculated using the TEFPAH in Table S2, was spring (70.5 pg m−3) > winter (64.5 pg m−3) > autumn (59.5 pg m−3) > summer (28.1 pg m−3), which is similar to the concentration order of the nine PAHs. In addition, BaP was the largest contributor (not less than 62%) in all of the seasons. Moreover, the order of the toxicity of the atmospheric four NPAHs, calculated using the TEFNPAH in Table S3, was winter (3.72 pg m−3) > spring (2.96 pg m−3) > autumn (2.07 pg m−3) > summer (1.48 pg m−3), which is also consistent with the concentration order of the four NPAHs. In addition, 1-NP showed the largest mutagenic contribution, which was 57–72%, followed by 6-NC, the contribution of which was 20–42%. This order was constant over the year. These results suggest that the winter monsoon and the spring Asian dust storm changed the atmospheric concentrations of the PAHs and NPAHs, but did not change their compositions in Kanazawa.

4. Conclusions

PM2.5 and PM>2.5 samples were collected seasonally from the spring of 2017 to the winter of 2018, and nine PAHs and six NPAHs were determined using HPLC with fluorescence and chemiluminescence detections, respectively. The contributions of vehicles and coal combustion, and the effects of long-range transport from China on those atmospheric pollutants in Kanazawa were calculated using the NP method.
  • The atmospheric concentrations of PAHs and NPAHs showed similar seasonal variations: they were highest in the winter and lowest in the summer.
  • The percentage of Pc in the PM2.5 was much smaller (2.1%). However, the atmospheric concentration of Pc showed seasonal variation. The annual average contributions of coal heating facilities/industries and vehicles to Pc were 69% and 31%, respectively.
  • The high concentrations of Pc and PAHs in the winter and during the Asian dust event in the spring were largely attributed to the long-range transport of emissions from coal heating facilities and industries in China. The NPAHs were mainly emitted from vehicles in Kanazawa.
  • The Pc concentrations in the summer of 2017 and the winter of 2018 were respectively 1/13 and 1/16 of those detected in 1999. This significant improvement was mostly attributed to the decrease in the Pc quantities emitted from vehicles in Kanazawa. However, the decrease in the Pc amount transported from China was much lower.
Thus, the seasonal and long-term changes of the air pollution in Kanazawa, caused by Pc, PAHs and NPAHs, were characterized by domestic emissions from vehicles and coal combustion emissions transported from China.

Supplementary Materials

The following are available online at https://www.mdpi.com/2073-4433/12/2/256/s1. Figure S1: Map of monitoring sites, Table S1: Correlation coefficients between atmospheric compounds, Table S2: Toxic equivalency factors of PAHs (TEFPAH), Table S3: Toxic equivalency factors of NPAHs (TEFNPAH).

Author Contributions

Project planning and supervision: K.H. and H.N.; Sampling: K.H. and N.T.; PAHs analysis: N.T., W.X., P.K.O. and A.H.; NPAHs analysis: K.H.; Writing-review and editing: K.H. and H.N. All authors have read and agreed to the published version of the manuscript.

Funding

This research was financially supported in part by a Grant in Aid for Scientific Research (No. 17H06283) from the Japan Society for the Promotion of Science, by the Environment Research and Technology Development Fund (5-1951) of the Environmental Restoration and Conservation Agency of Japan, and by the research fund of the Japan Automobile Research Institute.

Institutional Review Board Statement

Not applicable.

Informed Consent Statement

Not applicable.

Data Availability Statement

Concentration data of PAHs and NPAHs presented in this study may be obtained on request from the corresponding author.

Acknowledgments

We express our gratitude to Atsushi Shimizu of the National Institute for Environmental Studies, Japan, and Atsushi Matsuki and Yayoi Inomata of Kanazawa University for their provision of the information of the lidar observations, backward trajectories and weather maps. This research was supported by a Grant in Aid for Scientific Research (No. 17H06283) from the Japan Society for the Promotion of Science, the Environment Research and Technology Development Fund (5-1951) of the Environmental Restoration and Conservation Agency of Japan, and the research fund from the Japan Automobile Research Institute.

Conflicts of Interest

The authors declare no conflict of interest.

References

  1. WHO. Ambient Air Pollution: A Global Assessment of Exposure and Burden of Disease; WHO: Geneva, Switzerland, 2016; pp. 1–131. ISBN 9789241511353. [Google Scholar]
  2. WHO. Air Pollution and Child Health: Prescribing Clean Air; WHO/CED/PHE/18.01; WHO News Releases: Geneva, Switzerland, 2018. [Google Scholar]
  3. Anyenda, E.O.; Higashi, T.; Kambayashi, Y.; Nguyen, T.T.T.; Michigami, Y.; Fujimura, M.; Hara, A.J.; Tsujiguchi, H.; Kitaika, M.; Asakura, H.; et al. Associations of Cough Prevalence with Ambient Polycyclic Aromatic Hydrocarbons, Nitrogen and Sulphur Dioxide: A Longitudinal Study. Int. J. Environ. Res. Public Health 2016, 13, 800. [Google Scholar] [CrossRef] [Green Version]
  4. Hayakawa, K.; Tang, N.; Nagato, E.G.; Toriba, A.; Sakai, S.; Kano, F.; Goto, S.; Endo, O.; Arashidani, K.; Kakimoto, H. Long Term Trends in Atmospheric Concentrations of Polycyclic Aromatic Hydrocarbons and Nitropolycyclic Aromatic Hydrocarbons: A Study of Japanese Cities from 1997 to 2014. Environ. Pollut. 2018, 233, 474–482. [Google Scholar] [CrossRef]
  5. Hayakawa, K.; Nagao, S.; Inomata, Y.; Inoue, M.; Matsuki, A. Trans-Boundary Pollution in North-East Asia; Nova Science Publishers: New York, NY, USA, 2018; ISBN 978-1-53613-742-2. [Google Scholar]
  6. Hayakawa, K.; Suzuki, N. Special Issue “Recent Advances in Polycyclic Aromatic Hydrocarbons Research: Occurrence, Fate, Analysis and Risk Assessment”. Available online: https://www.mdpi.com/journal/ijerph/special_issues/PAHs (accessed on 31 December 2019).
  7. Tang, N.; Hakamata, M.; Sato, K.; Okada, Y.; Yang, X.-Y.; Tatematsu, M.; Toriba, A.; Kameda, T.; Hayakawa, K. Atmospheric behaviors of polycyclic aromatic hydrocarbons at a Japanese remote background site, Noto peninsula, from 2004. Atmos. Environ. 2015, 120, 144–151. [Google Scholar] [CrossRef] [Green Version]
  8. Zhang, H.; Zhang, L.; Yang, L.; Zhou, Q.; Zhang, X.; Xing, W.; Hayakawa, K.; Toriba, A.; Tang, N. Impact of COVID-19 Outbreak on the Long-range Transport of Common Air Pollutants in KUWAMS. Biol. Pharm. Bull. 2021, 20, 2035–2046. [Google Scholar]
  9. Yang, L.; Zhang, L.; Zhang, H.; Zhou, Q.; Zhang, X.; Xing, W.; Takami, A.; Sato, K.; Shimizu, A.; Yoshino, A.; et al. Comparative analysis of PM2.5-bound polycyclic aromatic hydrocarbons (PAHs), nitro-PAHs (NPAHs) and water-soluble inorganic ions (WSIIs) at two background sites in Japan. Int. J. Environ. Res. Public Health 2020, 17, 8224. [Google Scholar] [CrossRef] [PubMed]
  10. Hayakawa, K.; Tang, N.; Toriba, A.; Nagato, E.G. Calculating sources of combustion-derived particulates using 1-nitropyrene and pyrene as markers. Environ. Pollut. 2020, 265, 114730. [Google Scholar] [CrossRef] [PubMed]
  11. Xing, W.; Zhang, L.; Yang, L.; Zhou, Q.; Zhang, X.; Toriba, A.; Hayakawa, K.; Tang, N. Characteristics of PM2.5-bound polycyclic aromatic hydrocarbons and nitro-polycyclic aromatic hydrocarbons at a roadside air pollution monitoring station in Kanazawa, Japan. Int. J. Environ. Res. Public Health 2020, 17, 805. [Google Scholar] [CrossRef] [PubMed] [Green Version]
  12. Wise, S.A.; Sander, L.C.; Schantz, M.M. Analytical methods for determination of polycyclic aromatic hydrocarbons (PAHs)—A historical perspective on the U.S. EPA priority pollutant PAHs. Polycycl. Aromat. Compd. 2015, 35, 187–247. [Google Scholar] [CrossRef]
  13. Hayakawa, K.; Kitamura, R.; Butoh, M.; Imaizumi, N.; Miyazaki, M. Determination of diamino- and aminopyrenes by high-performance liquid chromatography with chemiluminescence detection. Anal. Sci. 1991, 7, 573–577. [Google Scholar] [CrossRef] [Green Version]
  14. Hayakawa, K.; Murahashi, T.; Butoh, M.; Miyazaki, M. Determination of 1,3-, 1,6-, and 1,8-dinitropyrenes and 1-nitropyrene in urban air by high-performance liquid chromatography using chemiluminescence detection. Environ. Sci. Technol. 1995, 29, 928–932. [Google Scholar] [CrossRef]
  15. Tang, N.; Taga, R.; Hattori, T.; Toriba, A.; Kizu, R.; Hayakawa, K. Simultaneous determination of twenty-one mutagenic nitropolycyclic aromatic hydrocarbons by high-performance liquid chromatography with chemiluminescence detection. In Proceedings of the 13th International Symposium, Bioluminescence and Chemiluminescence Progress and Perspective, Yokihama, Japan, 2–6 August 2005; Tsuji, A., Maeda, M., Matsumoto, M., Kricka, L., Stanley, P.E., Eds.; World Science: London, UK, 2005; pp. 441–9812561183. [Google Scholar]
  16. Shimizu, A.; Sugimoto, N.; Matsui, I.; Arao, K.; Uno, I.; Murayama, T.; Kagawa, N.; Aoki, K.; Uchiyama, A.; Yamazaki, A. Continuous observations of Asian dust and other aerosols by polarization lidar in China and Japan during ACE-Asia. J. Geophys. Res. 2004, 109, D19S17. [Google Scholar] [CrossRef]
  17. National Oceanic and Atmospheric Administration. Lagrangian Integrated Trajectory Model. Available online: https://ready.arl.noaa.gov/hypub-bin/trajtype.pl (accessed on 12 February 2020).
  18. Japan Meteorological Agency. Daily Weather Map. Available online: http://www.data.jma.go.jp/fcd/yoho/hibiten/index.html (accessed on 12 February 2020).
  19. USEPA. Provisional Guidance for Quantitative Risk Assessment of Polycyclic Aromatic Hydrocarbons EAP/600/R-93/089. 1993. Available online: https://www.epa.gov/risk/relative-potency-factors-carcinogenic-polycyclic-aromatic-hydrocarbons-pahs (accessed on 12 February 2021).
  20. Hayakawa, K.; Nakamura, A.; Terai, N.; Kizu, R.; Ando, K. Nitroarene concentrations and direct-acting mutagenicity of diesel exhaust particulates fractionated by silica-gel column chromatograph. Chem. Pharm. Bull. 1997, 45, 1820–1822. [Google Scholar] [CrossRef] [Green Version]
  21. Yang, L.; Suzuki, G.; Zhang, L.; Zhou, Q.; Zhang, X.; Xing, W.; Shima, M.; Yoda, Y.; Nakatsubo, R.; Hiraki, T.; et al. The characteristics of polycyclic aromatic hydrocarbons in different emission source areas in Shenyang, China. Int. J. Environ. Public Heath 2019, 16, 2817. [Google Scholar] [CrossRef] [PubMed] [Green Version]
  22. Zhang, L.; Morisaki, H.; Wei, Y.; Li, Z.; Yang, L.; Zhou, Q.; Zhang, X.; Xing, W.; Hu, M.; Shima, M.; et al. PM2.5-bound polycyclic aromatic hydrocarbons and nitro-polycyclic aromatic hydrocarbons inside and outside a primary school classroom in Beijing: Concentration, composition, and inhalation cancer risk. Sci. Total Environ. 2020, 705. [Google Scholar] [CrossRef]
  23. Ansmann, A.; Bösenberg, J.; Chaikovsky, A.; Comerón, A.; Eckhardt, S.; Eixmann, R.; Freudenthaler, V.; Ginoux, P.; Komguem, L.; Linné, H.; et al. Long-range transport of Sahara dust to northern Europe: The 11–16 October 2001 outbreak observed with EARLINET. J. Geogr. Res. 2003, 108, D24. [Google Scholar] [CrossRef]
  24. Nguyen, H.; Riley, M.; Leys, J.; Salter, D. Dust storm event of February 2019 in central and east coast of Australia and evidence of long-range transport to New Zealand and Antarctica. Atmosphere 2019, 10, 653. [Google Scholar] [CrossRef] [Green Version]
  25. Hayakawa, K. Polycyclic Aromatic Hydrocarbons: Environmental Behavior and Toxicity in East Asia; Springer: Berlin/Heidelberg, Germany, 2018; ISBN 978-981-10-6774-7. [Google Scholar]
  26. Cetin, B.; Ozturk, F.; Keles, M.; Yurdakul, S. PAHs and PCBs in an eastern Mediterranean megacity, Istanbul: Their spatial and temporal distributions, air–soil exchange and toxicological effects. Environ. Pollut. 2017, 220, 1322–1332. [Google Scholar] [CrossRef] [PubMed]
  27. Franco, J.; de Resende, F.; de Almeida Furtado, L.; Brasil, F.; Eberlin, N.; Netto, P. Polycyclic aromatic hydrocarbons (PAHs) in street dust of Rio de Janeiro and Niterói, Brazil: Particle size distribution, sources and cancer risk assessment. Sci. Total Environ. 2017, 599–600, 305–313. [Google Scholar] [CrossRef]
  28. Hamid, N.; Syed, H.; Junaid, M.; Mahmood, A.; Li, J.; Zhang, G.; NaseemMalik, R. Elucidating the urban levels, sources and health risks of polycyclic aromatic hydrocarbons (PAHs) in Pakistan: Implications for changing energy demand. Sci. Total Environ. 2018, 619–620, 165–175. [Google Scholar] [CrossRef]
  29. Yang, J.; Xu, W.; Cheng, H. Seasonal variations and sources of airborne polycyclic aromatic hydrocarbons (PAHs) in Chengdu, China. Atmosphere 2018, 9, 63. [Google Scholar] [CrossRef] [Green Version]
  30. Byambaa, B.; Yang, L.; Matsuki, A.; Nagato, E.G.; Gankhuyang, K.; Chuluunpurev, B.; Banzragch, L.; Chonokhuu, S.; Tang, N.; Hayakawa, K. Sources and characteristics of polycyclic aromatic hydrocarbons in ambient total suspended particles in Ulaanbaatar city, Mongolia. Int. J. Environ. Res. Public Health 2019, 16, 442. [Google Scholar] [CrossRef] [Green Version]
  31. Hu, H.; Tian, M.; Zhang, L.; Yang, F.; Peng, C.; Chen, Y.; Shi, G.; Yao, X.; Jiang, C.; Wang, J. Sources and gas-particle partitioning of atmospheric parent, oxygenated, and nitrated polycyclic aromatic hydrocarbons in a humidcity in southwest China. Atmos. Environ. 2019, 206, 1–10. [Google Scholar] [CrossRef]
  32. Emine, A.; Fatma, E. Atmospheric polycyclic aromatic hydrocarbons (PAHs) at two sites, in Bursa, Turkey: Determination of concentrations, gas–particle partitioning, sources, and health risk. Arch. Environ. Contam. Toxicol. 2020, 78, 350–366. [Google Scholar] [CrossRef]
  33. Yang, L.; Zhang, X.; Xing, W.; Zhou, Q.; Zhang, L.; Wu, Q.; Zhou, Z.; Chen, R.; Toriba, A.; Hayakawa, K.; et al. Yearly variation in characteristics and health risk of polycyclic aromatic hydrocarbons and nitro-PAHs in urban Shanghai from 2010–2018. J. Environ. Sci. 2021, 99, 72–79. [Google Scholar] [CrossRef] [PubMed]
  34. WHO. Review of Evidence on Health Aspects of Air Pollution—REVIHAAP Project: Final Technical Report, WHO Regional Office for Europe (2013). Available online: https://www.euro.who.int/en/health-topics/environment-and-health/air-quality/publications/2013/review-of-evidence-on-health-aspects-of-air-pollution-revihaap-project-final-technical-report (accessed on 12 February 2021).
  35. European Environment Agency. Annual Mean Bap Concentrations in 2018. 2020. Available online: https://www.eea.europa.eu/data-and-maps/figures/annual-mean-bap-concentrations-in-4 (accessed on 12 February 2021).
Figure 1. Daily atmospheric concentration of PM2.5 and PM>2.5 fractions in April, August and November 2017, and February 2018 in Kanazawa.
Atmosphere 12 00256 g001
Figure 2. Daily atmospheric concentrations of PM2.5-bound PAHs in April, August and November 2017, and February 2018 in Kanazawa. The pie charts show the fractions of the average concentrations of PAHs.
Atmosphere 12 00256 g002
Figure 3. Daily atmospheric concentrations of PM2.5-bound NPAHs in April, August and November 2017, and February 2018 in Kanazawa. The pie charts show the fractions of the average concentrations of PAHs.
Atmosphere 12 00256 g003
Figure 4. Daily atmospheric concentrations and compositions of PM2.5 in April, August and November 2017, and February 2018 in Kanazawa.
Atmosphere 12 00256 g004
Figure 5. Daily atmospheric concentrations and sources of Pc in April, August and November 2017, and February 2018 in Kanazawa.
Atmosphere 12 00256 g005
Table 1. Seasonal Atmospheric Concentrations (Average ± S.D.) of PM>2.5 and PM2.5 in Kanazawa.
Spring,
2017
Summer,
2017
Autumn,
2017
Winter,
2018
Annual a
PM>2.5,
μg m−3
9.5 ± 9.97.6 ± 1.77.7 ± 4.27.4 ± 2.78.0 ± 4.2
PM2.5,
μg m−3
21.7 ± 12.110.6 ± 4.312.3 ± 5.114.2 ± 2.614.7 ± 7.9
PM2.5/TSP b,
%
69.658.261.565.764.6
Annual average ± SD of the sum of the spring, summer and autumn of 2017, and the winter of 2018. TSP = PM>2.5 + PM2.5.
Table 2. Seasonal Atmospheric Concentrations of ΣPAH and ΣNPAH in Kanazawa.
Spring,
2017
Summer,
2017
Autumn,
2017
Winter,
2018
Annual a
ΣPAH b,
ng m−3
0.86 ± 0.560.30 ± 0.090.66 ± 0.231.00 ± 0.260.71 ± 0.41
ΣNPAH c,
pg m−3
7.90 ± 3.023.32 ± 1.186.53 ± 2.479.56 ± 4.066.83± 3.68
a Annual average ± SD of sum of spring, summer and autumn of 2017 and the winter of 2018. b ΣPAH = FR + Pyr + BaA + Chr + BbF + BkF + BaP + BghiPe + DP. c ΣNPAH = 9-NA + 1-NP + 6-NC + 7-NBaA + 3-NPer + 6-NBaP.
Table 3. Seasonal atmospheric concentrations (average ± S.D.) of Pc, Po, Pl and Ph in Kanazawa.
Spring,
2017
Summer,
2017
Autumn,
2017
Winter,
2018
Annual a
Pc,
μg m−3
0.36 ± 0.140.18 ± 0.100.26 ± 0.080.47 ± 0.080.33 ± 0.15
Po,
μg m−3
21.4 ± 12.110.2 ± 6.212.0 ± 5.013.6 ± 2.614.6 ± 8.1
Pc/PM2.5,
%
1.71.72.13.32.1
Pl,
μg m−3
0.26 ± 0.140.10 ± 0.040.20 ± 0.050.31 ± 0.070.23 ± 0.11
Ph,
μg m−3
0.10 ± 0.030.07 ± 0.070.06 ± 0.030.16 ± 0.060.10 ± 0.06
Ph/Pc,
%
27.841.223.134.031.0
a Annual average ± SD of the sum of the spring, summer and autumn of 2017, and the winter of 2018. Pc, particulate from a combustion source; Po, particulate from a non-combustion source; Pl, particulate from a combustion source with a lower temperature (heating facilities/industries); Ph, particulate from a combustion source with a higher temperature (vehicles). PM2.5 = Pc + Po. Pc = Pl + Ph.
Publisher’s Note: MDPI stays neutral with regard to jurisdictional claims in published maps and institutional affiliations.

