Abstract
To identify the vegetation dynamics and relationship with the hydrothermal conditions in the Yellow River basin (YRB), the spatial–temporal variations of EVI, effective precipitation (Epr), accumulated temperature (At), and their relationships were obtained based on the MODIS EVI data and meteorological data from the YRB during 2001–2020. The results indicate that EVI trends increased during 2001 to 2020, especially in the farmland, forestland, and grassland ecosystems. Epr and At have also increased over the last 20 years. Epr mostly increased faster in the grassland, and water bodies and wetland ecosystems. At mostly increased faster in the water bodies and wetland, desert, and forest ecosystems. Affected by Epr and At, the correlation between the EVI and hydrothermal conditions varied under different hydrothermal conditions. Compared to the At, the Epr was the restrictive factor for the EVI variations in the terrestrial ecosystem in the YRB. In addition, the dynamical thresholds of the EVI, Epr, and At were confirmed. This study can improve the understanding of vegetation variations and their response to regional climate change, which is critical for ecological conservation and the high-quality development of the YRB.
1. Introduction
Vegetation is a vital component of the terrestrial ecosystem. It is not only the link between the atmosphere, soil, and water bodies but also the basis for the survival of other organisms [1,2,3]. Climate is a direct driver of vegetation change and determines the distribution of surface vegetation. In turn, vegetation greatly influences the carbon and water cycles of terrestrial ecosystems. It serves as an indicator of the relationship between terrestrial ecosystems and climate change [4]. Therefore, it is necessary to study the interactions between the climate and terrestrial ecosystems. Some scholars argued that climate warming was the direct cause of vegetation variations in the northern hemisphere [5,6], while Braswell pointed out that warming showed a suppressive effect on vegetation growth [7].
Numerous studies have different emphases on various scales. On a global scale, the NDVI was significantly positively correlated with temperature in the northern middle- and high-latitude zones, and it was significantly negatively correlated with precipitation in some semiarid regions [8]. However, increasing precipitation promoted the growth of grassland except in the Arctic region [9,10,11,12]. In China, vegetation distribution patterns have significantly altered under the climate changes over the last half century [13,14,15,16]. In the Tibetan Plateau, vegetation changes largely coincided with the regional and seasonal characteristics of temperature and precipitation [3]. In the Qilian Mountains, temperature was the major factor affecting vegetation [17]. However, in the Loess Plateau, precipitation was a key factor in promoting vegetation growth [18]. Therefore, precipitation and temperature acted differently on vegetation changes [19].
Most previous studies largely concentrated on precipitation and temperature which affected vegetation growth and patterns. Although surface vegetation was directly influenced by hydrothermal conditions, there were cumulative effects and lags in the response of vegetation to climate driving forces [20]. Considering hysteretic effects and the actual vegetation growth, in contrast with other studies, this study selected accumulated temperature (At) and effective precipitation (Epr) as the key indicators to analyze the relationship between hydrothermal conditions and vegetation. At was the sum of all values of the daily average temperature ≥10 °C for 365 days of the year [21,22,23]. Epr was the net water quantity that can be determined using precipitation and the effective utilization coefficient [24]. For vegetation, the normalized difference vegetation index (NDVI) and enhanced vegetation index (EVI) were used as critical indicators of vegetation growth [25,26,27]. They are also effective indicators to study global and regional vegetation growth and change in surface vegetation cover [28,29]. However, compared with NDVI, EVI is more sensitive to topographic effects and has more advantages in the monitoring of sensitive and high biomass conditions [30,31]. Meanwhile, water and heat conditions were the main factors driving vegetation variations [32].
The YRB is very sensitive to global warming [33]. Its vegetation improved over the past 32 years and will mainly remain either unchanged or continuously improve in the future [27,34,35,36,37]. In order to better understand vegetation variations in response to hydrothermal conditions, based on the MODIS EVI data and meteorological data from the YRB during 2001–2020, this study aimed to: (a) explore the spatiotemporal pattern of EVI in the YRB since 2001; (b) identify the spatiotemporal distribution of the Epr and AT over 20 years; (c) explore the main hydrothermal conditions affecting vegetation variations and patterns; and (d) confirm the dynamical thresholds of EVI, Epr and At. Our study improves the understanding of terrestrial vegetation variations and their response to regional climate change, which is critical for regional ecological conservation and high-quality development. To investigate the response relationship between regional vegetation and climate change should provide scientific theory and a basis for the sustainable development of the regional ecological environment.
2. Materials and Methods
The Yellow River, originating in the Bayankara mountain range in Qinghai province, covers an area of approximately 752,443 km2, flows through nine provinces, and empties into the Bohai Sea. As showed in Figure 1, YRB is located at 96°–119° E, 32°–42° N across four geomorphic units, including the Qinghai–Tibet Plateau, Inner Mongolia Plateau, Loess Plateau, and Yellow Huaihai Plain. The basin lies in the mid-latitude zone, which is affected by atmospheric and monsoon circulation in a complex manner [38,39]. This leads to significant climatic variability in different regions of YRB. The YRB spans three climatic divisions from north to south: arid (annual precipitation 0–200 mm), semiarid (annual precipitation 200–400 mm), and semihumid (annual precipitation 400–800 mm), with most of the area located in the arid and semiarid zones. The YRB has a large population and complex geographical and climatic conditions, and the sustainable development of its population, resources, and environment has been a major concern.
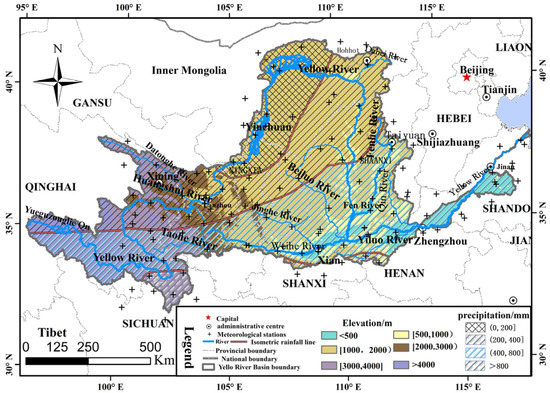
Figure 1.
Geographic location of the YRB (Yellow River basin).
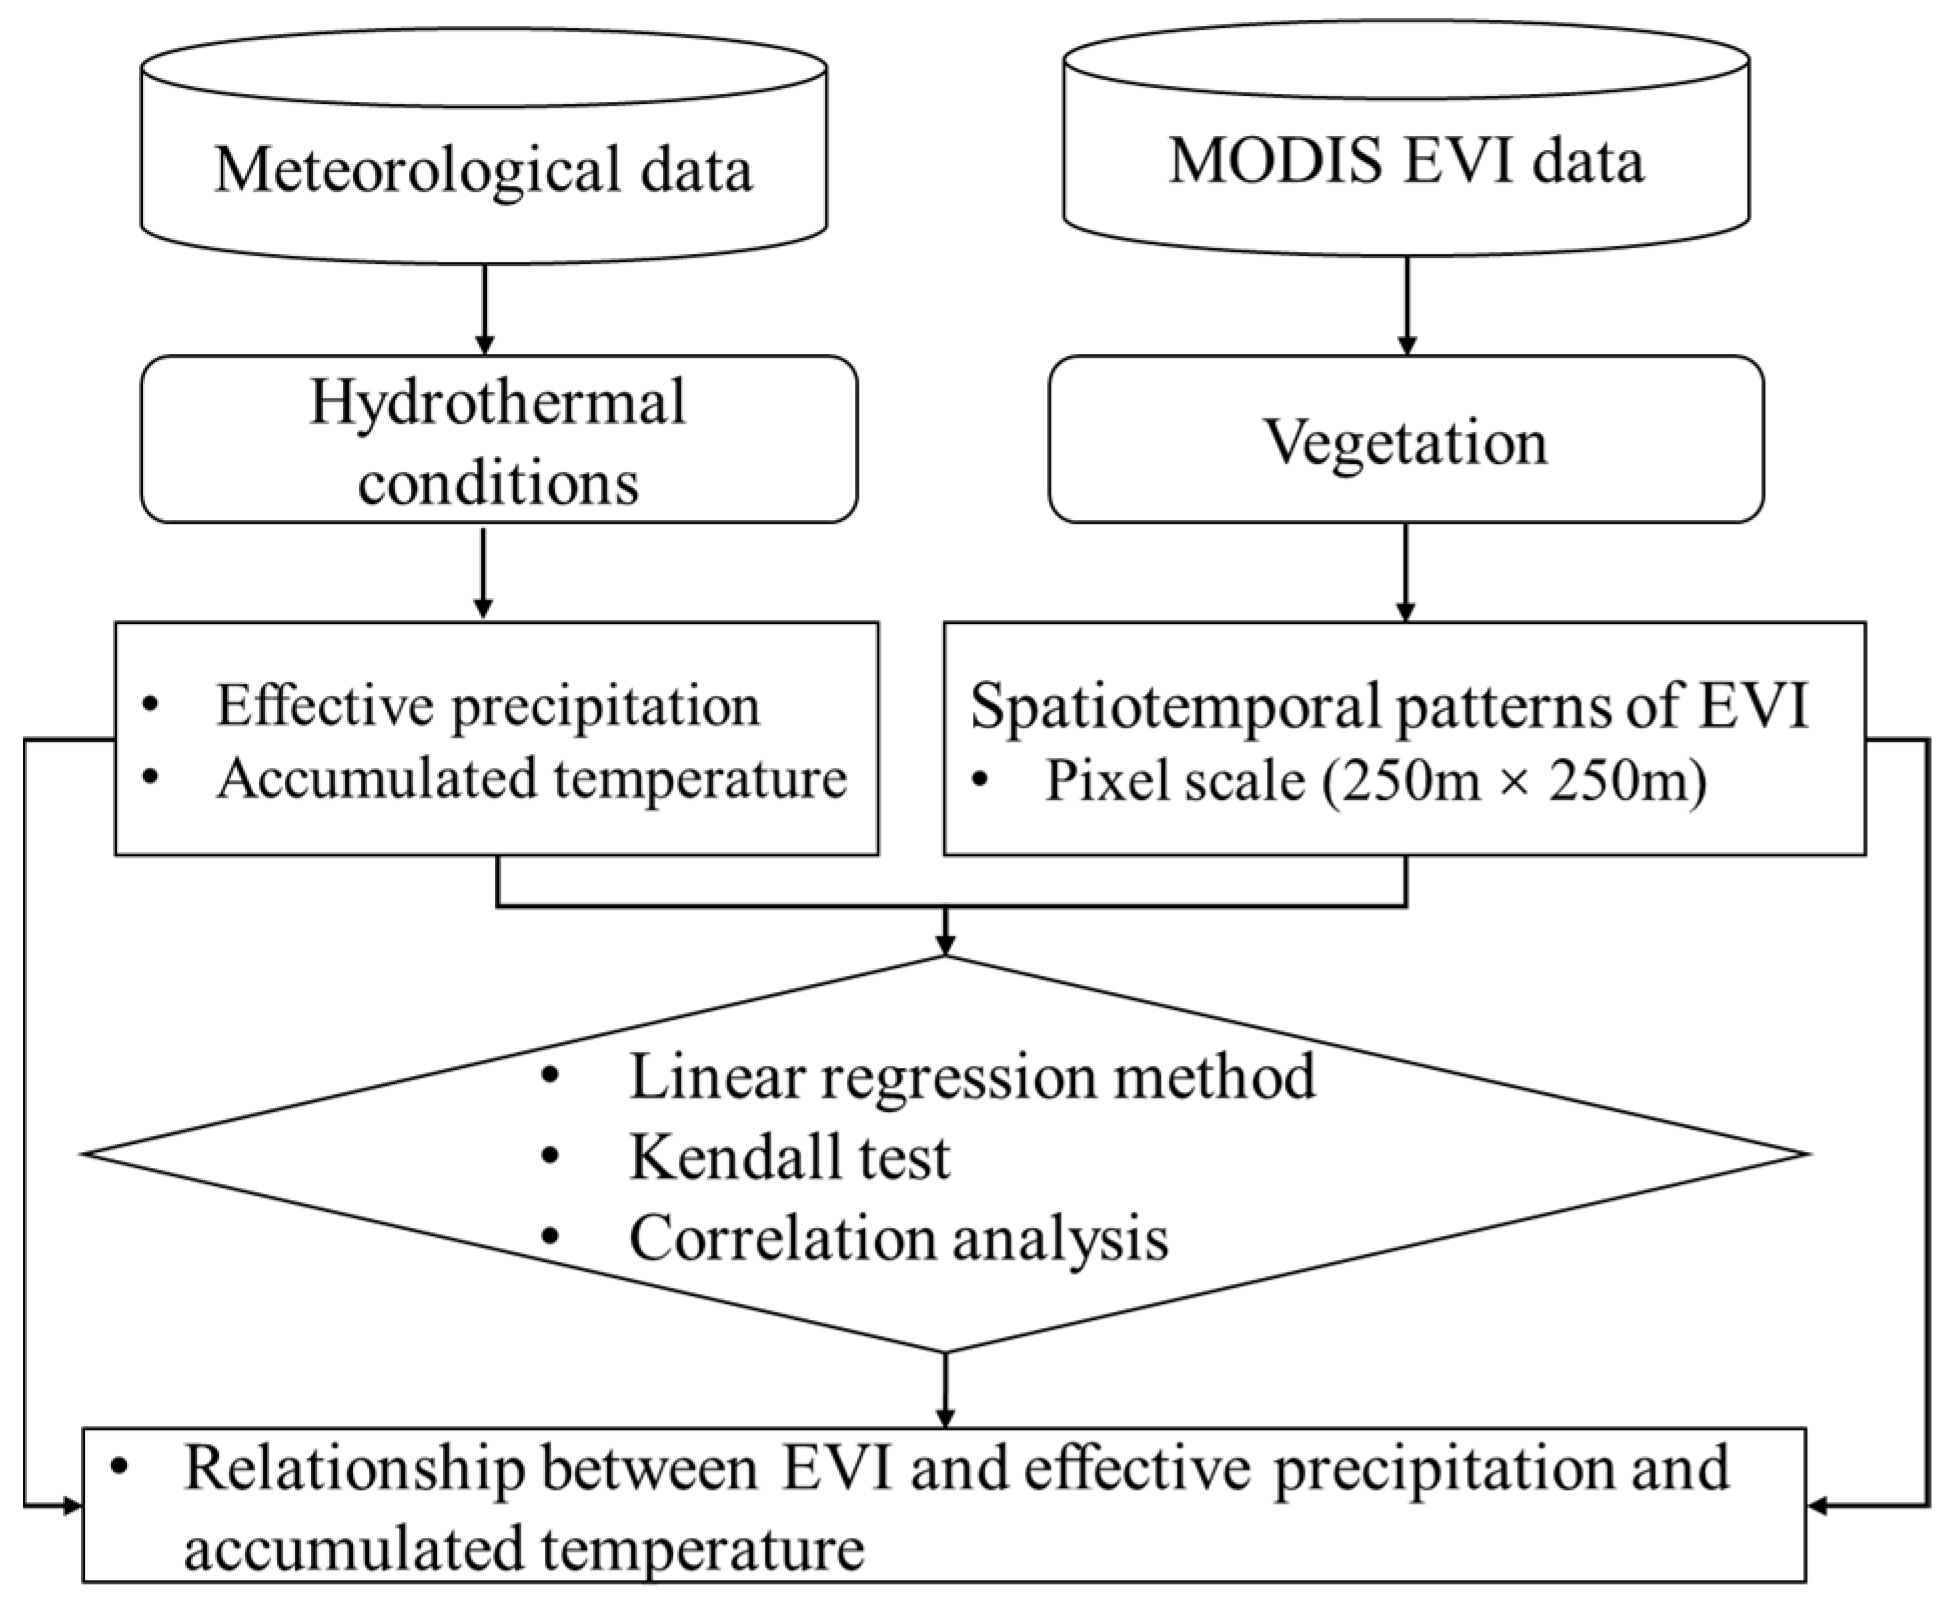
In this study, linear regression, Kendall test and correlation analysis were used to investigate the spatiotemporal patterns and variations of hydrothermal conditions and vegetation, on both basin scale and pixel scale. Then relationship between EVI and hydrothermal conditions were discussed. For hydrothermal conditions, Epr and At were selected as the main factors influencing the EVI changes (Figure 2).

Figure 2.
A flowchart for investigation of vegetation variations.
2.1. Data Sources and Data Processing
2.1.1. MODIS EVI Data
The EVI was used as an indicator to reveal vegetation patterns [36,40,41]. The MODIS EVI data were derived from the NASA MODIS global vegetation index product (https://www.nasa.gov/, accessed on 30 September 2021) with a resolution of 250 m and a time scale of 16 days. EVI data from January 2001 to December 2020 were selected for the YRB, with 23 periods per year and a total of 460 images. The annual maximum synthesis method was used to obtain the 2001–2020 scale EVI series using ArcGis 10.7 software platform.
2.1.2. Meteorological Data
In this study, daily temperature and precipitation data of the YRB from 100 meteorological stations for the period 2001–2015 and 93 meteorological stations for the period 2016–2020 (the distribution of stations is shown in Figure 1) were selected from the National Meteorological Science Data Sharing Service Platform (http://www.resdc.cn, accessed on 5 October 2021). The relevant AML language was compiled using the ArcInfo Workstation 10.2 platform, and the IDW (inverse distance weighted) spatial interpolation method was used to graticule the data into 250 m resolution daily temperature and precipitation data from 2001 to 2020. The raster layers were obtained for the annual Epr and At in the YRB from 2001 to 2020.
2.1.3. Terrestrial Ecosystems Data
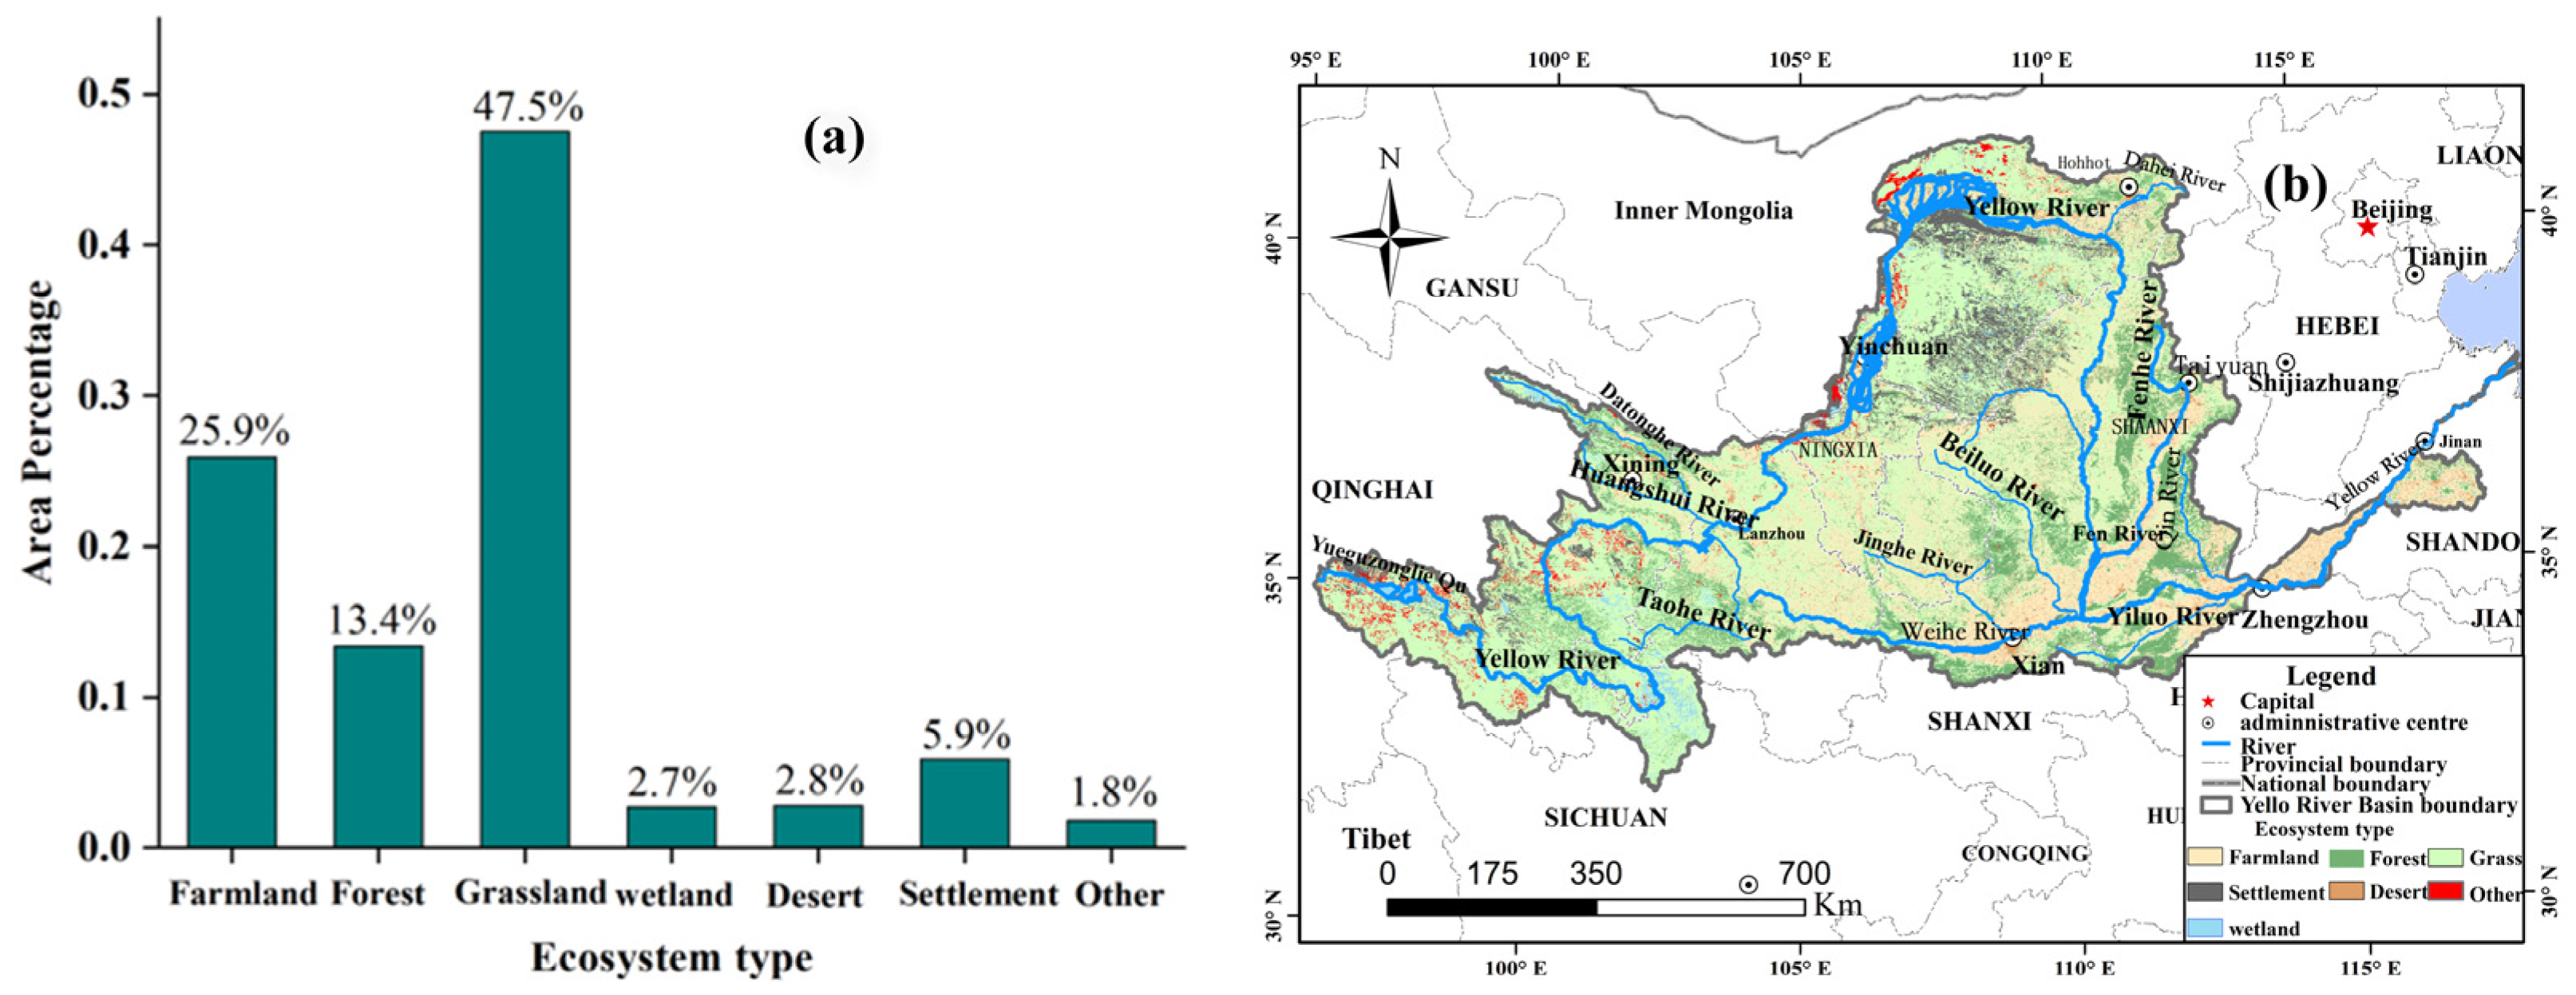
The data of terrestrial ecosystem types for 2015 in the YRB were obtained from the Resource and Environment Science Data Center of the Chinese Academy of Sciences (http://www.resdc.cn/, accessed on 5 October 2021). As indicated in Figure 3, the ecosystem types were classified into seven major categories: grassland, farmland, forest, settlement, desert, water bodies and wetlands, and others, accounting for 47.5%, 25.9%, 13.4%, 5.9%, 2.8%, 2.7%, and 1.8% of the total area, respectively. It can be concluded that the terrestrial ecosystem of the YRB is dominated by farmland, forests, and grasslands.
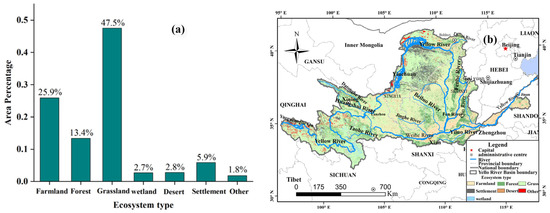
Figure 3.
Area proportion (a) of terrestrial ecosystem types and their spatial distribution (b) in the YRB (Yellow River basin). Note: Due to restrictions on name length, wetland represents water bodies and wetlands.
2.2. Methods
A linear trend analysis and the Kendall test were used to study the extent of hydrothermal conditions and EVI variations at different scales in the YRB. Effects of the hydrothermal conditions on the EVI were studied based on a correlation analysis.
2.2.1. Linear Regression Method
The annual series data of Epr, At, and EVI in the YRB from 2001 to 2020 were used for the trend analysis of the elements using the linear propensity rate method [42,43]. indicates a certain Epr, At or EVI; indicates the time corresponding to xi. The one-dimensional linear regression equation is:
where is a constant term, is the tendency rate, > 0 means that the study object exhibits an increasing trend in the statistical time period and vice versa, and the absolute value indicates the degree of change.
2.2.2. Mann–Kendall Test
The Mann-Kendall test was used to test the significance of the trends in Epr, At and EVI in the Yellow River basin [40,44]. The test statistic U was constructed according to Equation (2), and given the significance level , the trend was considered insignificant when and significant otherwise.
Among them:
where: n is the length of the sequence, text ; is the number of occurrences of in the given sequence for all pairs of values .
2.2.3. Correlation Analysis
The correlation between EVI and Epr or At in the YRB from 2001 to 2020 was analyzed at the image element level and on a regional scale. The influence of the hydrothermal conditions on the EVI in the YRB was studied based on the results of the correlation analysis [22,45]. The correlation coefficient was calculated as follows:
where is the correlation coefficient between factors and y; andare the values of factors and y in year , respectively; and are the multiyear averages of factors and y in the study period, respectively. indicates that factors and y are positively correlated and vice versa; the larger , the stronger the correlation.
3. Results and Discussion
3.1. Spatiotemporal Patterns of EVI in the YRB
3.1.1. Temporal Variation of EVI
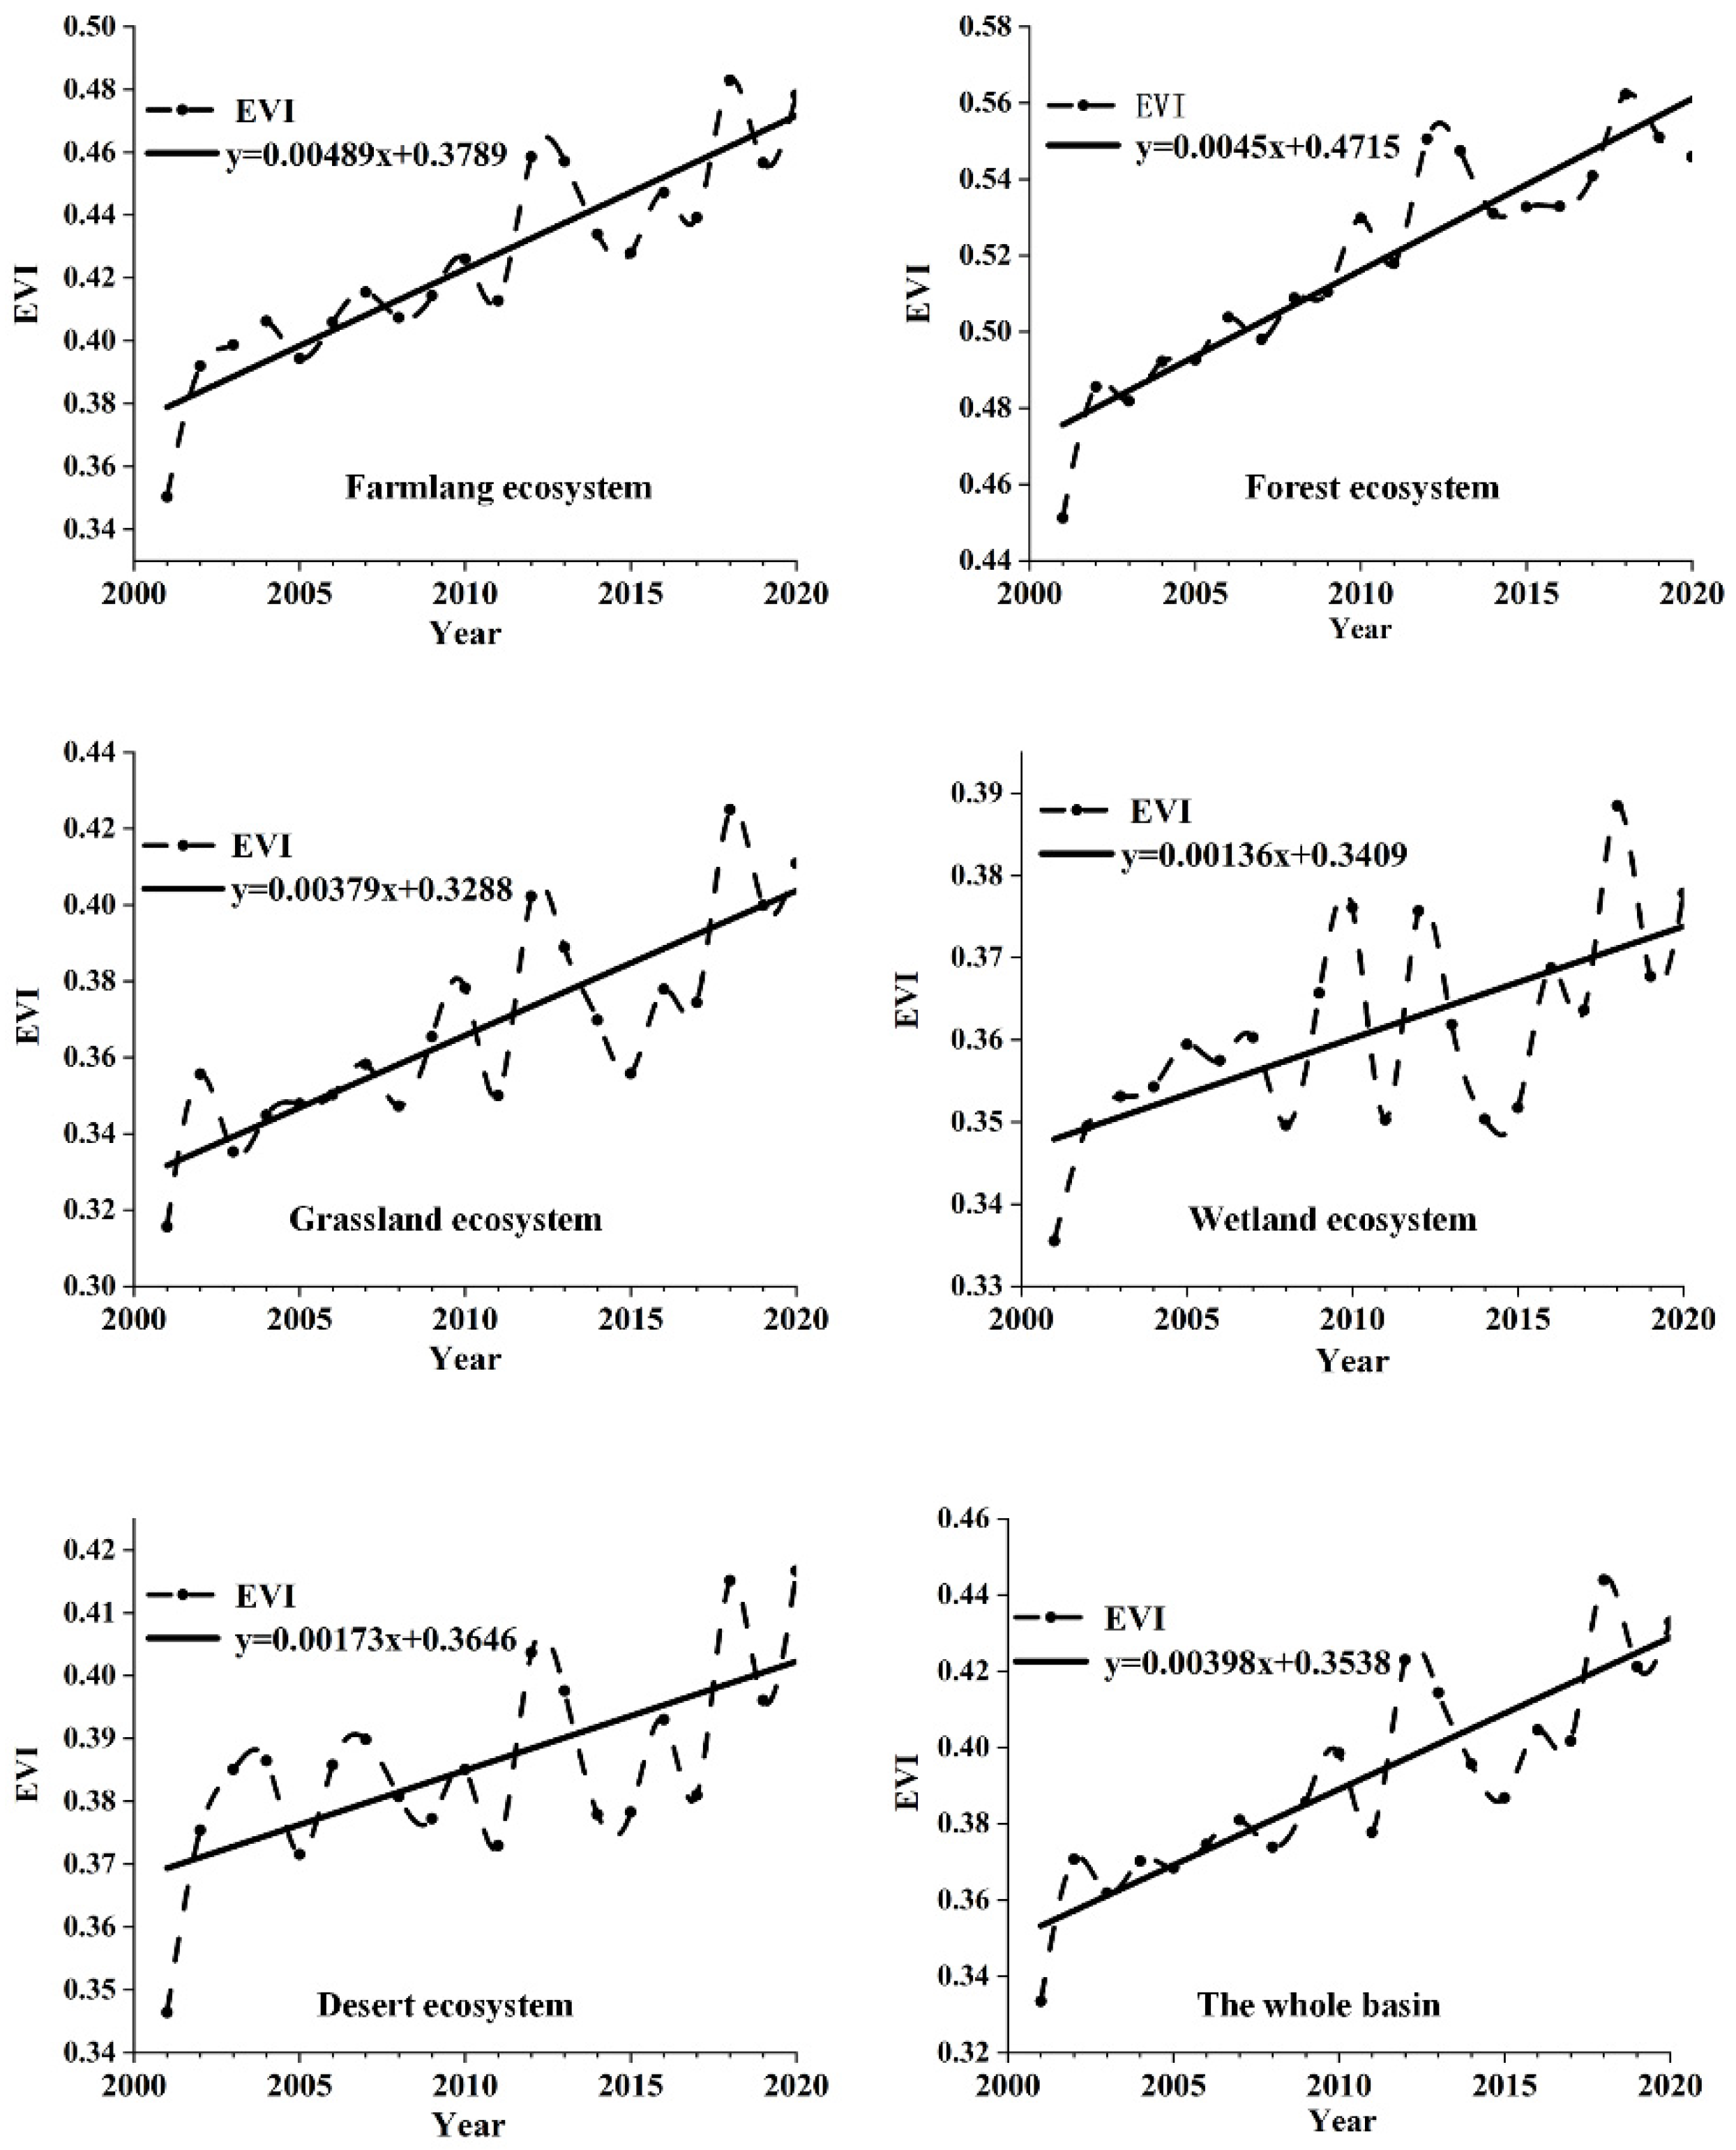
The variations of EVI exhibited an increasing trend in different ecosystems in the YRB, but the change slopes varied (Figure 4). The variation slope of EVI from 2001 to 2020 was about 0.0040 yr−1 over the whole of the YRB. The trends of EVI were approximately 0.0049 yr−1 and 0.0045 yr−1 in the farmland and forest ecosystems, respectively; about 0.0038 yr−1 in the grassland ecosystems; and approximately 0.0014 yr−1 and 0.0017 yr−1 in the water and wetland ecosystems and desert ecosystems, respectively. The slope of the EVI in the farmland and forest ecosystems was higher than the average slope in the YRB, and the slope of the others was lower than the mean slope over the whole basin.
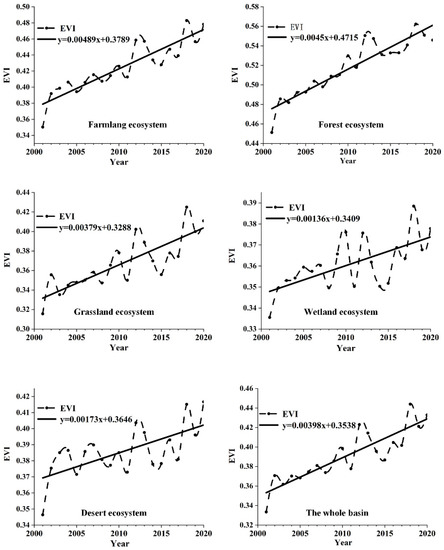
Figure 4.
Variation of annual EVI in different ecosystems in the YRB (Yellow River basin).
The artificial cover in the agroforestry ecosystem consists primarily of crops (accounting for 71%). Their growth cycles are short and perform the significant seasonal variations. When lacking precipitation, substantial irrigation still meets the water requirements for crop growth. This could explain the greater slope of EVI in the farmland ecosystems. In addition, a series of ecological constructions and projects have been implanted in the YRB since the 1990s [11,46]. These artificial activities intervened and changed the land-use types of the YRB, especially the project of returning farmland to forests and grassland in 1999. Specific interventions included the conversion of: arable land to woodland, scrub and grassland; grassland to woodland and scrub; and desert to woodland, scrub, and grassland in local areas. As a result, the EVI of the farmland, grassland, and desert ecosystems dramatically increased after 2000.
3.1.2. Spatial Pattern of EVI
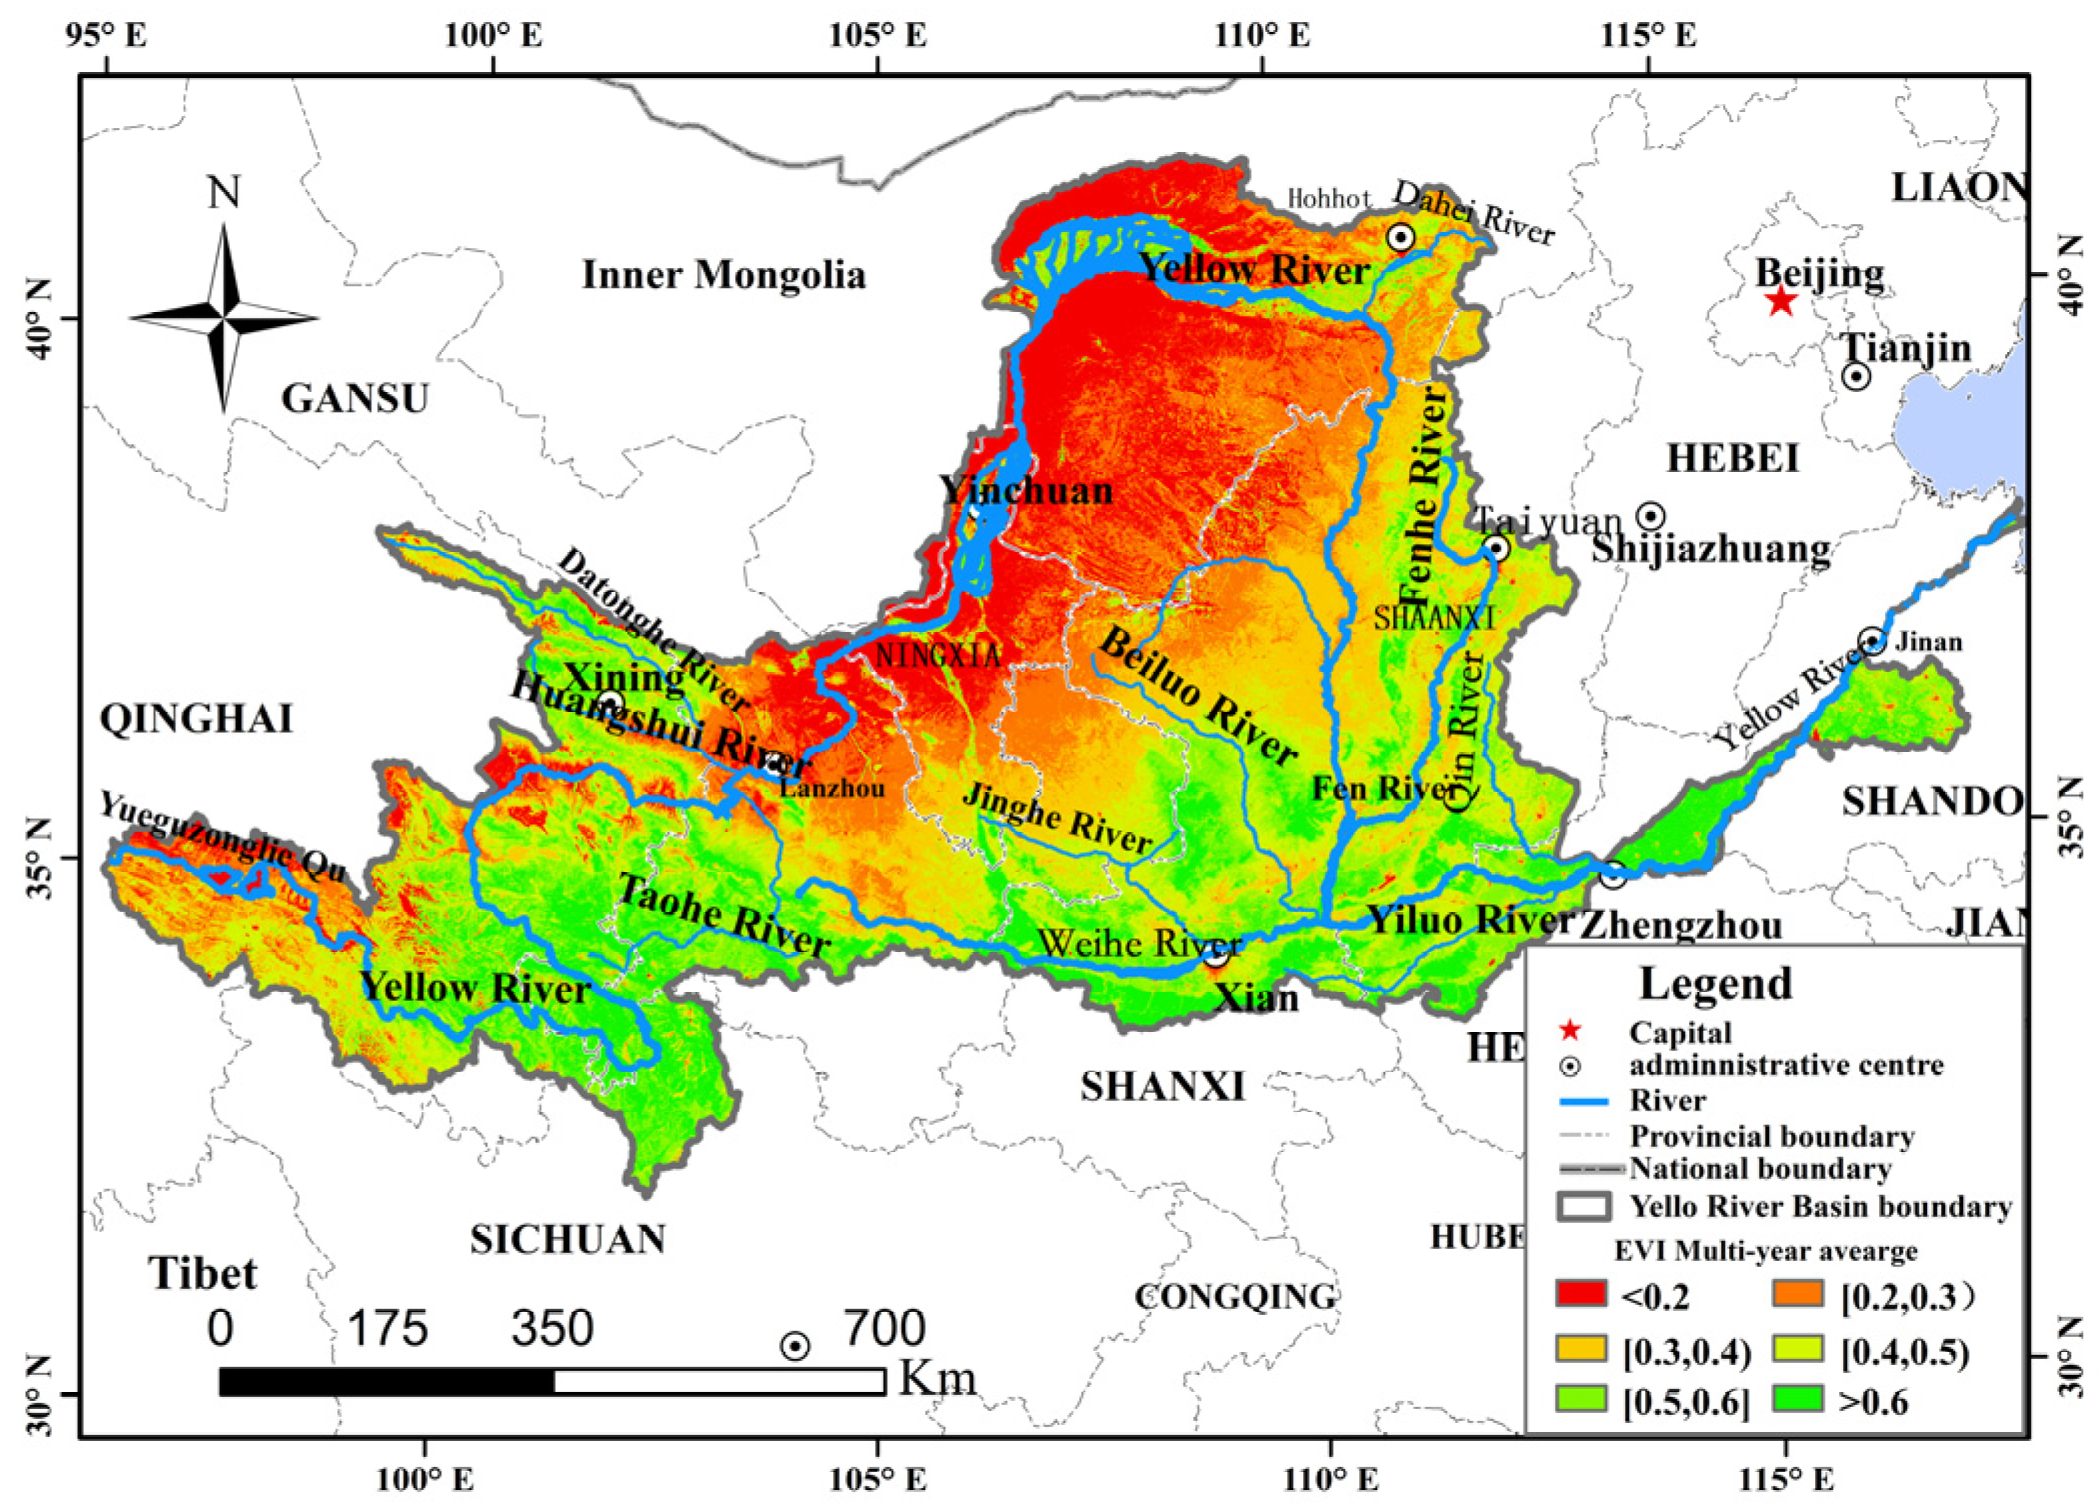
Figure 5 shows the spatial distribution of the multiyear mean values of the EVI for the YRB. Overall, the mean value was 0.39, and the EVI gradually increased from the northwest to southeast. Based on the existing research results, when the EVI was between 0.3 and 0.45, the vegetation cover can be classified as low to medium [12,47]. Therefore, the overall vegetation coverage of the YRB has been moderately low over the past 20 years. The low-value areas (EVI < 0.3) of the YRB accounted for 33% of the area and are predominantly located in the Inner Mongolia Plateau, Loess Plateau, Qinghai–Tibet Plateau, and west of the Taihang Mountains. The research indicates that the 400 mm annual precipitation line was the dividing line between semiarid and semihumid areas [48,49]. The majority of the Inner Mongolian Plateau, Loess Plateau, Qinghai–Tibet Plateau, and areas to the west of the Taihang Mountains located west of the dividing line is where precipitation was less than 400 mm. Therefore, low precipitation can lead to low EVI. For the Qinghai–Tibet Plateau, the low temperature was also an important reason for the low EVI due to its high altitude [50]. In addition, the vegetation cover in the northwestern part of the basin was dominated by desert and decertified grassland, whereas the Yellow River source area belonged to the typical mountain-type plateau and was widely covered with bare rocks and sparse grassland [51]. This also explained the low EVI in the northwestern part of the basin to some extent. Therefore, the vast low EVI areas were also responsible for the overall low vegetation cover level in the YRB.

Figure 5.
Spatial distribution of multiyear average EVI in the YRB during 2001–2020.
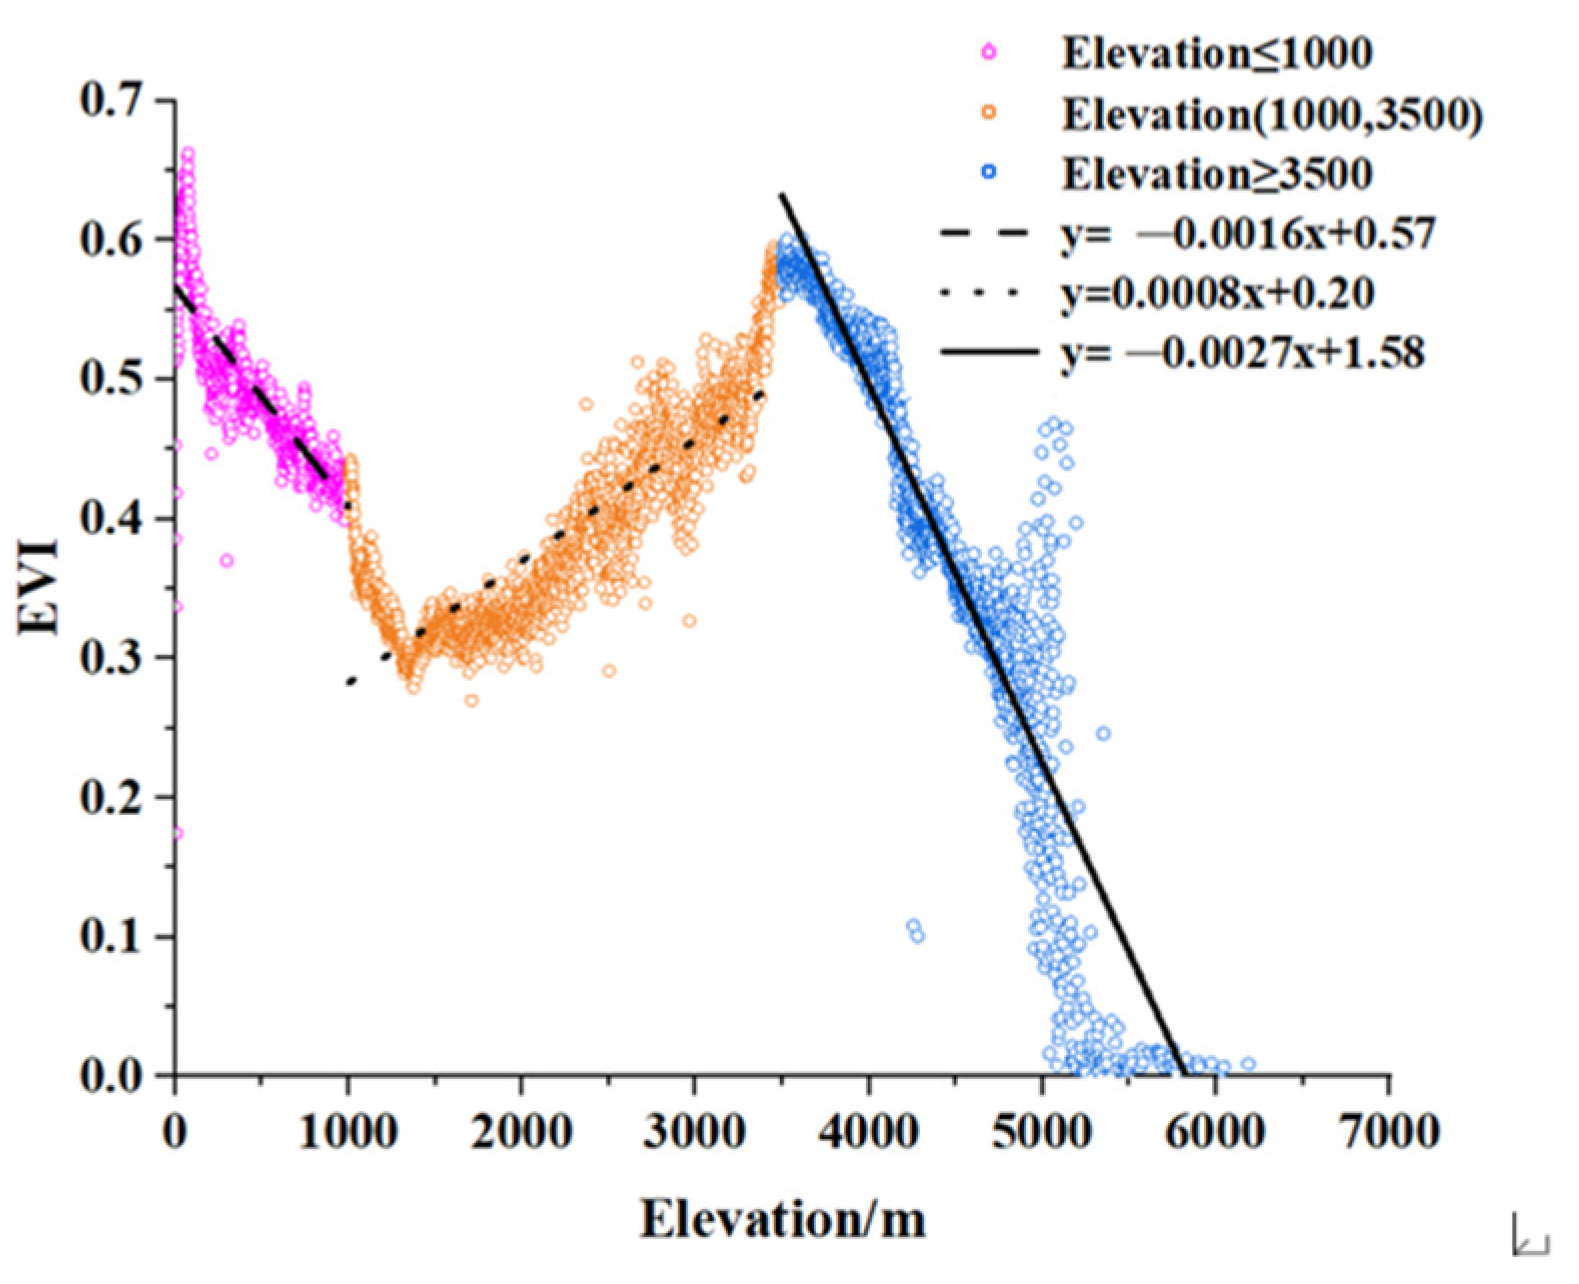
Figure 6 reveals the spatial average EVI along the different elevations. When the elevation was greater than 3500 m or less than 1000 m, the average EVI decreased with elevation. When 1000 < elevation < 3500, the average EVI and elevation increased at the same time. From the watershed perspective, the EVI in the upper and lower reaches of the YRB were higher than those in the middle reaches [52,53].
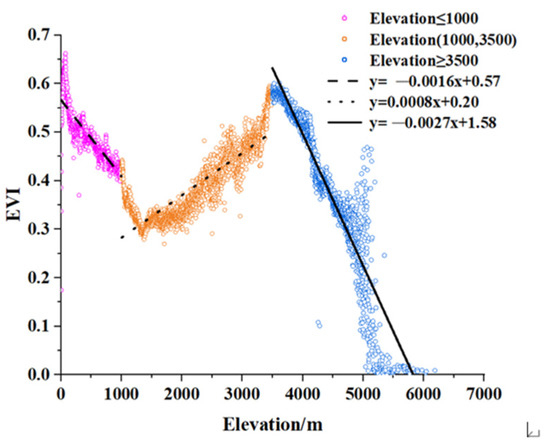
Figure 6.
Average EVI changes along various elevations.
The upstream areas were less disturbed by anthropogenic activities, with large areas of primary forests (e.g., Sanjiangyuan National Park and Qilianshan National Park) and nature reserves (e.g., Qilianshan Nature Reserve, Xinglongshan Nature Reserve, and Helanshan Nature Reserve) [13,16]. In contrast, the downstream areas were predominantly artificial vegetation (crops) [54]. Therefore, the overall vegetation cover level was better. Furthermore, the midstream areas were mostly located in arid and semiarid climate zones, while the upstream and downstream areas were mostly located in humid and semihumid zones [14,15]. As a result, due to the influence of water and heat conditions, their vegetation was relatively the least suitable.
3.1.3. Spatial Distribution of EVI Tendency
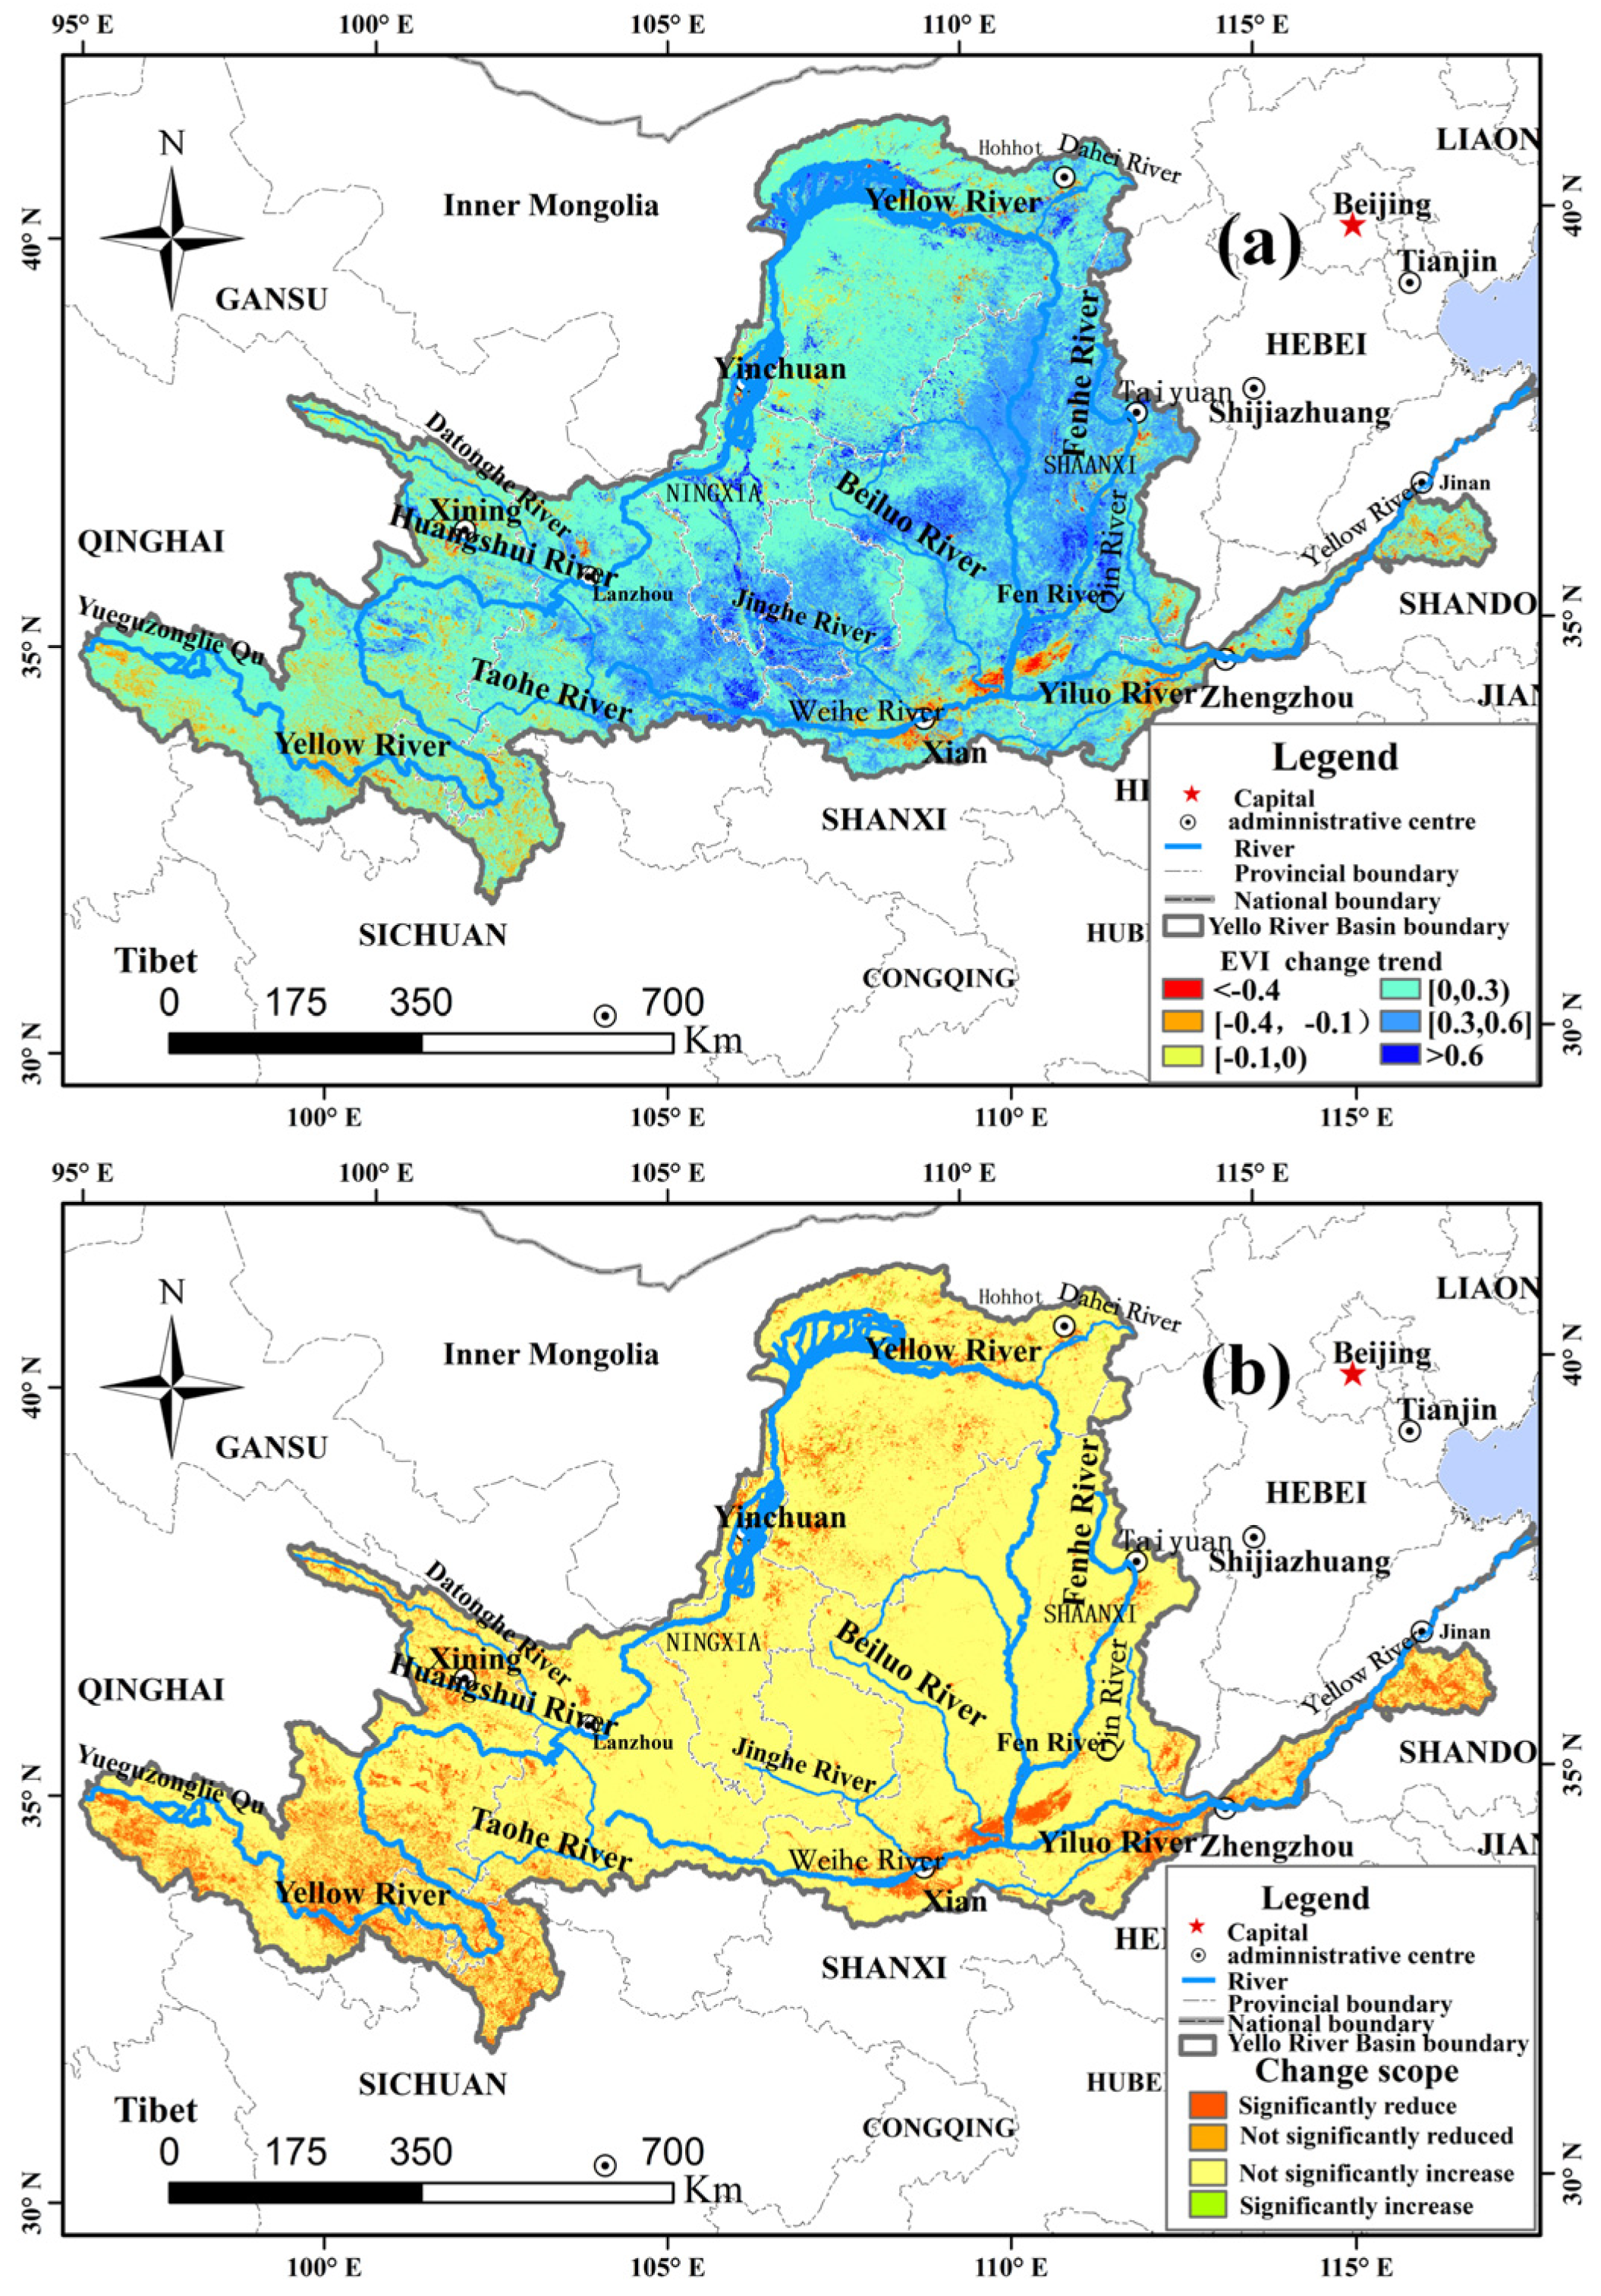
Figure 7 illustrates the spatial characteristics of the EVI trends in the YRB from 2001 to 2020. As shown in the figure, the overall EVI trend is increasing. The proportion of the area with vegetation growth was 87%, which was much larger than the area with a decrease in vegetation (13%). The vegetation growth areas were predominantly located in the Qilian Mountains, Ningxia Plain, Loop Plain, Loess Plateau, northern Guanzhong Plain, southern Gansu province, and western Shanxi province. However, areas with significant changes (p < 0.05) accounted for approximately 13% of the total area and were primarily distributed in the areas with reduced vegetation. The possible reasons for the significant decrease were that these areas were mainly concentrated on both banks of the Yellow River in Qinghai, Henan, and the Shandong province and on both banks of the Wei River, which are relatively densely populated. The vegetation is vulnerable to human activities, and the accelerated urbanization process exacerbated the vegetation degradation to some extent, resulting in some reduction in vegetation cover.

Figure 7.
Spatial distribution of EVI trend (a) and trend significance levels (b, p < 0.05) of spatial pattern in the YRB from 2001 to 2020.
3.2. Spatiotemporal Distribution of Epr and At in the YRB
3.2.1. Temporal Variation of Epr and At
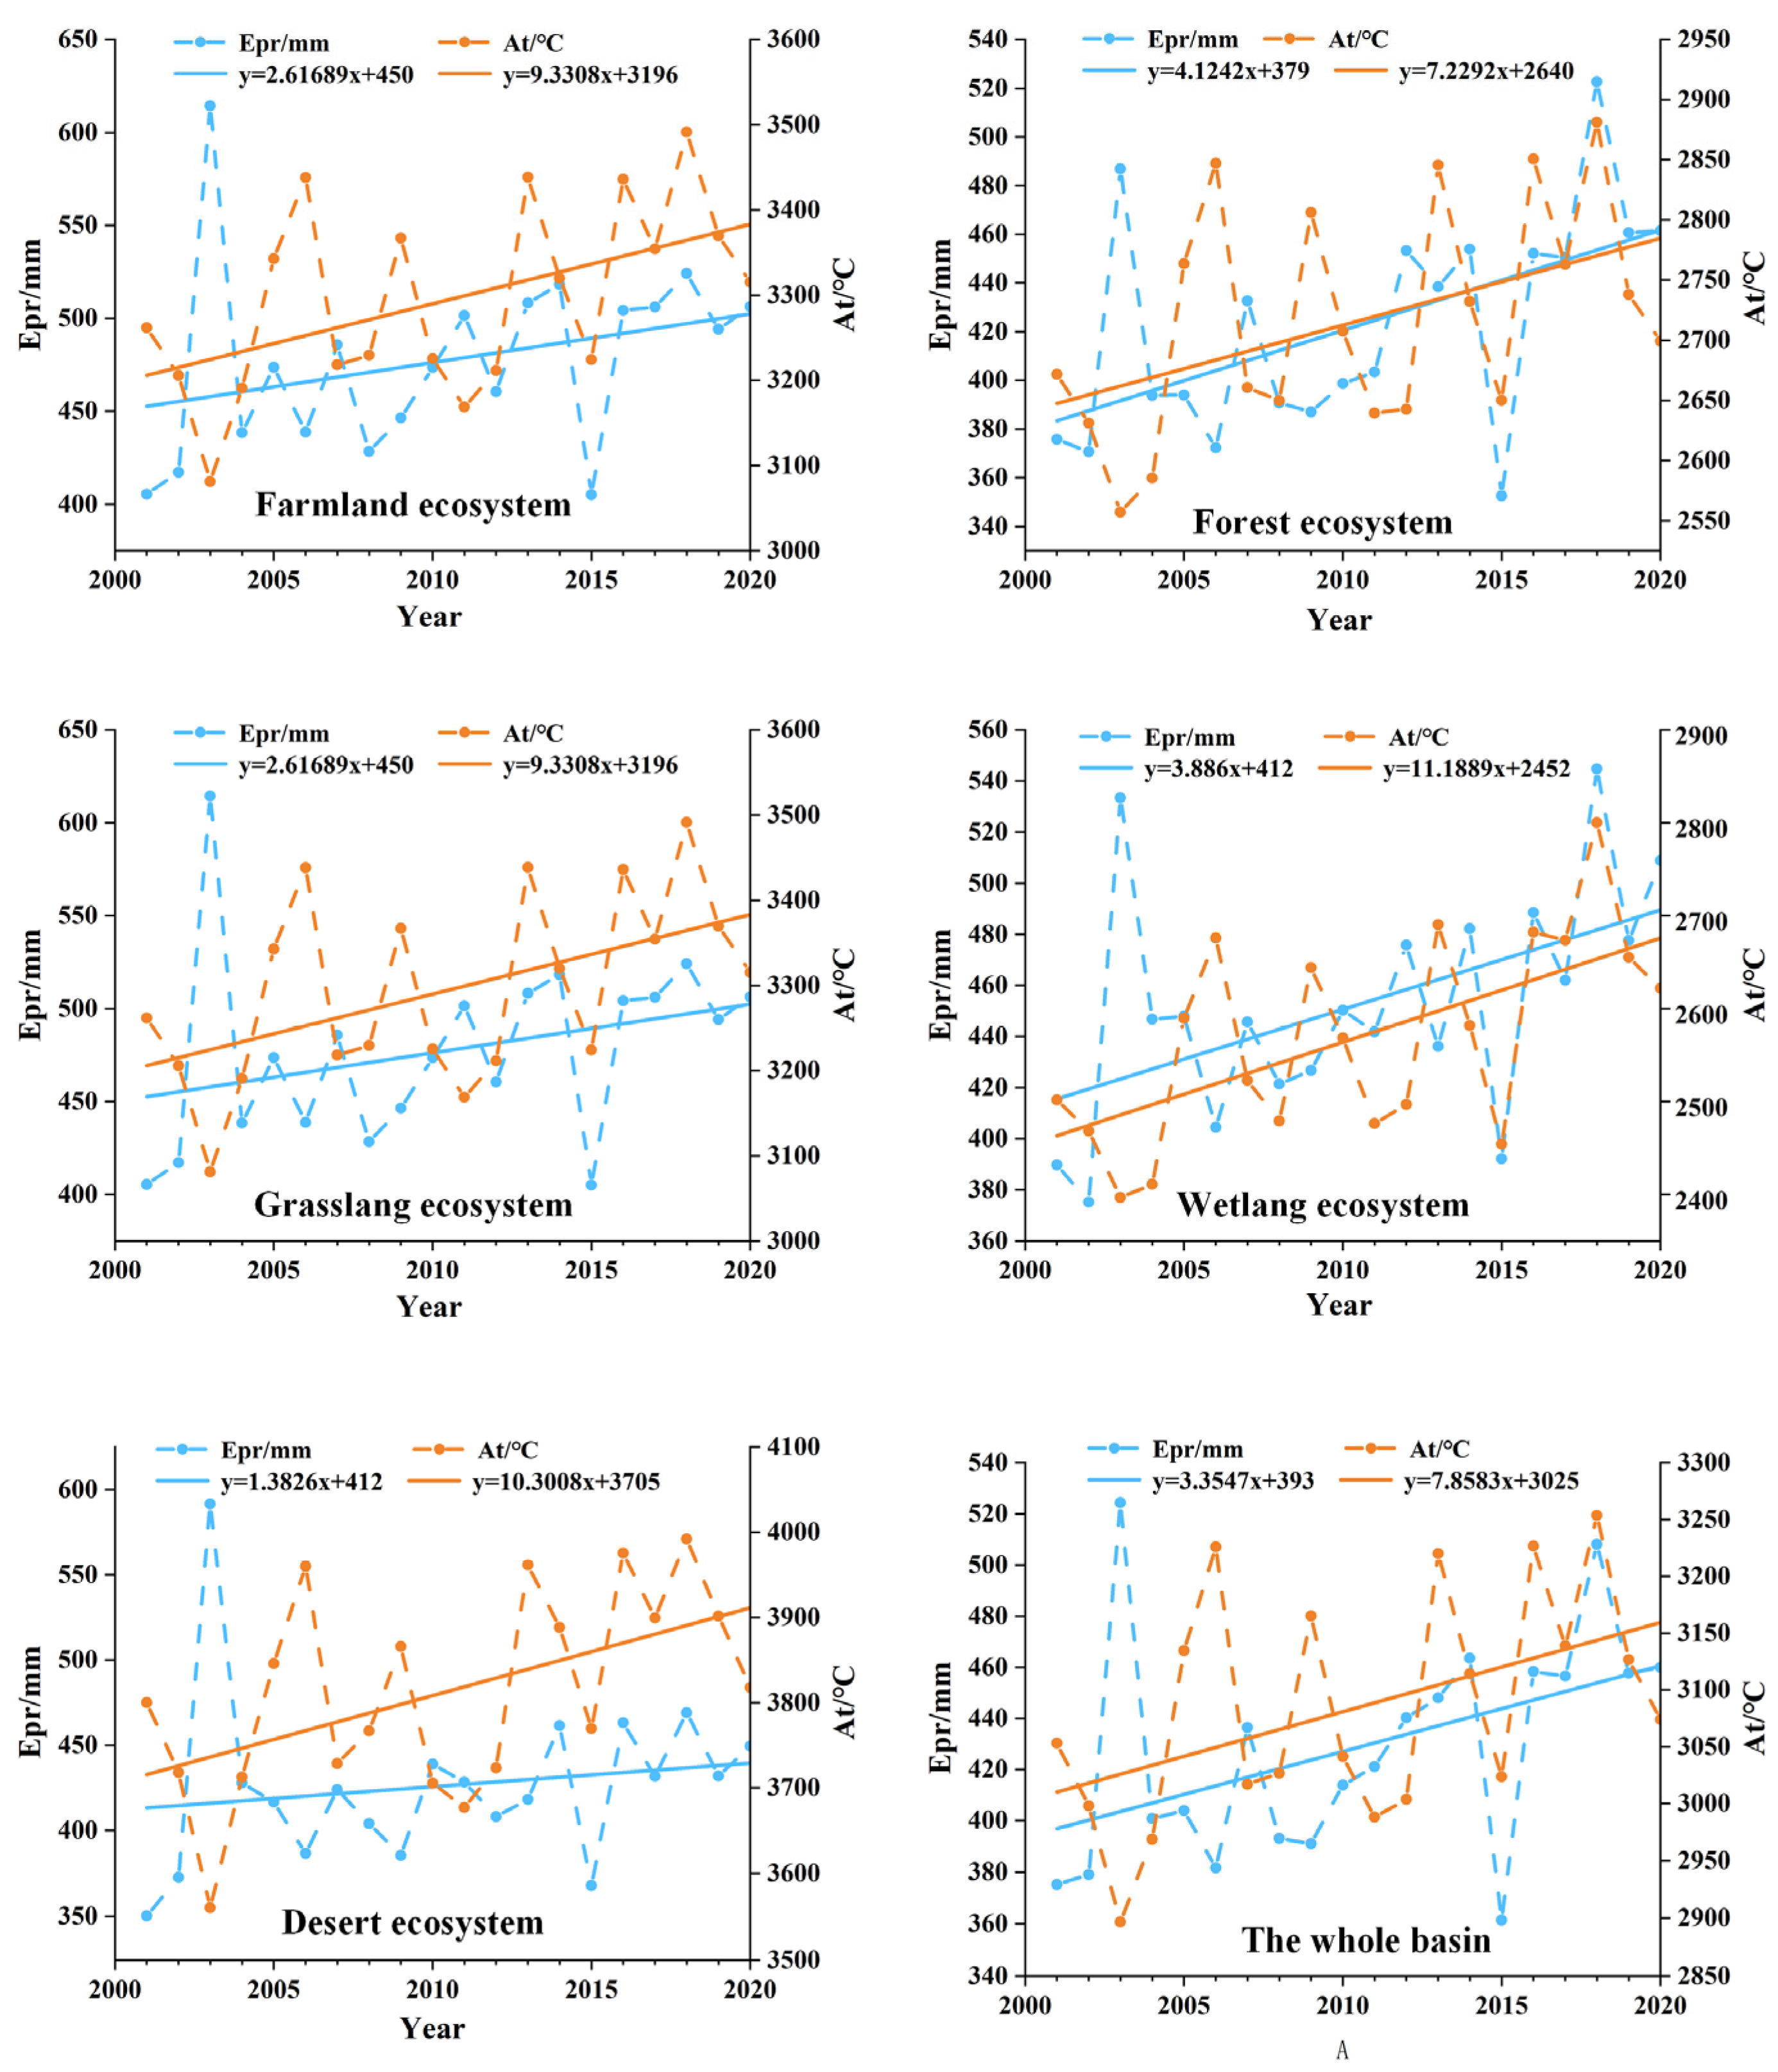
As shown in Figure 8, the Epr of both the YRB and each ecosystem has increased over the past 20 years. The rate of increase in the Epr was 3.35 mm/yr, with the rates of change in different ecosystems as follows: grassland (4.12 mm/yr) > water bodies and wetland (3.89 mm/yr) > forest (2.62 mm/yr) > farmland (2.49 mm/yr) > desert (1.38 mm/yr). The Epr growth rate of grassland, and water bodies and wetland ecosystems was greater than that of the whole basin, while the growth rate of the forest, farmland, and desert ecosystems was less than that of the whole basin. Among them, the Epr in the YRB sharply increased in 2003 and 2006. These could have been mainly affected by meteorological changes, such as atmospheric circulation and tropical cyclone activity. In 2016, the Epr increased compared with previous years, occurring mostly during the flood season. In June, influenced by the low-pressure trough from northeast China to Chongqing, the precipitation in the central-eastern part of the YRB was higher than normal. In July, influenced by the short-wave trough of the westerly wind belt and the northwest Pacific high, the overall precipitation in the YRB was high. In August, the southern part of the basin was controlled by continental high pressure, while the subtropical high pressure was weak, the westward extension of the ridge point shifted eastward, and more precipitation occurred in the north with lower amounts in the south [11,55,56].
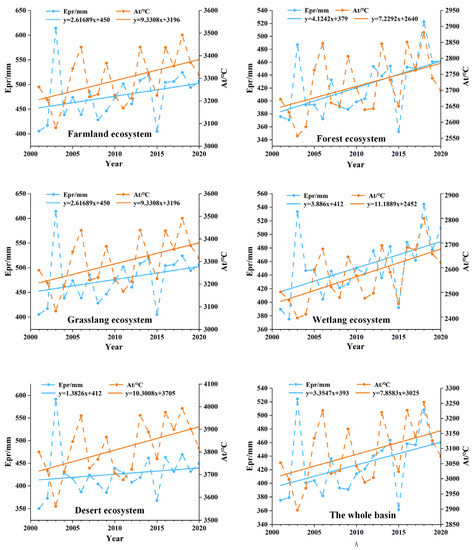
Figure 8.
Interannual variation of annual Epr (effective precipitation) and At (accumulated temperature) in different ecosystems.
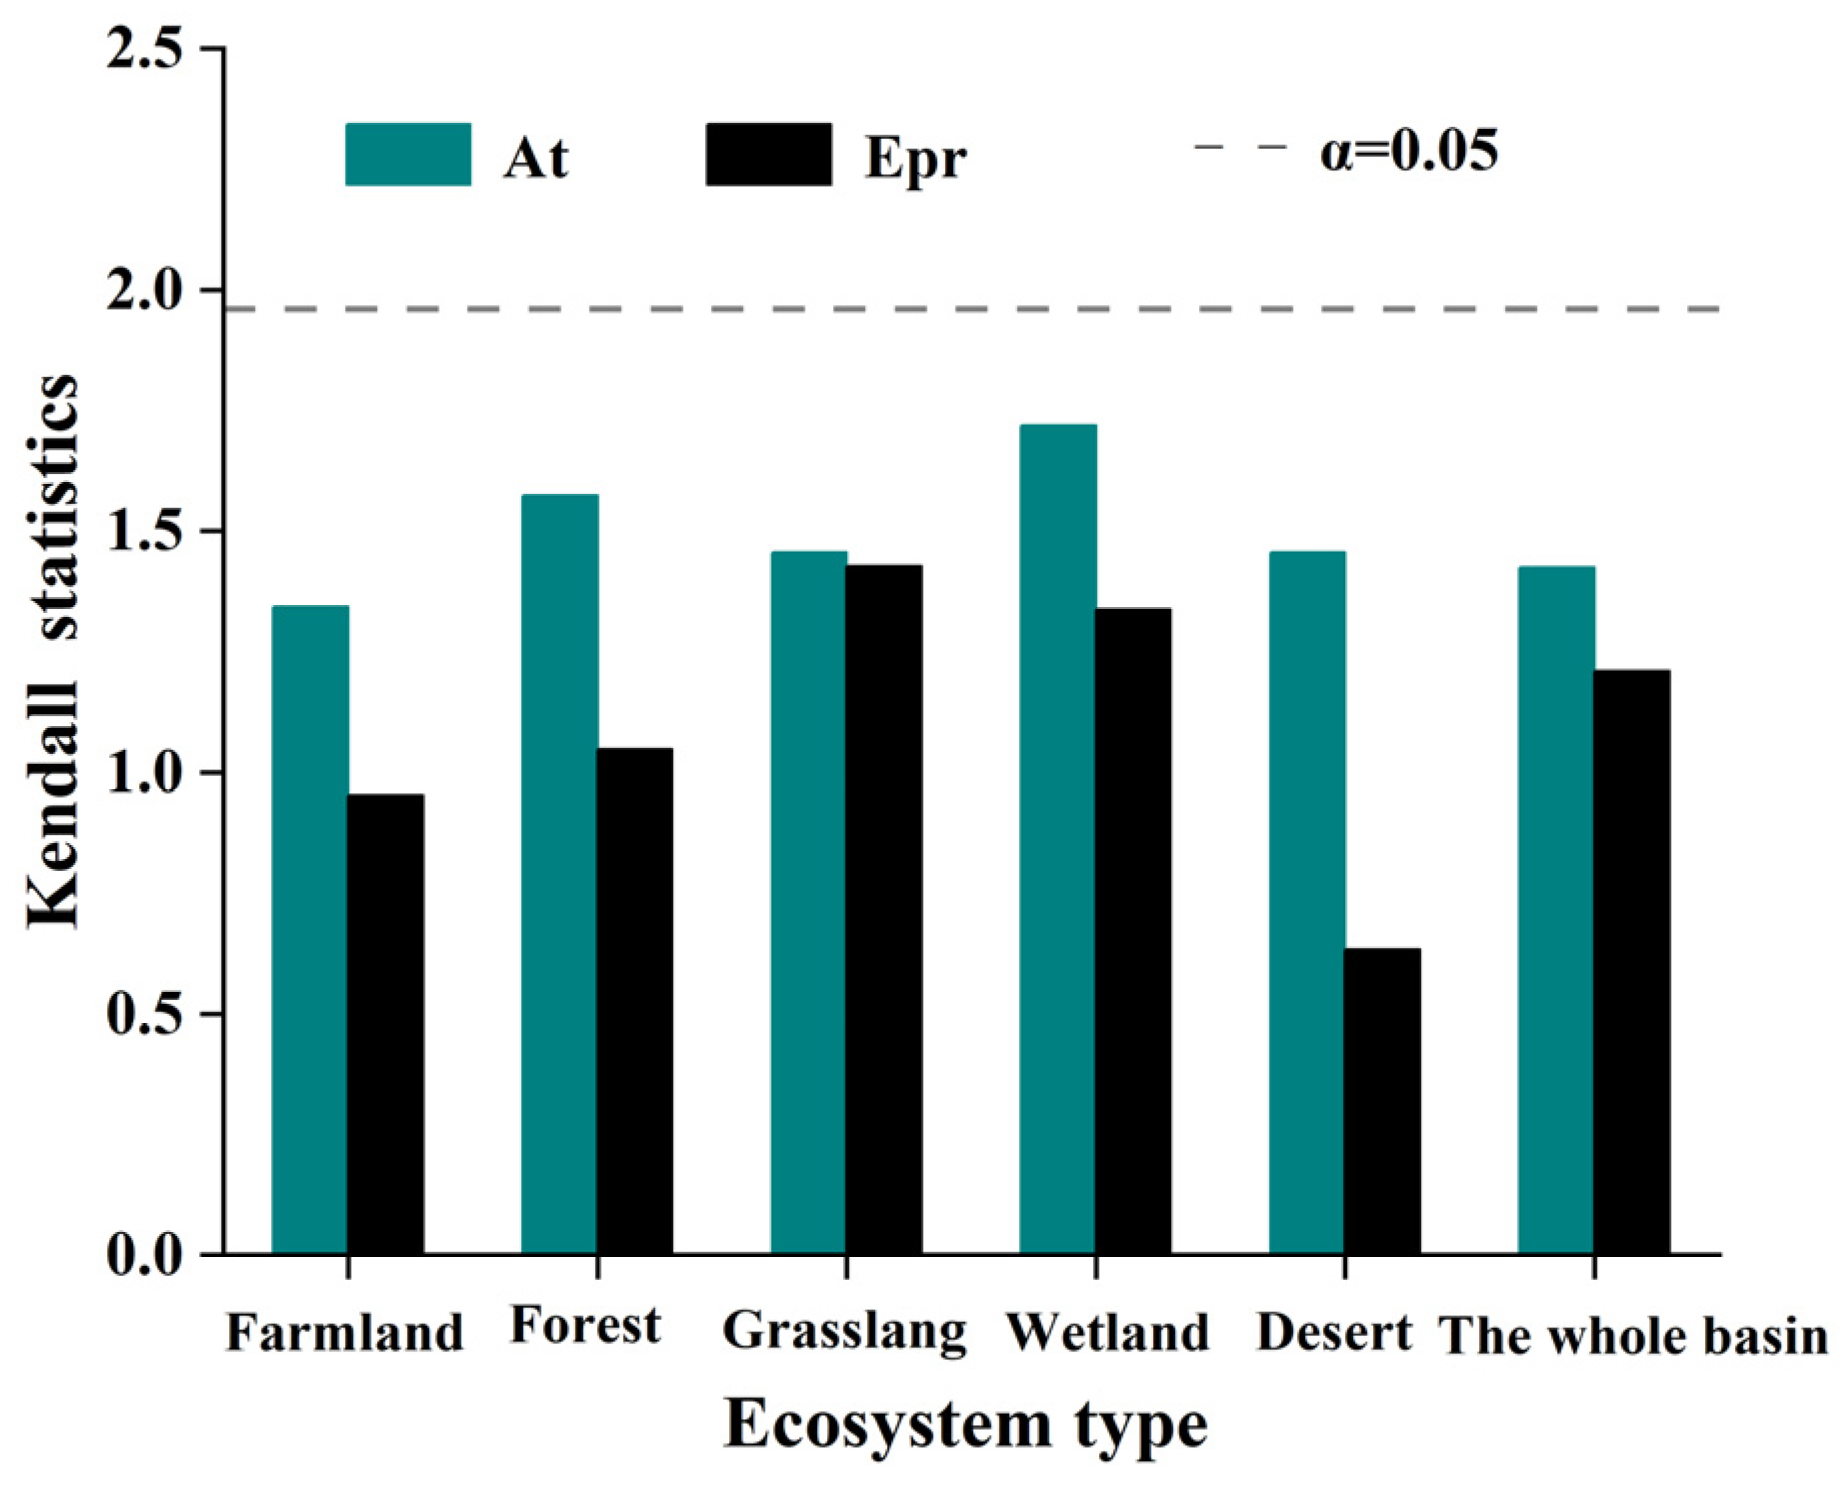
As shown in Figure 8, the multiyear At in the YRB increased at the rate of 7.86 °C/yr, with the increases of various ecosystems as follows: water bodies and wetland (11.12 °C/yr) > desert (10.30 °C/yr) > forest (9.33 °C/yr) >farmland (8.25 °C/yr) > grassland (7.23 °C/yr). The At increase in the water bodies and wetland, and desert ecosystems was greater than that of the entire basin, while the changes in the forest, farmland, and grassland ecosystems were smaller than that of the entire basin. The Kendall test indicated (Figure 9) that the hydrothermal conditions of the major terrestrial ecosystems in the YRB did not significantly vary.
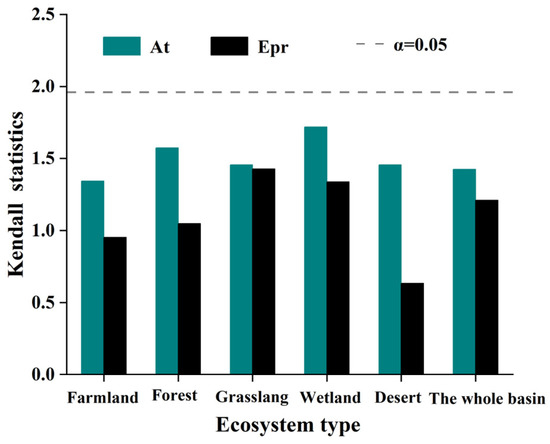
Figure 9.
Significance test of annual Epr (effective precipitation) and annual At (accumulated temperature) trends in different ecosystems.
The growth rates of EVI, Epr, and At indicated some differences. The annual Epr and At growth rates of farmland and forest ecosystems were smaller than those of the grassland, and water bodies and wetland ecosystems. However, the interannual EVI growth rates of the farmland and forest ecosystems were the highest of all the ecosystem types. This is because, although the growth rates of the Epr and At of the grassland, and water bodies and wetland ecosystems were large, the base was small, and the overall level was lower than that of farmland and forest ecosystems, especially the At [37,57]. The annual At of the farmland and forest ecosystems was greater than 3000 °C on average, while that of the grassland, and water bodies and wetland ecosystems were below 3000 °C. In addition, although the growth rates of the Epr and At for the forest ecosystems were higher than those of the farmland ecosystems, the EVI growth rate in farmland ecosystems was higher than that of forest ecosystems because, in addition to precipitation, farmland fields were also irrigated and fertilized [58,59].
3.2.2. Spatial Patterns of Epr and At
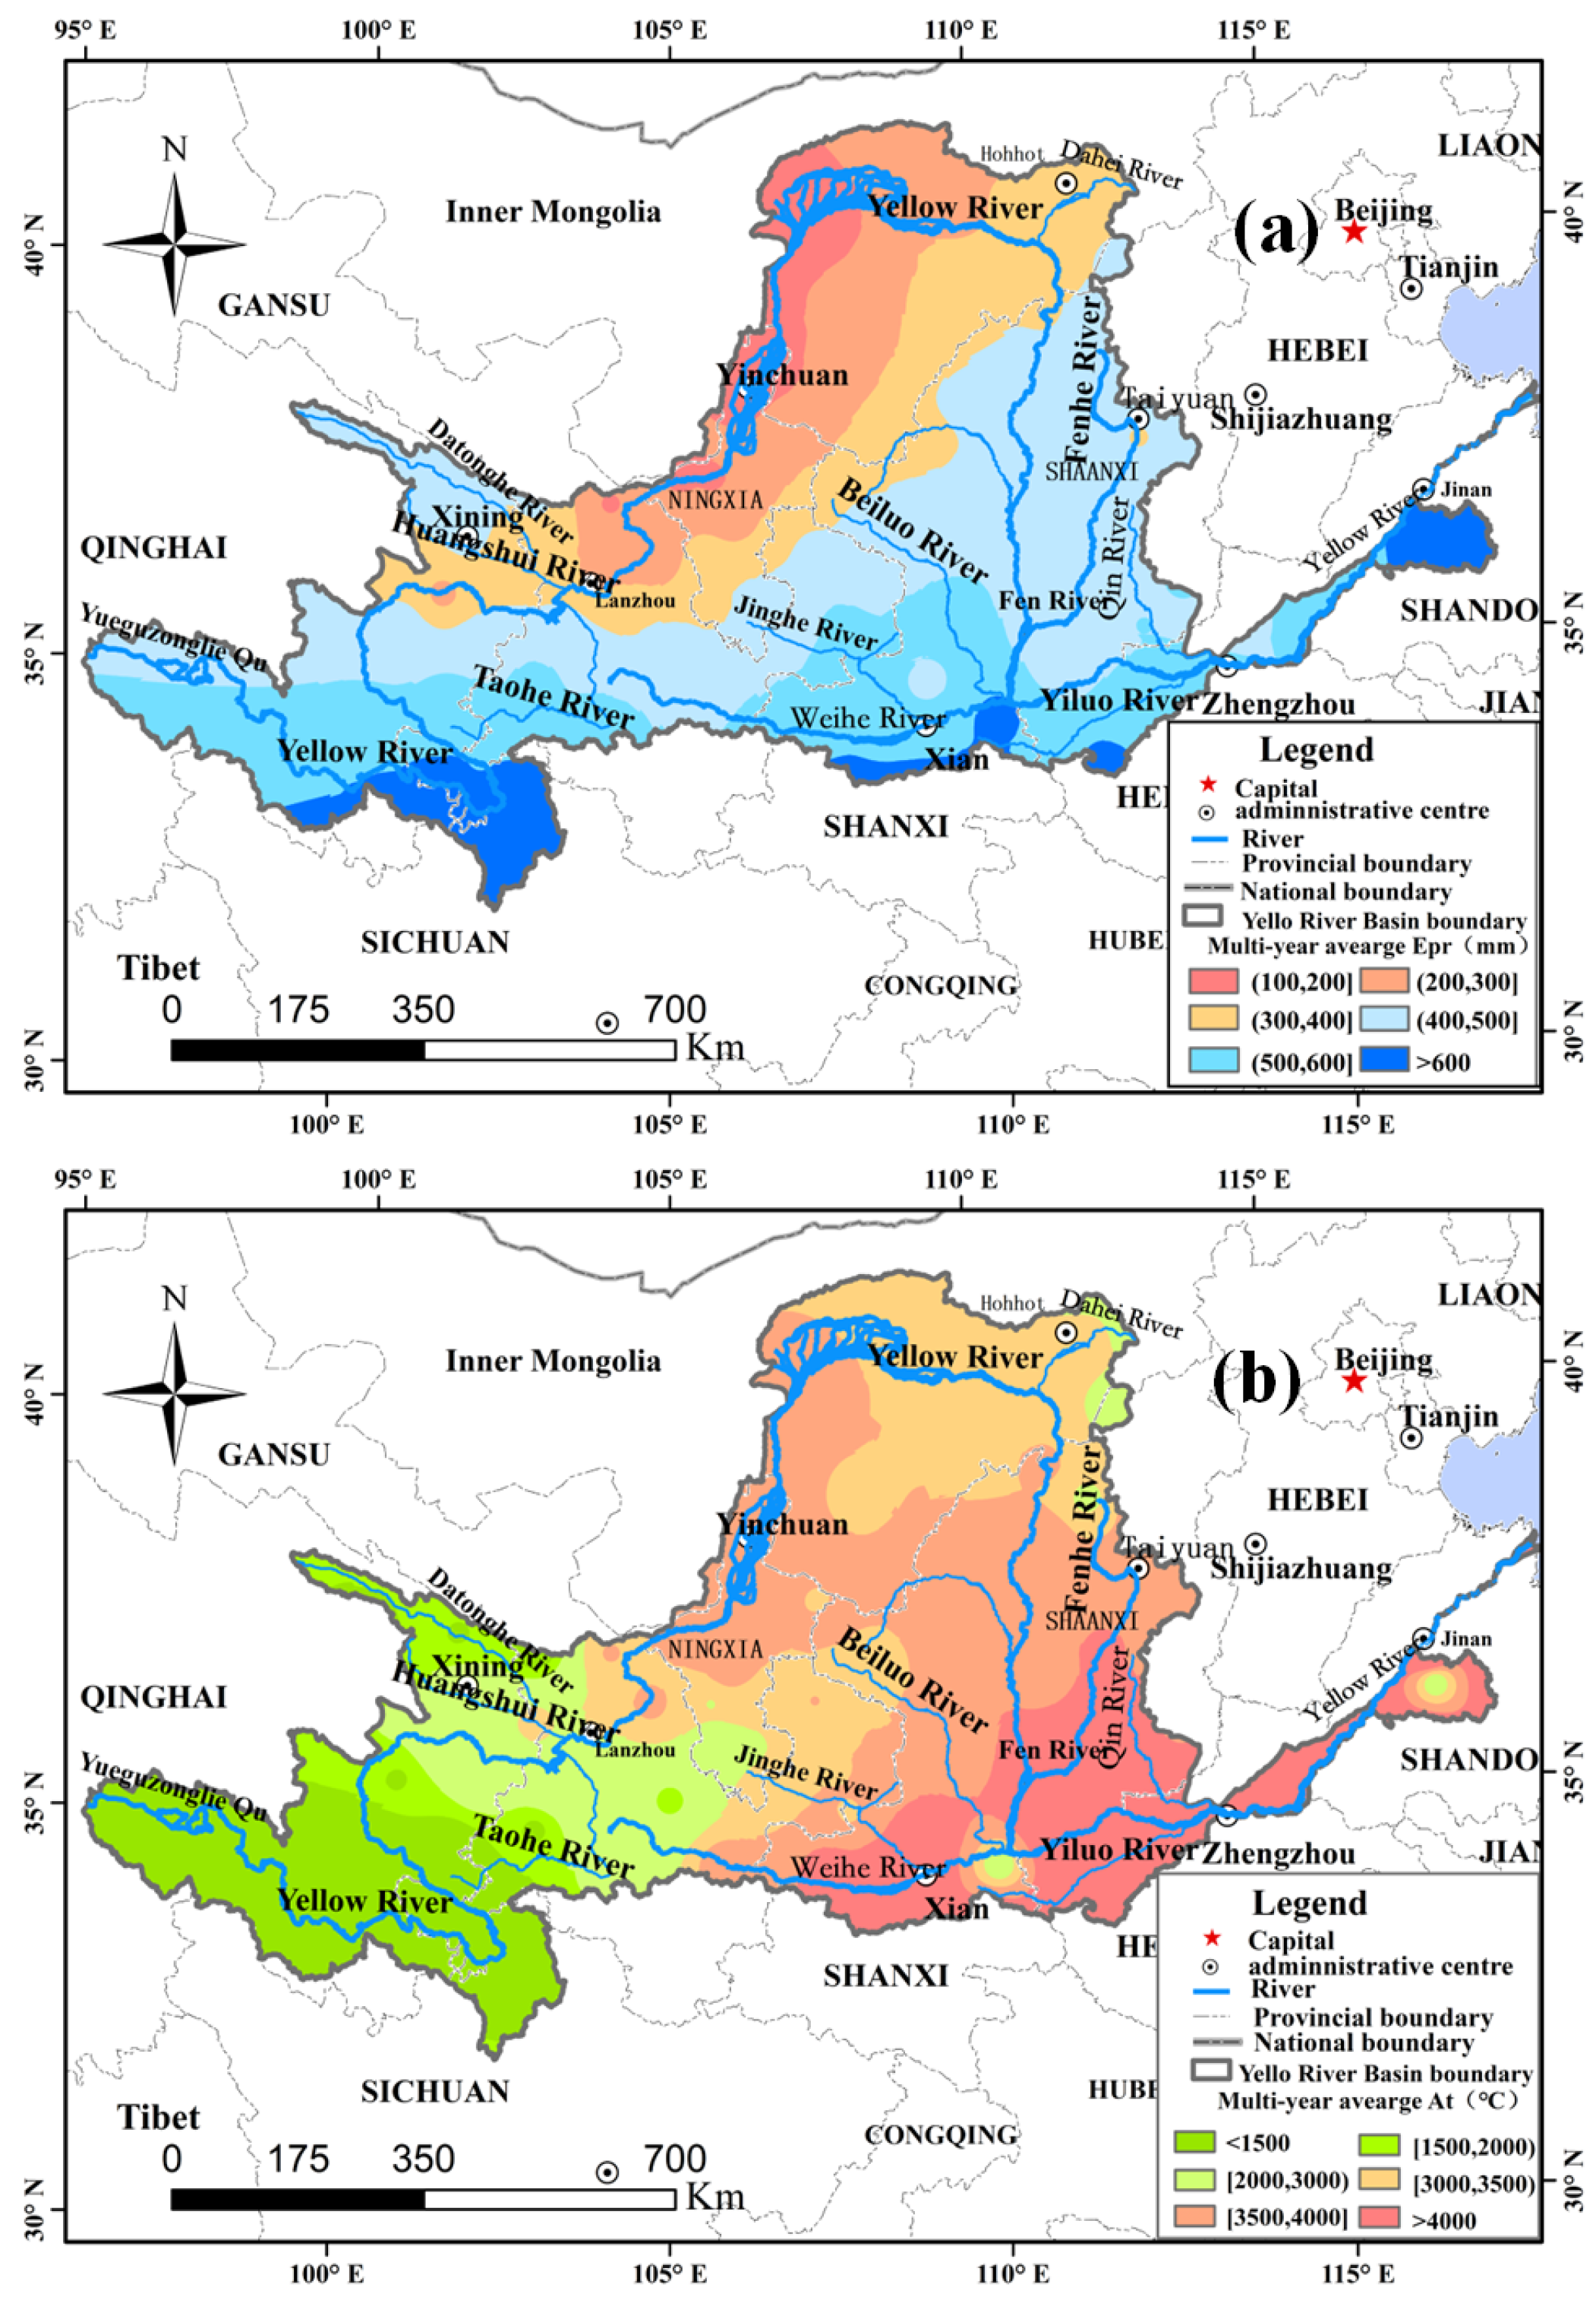
During the period of 2001–2020, the multiyear average Epr and average At of the YRB were 428.70 mm and 3084.78 °C, respectively.
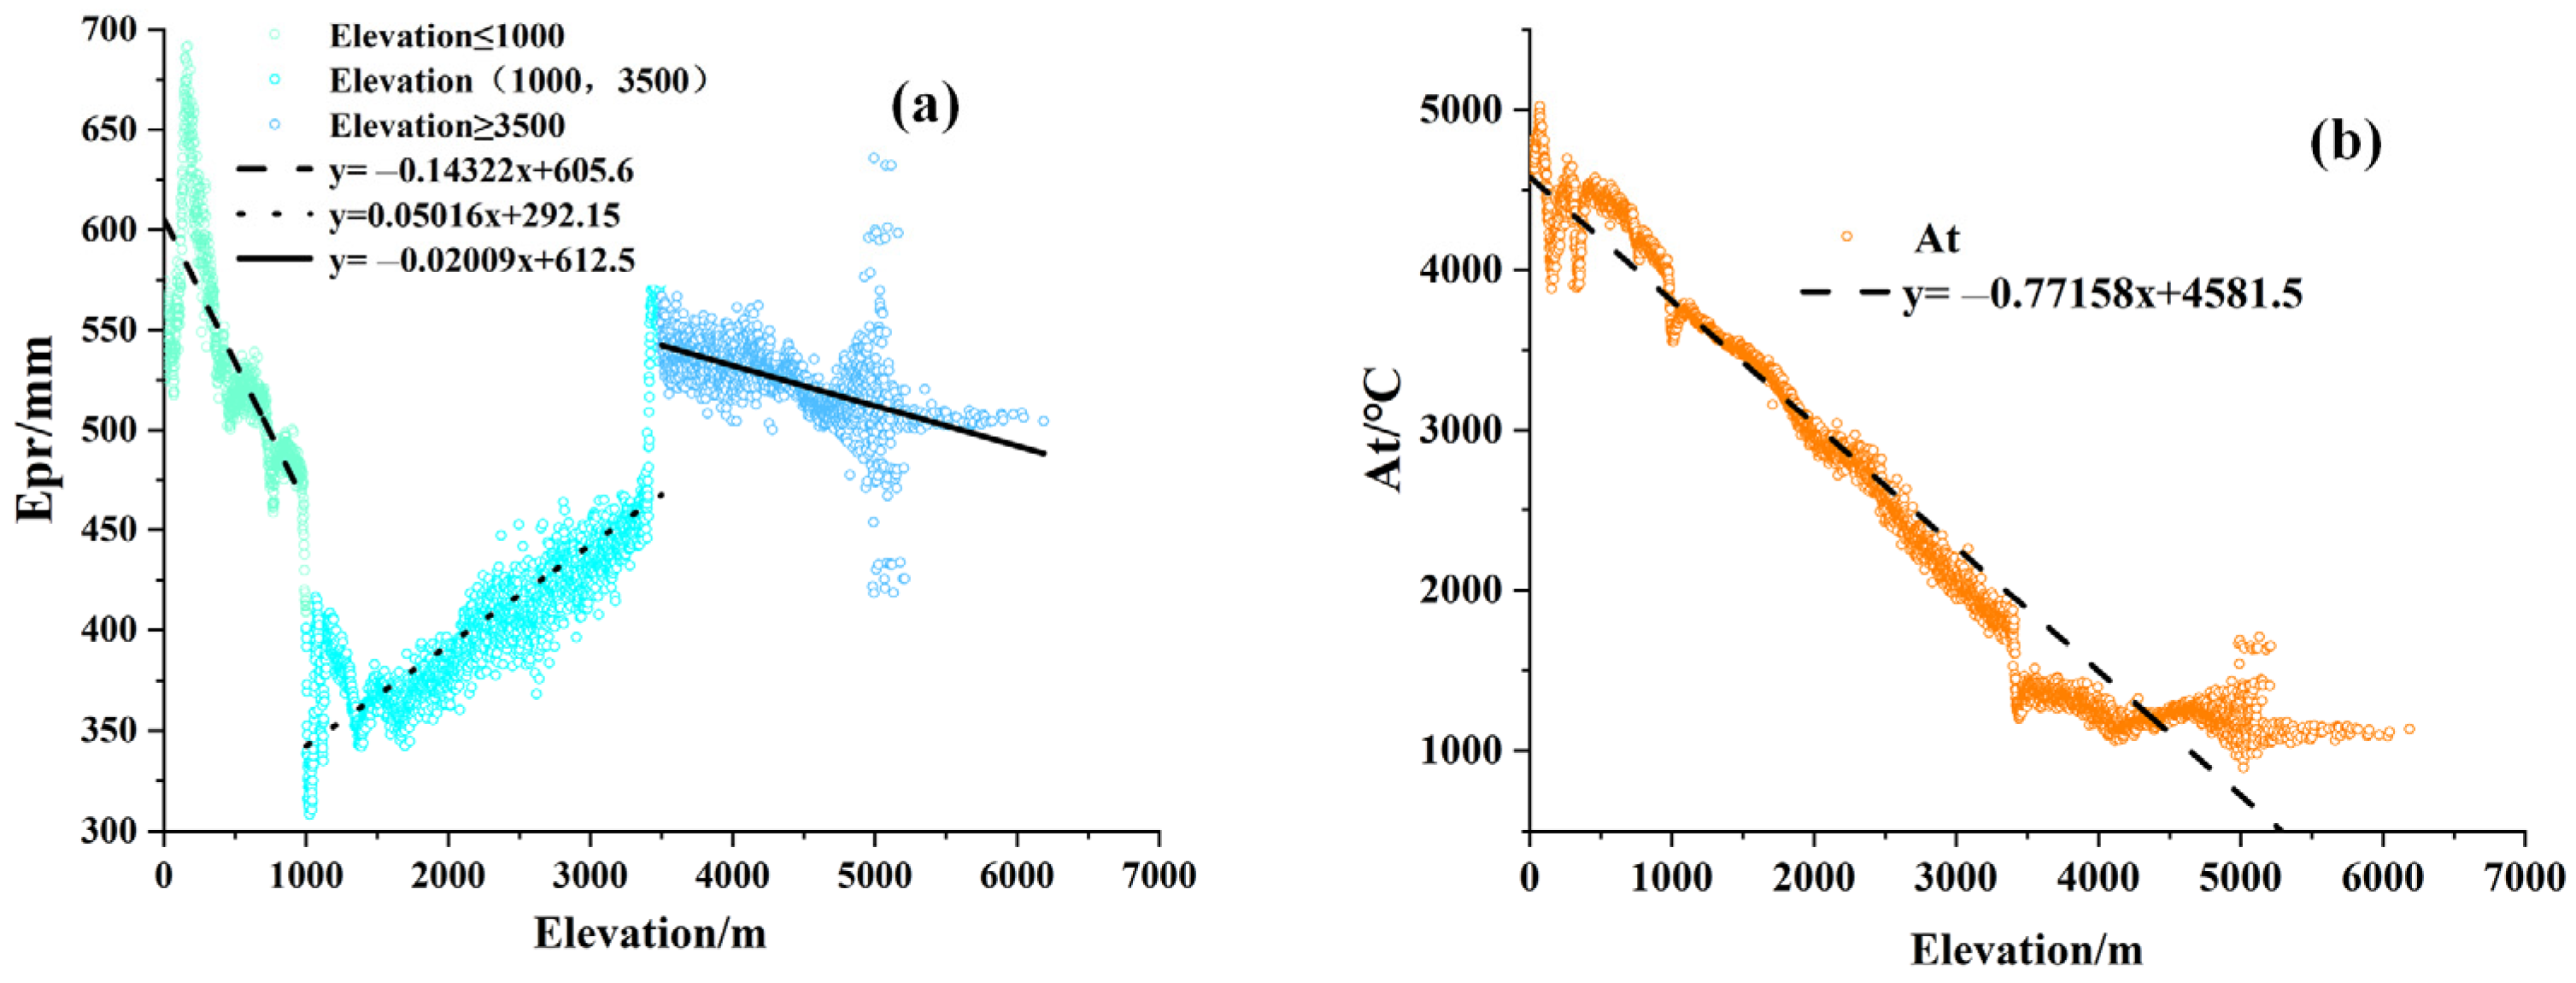
As demonstrated in Figure 10a, the multiyear average Epr increased from the northwest to the southeast. The regions with Epr above 600 mm were mainly located in the northern Sichuan province, southern Xi’an City, northwestern Henan province, and southern Jinan City in the Shandong province. From Figure 11a, the mean value of the multiyear Epr in the YRB exhibited a decreasing–increasing–decreasing trend with various elevations. In the areas below 1000 m above sea level in the YRB, the average Epr significantly decreased with elevation increasing by approximately 14.3 mm per 100 m increase in elevation. In the area between 1000 and 3500 m, the precipitation gradually increased by approximately 5 mm for every 100 m increase in elevation. In the area above 3500 m, the precipitation increased with increasing elevation. The reason for the two distinct dividing points between 1000 m and 3500 m in the Epr is probably because the area below 1000 m in elevation in the YRB is located predominantly in the central and eastern parts of the basin and is further inland with higher elevation. Further inland, the water vapor is blocked, resulting in less rainfall [60,61]. When the altitude is between 1000 m and 3500 m, the air rises owing to the high terrain and readily condenses into rain [62,63]. In addition, the temperature decreases as the altitude rises, and evaporation decreases, resulting in higher Epr. Therefore, the precipitation increases with the increase in elevation [64,65]. When the altitude reaches 3500 m, the precipitation decreases as the altitude continues to rise because the altitude is too high. The water vapor in the air decreases due to the large amount of precipitation after reaching a certain altitude. At the same time, the effect of rainfall reduction by evaporation on the total rainfall is very slight because the temperature is too low. Therefore, the precipitation decreased with the increase in elevation [66,67].

Figure 10.
Multiyear average Epr (effective precipitation, (a)) and multiyear average At (accumulated temperature, (b)) in the YRB from 2001 to 2020.

Figure 11.
Spatial mean values of annual Epr (effective precipitation, (a)) and annual At (accumulated temperature, (b)) at different elevations.
As shown in Figure 10b, the multiyear average At in the YRB gradually increases from west to east, decreasing with elevation increasing by the approximate linear trend in Figure 11b. The multiyear average At decreases by approximately 77 °C for every 100 m with elevation increasing. When the altitude exceeds 4000 m, elevation increases and the speed of At decreasing becomes slower. The annual At is the sum of the daily average temperature during which the temperature ≥10 °C [66,67,68]. Usually, in highland mountainous areas (at roughly the same latitude), the relationship between temperature and altitude is that the higher the altitude, the lower the temperature. This is because at high altitudes, the air pressure is low, the air is thin, and the atmosphere is poorly insulated. This leads to a large amount of heat dissipation and lower temperatures; for every 1000 m of elevation rise, the temperature drops 6 °C. The At is the sum of all values of the daily average temperature ≥10 °C for 365 days of the year. Therefore, the At also decreases with increasing altitude.
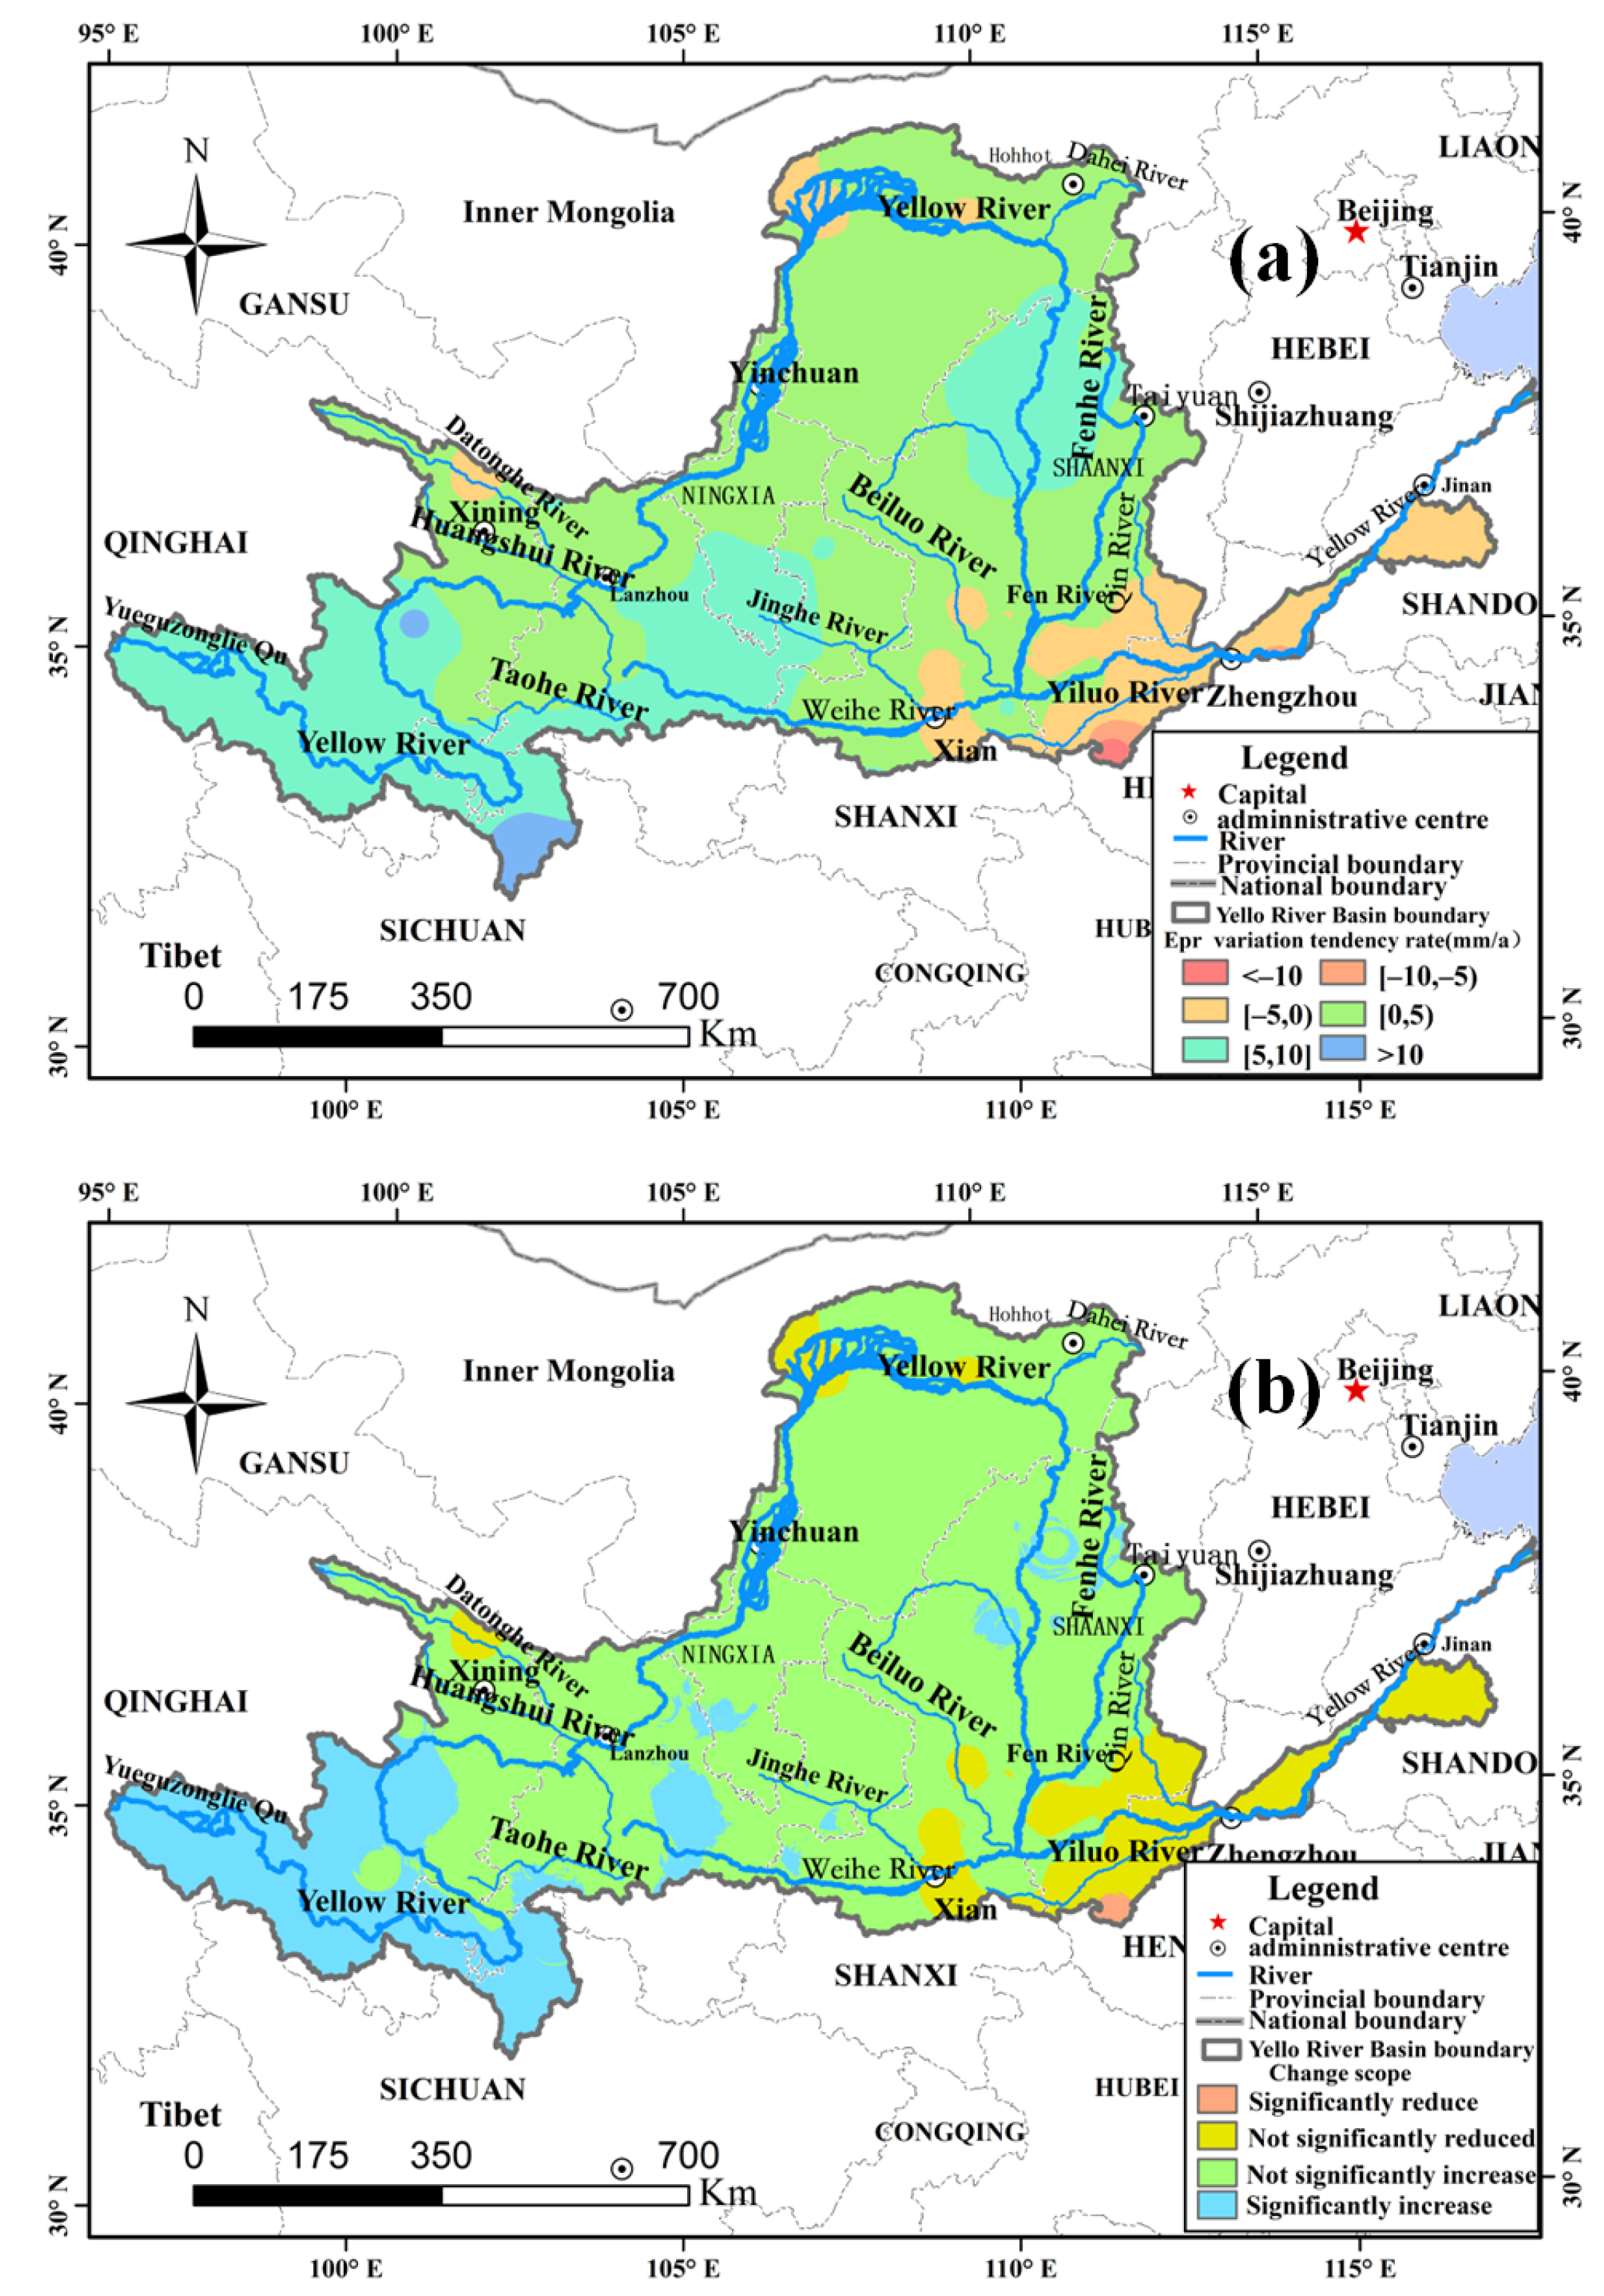
An analysis of the trends of Epr and At in the YRB over the past 20 years (Figure 12) indicates that the spatial variability of the Epr changes was substantial, with 12% of regions experiencing a decrease and 88% experiencing an increase. The areas with a decrease were concentrated in the middle reaches of the Inner Mongolia Autonomous Region, the Weihe River basin, and the lower reaches of the Yellow River. Those with an increase were predominantly concentrated in the Yellow River source area of Qinghai province, the Ningxia Plain, the central part of Gansu Inner Mongolia Plateau, Loess Plateau, Guanzhong region, and the central and western regions of the Shanxi province (Figure 12a). According to the significance (p < 0.05) analysis, the Epr in the YRB was mostly increasing but not significantly. Less than 20% of the area exhibited a significant change (p < 0.05) (Figure 12b), mostly with a significant increase, predominantly located in the upper reaches of the Yellow River in the Qinghai province and parts of the Sichuan province.

Figure 12.
Trends (a) and significance level ((b), p < 0.05) in Epr (effective precipitation) in the YRB, 2001–2020.
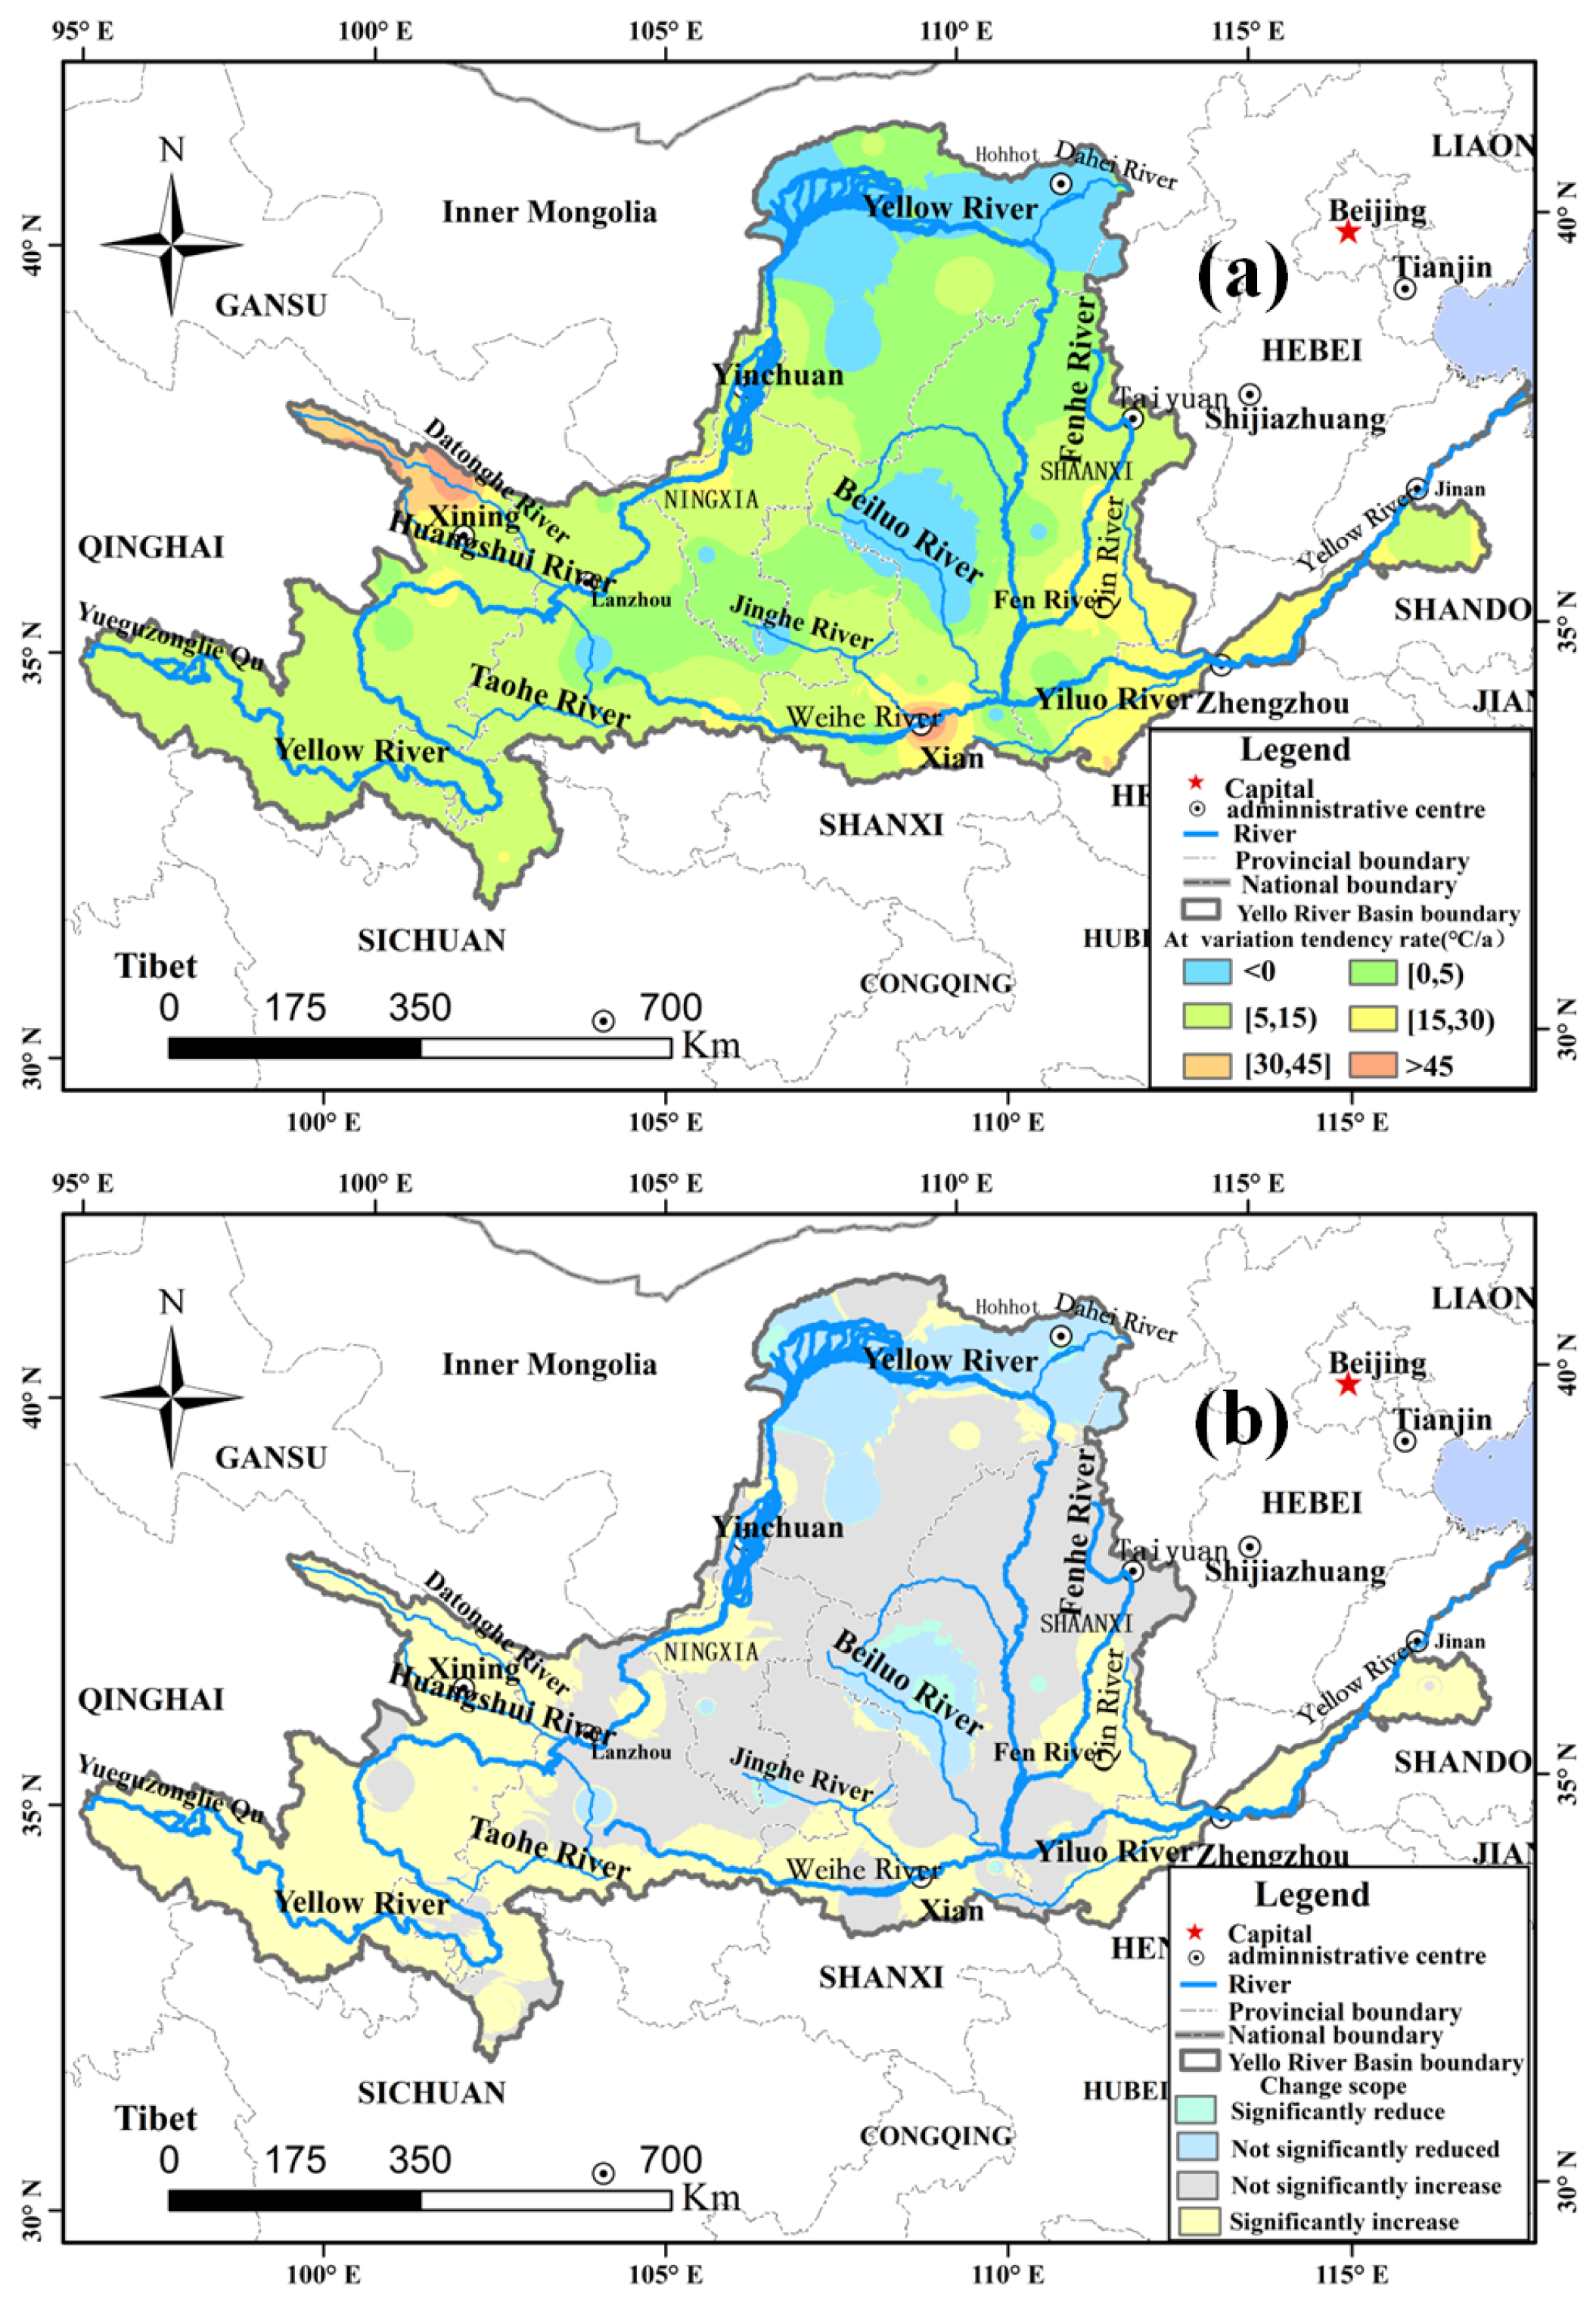
Except for the Inner Mongolia Plateau and parts of the Guanzhong Plain, the At increased in most of the basin, accounting for approximately 87% of the total area, while the area with a decrease accounted for only 13% (Figure 13a). The area of the basin with a significant (p < 0.05) increase in the At was 41% (Figure 13b). It is mainly in the Qinghai–Tibet Plateau and the Yellow–Huaihai Plain, the areas along the banks of the Yellow River in Ningxia and the Qinling area in the south of the basin on both sides of the Weihe River.

Figure 13.
Trends (a) and significance level ((b), p < 0.05) in At (accumulated temperature) in the YRB, 2001–2020.
Different regions in the YRB have different warming rates. The annual At and warming rate in the Loess Plateau and the eastern edge of the Qinghai–Tibet Plateau are significantly lower than those in the agricultural and livestock staggered zone of the Gansu province. These differences may be related to the increasing concentration of greenhouse gases [69,70]. It leads to the imbalance between the absorption and emission of energy in each region. The rising trend of CO2, CH4, and other greenhouse gases is directly proportional to the change in temperature, and the warming of the climate promotes the promotion of multicrops and the improvement of forest productivity but also increases the uncertainty of agricultural production.
3.3. Relationship between EVI and Hydrothermal Conditions
3.3.1. Variations EVI with Various Epr and At Zones
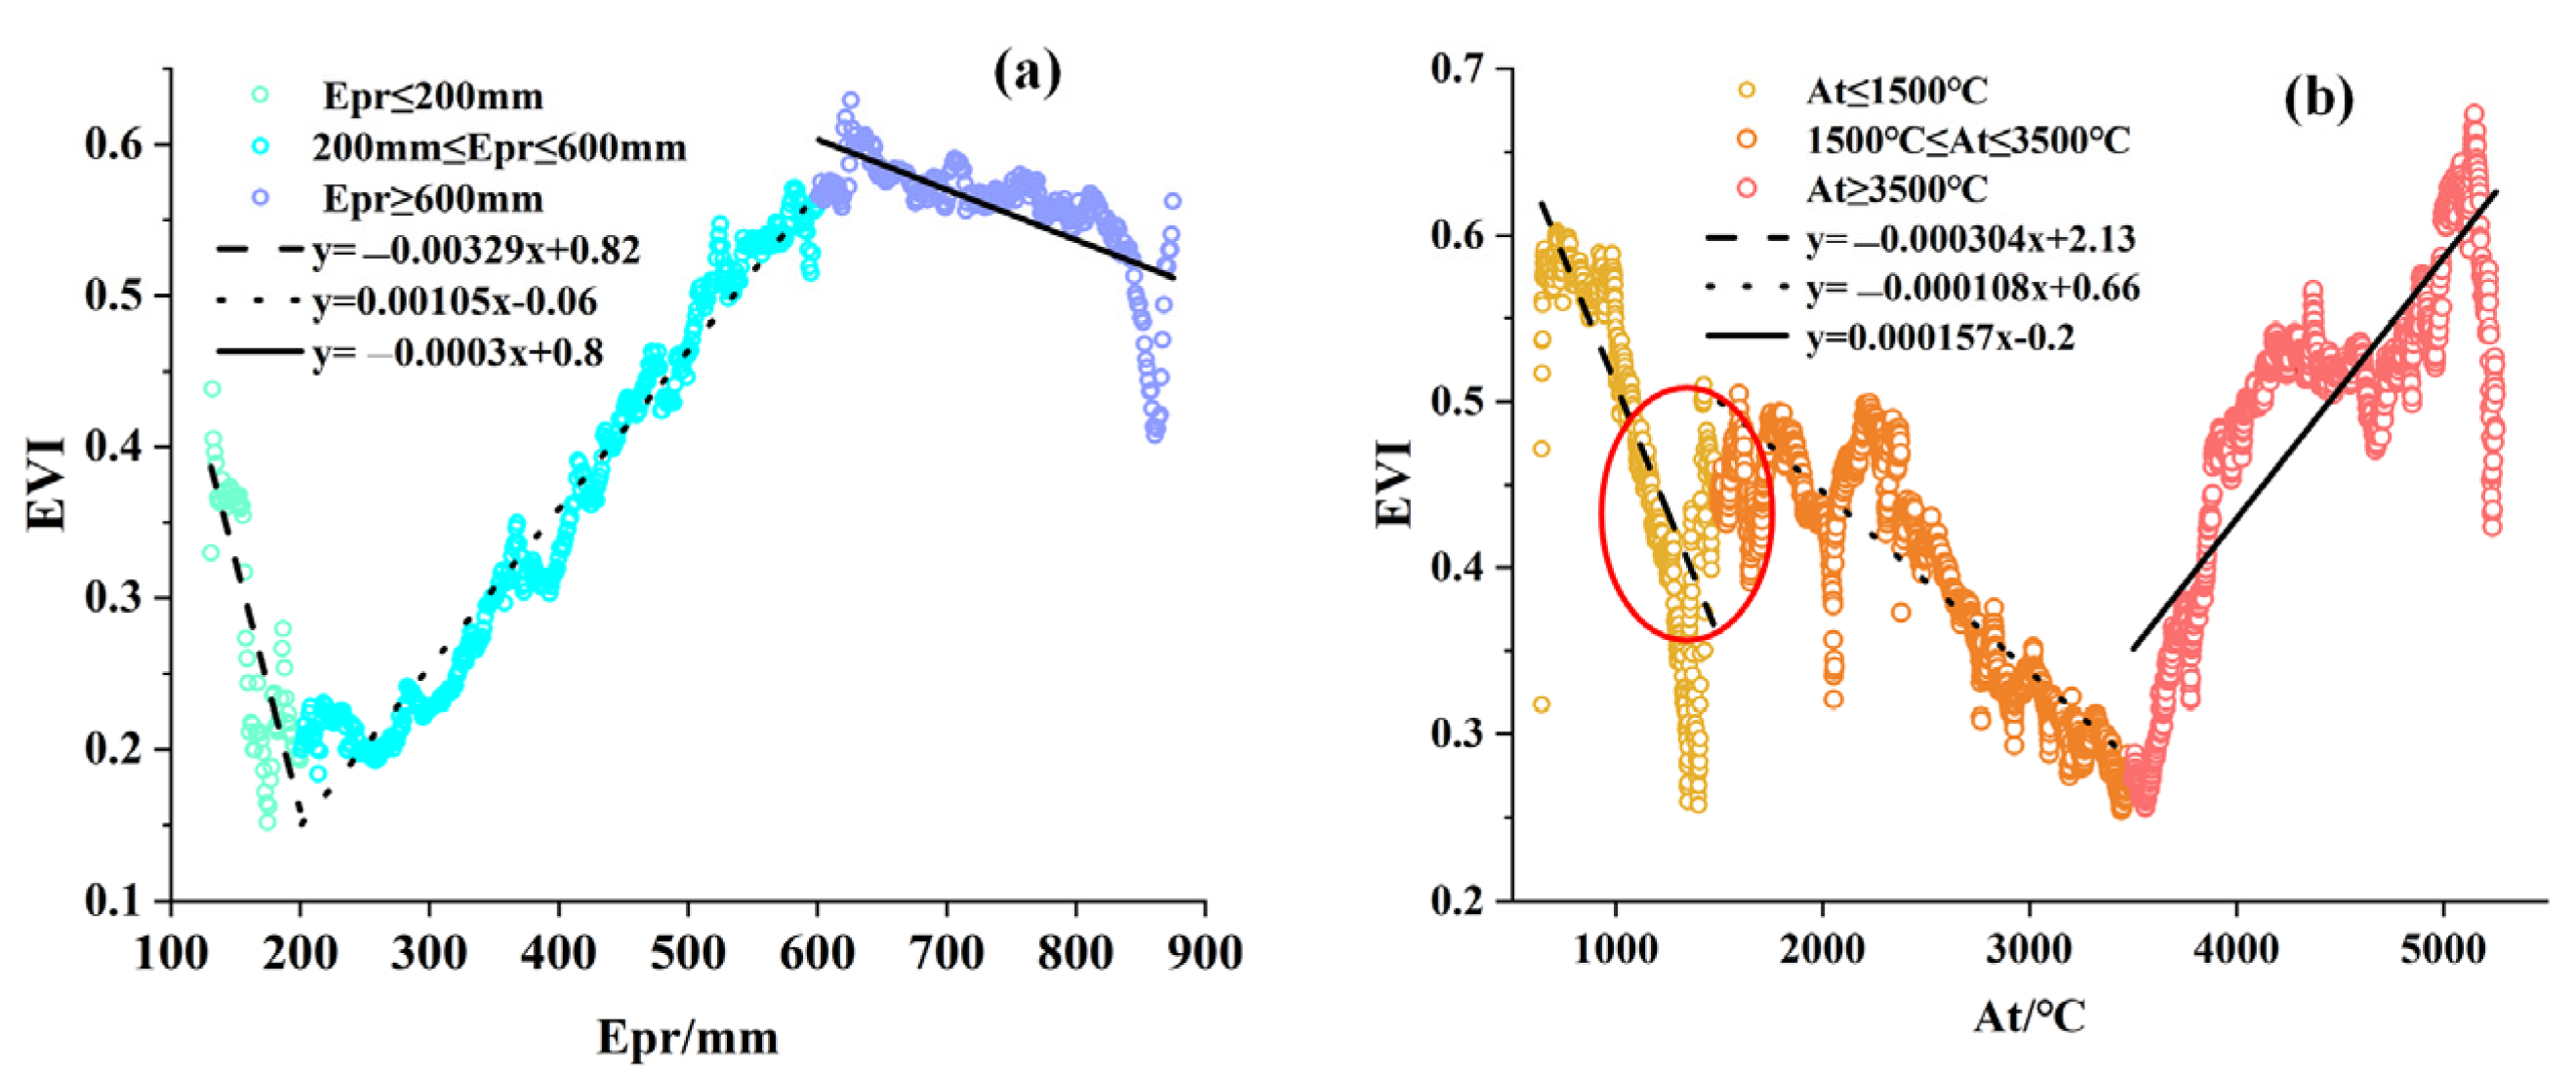
In the past 20 years, there has been a decreasing–increasing–decreasing relationship between the EVI and multiyear Epr in the YRB. As indicated in Figure 14a, when the Epr per year is less than 200 mm, the EVI in the basin decreases by approximately 0.33 per 100 mm with Epr increasing. Areas with an Epr of less than 200 mm are mainly located in the northwestern part of the basin. Most of these lands are unused and are saline lands. The evaporation intensity of saline soils is strong. The evaporation is much greater than the precipitation, thus inhibiting the growth of vegetation [71,72]. When the Epr is between 200 and 600 mm, the EVI increases approximately 0.1 per 100 mm with Epr increasing. When the Epr is greater than 600 mm, the EVI slowly decreases to about 0.03 per 100 mm with Epr increasing. As the surface slope of these areas is large, and the soil is very loose, it will lead to soil erosion and cause bare ground if there is too much rainfall, thus reducing the vegetation cover [73].

Figure 14.
Relationship between multiyear average Epr (effective precipitation, (a)) and At (accumulated temperature, (b)), and EVI in different Epr and At zones.
From Figure 14b, the trend and magnitude of the EVI varied in different At ranges. When the annual At was less than 1500 °C, the EVI significantly decreased with the increase in the At by 0.03 per 100 °C increase. When the annual At was between 1500 and 3500 °C, the EVI decreased relatively slowly with the increase in At by 0.01 per 100 °C increase. When the At was greater than 3500 °C, the EVI increased with the increase in At by 0.0157 per 100 °C. The areas with At below 3500 °C in the YRB are mainly located in the Qinghai–Tibet Plateau, Inner Mongolia Plateau, and Loess Plateau areas. These areas are semiarid. In the more arid natural environments, forest and grass vegetation cannot get enough water from the soil. Precipitation is the only source of soil moisture recharge in the region, and the team of vegetation growth and development of the region plays a vital role. Therefore, as At increases, evaporation increases and Epr decreases. This leads to the worse growth of vegetation.
As indicated by the location of the red circle in the Figure 14b, there is a significant abrupt change in the EVI where the At is approximately 1500 °C. Areas with At of less than 1500 °C are primarily located in the Gansu province, which was a fragile ecological environment. It was an important part of an ecological security barrier in China. In recent years, ecological projects, such as “returning farmland to forest and grass”, “three northern protective forests” and “natural forest protection” were implemented, and the vegetation was effectively restored [74]. This may lead the EVI value to significantly increase. The area with At greater than 3500 °C is mainly located in the eastern part of the basin in the Yellow and Huaihai Sea plains, where the effective rainfall is relatively high, and the hydrothermal conditions are relatively good. Therefore, the EVI values significantly increased with increasing At.
3.3.2. Correlations between EVI and Hydrothermal Conditions
The correlations between the EVI and hydrothermal conditions in the YRB are presented in Figure 15a, with more areas showing a positive correlation (accounting for 86%) and those with a negative correlation (accounting for only 14%). The significance (p < 0.05) level is presented in Figure 16a. It indicates that the areas with a significant positive correlation between the EVI and Epr are predominantly located at the beginning of the middle reaches of the Yellow River, including the Loess Plateau area in the central part of the basin as well as some areas in Inner Mongolia and the Taihang Mountains.
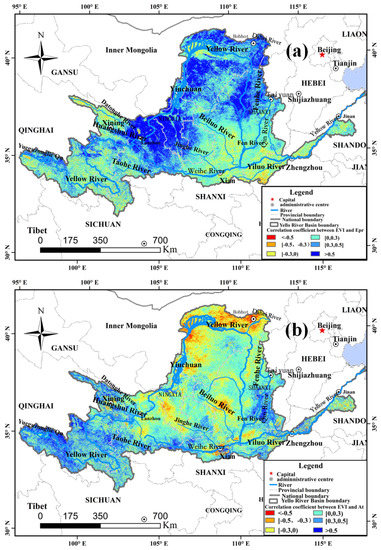
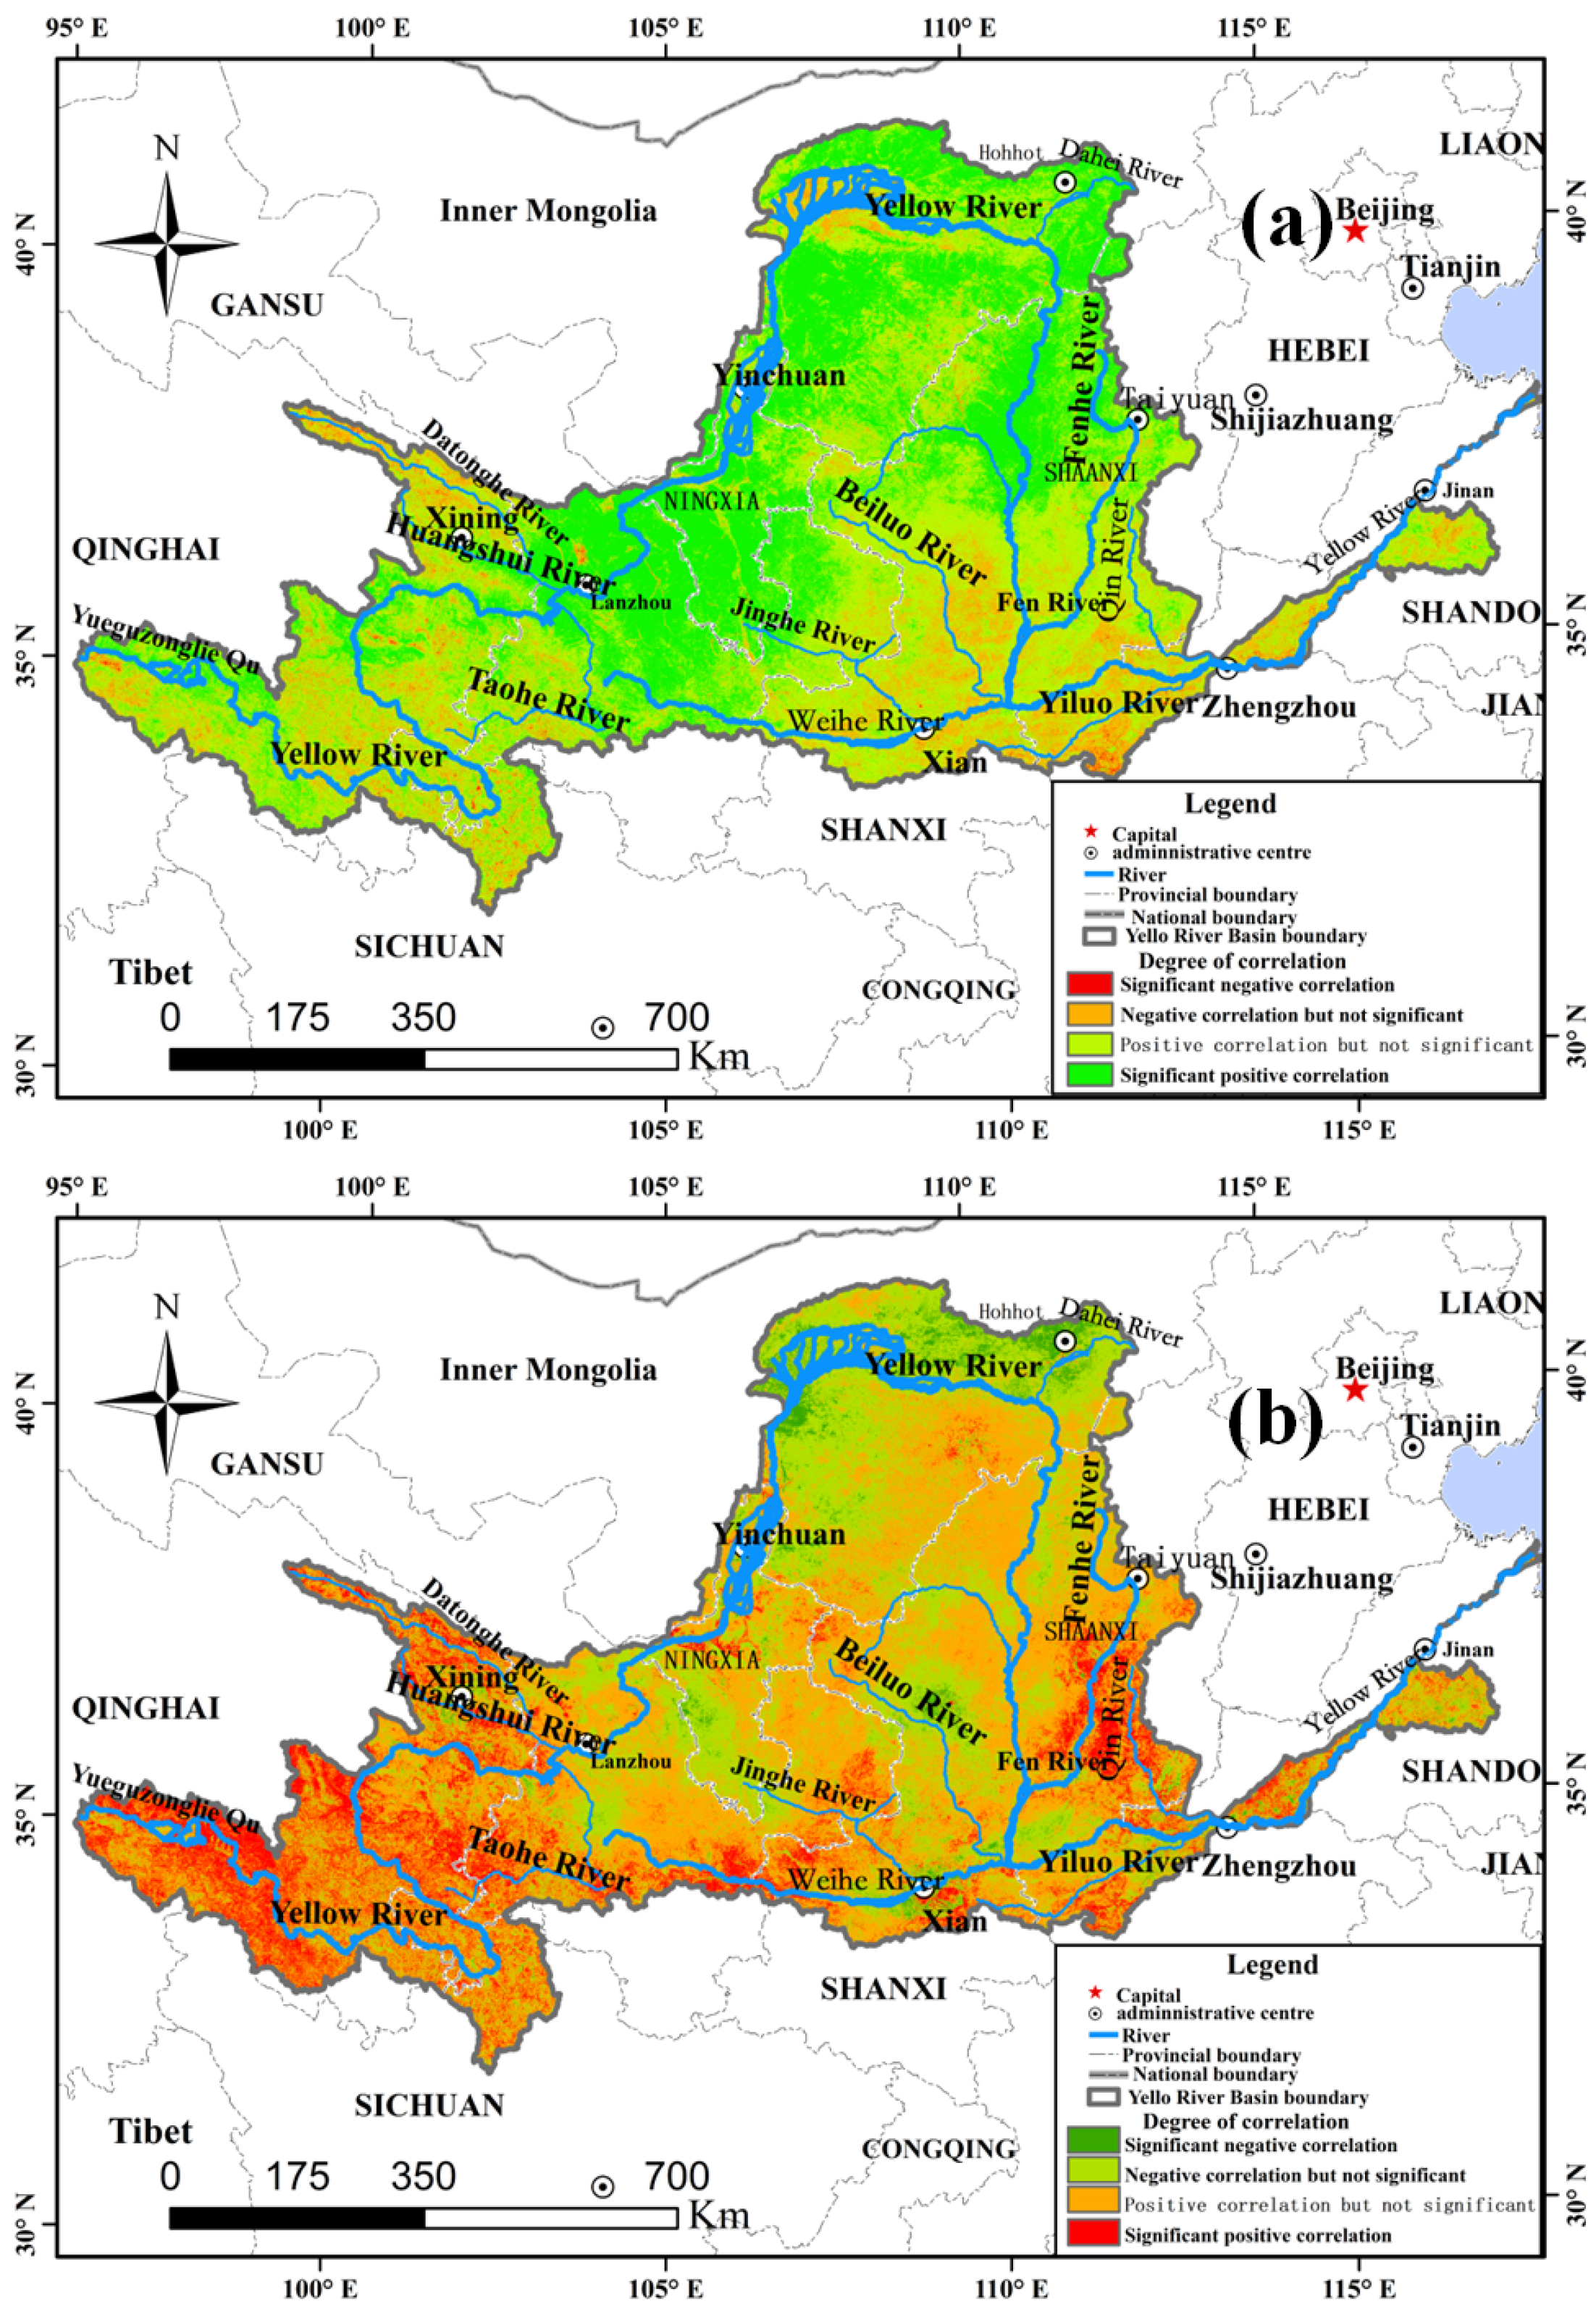
Figure 15.
Spatial distribution of correlation between EVI and Epr (effective precipitation, (a)) and AT (accumulated temperature, (b)).

Figure 16.
Correlation significance level (p < 0.05) of EVI with Epr (effective precipitation, (a)) and At (accumulated temperature, (b)).
As shown in Figure 15b, the correlation between the EVI and At in the YRB has distinct spatial variability, in which the positively correlated areas account for 66% and negatively correlated areas account for 34% of the total. The former is primarily located in the source and downstream areas of the Yellow River, and the latter is concentrated in the areas along both banks of the middle section of the Yellow River, the areas along both banks of the Tudao River, a tributary of the Yellow River, and some areas of the Loess Plateau. Among them, from the significance (p < 0.05) analysis, as shown in Figure 16b, the areas exhibiting a significant positive correlation between the EVI and At were predominantly located in the Tibetan Plateau area in the western part of the YRB, in the Taihang Mountains area, and in part of the Yellow and Huai Plain in the eastern part of the basin.
3.3.3. Different Thresholds of Epr and At in Different Ecosystems
Combining the relationships among the multiyear Epr, At, and EVI (Figure 14), the turning points of Epr and At changes were selected as the corresponding variable thresholds to classify different hydrothermal climate zones. The annual Epr thresholds of 200 mm and 600 mm and At thresholds of 1500 °C and 3500 °C were selected. Furthermore, different ecosystem types in the YRB were superimposed, and the statistical results of the various hydrothermal climate zones of the ecosystems in the YRB were obtained, as shown in Table 1. In this study, the relationship between the EVI and hydrothermal conditions was focused on these ecosystem types, whose area comprised more than 0.8% of the total area (relatively large area share and more uniform distribution) under different hydrothermal condition partitions, and the results are provided in Table 2 and Table 3.

Table 1.
Area of different hydrothermal condition zones as a proportion of the basin area.
Table 2.
Correlation coefficients of EVI and Epr on different hydrothermal condition partitions.
Table 3.
Correlation coefficients of EVI and At (accumulated temperature) on different hydrothermal condition partitions.
As shown in Table 2, the EVI and Epr in the YRB exhibited a strong positive correlation, especially in areas with Epr greater than 200 mm, which include: all areas in the upper and lower reaches of the basin; all areas in Henan, Shaanxi, and Shanxi in the middle reaches of the basin; and some areas in Ningxia, Gansu, and Inner Mongolia. The YRB is predominantly located in arid and semiarid areas, with a relatively fragile ecological environment and water shortage [75]. The soil water content, transpiration level, and air humidity affect plant growth [76,77]. When water is lacking, plant cell division and elongation are affected, which, in turn, affects vegetation growth [78,79]. In arid and semiarid regions of the basin, vegetation growth is more sensitive to Epr because of low rainfall and high evaporation; therefore, the Epr in this region is the key factor limiting vegetation growth in the YRB.
As can be seen in Table 3, in the area with At less than 1500 °C, all the ecosystems have positive correlation with the EVI, with the highest in the grassland ecosystems. When the annual At was between 1500 and 3500 °C and the Epr was between 200 mm and 600 mm, only the desert ecosystem showed a negative correlation between the EVI and At, and the other ecosystems showed a positive correlation. In areas with annual At greater than 3500 °C, where the Epr was relatively small, such as the farmland and grassland ecosystems, the corresponding EVI was negatively correlated with the At, whereas in areas with more Epr, the EVI was positively correlated. In terms of the relationship between crops and temperature, different crops have different requirements for the AT, such as 2500–3500 °C for corn, 1000–2500 °C for rice, 2500 °C for potatoes, and 2500 °C for wheat. Insufficient At will reduce the crop yield, but if the At is too high, exceeding the maximum temperature to which the crops are adapted, it will also cause crop malnutrition [80]. Typically, crops do not require At higher than 3500 °C. Therefore, the EVI in the farmland ecosystems exhibited a negative correlation with the At in areas where the basin-wide At exceeded 3500 °C. For the grassland ecosystems, the temperature is relatively low in areas with vegetation cover and relatively high in areas without vegetation cover owing to solar radiation and subsurface reflection, and precipitation is the key constraint [81]. Therefore, when the At was greater than 3500 °C and the Epr was less than 200 mm, the EVI of the grassland ecosystems showed a negative correlation with the At.
4. Conclusions and Limitations
This study obtained EVI dynamics and their responses to hydrothermal conditions in the YRB. The primary conclusions are as follows:
- (1)
- The multiyear EVI increased in the YRB from 2001 to 2020. The EVI decreased–increased–decreased with the elevation increasing. The elevation thresholds (1300 m and 3500 m altitudes) affecting EVI variations were clarified. EVI varied diversely during the different elevation threshold zones.
- (2)
- For major ecosystems and the whole YRB, the EVI, Epr and At have all increased. Their increasing rates most significantly changed in the farmland, grassland, and water bodies and wetland ecosystems, respectively.
- (3)
- The EVI varied with the variation of hydrothermal conditions in the YRB over the past 20 years. Nine dynamical threshold zones combining Epr (200 mm or 600 mm) with At (1500 °C or 3500 °C) were confirmed. Compared to the At, the Epr was the main driving factor of the EVI variations in the YRB.
However, with regards to driving factors, accepting the hydrothermal conditions of the vegetation dynamics considered in this study, anthropogenic activities and socioeconomic factors also have effects on vegetation growth. Climate changes and human activities were regarded as major driving factors, which could contribute to the understanding of vegetation variation attribution. In the future, the comprehensive impact and relationship of their factors on vegetation changes need to be quantified and assessed. In addition, evapotranspiration, snow, sunshine, and radiation all should be considered as part of the water and heat conditions. In terms of methods, cross-wavelet analysis could show the time delay between climate and vegetation that arise from land cover type and soil characteristics. Therefore, this method should be applied to investigate the relationship between vegetation variations and climatic changes.
In this study, the spatiotemporal effects of water and temperature on the EVI of the terrestrial ecosystem in the YRB were statistically analyzed at the basin scale. The results provide the basic data and technical support for the study of terrestrial ecosystem responses and adaptation to climate change as well as ecological protection and high-quality development in the YRB.
Author Contributions
Conceptualization, Z.Y.; methodology and data analysis, L.H.; writing—original draft preparation, H.W.; writing—review and editing, J.Y.; visualization, S.L.; supervision, D.Y.; funding acquisition, Z.Y. and J.Y. All authors have read and agreed to the published version of the manuscript.
Funding
This research was funded by the National Natural Science Foundation of China (grant number 52109038 and 51909080) and Postdoctoral Research Grant in Henan Province (grant number 202102014).
Institutional Review Board Statement
Not applicable.
Informed Consent Statement
Not applicable.
Data Availability Statement
Not applicable.
Acknowledgments
All authors thank NASA and the China Meteorological Data Service Centre for data.
Conflicts of Interest
All authors declare that the research was conducted in the absence of any commercial or financial relationships that could be construed as a potential conflict of interest.
References
- Lingtong, D.; Qingjiu, T.; Lei, W. Influence of vegetation structural features on MODIS spectral drought index. Spectrosc. Spectr. Anal. 2015, 35, 982–986. [Google Scholar]
- Tian, Z.; Ren, Z.; Wei, H. Spatial and temporal mechanisms driving vegetation evolution in the Yellow River Basin from 2000 to 2020. Environ. Sci. 2022, 43, 743–751. [Google Scholar]
- Pang, G.; Wang, X.; Yang, M. Using the NDVI to identify variations in, and responses of, vegetation to climate change on the Tibetan Plateau from 1982 to 2012. Quat. Int. 2017, 444, 87–96. [Google Scholar] [CrossRef]
- Richardson, A.D.; Keenan, T.F.; Migliavacca, M.; Ryu, Y.; Sonnentag, O.; Toomey, M. Climate change, phenology, and phenological control of vegetation feedbacks to the climate system. Agric. For. Meteorol. 2013, 169, 156–173. [Google Scholar] [CrossRef]
- Myneni, R.B.; Keeling, C.D.; Tucker, C.J.; Asrar, G.; Nemani, R.R. Increased plant growth in the northern high latitudes from 1981 to 1991. Nature 1997, 386, 698–702. [Google Scholar] [CrossRef]
- Kaufmann, R.K. Reply to Comment on "Variations in northern vegetation activity inferred from satellite data of vegetation index during 1981–1999" by J. R. Ahlbeck. J. Geophys. Res. 2002, 107, 4127. [Google Scholar] [CrossRef]
- Braswell, B.H.; Schimel, D.S.; Under, E.; Iii, B.M. The response of global terrestrial ecosystems to interannual temperature variability. Science 1997, 278, 870–872. [Google Scholar] [CrossRef]
- Bower, J.R.; Ichii, T. The red flying squid (Ommastrephes bartramii): A review of recent research and the fishery in Japan. Fish. Res. 2005, 76, 39–55. [Google Scholar] [CrossRef]
- Gao, Q.; Schwartz, M.W.; Zhu, W.; Wan, Y.; Qin, X.; Ma, X.; Liu, S.; Williamson, M.A.; Peters, C.B.; Yue, L. Changes in Global Grassland Productivity during 1982 to 2011 Attributable to Climatic Factors. Remote Sens. 2016, 8, 384. [Google Scholar] [CrossRef]
- Ghaderpour, E.; Vujadinovic, T. The Potential of the Least-Squares Spectral and Cross-Wavelet Analyses for Near-Real-Time Disturbance Detection within Unequally Spaced Satellite Image Time Series. Remote Sens. 2020, 12, 2446. [Google Scholar] [CrossRef]
- Ghaderpour, E.; Abbes, A.B.; Rhif, M.; Pagiatakis, S.D.; Farah, I.R. Non-stationary and unequally spaced NDVI time series analyses by the LSWAVE software. Int. J. Remote Sens. 2019, 41, 2374–2390. [Google Scholar] [CrossRef]
- Omar, M.S.; Kawamukai, H. Prediction of NDVI using the Holt-Winters model in high and low vegetation regions: A case study of East Africa. Sci. Afr. 2021, 14, e01020. [Google Scholar] [CrossRef]
- Song, T. The exploration of China’s National Park System Pilot Project: Taking Northeast China Tiger and Leopard National Park System Pilot Area as an example. Int. J. Geoherit. Parks 2020, 8, 203–209. [Google Scholar] [CrossRef]
- Xu, S.; Yu, Z.; Yang, C.; Ji, X.; Zhang, K. Trends in evapotranspiration and their responses to climate change and vegetation greening over the upper reaches of the Yellow River Basin. Agric. For. Meteorol. 2018, 263, 118–129. [Google Scholar] [CrossRef]
- Li, H.; Shi, C.; Zhang, Y.; Ning, T.; Sun, P.; Liu, X.; Ma, X.; Liu, W.; Collins, A.L. Using the Budyko hypothesis for detecting and attributing changes in runoff to climate and vegetation change in the soft sandstone area of the middle Yellow River basin, China. Sci. Total Environ. 2020, 703, 135588. [Google Scholar] [CrossRef]
- Li, H.; Fan, Y.; Gong, Z.; Zhou, D. Water accessibility assessment of freshwater wetlands in the Yellow River Delta National Nature Reserve, China. Ecohydrol. Hydrobiol. 2020, 20, 21–30. [Google Scholar] [CrossRef]
- Gao, X.; Huang, X.; Lo, K.; Dang, Q.; Wen, R. Vegetation responses to climate change in the Qilian Mountain Nature Reserve, Northwest China. Glob. Ecol. Conserv. 2021, 28, e01698. [Google Scholar] [CrossRef]
- He, P.; Xu, L.; Liu, Z.; Jing, Y.; Zhu, W. Dynamics of NDVI and its influencing factors in the Chinese Loess Plateau during 2002–2018. Reg. Sustain. 2021, 2, 36–46. [Google Scholar] [CrossRef]
- Forzieri, G.; Alkama, R.; Miralles, D.G.; Cescatti, A. Satellites reveal contrasting responses of regional climate to the widespread greening of Earth. Science 2018, 1727, 1180–1184. [Google Scholar] [CrossRef]
- Nemani, R.R. Climate-Driven Increases in Global Terrestrial Net Primary Production from 1982 to 1999. Science 2003, 300, 1560–1563. [Google Scholar] [CrossRef]
- Aguilera, F.; Orlandi, F.; Ruiz-Valenzuela, L.; Msallem, M.; Fornaciari, M. Analysis and interpretation of long temporal trends in cumulative temperatures and olive reproductive features using a seasonal trend decomposition procedure. Agric. For. Meteorol. 2015, 203, 208–216. [Google Scholar] [CrossRef]
- Denghua, Y.; Zhe, Y.; Zhiyong, Y.; Yong, W. Analysis of spatial and temporal variability of drought in the Haihe River Basin since 1961. Adv. Water Sci. 2013, 24, 8. [Google Scholar]
- Priego-Quesada, J.I.; Oficial-Casado, F.; Gandia-Soriano, A.; Carpes, F.P. A preliminary investigation about the observation of regional skin temperatures following cumulative training loads in triathletes during training camp. J. Therm. Biol. 2019, 84, 431–438. [Google Scholar] [CrossRef] [PubMed]
- Sikorska, A.E.; Viviroli, D.; Seibert, J. Effective precipitation duration for runoff peaks based on catchment modelling. J. Hydrol. 2018, 556, 510–522. [Google Scholar] [CrossRef]
- Wenbo, Z.; Xiaodong, Z.; Jingjing, Z.; Lianqi, Z. Forest vegetation phenology and its response to climate change in the Fuyu Mountains. J. Geogr. Sci. 2019, 29, 131–145. [Google Scholar]
- Cabello, J.; Alcaraz-Segura, D.; Ferrero, R.; Castro, A.J.; Liras, E. The role of vegetation and lithology in the spatial and inter-annual response of EVI to climate in drylands of Southeastern Spain. J. Arid Environ. 2012, 79, 76–83. [Google Scholar] [CrossRef]
- Hongwei, Z.; Bingfang, W.; Shuai, W.; Walter, M.; Fuyou, T.; Eric, M.Z.; Nitesh, P.; Mavengahama, S. A Synthesizing Land-cover Classification Method Based on Google Earth Engine: A Case Study in Nzhelele and Levhuvu Catchments, South Africa. Chin. Geogr. Sci. 2020, 30, 397–409. [Google Scholar]
- Sonali, P.; Paul, S. Spatio-temporal dependency of vegetation dynamics on climatic variables during 1982–2015 over India. Adv. Space Res. 2021, 68, 4616–4635. [Google Scholar]
- Islam, A.R.M.T.; Islam, H.M.T.; Shahid, S.; Khatun, M.K.; Ali, M.M.; Rahman, M.S.; Ibrahim, S.M.; Almoajel, A.M. Spatiotemporal nexus between vegetation change and extreme climatic indices and their possible causes of change. J. Environ. Manag. 2021, 289, 112505. [Google Scholar] [CrossRef]
- Huete, A.; Didan, K.; Miura, T.; Rodriguez, E.P.; Gao, X.; Ferreira, L.G. Overview of the radiometric and biophysical performance of the MODIS vegetation indices. Remote Sens. Environ. 2002, 83, 195–213. [Google Scholar] [CrossRef]
- Bunkei, M.; Wei, Y.; Jin, C.; Yuyichi, O.; Guoyu, Q. Sensitivity of the Enhanced Vegetation Index (EVI) and Normalized Difference Vegetation Index (NDVI) to Topographic Effects: A Case Study in High-density Cypress Forest. Sensors 2007, 7, 2636–2651. [Google Scholar]
- Zhang, Y.; Zhou, G. Terrestrial transect study on driving mechanism of vegetation changes. Sci. China 2008, 51, 984–991. [Google Scholar] [CrossRef]
- Lu, M.; Sun, H.; Yan, D.; Xue, J.; Zhang, W. Projections of thermal growing season indices over China under global warming of 1.5 °C and 2.0 °C. Sci. Total Environ. 2021, 781, 146774. [Google Scholar] [CrossRef]
- Chen, H.; Ma, J.; Wei, J.; Gong, X.; Yu, X.; Guo, H.; Zhao, Y. Biochar increases plant growth and alters microbial communities via regulating the moisture and temperature of green roof substrates. Sci. Total Environ. 2018, 635, 333–342. [Google Scholar] [CrossRef] [PubMed]
- Sha, Z.; Yun, B.; Qi, L.; Deming, T. Remote sensing vegetation index and CASA model for estimating winter wheat yields in Shandong Province. Spectrosc. Spectr. Anal. 2021, 41, 257–264. [Google Scholar]
- Wang, J.; Liu, Z.; Gao, J.; Emanuele, L.; Ren, Y.; Shao, M.; Wei, X. The Grain for Green project eliminated the effect of soil erosion on organic carbon on China’s Loess Plateau between 1980 and 2008. Agric. Ecosyst. Environ. 2021, 322, 107636. [Google Scholar] [CrossRef]
- Ma, S.; Qiao, Y.-P.; Wang, L.-J.; Zhang, J.-C. Terrain gradient variations in ecosystem services of different vegetation types in mountainous regions: Vegetation resource conservation and sustainable development. For. Ecol. Manag. 2021, 482, 118856. [Google Scholar] [CrossRef]
- Fraga, H.; Amraoui, M.; Malheiro, A.C.; Moutinho-Pereira, J.; Eiras-Dias, J.; Silvestre, J.; Santos, J.A. Examining the relationship between the Enhanced Vegetation Index and grapevine phenology. Eur. J. Remote Sens. 2014, 47, 753–771. [Google Scholar] [CrossRef]
- Ziyan, Z.; Meixia, L.; Zhuguo, M. Climate, hydrology and vegetation cover changes in the Yellow River source area and suggestions for countermeasures. J. Chin. Acad. Sci. 2020, 35, 61–72. [Google Scholar]
- Yuan, Z.; Xu, J.; Chen, J.; Wang, Y.; Yin, J. EVI Indicated Spatial-Temporal Variations in Vegetation and Their Responses to Climatic and Anthropogenic Factors in the Chinese Mainland Since 2000s. J. Environ. Inform. 2021. [Google Scholar] [CrossRef]
- Dong, H.; Guihua, Y.; Tingbin, Z.; Jiaqing, M.; Jingji, L.; Xiaojuan, B. Temporal and Spatial Characteristics of EVI and Its Response to Climatic Factors in Recent 16 years Based on Grey Relational Analysis in Inner Mongolia Autonomous Region, China. Remote Sens. 2018, 10, 961. [Google Scholar]
- Ghorbanian, A.; Mohammadzadeh, A.; Jamali, S. Linear and Non-Linear Vegetation Trend Analysis throughout Iran Using Two Decades of MODIS NDVI Imagery. Remote Sens. 2022, 14, 3683. [Google Scholar] [CrossRef]
- Hossain, M.L.; Li, J. NDVI-based vegetation dynamics and its resistance and resilience to different intensities of climatic events. Glob. Ecol. Conserv. 2021, 30, e01768. [Google Scholar] [CrossRef]
- Wang, X.; Gao, Q.; Wang, C.; Yu, M. Spatiotemporal patterns of vegetation phenology change and relationships with climate in the two transects of East China. Glob. Ecol. Conserv. 2017, 10, 206–219. [Google Scholar] [CrossRef]
- Zhe, Y.; Yu, Z.; Feng, Z.; Xu, J.; Jun, Y. Spatial and temporal variation characteristics of NDVI and its response to hydrothermal conditions in the Yangtze River Basin. J. Chang. Acad. Sci. 2019, 36, 7–15. [Google Scholar]
- Gu, L.; Gong, Z.; Du, Y. Evolution characteristics and simulation prediction of forest and grass landscape fragmentation based on the “Grain for Green” projects on the Loess Plateau, P.R. China. Ecol. Indic. 2021, 131, 108240. [Google Scholar] [CrossRef]
- Yao, R.; Cao, J.; Wang, L.; Zhang, W.; Wu, X. Urbanization effects on vegetation cover in major African cities during 2001–2017. Int. J. Appl. Earth Obs. Geoinf. 2019, 75, 44–53. [Google Scholar] [CrossRef]
- Zhe, Y.; Denghua, Y.; Zhiyong, Y.; Jun, Y. Spatial and temporal variation of 400mm and 800mm isochrones in China from 1961 to 2010. Adv. Water Sci. 2014, 25, 494–502. [Google Scholar]
- Hao, W.; Denghua, Y.; Dayong, Q.; Jianhua, W. Spatial variation of 400mm isopycnals in the Yellow River basin over the past 50 years. Adv. Earth Sci. 2005, 649–655. [Google Scholar]
- Che, M.; Chen, B.; Innes, J.L.; Wang, G.; Dou, X.; Zhou, T.; Zhang, H.; Yan, J.; Xu, G.; Zhao, H. Spatial and temporal variations in the end date of the vegetation growing season throughout the Qinghai–Tibetan Plateau from 1982 to 2011. Agric. For. Meteorol. 2014, 189–190, 81–90. [Google Scholar] [CrossRef]
- Tian, F.; Liu, L.-Z.; Yang, J.-H.; Wu, J.-J. Vegetation greening in more than 94% of the Yellow River Basin (YRB) region in China during the 21st century caused jointly by warming and anthropogenic activities. Ecol. Indic. 2021, 125, 107479. [Google Scholar] [CrossRef]
- Dossou, J.F.; Li, X.X.; Kang, H.; Boré, A. Impact of climate change on the Oueme basin in Benin. Glob. Ecol. Conserv. 2021, 28, e01692. [Google Scholar] [CrossRef]
- Chi, Y.; Sun, J.; Sun, Y.; Liu, S.; Fu, Z. Multi-temporal characterization of land surface temperature and its relationships with normalized difference vegetation index and soil moisture content in the Yellow River Delta, China. Glob. Ecol. Conserv. 2020, 23, e01092. [Google Scholar] [CrossRef]
- Gan, Y.; Huang, X.; Li, S.; Liu, N.; Li, Y.C.; Freidenreich, A.; Wang, W.; Wang, R.; Dai, J. Source quantification and potential risk of mercury, cadmium, arsenic, lead, and chromium in farmland soils of Yellow River Delta. J. Clean. Prod. 2019, 221, 98–107. [Google Scholar] [CrossRef]
- Zhao, H.; Huang, C.C.; Wang, H.; Liu, W.; Qiang, X.; Xu, X.; Zheng, Z.; Hu, Y.; Zhou, Q.; Zhang, Y.; et al. Mid-late Holocene temperature and precipitation variations in the Guanting Basin, upper reaches of the Yellow River. Quat. Int. 2018, 490, 74–81. [Google Scholar] [CrossRef]
- Sun, C.; Chen, Y.; Li, J.; Chen, W.; Li, X. Stable isotope variations in precipitation in the northwesternmost Tibetan Plateau related to various meteorological controlling factors. Atmos. Res. 2019, 227, 66–78. [Google Scholar] [CrossRef]
- Geng, S.; Shi, P.; Song, M.; Zong, N.; Zu, J.; Zhu, W. Diversity of vegetation composition enhances ecosystem stability along elevational gradients in the Taihang Mountains, China. Ecol. Indic. 2019, 104, 594–603. [Google Scholar] [CrossRef]
- Naboureh, A.; Li, A.; Ebrahimy, H.; Bian, J.; Azadbakht, M.; Amani, M.; Lei, G.; Nan, X. Assessing the effects of irrigated agricultural expansions on Lake Urmia using multi-decadal Landsat imagery and a sample migration technique within Google Earth Engine. Int. J. Appl. Earth Obs. Geoinf. 2021, 105, 102607. [Google Scholar] [CrossRef]
- Li, Y.; Huang, G.; Chen, Z.; Xiong, Y.; Huang, Q.; Xu, X.; Huo, Z. Effects of irrigation and fertilization on grain yield, water and nitrogen dynamics and their use efficiency of spring wheat farmland in an arid agricultural watershed of Northwest China. Agric. Water Manag. 2022, 260, 107277. [Google Scholar] [CrossRef]
- Wu, D.; Zhang, C.; Wang, T.; Liu, L.; Zhang, X.; Yuan, Z.; Yang, S.; Chen, F. East-west asymmetry in the distribution of rainfall in the Chinese Loess Plateau during the Holocene. CATENA 2021, 207, 105626. [Google Scholar] [CrossRef]
- Yang, C.; Dang, H.; Zhou, X.; Zhang, H.; Wang, X.; Wang, Y.; Qiao, P.; Jiang, X.; Jian, Z. Upper ocean hydrographic changes in response to the evolution of the East Asian monsoon in the northern South China Sea during the middle to late Miocene. Glob. Planet. Chang. 2021, 201, 103478. [Google Scholar] [CrossRef]
- Hou, R. Numerical simulation and analysis of cloud microphysics structure of windward slope rainfall in Taihang Mountain. Sci. Meteorol. Sin. 2010, 30, 351–357. [Google Scholar]
- Huang, G.; Chen, Z. Research on critical rainfall of mountain torrent disasters based on effective antecedent rainfall. J. Nat. Disasters 2014, 23, 192–197. [Google Scholar]
- Montero-Martínez, G. The effect of altitude on the prediction of momentum for rainfall erosivity studies in Mexico. CATENA 2021, 207, 105604. [Google Scholar] [CrossRef]
- Manalebish Debalike, A.; Semu Mitiku, K.; Lungu, E.M.; Woldeamlak, B. Effects of temperature and rainfall in plant–herbivore interactions at different altitude. Ecol. Model. 2019, 406, 50–59. [Google Scholar] [CrossRef]
- Marin, R.J.; Velásquez, M.F.; García, E.F.; Alvioli, M.; Aristizábal, E. Assessing two methods of defining rainfall intensity and duration thresholds for shallow landslides in data-scarce catchments of the Colombian Andean Mountains. CATENA 2021, 206, 105563. [Google Scholar] [CrossRef]
- Liu, Y.; Chen, X.; Li, Q.; Yang, J.; Li, L.; Wang, T. Impact of different microphysics and cumulus parameterizations in WRF for heavy rainfall simulations in the central segment of the Tianshan Mountains, China. Atmos. Res. 2020, 244, 105052. [Google Scholar] [CrossRef]
- Nian-Bing, Z.; Jun, Z.; Shu-Liang, F.; Hai-Yan, W.; Hong-Cheng, Z. Effects of temperature and solar radiation on yield of good eating-quality rice in the lower reaches of the Huai River Basin, China. J. Integr. Agric. 2021, 20, 1762–1774. [Google Scholar]
- Willard, D.A.; Donders, T.H.; Reichgelt, T.; Greenwood, D.R.; Sangiorgi, F.; Peterse, F.; Nierop KG, J.; Frieling, J.; Schouten, S.; Sluijs, A. Arctic vegetation, temperature, and hydrology during Early Eocene transient global warming events. Glob. Planet. Chang. 2019, 178, 139–152. [Google Scholar] [CrossRef]
- Lawal, S.; Lennard, C.; Hewitson, B. Response of southern African vegetation to climate change at 1.5 and 2.0° global warming above the pre-industrial level. Clim. Serv. 2019, 16, 100134. [Google Scholar] [CrossRef]
- Kawser, U.; Nath, B.; Hoque, A. Observing the influences of climatic and environmental variability over soil salinity changes in the Noakhali Coastal Regions of Bangladesh using geospatial and statistical techniques. Environ. Chall. 2022, 6, 100429. [Google Scholar] [CrossRef]
- Nachshon, U.; Levy, G.J. Soil salination processes and management. In Reference Module in Earth Systems and Environmental Sciences; Elsevier: Amsterdam, The Netherlands, 2022. [Google Scholar]
- Zhao, H.; Zhang, F.; Yu, Z.; Li, J. Spatiotemporal variation in soil degradation and economic damage caused by wind erosion in Northwest China. J. Environ. Manag. 2022, 314, 115121. [Google Scholar] [CrossRef] [PubMed]
- Zhang, K.; Dang, H.; Tan, S.; Cheng, X.; Zhang, Q. Change in soil organic carbon following the ‘Grain-for-Green’ programme in China. Land Degrad. Dev. 2010, 21, 13–23. [Google Scholar] [CrossRef]
- Cui, L.; Shi, J. Evaluation and comparison of growing season metrics in arid and semi-arid areas of northern China under climate change. Ecol. Indic. 2021, 121, 107055. [Google Scholar] [CrossRef]
- Fang, W.; Quansheng, G.; Qibiao, Y.; Huaxin, W.; Xinliang, X. Impacts of Land-use and Land-cover Changes on River Runoff in Yellow River Basin for Period of 1956–2012. Chin. Geogr. Sci. 2017, 27, 13–24. [Google Scholar]
- Wang, F.; Wang, Z.; Yang, H.; Zhao, Y. Study of the temporal and spatial patterns of drought in the Yellow River basin based on SPEI. Sci. China (Earth Sci.) 2018, 61, 1098–1111. [Google Scholar] [CrossRef]
- Guo, L.; Zhang, T.; Zhang, Q.; Jin, H.; Li, E.; Li, Y.; Wu, Y.; Yang, Z. The Effects of Pre-Season Rainfall on the Phenology of Plants in the Rejuvenated Period. Int. J. Ecol. 2020, 9, 23–31. [Google Scholar] [CrossRef]
- Sun, C.; Hou, H.; Chen, W. Effects of vegetation cover and slope on soil erosion in the Eastern Chinese Loess Plateau under different rainfall regimes. PeerJ 2021, 9, e11226. [Google Scholar] [CrossRef]
- Yang, M.; Mou, Y.; Meng, Y.; Liu, S.; Peng, C.; Zhou, X. Modeling the effects of precipitation and temperature patterns on agricultural drought in China from 1949 to 2015. Sci. Total Environ. 2020, 711, 135139. [Google Scholar] [CrossRef]
- Caiqin, Z.; Jun, Z.; Jing, L.; Xiruo, L. Simulation and statistical analysis of plant growth characteristics of grassland based on cumulative temperature factor. Resour. Environ. Arid Reg. 2016, 30, 157–163. [Google Scholar]


Publisher’s Note: MDPI stays neutral with regard to jurisdictional claims in published maps and institutional affiliations. |
© 2022 by the authors. Licensee MDPI, Basel, Switzerland. This article is an open access article distributed under the terms and conditions of the Creative Commons Attribution (CC BY) license (https://creativecommons.org/licenses/by/4.0/).