Abstract
Radiation fog episodes are characterized by aerosol radiative properties measured at Hefei in urban central China, which hopefully benefits numerical weather prediction and air quality improvement for local governments. In this study, a high mean aerosol optical depth (AOD) is seen over Hefei during the sampling period, whereas an AOD of ~3.0 at 550 nm is observed during the fog episodes. We redefine the fog scavenging coefficient based on its starting and ending points in time, and a black carbon (BC) scavenging coefficient of 30% is observed. Meanwhile, the fog process cannot reduce aerosol number concentrations at size bins between 0.5 and 0.6 μm, whereas a mean particle scavenging coefficient of 21% at sizes within 0.6–1 μm is seen. Significantly large median aerosol scattering coefficient (2690 Mm−1) and absorption coefficient (446 Mm−1) at 550 nm, and low scattering Angstrom exponent in fog are observed, while distinctive particle size distributions between fog and haze are shown. Particle mean size distribution in fog is lower than that in haze at size bins between 0.7 and 2.1 μm, whereas the reverse is true for sizes within 0.5–0.7 μm and larger than 2.1 μm. Aerosol scattering during fog episodes undergoes a bigger increase than particle absorption, and this increase of scattering in fog is even higher than in haze. Median single scattering albedos of 0.86, 0.82, and 0.76 at 550 nm and aerosol radiative forcing efficiencies of −15.0, −14.0, and −10.0 W/m2 are seen for fog, haze and clear periods, respectively, and more negative radiative forcing efficiency emphasizes the significance of fog episodes on climate forcing. Our study clearly reveals the changes of aerosol radiative properties during radiation fog, particularly a synchronous variation of fog aerosol backscattering ratio with the visibility, indicating that more large particles are formed with fog becoming thicker and are scavenged with the dissipation of fog.
1. Introduction
Fog is a weather phenomenon in which water droplets smaller than 50 microns, coupled with atmospheric aerosol particles, result in a degradation of visibility to 1 km or less [1]. As a common fog type seen in continental regions, radiation fog usually forms by surface radiative cooling under clear skies [2]. Reduced visibility due to fog is one of the major concerns for the safety of public traffic, and abundant financial losses can be caused on account of delays induced by low visibility [3]. Meanwhile, aerosol particles in fog can show significant adverse influences on human health as they are capable of carrying toxic material (e.g., polycyclic aromatic hydrocarbons and heavy metals) [4]. Nevertheless, prediction of radiation fog is challenging for numerical weather models, and one of the factors resulting in low quality of fog forecasts is that understanding of aerosol fog interaction requires significant advancements [5].
Fog is a low cloud that is contact with the ground, and aerosols as cloud condensation nuclei (CCN) can indirectly alter properties of clouds and precipitation on global and regional scales [6]. In addition, aerosols can directly scatter and absorb solar radiation, and impact the climate and the Earth’s energy balance. This is especially true for strongly absorptive black carbon aerosols [7]. Enhanced aerosol loading and air pollution due to industrialization and urbanization impact fog duration, and increased particles can enhance the development and occurrence of fog [8]. Over polluted regions, the number concentration of fog droplet is more than 1000 cm−3, and a mean fog droplet radius of about 5–6 μm is observed [9].
Aerosol can also have crucial impacts on fog microphysical properties, such as fog size distribution, and explosive CCN activation enhances mixing moistures and particles under cooling conditions with high humidity, developing fog episodes [10]. It is observed that activated fog droplet concentration is comparatively low, while non-activated hydrated aerosols contribute to light scattering significantly, resulting in visibility degradation [11]. Moreover, fog water acts as a medium suitable for secondary aerosol formations, altering aerosol chemical properties [12]. Latent heating provided by condensation process of fog droplets and high number concentration of aerosols enhance Brownian coagulation, and promote fog explosive development [13]. Huang et al. [14] report that fog process is a major pathway for yielding secondary inorganic aerosols and influencing the process of neutralization.
Fog water chemistry has been studied for several decades, and fog scavenging is a process in which aerosol particles are converted into fog droplets [15]. Aerosol water uptake related to fog facilitates the process and formation of secondary species with heterogeneous-phase chemistry [16]. Fog scavenging is favorable to predict aerosol effects on air quality and climate, as it can reduce particulate loading with wet removal and change particle hygroscopicity and size distribution due to a selective washout of water-soluble aerosols [17]. Fog scavenging mechanisms include nucleation scavenging and impaction scavenging, of which nucleation scavenging is the dominant mechanism [18]. Nucleation scavenging is that particles are activated to form the droplets of fog, whereas impaction scavenging is incorporating interstitial aerosol into fog droplet with phoretic effect, inertial impaction, and Brownian diffusion [15]. Values of 5–6% have been reported for fog-scavenging coefficients of BC in Californian radiation fogs [17]. Gilardoni et al. [15] present that 39% for BC, 50% for organics, and 70% for nitrate are scavenged on average by fog processes in the Po Valley of Italy. Heintzenberg et al. [19] estimate scavenging coefficients of BC by fog with three distinctive approaches, and different values ranging from 6% to 50% can be obtained in Chilean coastal fogs. Meanwhile, Zhu et al. [20] show that fog can increase aerosol number concentrations in some cases, in addition to removing particles in other cases. These studies potentially require further researches on the advance of aerosol-fog interactions and redefining aerosol-scavenging effects of fog. Intensive fog field campaigns are implemented in the Pearl River Delta [21], Yangtze River Delta [20], and North China Plain [22], whereas few results are reported regarding influence of radiation fog on aerosol radiative properties in urban central China.
Here, surface aerosol radiative properties are measured in Hefei from 11 June to 30 June 2012 with a whole fog cycle occurring. A visibility sensor, aethalometer, integrating nephelometer, and aerodynamic particle sizer spectrometer are employed to measure atmospheric visibility and aerosol characteristics, while air-mass back-trajectories are applied for aerosol source-region identification during fog episode. The objective of our study here is to assess aerosol radiative properties impacted by radiation fog in urban central China, which hopefully benefit numerical weather prediction and air quality improvement for local governments.
2. Materials and Methods
The field experiments were conducted in Hefei, which is the capital of the Anhui province in central China and located in the west of Yangtze delta region with a climate of continental monsoon [23]. As a weather phenomenon, fog is commonly seen in Hefei, especially in summer, and it results in severe visibility impairment. In this work, fog is defined as horizontal visibility less than 1 km with a high relative humidity of ~100%, whereas for comparison, haze and clear periods have visibilities between 1 km and 5 km, and larger than 5 km, respectively. In other studies, PM2.5 mass concentration has also been used to distinguish fog and haze [24]. The intensive aerosol observations were performed from 11 June to 30 June 2012 at the Science Island (31.90° N, 117.19° E), which locates at northwest of Hefei city and is surrounded by with densely populated urban areas. The sampling instruments were positioned in a constructed trailer with the inlet ports placed through its roof, and the setup of experiments is designed to have a maximization of counting statistics with minimization of measurement biases and particle losses on the basis of minimal tubing bends and isokinetic sampling techniques. Surface aerosol radiative properties were measured in Hefei from 11 June to 30 June 2012 with a whole fog cycle occurring. A visibility sensor, aethalometer, integrating nephelometer, and aerodynamic particle sizer spectrometer were employed to measure atmospheric visibility and aerosol characteristics, which are summarized in Table 1.

Table 1.
Measured aerosol properties and related instruments.
The visibility is measured by a Belfort visibility sensor (model 6000) composed of a MIG Pole, a transmitter, and a receiver, while its calibration is finished with the 90001 Calibration Kit recommended by its manufacturer. The size distribution and aerosol number concentration are measured with an aerodynamic particle sizer spectrometer (APS, model 3321), which is an optical particle counter with the measurements at 52 nominal bins in an aerodynamic size range of 0.50–20 μm. Aerosol particle size classification is on the basis of aerosol aerodynamic size prior to characterizing particle size distribution. This instrument determines the time-of-flight of individual aerosols in an accelerating flow field, and counting efficiencies for solid particles can be in a range of 85–99% based on Volckens and Peters [25]. Its calibration was carried out with polystyrene gum elastic, and its sampling is set as 5-min intervals with a flow rate of 5 L/min.
A total/back integrating nephelometer (model 3563) as applied to measure aerosol scattering and backscattering coefficients at 450, 550 and 700 nm. This nephelometer was calibrated with particle filtered air as low span gas and CO2 as high span gas, while zero baseline was checked at least once a week. The flow rate and average time of the nephelometer were set as 30 L/min and 5 min, respectively, whereas truncation errors associated with geometrical blockage of scattered light for an angle of <7° and >170°, were corrected on the basis of Anderson and Ogren [26]. Aerosol absorption coefficients were measured with a 7-wavelength Aethalometer (model AE31), yielding a change in optical attenuation by measuring the intensity of light beam passing through a tare and loaded with particle filter tape. The aethalometer was operated at a flow rate of 5 L/min, and filter tape advances if the attenuation at 370 nm reached 75.
Source regions for aerosol radiative properties in fog over Hefei can be obtained with backward trajectories, and three-day trajectories are analyzed employing the Hybrid Single Particle Lagrangian Integrated Trajectory (HYSPLIT) model [27,28]. The data of meteorology used for trajectory calculations come from the Global Data Assimilation System (GDAS) archive. We select trajectories at 500 m above ground level, and air-mass back-trajectories are applied for aerosol source-region identification during fog episodes.
3. Results and Discussion
3.1. Overview of Aerosol Radiative Properties
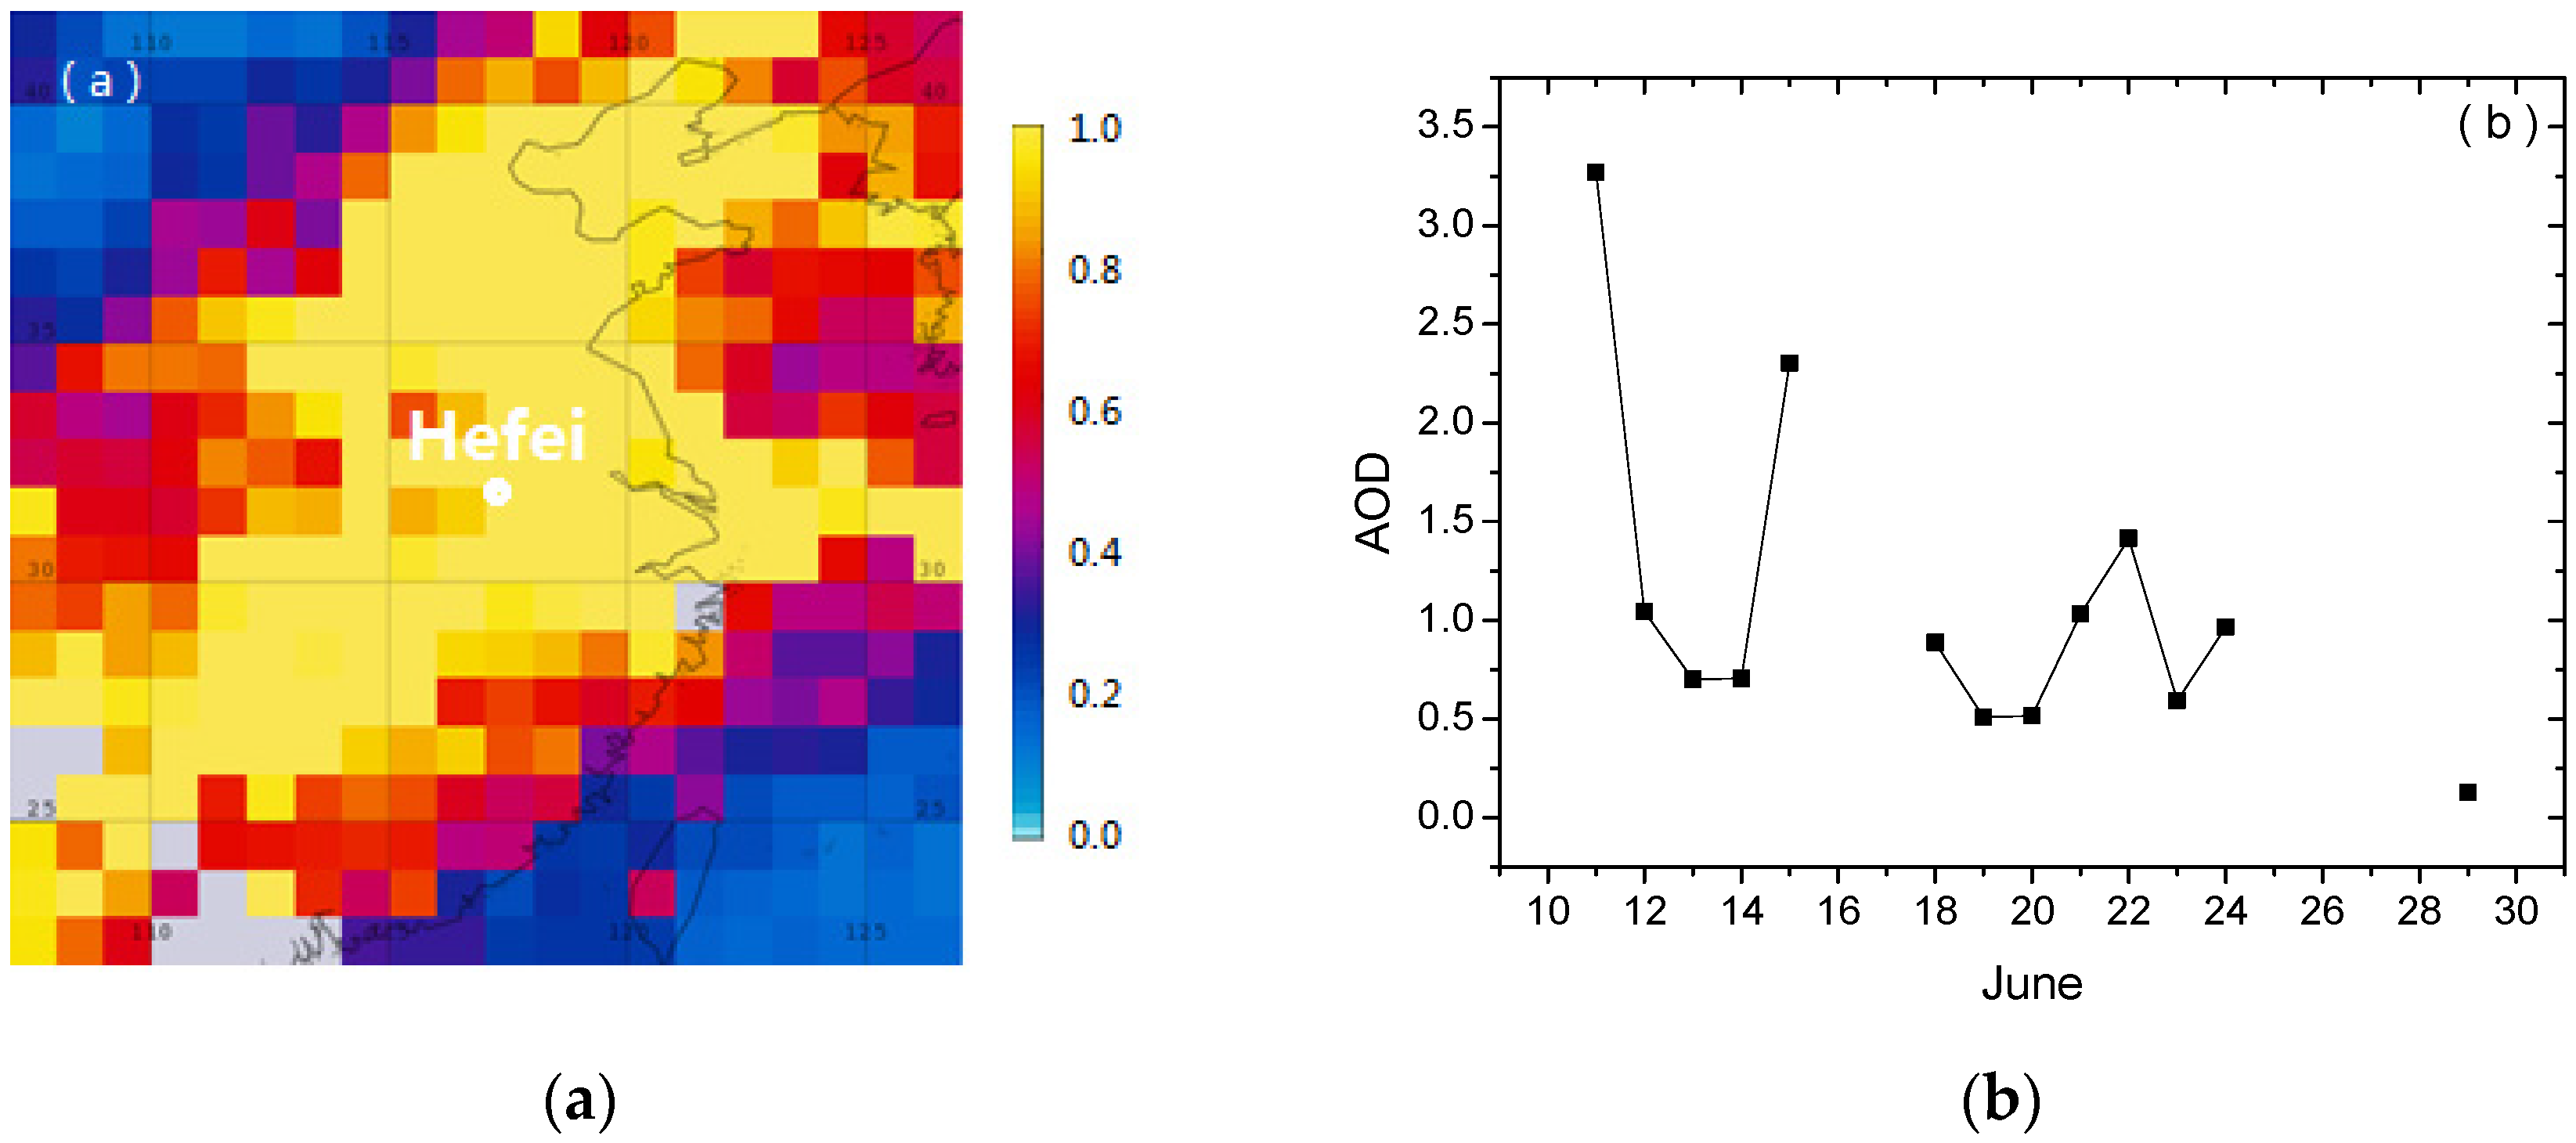
While aerosol loading and air pollution situation can be revealed with the satellite data of daily aerosol optical depth (AOD) from moderate resolution imaging spectroradiometry (MODIS) Level 2 10 km × 10 km Collection V005, regional AOD distribution on the basis of the Giovanni map [29] over mid-eastern China is illustrated in Figure 1. An average AOD of ~1.0 at 550 nm during June 2012 is obtained over Hefei (see Figure 1a), and such high aerosol loading is probably attributed to severe haze and fog episodes contributed by synoptic patterns and anthropogenic emissions (e.g., straw biomass burning, and traffic exhausts) [30,31]. During the sampling period, a typical radiation fog event is observed in 11–12 June 2012, and an AOD of ~3.0 at 550 nm is even obtained (see Figure 1b), indicating strong aerosol extinction during fog episodes. For comparison, AOD values of 0.14, 0.34, 0.42, 0.54, and 0.74 are seen at remote stations, rural/desert regions, the Loess Plateau, central and eastern China, respectively [32]. Zhao et al. [33] presented that large AOD values ranging from 0.67 to 1.25 in July are observed in urban areas over northeastern China, while annual AOD at rural site is 2.1 times lower than at urban site. The AOD is also influenced by synoptic patterns (for example, advection of air from less densely populated regions or high wind speed may favor low AOD).

Figure 1.
Time-averaged map of aerosol optical depth (AOD) at 550 nm over mid-eastern China derived from MODIS-Aqua data during June 2012 (a), and daily AOD during sampling period (b) over Hefei (region: 116–118 E, 31–33 N). White circle denotes the sampling site of Hefei. The data gaps in Figure 1b originate from the lack of MODIS-Aqua data (e.g., under cloudy weather conditions).
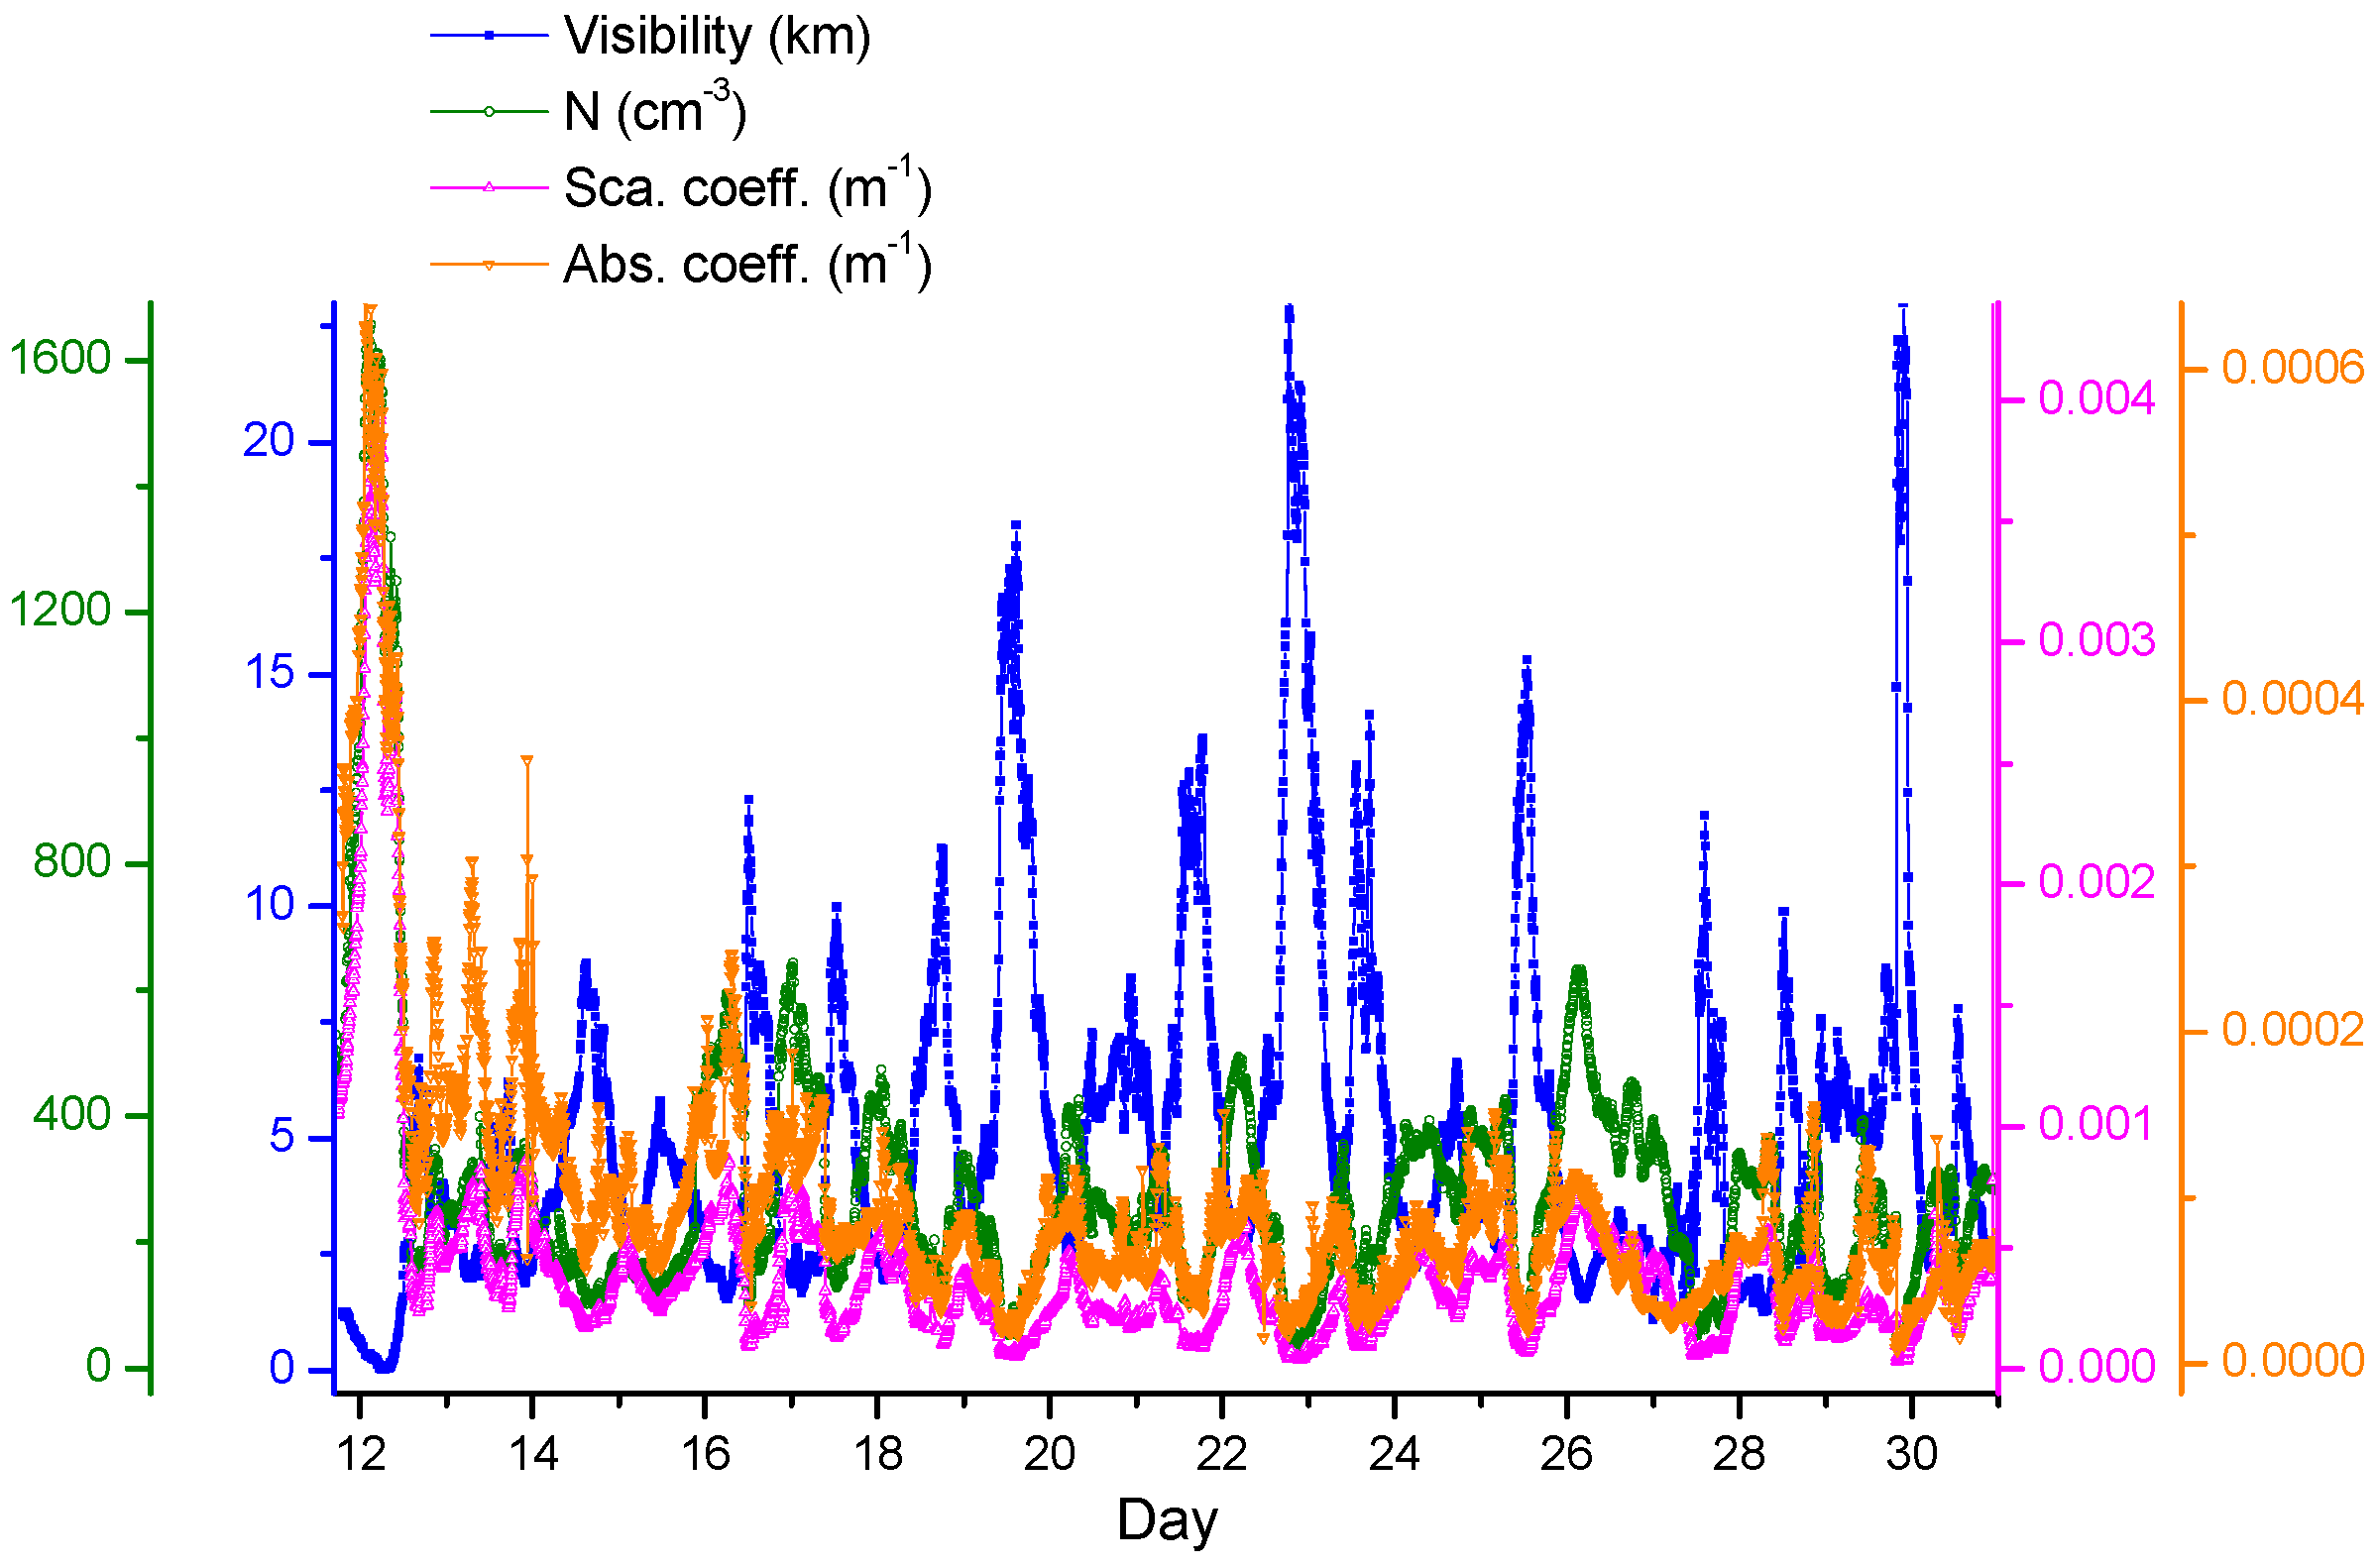
Figure 2 illustrates temporal variations of visibilities, aerosol number concentrations (N), scattering coefficients () and absorption coefficients () at 550 nm during sampling period. For N, and , large variabilities in ranges of 31–1656 cm−3, 32–3940 Mm−1, and 8–643 Mm−1 with mean values of 287 cm−3, 413 Mm−1 and 93 Mm−1 are observed in Hefei, respectively. High values of N, , and are related to fog or haze episodes, while low aerosol properties are usually due to rain scavenging. Particle scavenging by precipitation is a significant aerosol removal mechanism [34], which can result in low aerosol concentrations in the atmosphere. It is shown that fog can create new particle materials through scavenging gas [35], whereas haze pollution is largely related to anthropogenic emissions such as traffic and industrial discharges and biomass burning [36]. Negative correlations of visibility with aerosol number concentration, scattering and absorption coefficients are observed, which are depicted in Figure 3. The nonlinear optimization of visibility with , N and on the basis of least squares are , and with R2 of 0.64, 0.65 and 0.51, respectively. A relatively poor negative correlation is found between the absorption coefficient and atmospheric visibility.

Figure 2.
Temporal variations of visibilities, aerosol number concentrations (N), and scattering and absorption coefficients at 550 nm from 11 June to 30 June 2012, in Hefei.
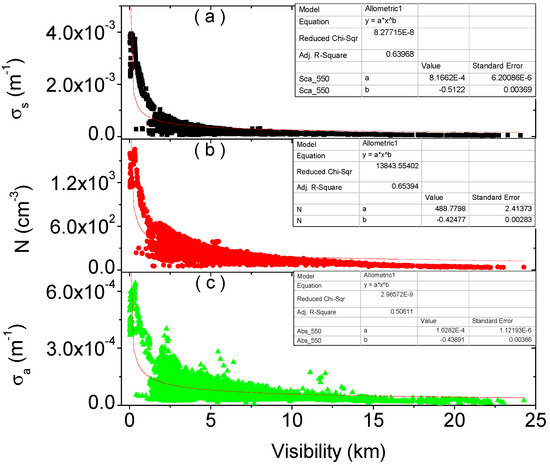
Figure 3.
Aerosol scattering coefficient (a) at 550 nm, number concentration (b), and absorption coefficient (c) at 550 nm as a function of visibility.
3.2. Scavenging of Black Carbon by Radiation Fog
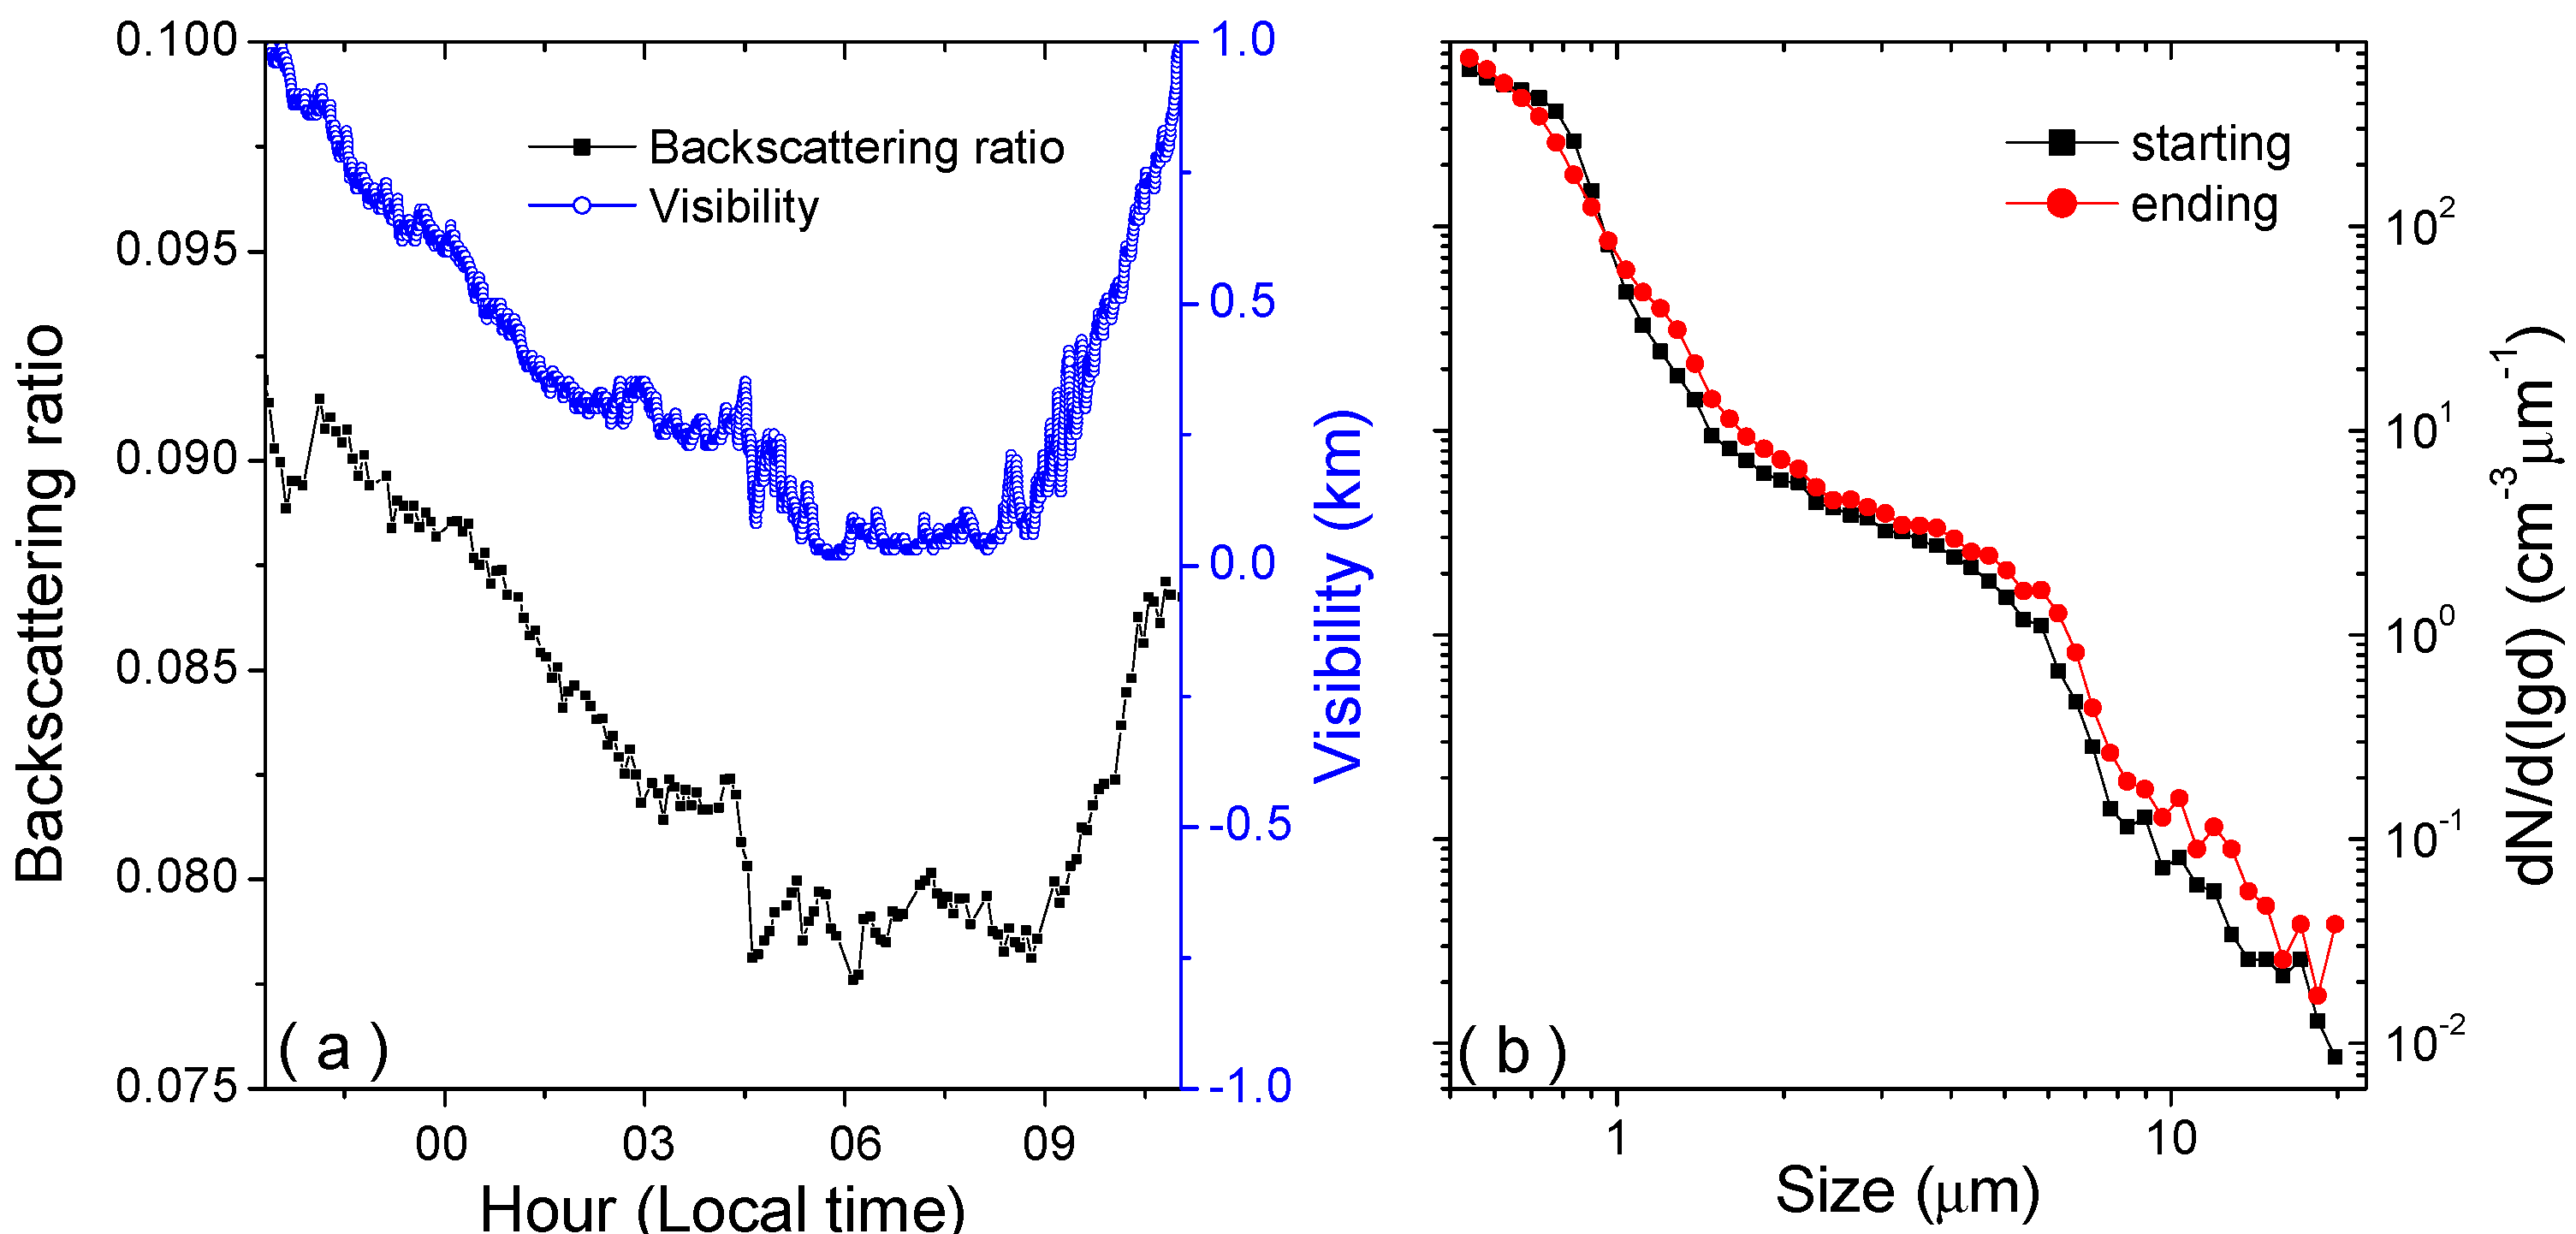
During the sampling period of 11–12 June 2012, a typical radiation fog event can be seen, and variations of visibility and aerosol backscattering ratio during this fog are shown in Figure 4a. For the fog episode, the visibility decreases gradually with time until a minimum of less than 50 m, maintained for about 3 h, and increased with fog dissipation due to heating by solar radiation. The backscatter ratio, b, is a ratio of backscattering coefficient to scattering coefficient, this being highly associated with particle size distribution and decreasing with particle size. As illustrated in Figure 4a, aerosol backscattering ratio generally show synchronous change with the visibility. This indicates that more large particles may be formed and accumulated with fog becoming severer, since smaller aerosol backscattering albedo implies bigger particle size. Meanwhile, as fog becomes lighter due to dissipation, more large aerosols may be scavenged, resulting in the existence of more small particles.

Figure 4.
Variations of visibility and aerosol backscattering ratio during fog periods (a) and particle size distributions at the starting and ending points of fog (b).
To show the impact of fog on aerosol properties, Table 2 lists aerosol radiative properties right before and after fog episodes (i.e., starting and ending points in time), and unnormalized particle size distributions, reflecting absolute aerosol number concentrations, are portrayed in Figure 4b. At starting and ending points of fog, number concentrations, N, measured by the aerodynamic particle sizer spectrometer are 776 and 772 cm−3, whereas number concentrations of supermicron particles with diameters larger than 1 μm, N > 1 μm, are 7 and 9 cm−3, respectively. Compared to the starting point, total number concentration at ending point is lower, as opposed to higher supermicron number concentration, indicating the effect of fog on aerosol number concentration. This may suggest that some supermicron particles are formed along with the removal of some submicron particles during the fog process. As illustrated in Figure 4b, the aerosol size distribution in coarse mode (i.e., size > 1 μm) at the ending point of the fog is higher than that at starting point, indicating that more coarse particles formed due to fog episode. In accumulation mode (i.e., particle size between 0.1 and 1 μm), particle number concentrations at size bins between 0.5 and 0.6 μm are higher at ending point than starting point, whereas the reverse is true at sizes of 0.6–1 μm.
Table 2.
Aerosol radiative properties at starting and ending points of fog.
As listed in Table 2, aerosol scattering coefficient at 550 nm is 1590 Mm−1 at the ending point of fog, which is slightly higher than that at starting point with a value of 1510 Mm−1. Aerosol scattering Angstrom exponent is a significant parameter describing scattering dependency on wavelength, depending on size distribution, and decreasing with increased size. Based on scattering measurements at 700 nm and 450 nm, the can be obtained following:
The between 450 nm and 700 nm at starting point is 2.18, and it decreases to 1.85 after fog ends, indicating more large particles are assembled during fog event. The backscattering ratio show similar variation trends to the , which can also imply the effect of fog process on particle size. The absorption coefficient at 550 nm, which is converted based on aethalometer measurements at 590 and 520 nm, is 354 and 275 Mm−1 at starting and ending points, respectively, suggesting the scavenging of absorption particles by the fog. Given the aerosol scattering and absorption, the effect of fog on single scattering albedo ω0 can be studied. The ω0, defined as a ratio of aerosol scattering to extinction, is a significant parameter to determine the sign of their direct radiative forcing, and is a function of particle composition. As illustrated in Table 2, the values of ω0 at fog starting point in time are 0.83, 0.81 and 0.75 for 450, 550, and 700 nm, respectively, whereas they increase to 0.87, 0.85, and 0.81, respectively after a fog episode. This can be explained by the increase of aerosol scattering and decrease of absorption due to the fog. To summarize, aerosol radiative properties undergo distinctive variations through the fog process (i.e., an increase of scattering coefficient and single scattering albedo, and decrease of scattering Angstrom exponent, backscattering ratio, and absorption coefficient).
It is reported that fog can remove particles on the basis of collision-coalescence mechanism [20,37], whereas specific criteria for estimating fog scavenging effect on aerosols is still under discussion. Based on distinctive approaches, fog-scavenging coefficients for black carbon can range from 6% to 50% [19]. Here, we define fog scavenging coefficient η by comparing aerosol parameters right before and after fog episodes, and it follows that:
Taking into account BC mass concentration at 880 nm, a fog scavenging coefficient of 30% is obtained (see Table 2). BC is the most hydrophobic component, and has less fog scavenging coefficient than hydrophilic species, such as nitrate and ammonium [15]. The BC scavenging coefficient by fog is generally similar to those estimated over the Po Valley in northern Italy, where a mean η of 39% is estimated [15]. Furthermore, the fog process cannot reduce aerosol number concentrations in coarse mode, but it can remove particles at sizes within 0.6–1 μm with an average scavenging coefficient of 21% (see Figure 4b).
3.3. Comparison of Aerosol Radiative Properties during Fog with Haze and Clear Periods
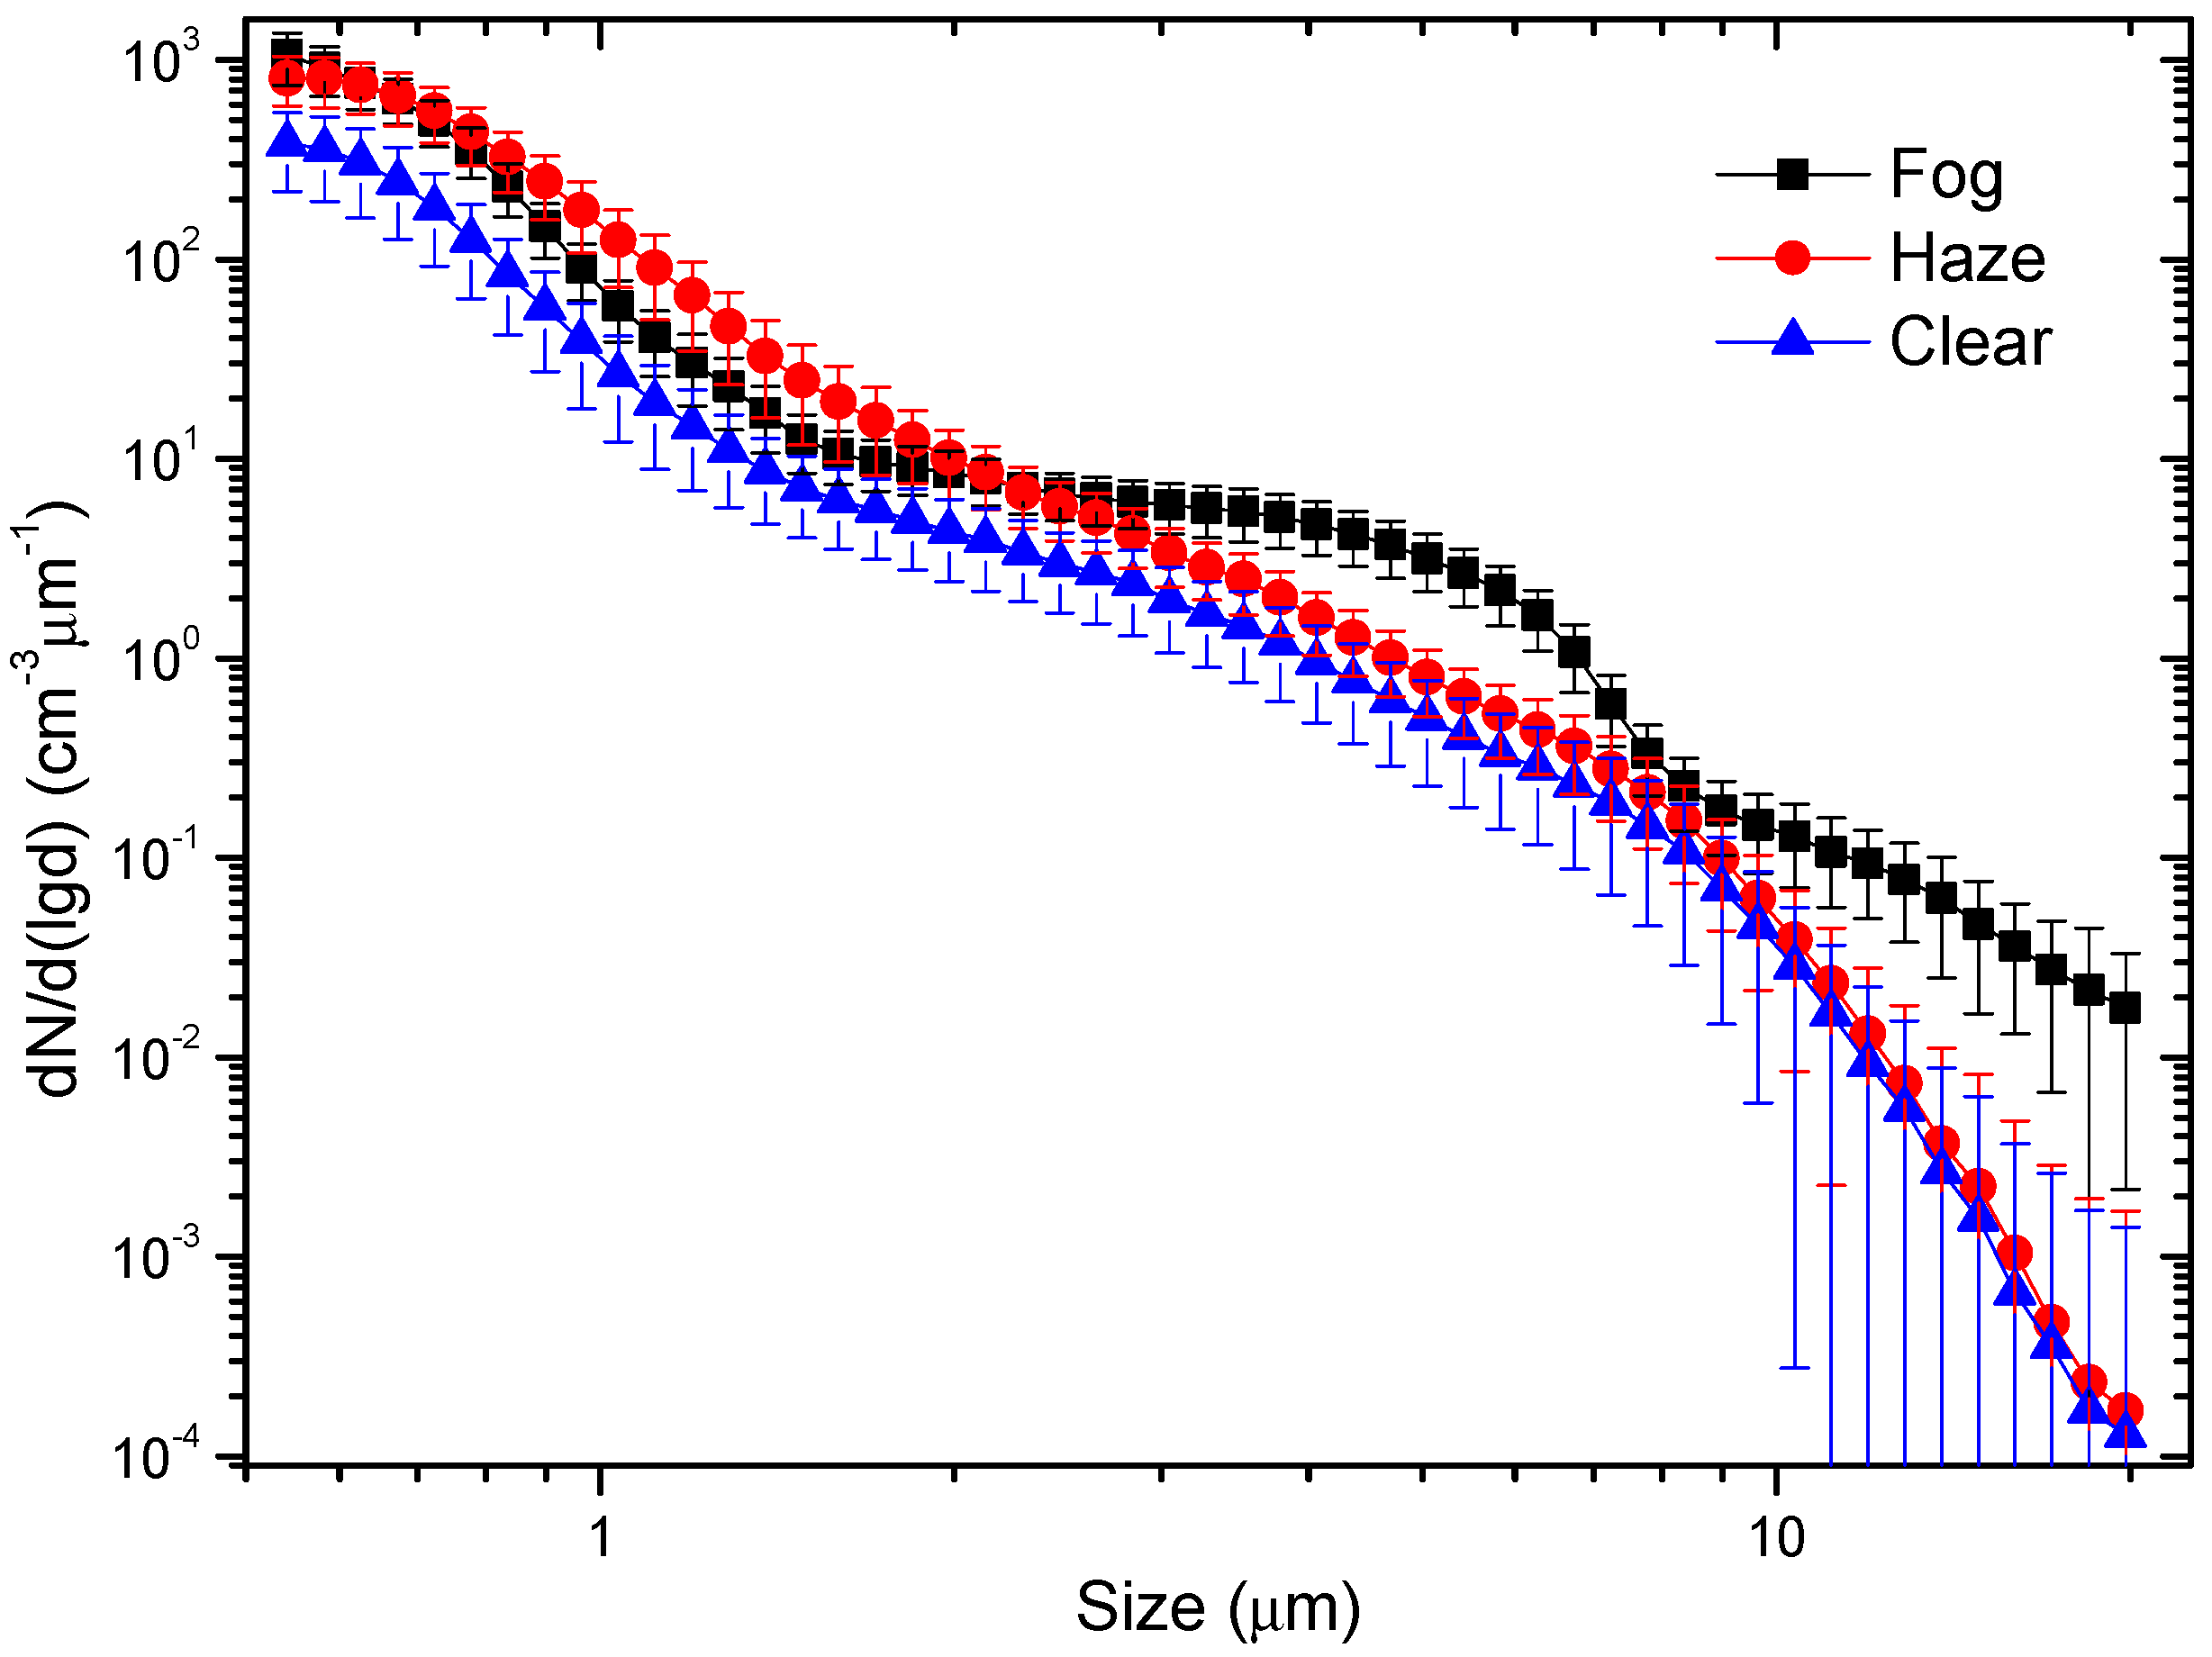
Table 3 compares aerosol properties for fog, haze, and clear periods observed in the field campaign in terms of median, 10th, and 90th percentiles. The fog period is defined as the observation period with horizontal visibility less than 1 km with a high relative humidity of ~100%, whereas the haze and clear periods are periods with visibility between 1 km and 5 km and visibility larger than 5 km, respectively. A high median N value of 1198 cm−3 is seen during fog episode, followed by median value of 335 cm−3 for haze periods, while the lowest median N of 175 cm−3 during clear periods is observed. The median N during fog event is almost a factor of 4 larger than that during haze episodes, and is a factor of ~8 higher that for clear periods, indicating heavy particulate loading and high-potential health risk due to exposure on foggy days. For supermicron aerosols, observed median N > 1 μm values are 10, 13, and 4 cm−3 during fog, haze, and clear periods, respectively. Aerosol size distributions during the fog, haze, and clear periods are illustrated in Figure 5. The mean size distribution for clear periods is obviously lower than those under foggy and hazy weather conditions at all particle size larger than 0.5 μm. Aerosol mean size distribution at size bins larger than 2.1 μm and within 0.5–0.7 μm during fog episode is higher than that during haze period, whereas the reverse is true for particles with a size ranging from 0.7 to 2.1 μm.
Table 3.
Aerosol properties during fog, haze and clear periods a.
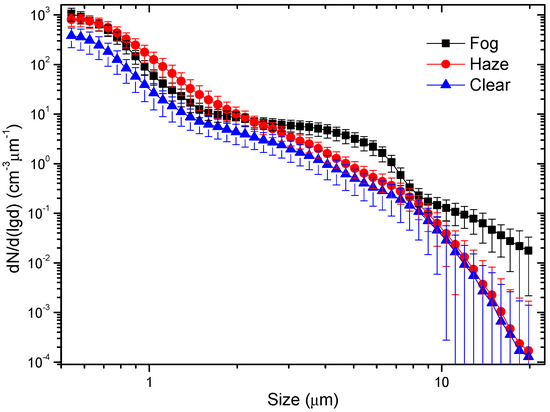
Figure 5.
Mean size distributions for fog, haze and clear periods.
As shown in Table 3, median at 550 nm is 2690 Mm−1 during fog period, which is higher than those during haze and clear periods by factors of over 6 and 14, respectively. Strong aerosol scattering is observed during fog period, resulting in severe visibility degradation, and being probably explained by high number concentration of particles with sizes larger than 0.5 μm. The in Hefei for clear periods is slightly higher than that in Klang Valley, Malaysia during southwest monsoon season in 2000 (with a mean value of 101 Mm−1) [38]. The fog group shows lowest median of 1.91, followed by the haze group of 1.95, and the clear group has largest with a median value of 2.12. The observed median b values at 550 nm are 0.09, 0.10 and 0.11 for fog, haze and clear periods, respectively. Both and b results indicate more large particles during fog episode, agreeing with size distributions illustrated in Figure 5. Median values of 446, 95 and 59 Mm−1 at 550 nm are seen for fog, haze and clear periods, respectively (see Table 3). The at Hefei for clear periods is similar to those measured in Wuqing, showing a mean of 43 Mm−1 [39]. Compared to haze and clear periods, aerosol median absorption coefficients for fog episodes are higher by factors of 4.7 and 7.6, respectively, whereas median fog scattering coefficients are larger by factors of 6.3 and 14.2, respectively. Obviously, during fog episodes, the concentrations of scattering aerosols undergo a bigger augment than those of absorption particles, and this may be associated with the hygroscopic growth of particle size due to high relative humidity. Meanwhile, this augment of scattering in fog is even higher than in haze.
Aerosol direct climate effect in terms of cooling or warming is dependent on ω0, and the comparison of ω0 results during the fog, haze, and clear periods are also shown in Table 3. Median ω0 values at 550 nm are 0.86, 0.82, and 0.76 for fog, haze and clear periods, respectively. Aerosol effect can change from cooling atmosphere to warming if ω0 is smaller than a critical 0.86, and an obtained ω0 below this threshold may imply a warming effect in the boundary layer of Hefei [40]. A larger ω0 observed in fog in comparison with haze and clear periods may be attributed to the fact that the formation of secondary aerosols along with particle growth during aging process generates massive scattering compositions (such as sulfate, nitrate, and ammonium). The lensing effect can enlarge aged BC absorption due to coating, whereas the increase in particle scattering on account of secondary aerosol formations and condensations overcome absorption increase, resulting in an ω0 increase [41]. The up-scatter fraction β is another important parameter that controls direct radiative forcing of aerosols and is used in some simplified radiative forcing equations to determine top of atmosphere forcing (it can be obtained following [42]).
For fog, haze, and clear periods, median β values of 0.22, 0.24, and 0.25 at 550 nm can be derived, corresponding to b of 0.09, 0.10, and 0.11, respectively.
To evaluate the impacts of β and ω0 on estimations of aerosol radiative forcing at the top of atmosphere, aerosol radiative forcing efficiency (ΔF/δ) defined as aerosol radiative forcing (ΔF) per unit optical depth (δ) can be estimated. The ΔF/δ can be calculated following Randles et al. [43] and Dinar et al. [44] with the form of
where RS, AC, Tat, S0, and D are the surface reflectance, fractional cloud amount, atmospheric transmittance, solar constant, and fractional day length, respectively. These constants are set as , , , W/m2 and , which are suitable for urban area. The ΔF/δ is a zero-order estimation of the variations of radiative flux, as many simplified assumptions are considered, such as neglecting the spectral dependences of atmospheric and aerosol optical parameters, and only considering 550 nm here). Positive and negative values of ΔF/δ indicate heating and cooling the atmosphere by aerosols, respectively. For fog, haze and clear periods, median ΔF/δ values of −15.0, −14.0 and −10.0 W/m2 are seen, respectively. Aerosol radiative forcing efficiency in fog is more negative than that in haze, emphasizing the significance of the outbreak of fog events on climate forcing (in addition to haze episodes).
Source regions for aerosol radiative properties in fog over Hefei can be obtained with backward trajectories, and three-day trajectories are analyzed employing the HYSPLIT model. The trajectories at Hefei during fog episodes are illustrated in Figure 6, and air masses are originated from the Yangtze Delta to the east of Hefei. The monsoon wind prevailing brings Hefei aerosol pollutions produced over the Yangtze Delta, besides local emissions [31]. These anthropogenic aerosol emissions from industry and fossil fuels, as well as biomass burning displayed in the MODIS wildfire maps (not shown), are favorable for radiation fog episodes, in addition to weather conditions (such as calm wind, few clouds, and high relative humidity).
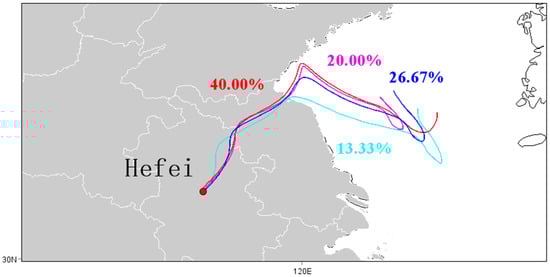
Figure 6.
HYSPLIT backward trajectories during fog period in Hefei at 500 m height above ground level.
4. Conclusions
Aerosol radiative properties are measured from 11 June to 30 June 2012 over urban central China (Hefei) to characterize radiation fog episodes. High mean aerosol optical depth is seen over Hefei during sampling period, and an AOD of ~3.0 at 550 nm is even observed during fog period. The analysis of aerosol observations leads to following conclusions related to climate issues:
The aerosol backscattering ratio generally has a synchronous change with the visibility, implying that more large particles are formed with fog being heavier while, with the dissipation of fog, more large aerosols are scavenged, resulting in more small particles left. Aerosol radiative properties undergo distinctive variations through the fog process, showing an increase of scattering coefficient and single scattering albedo, decrease of the scattering Angstrom exponent, and a backscattering ratio and absorption coefficient. We redefine the fog scavenging coefficient based on its starting and ending points in time, and the BC scavenging coefficient by fog is observed to be 30% for the radiation fog over urban central China. Meanwhile, the fog process cannot reduce aerosol number concentrations in coarse mode and at size bins between 0.5 and 0.6 μm, whereas a mean particle scavenging coefficient of 21% at sizes within 0.6–1 μm is seen. The median N value (1198 cm−3) measured by the APS during fog event is larger than those in haze and clear periods by factors of almost four and eight, respectively, indicating heavy particulate loading and high-potential health risk due to exposure on foggy days. Particle mean size for fog is lower than that for haze at size bins between 0.7 and 2.1 μm, whereas the reverse is true for sizes within 0.5–0.7 μm and larger than 2.1 μm. Both and b for fog episode are smaller than those during haze and clear periods, implying more large particles in fog. Median fog and at 550 nm are 2690 and 446 Mm−1, which are higher than those in haze by factors of 6.3 and 4.7 and more than those for clear periods by factors of 14.2 and 7.6, respectively. Aerosol scattering during a fog episode undergoes a bigger increase than particle absorption, and this increase of scattering in fog is even higher than in haze. This may be associated with the hygroscopic growth of particle size due to high relative humidity in fog. Median ω0 values of 0.86, 0.82, and 0.76 at 550 nm and ΔF/δ values of −15.0, −14.0 and −10.0 W/m2 are seen over urban central China for fog, haze and clear periods, respectively. Aerosol radiative forcing efficiency during fog episodes is more negative than that in haze, emphasizing the significance of the outbreak of fog events on climate forcing.
Author Contributions
Conceptualization, X.Z.; methodology, X.Z.; validation, X.Z.; investigation, X.Z., Y.W., Y.Z., A.H., C.G., S.H. and M.M.; data curation, X.Z.; writing—original draft preparation, X.Z.; writing—review and editing, X.Z.; visualization, X.Z. All authors have read and agreed to the published version of the manuscript.
Funding
This work is financially supported by the National Natural Science Foundation of China (NSFC) (No. 41505127), and Innovation and entrepreneurship training program for College Students in Jiangsu Province (202113982003Y, XJDCZX202110300010, XJDCZX202110300005, XJDCZX202110300006).
Data Availability Statement
Data available on request due to their robustness and restrictions on public sharing.
Acknowledgments
The analysis and visualizations used in this study were produced with the Giovanni online data system, developed and maintained by the NASA Goddard Earth Sciences (GES) Data and Information Services Center (DISC). The authors gratefully acknowledge the NOAA Air Resources Laboratory (ARL) for the provision of the HYSPLIT transport and dispersion model and/or READY website (https://www.ready.noaa.gov (accessed on 24 November 2021)) used in this publication.
Conflicts of Interest
The authors declare no conflict of interest.
References
- Wærsted, E.G.; Haeffelin, M.; Dupont, J.-C.; Delanoe, J.; Dubuisson, P. Radiation in fog: Quantification of the impact on fog liquid water based on ground-based remote sensing. Atmos. Chem. Phys. 2017, 17, 10811–10835. [Google Scholar] [CrossRef] [Green Version]
- Haeffelin, M.; Bergot, T.; Elias, T.; Tardif, R.; Carrer, D.; Chazette, P.; Colomb, M.; Drobinski, P.; Dupont, E.; Dupont, J.C.; et al. PARISFOG: Shedding new light on fog physical processes. B Am. Meteorol. Soc. 2010, 91, 767–783. [Google Scholar] [CrossRef] [Green Version]
- Gultepe, I.; Pearson, G.; Milbrandt, J.A.; Hansen, B.; Platnick, S.; Taylor, P.; Gordon, M.; Oakley, J.P.; Cober, S.G. The fog remote sensing and modeling field project. B Am. Meteorol. Soc. 2009, 90, 341–359. [Google Scholar] [CrossRef]
- Barrado, A.I.; Garcia, S.; Sevillano, M.L.; Rodriguez, J.A.; Barrado, E. Vapor-phase concentrations of PAHs and their derivatives determined in a large city: Correlations with their atmospheric aerosol concentrations. Chemosphere 2013, 93, 1678–1684. [Google Scholar] [CrossRef]
- Boutle, I.; Price, J.; Kudzotsa, I.; Kokkola, H.; Romakkaniemi, S. Aerosol–fog interaction and the transition to well-mixed radiation fog. Atmos. Chem. Phys. 2018, 18, 7827–7840. [Google Scholar] [CrossRef] [Green Version]
- Intergovernmental Panel on Climate Change (IPCC). Climate Change 2013. The Physical Science Basis; Cambridge University Press: Cambridge, UK, 2013. [Google Scholar]
- Rajesh, T.A.; Ramachandran, S. Black carbon aerosols over urban and high altitude remote regions: Characteristics and radiative implications. Atmos. Environ. 2018, 194, 110–122. [Google Scholar] [CrossRef]
- Shi, C.; Roth, M.; Zhang, H.; Li, Z. Impacts of urbanization on long-term fog variation in Anhui Province, China. Atmos. Environ. 2008, 42, 8484–8492. [Google Scholar] [CrossRef]
- Quan, J.; Zhang, Q.; He, H.; Liu, J.; Huang, M.; Jin, H. Analysis of the formation of fog and haze in North China Plain (NCP). Atmos. Chem. Phys. 2011, 11, 8205–8214. [Google Scholar] [CrossRef] [Green Version]
- Zhang, S.T.; Niu, S.J. Haze-to-fog transformation during a long lasting, low visibility episode in Nanjing. J. Trop. Meteorol. 2016, 22, 67–77. [Google Scholar]
- Hammer, E.; Gysel, M.; Roberts, G.C.; Elias, T.; Hofer, J.; Hoyle, C.R.; Bukowiecki, N.; Dupont, J.-C.; Burnet, F.; Baltensperger, U.; et al. Size-dependent particle activation properties in fog during the ParisFog 2012/13 field campaign. Atmos. Chem. Phys. 2014, 14, 10517–10533. [Google Scholar] [CrossRef] [Green Version]
- Han, S.Q.; Wu, J.H.; Zhang, Y.F.; Cai, Z.Y.; Feng, Y.C.; Yao, Q.; Li, X.J.; Liu, Y.W.; Zhang, M. Characteristics and formation mechanism of a winter haze–fog episode in Tianjin, China. Atmos. Environ. 2014, 98, 323–330. [Google Scholar] [CrossRef]
- Guo, L.J.; Guo, X.L.; Fang, C.G.; Zhu, S.C. Observation analysis on characteristics of formation, evolution and transition of a long-lasting severe fog and haze episode in North China. Sci. China Earth Sci. 2015, 58, 329–344. [Google Scholar] [CrossRef]
- Huang, K.; Zhuang, G.; Wang, Q.; Fu, J.S.; Lin, Y.; Liu, T.; Han, L.; Deng, C. Extreme haze pollution in Beijing during January 2013: Chemical characteristics, formation mechanism and role of fog processing. Atmos. Chem. Phys. 2014, 14, 479–486. [Google Scholar]
- Gilardoni, S.; Massoli, P.; Giulianelli, L.; Rinaldi, M.; Paglione, M.; Pollini, F.; Lanconelli, C.; Poluzzi, V.; Carbone, S.; Hillamo, R.; et al. Fog scavenging of organic and inorganic aerosol in the Po Valley. Atmos. Chem. Phys. 2014, 14, 6967–6981. [Google Scholar] [CrossRef] [Green Version]
- Li, Y.J.; Lee, B.Y.L.; Yu, J.Z.; Ng, N.L.; Chan, C.K. Evaluating the degree of oxygenation of organic aerosol during foggy and hazy days in Hong Kong using high-resolution time-of-flight aerosol mass spectrometry (HR-ToF-AMS). Atmos. Chem. Phys. 2013, 13, 8739–8753. [Google Scholar] [CrossRef] [Green Version]
- Collett, J.L.; Herckes, P.; Youngster, S.; Lee, T. Processing of atmospheric organic matter by California radiation fogs. Atmos. Res. 2008, 87, 232–241. [Google Scholar] [CrossRef]
- Elbert, W.; Hoffmann, M.R.; Kramer, M.; Schmitt, G.; Andreae, M.O. Control of solute concentrations in cloud and fog water by liquid water content. Atmos. Environ. 2000, 34, 1109–1122. [Google Scholar] [CrossRef]
- Heintzenberg, J.; Cereceda-Balic, F.; Vidal, V.; Leck, C. Scavenging of black carbon in Chilean coastal fogs. Sci. Total Environ. 2016, 541, 341–347. [Google Scholar] [CrossRef]
- Zhu, J.; Zhu, B.; Huang, Y.; An, J.; Xu, J. PM2.5 vertical variation during a fog episode in a rural area of the Yangtze River Delta, China. Sci. Total Environ. 2019, 685, 555–563. [Google Scholar] [CrossRef]
- Bi, X.; Lin, Q.; Peng, L.; Zhang, G.; Wang, X.; Brechtel, F.J.; Chen, D.; Li, M.; Peng, P.; Sheng, G.; et al. In situ detection of the chemistry of individual fog droplet residues in the Pearl River Delta region, China. J. Geophys. Res. 2016, 121, 9105–9116. [Google Scholar] [CrossRef]
- Hao, T.; Han, S.; Chen, S.; Shan, X.; Zai, Z.; Qiu, X.; Yao, Q.; Liu, J.; Chen, J.; Meng, L. The role of fog in haze episode in Tianjin, China: A case study for November 2015. Atmos. Res. 2017, 194, 235–244. [Google Scholar] [CrossRef]
- Zhang, X.; Mao, M. Brown haze types due to aerosol pollution at Hefei in the summer and fall. Chemosphere 2015, 119, 1153–1162. [Google Scholar] [CrossRef]
- Cheng, Z.; Wang, S.; Jiang, J.; Fu, Q.; Chen, C.; Xu, B.; Yu, J.; Fu, X.; Hao, J. Long-term trend of haze pollution and impact of particulate matter in the Yangtze River Delta, China. Environ. Pollut. 2013, 182, 101–110. [Google Scholar] [CrossRef]
- Volckens, J.; Peters, T.M. Counting and particle transmission efficiency of the aerodynamic particle sizer. J. Aerosol Sci. 2005, 36, 1400–1408. [Google Scholar] [CrossRef]
- Anderson, T.L.; Ogren, J.A. Determining aerosol radiative properties using the TSI 3563 integrating nephelometer. Aerosol Sci. Technol. 1998, 29, 57–69. [Google Scholar] [CrossRef] [Green Version]
- Draxler, R.R.; Rolph, G.D. HYSPLIT (HYbrid Single-Particle Lagrangian Integrated Trajectory) Model Access via NOAA ARL READY Website; NOAA Air Resources Laboratory: College Park, MD, USA, 2013. Available online: https://www.arl.noaa.gov/HYSPLIT.php (accessed on 24 November 2021).
- Rolph, G.D. Real-time Environmental Applications and Display sYstem (READY) Website; NOAA Air Resources Laboratory: College Park, MD, USA, 2013. Available online: https://www.ready.noaa.gov (accessed on 24 November 2021).
- Acker, J.G.; Leptoukh, G. Online Analysis Enhances Use of NASA Earth Science Data. Eos. Trans. AGU 2007, 88, 14–17. [Google Scholar] [CrossRef]
- Li, W.J.; Shao, L.Y.; Buseck, P.R. Haze types in Beijing and the influence of agricultural biomass burning. Atmos. Chem. Phys. 2010, 10, 8119–8130. [Google Scholar] [CrossRef] [Green Version]
- Mao, M.; Sun, H.; Zhang, X. Air Pollution Characteristics and Health Risks in the Yangtze River Economic Belt, China during Winter. Int. J. Environ. Res. Public Health 2020, 17, 9172. [Google Scholar] [CrossRef]
- Che, H.; Zhang, X.; Xia, X.; Goloub, P.; Holben, B.; Zhao, H.; Wang, Y.; Zhang, X.; Wang, H.; Blarel, L.; et al. Ground-based aerosol climatology of China: Aerosol optical depths from the China Aerosol Remote Sensing Network (CARSNET) 2002–2013. Atmos. Chem. Phys. 2015, 15, 7619–7652. [Google Scholar] [CrossRef] [Green Version]
- Zhao, H.; Che, H.; Xia, X.; Wang, Y.; Wang, H.; Wang, P.; Ma, Y.; Yang, H.; Liu, Y.; Wang, Y. Multiyear Ground-Based Measurements of Aerosol Optical Properties and Direct Radiative Effect Over Different Surface Types in Northeastern China. J. Geophys. Res. 2018, 123, 13887–13916. [Google Scholar] [CrossRef]
- Zhang, X.; Huang, Y.; Rao, R. Aerosol characteristics including fumigation effect under weak precipitation over the southeastern coast of China. J. Atmos. Sol.-Terr. Phys. 2012, 84, 25–36. [Google Scholar] [CrossRef]
- Herckes, P.; Marcotte, A.R.; Wang, Y.; Collett, J.L. Fog composition in the Central Valley of California over three decades. Atmos. Res. 2015, 151, 20–30. [Google Scholar] [CrossRef]
- Li, W.; Zhou, S.; Wang, X.; Xu, Z.; Yuan, C.; Yu, Y.; Zhang, Q.; Wang, W. Integrated evaluation of aerosols from regional brown hazes over northern China in winter: Concentrations, sources, transformation, and mixing states. J. Geophys. Res. 2011, 116, D09301. [Google Scholar] [CrossRef]
- Izhar, S.; Gupta, T.; Panday, A.K. Scavenging efficiency of water soluble inorganic and organic aerosols by fog droplets in the Indo Gangetic Plain. Atmos. Res. 2020, 235, 104767. [Google Scholar] [CrossRef]
- Keywood, M.D.; Ayers, G.P.; Gras, J.L.; Boers, R.; Leong, C.P. Haze in the Klang Valley of Malaysia. Atmos. Chem. Phys. 2003, 3, 591–605. [Google Scholar] [CrossRef] [Green Version]
- Ma, N.; Zhao, C.S.; Nowak, A.; Muller, T.; Pfeifer, S.; Cheng, Y.F.; Deng, Z.Z.; Liu, P.F.; Xu, W.Y.; Ran, L.; et al. Aerosol optical properties in the North China Plain during HaChi campaign: An in-situ optical closure study. Atmos. Chem. Phys. 2011, 11, 5959–5973. [Google Scholar] [CrossRef]
- Ramanathan, V.; Raman, M.V.; Roberts, G.; Kim, D.; Chung, C.; Winker, D. Warming trends in Asia amplified by brown cloud solar absorption. Nature 2007, 448, 575–578. [Google Scholar] [CrossRef]
- Cheng, Y.F.; Berghof, M.; Garland, R.M.; Wiedensohler, A.; Wehner, B.; Muller, T.; Su, H.; Zhang, Y.H.; Achtert, P.; Nowak, A.; et al. Influence of soot mixing state on aerosol light absorption and single scattering albedo during air mass aging at a polluted regional site in northeastern China. J. Geophys. Res. 2009, 114, D00G10. [Google Scholar] [CrossRef]
- Delene, D.J.; Ogren, J.A. Variability of Aerosol Optical Properties at Four North American Surface Monitoring Sites. J. Atmos. Sci. 2002, 59, 1135–1150. [Google Scholar] [CrossRef]
- Randles, C.A.; Russell, L.M.; Ramaswamy, V. Hygroscopic and optical properties of organic sea salt aerosol and consequences for climate forcing. Geophys. Res. Lett. 2004, 31, L16108. [Google Scholar] [CrossRef]
- Dinar, E.; Riziq, A.A.; Spindler, C.; Erlick, C.; Kiss, G.; Rudich, Y. The complex refractive index of atmospheric and model humic-like substances (HULIS) retrieved by a cavity ring down aerosol spectrometer (CRD-AS). Faraday Discuss 2008, 137, 279–295. [Google Scholar] [CrossRef]


Publisher’s Note: MDPI stays neutral with regard to jurisdictional claims in published maps and institutional affiliations. |
© 2022 by the authors. Licensee MDPI, Basel, Switzerland. This article is an open access article distributed under the terms and conditions of the Creative Commons Attribution (CC BY) license (https://creativecommons.org/licenses/by/4.0/).