Error in Figures
In the original publication [1], there was a mistake in Figures 4–7 as published. In these four Figures, the legend is missing. The corrected Figure 4, Figure 5, Figure 6 and Figure 7 appear below. The authors apologize for any inconvenience caused and state that the scientific conclusions are unaffected. This correction was approved by the Academic Editor. The original publication has also been updated.
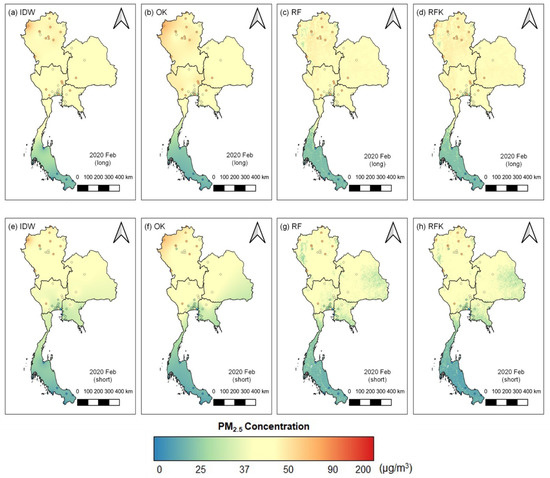
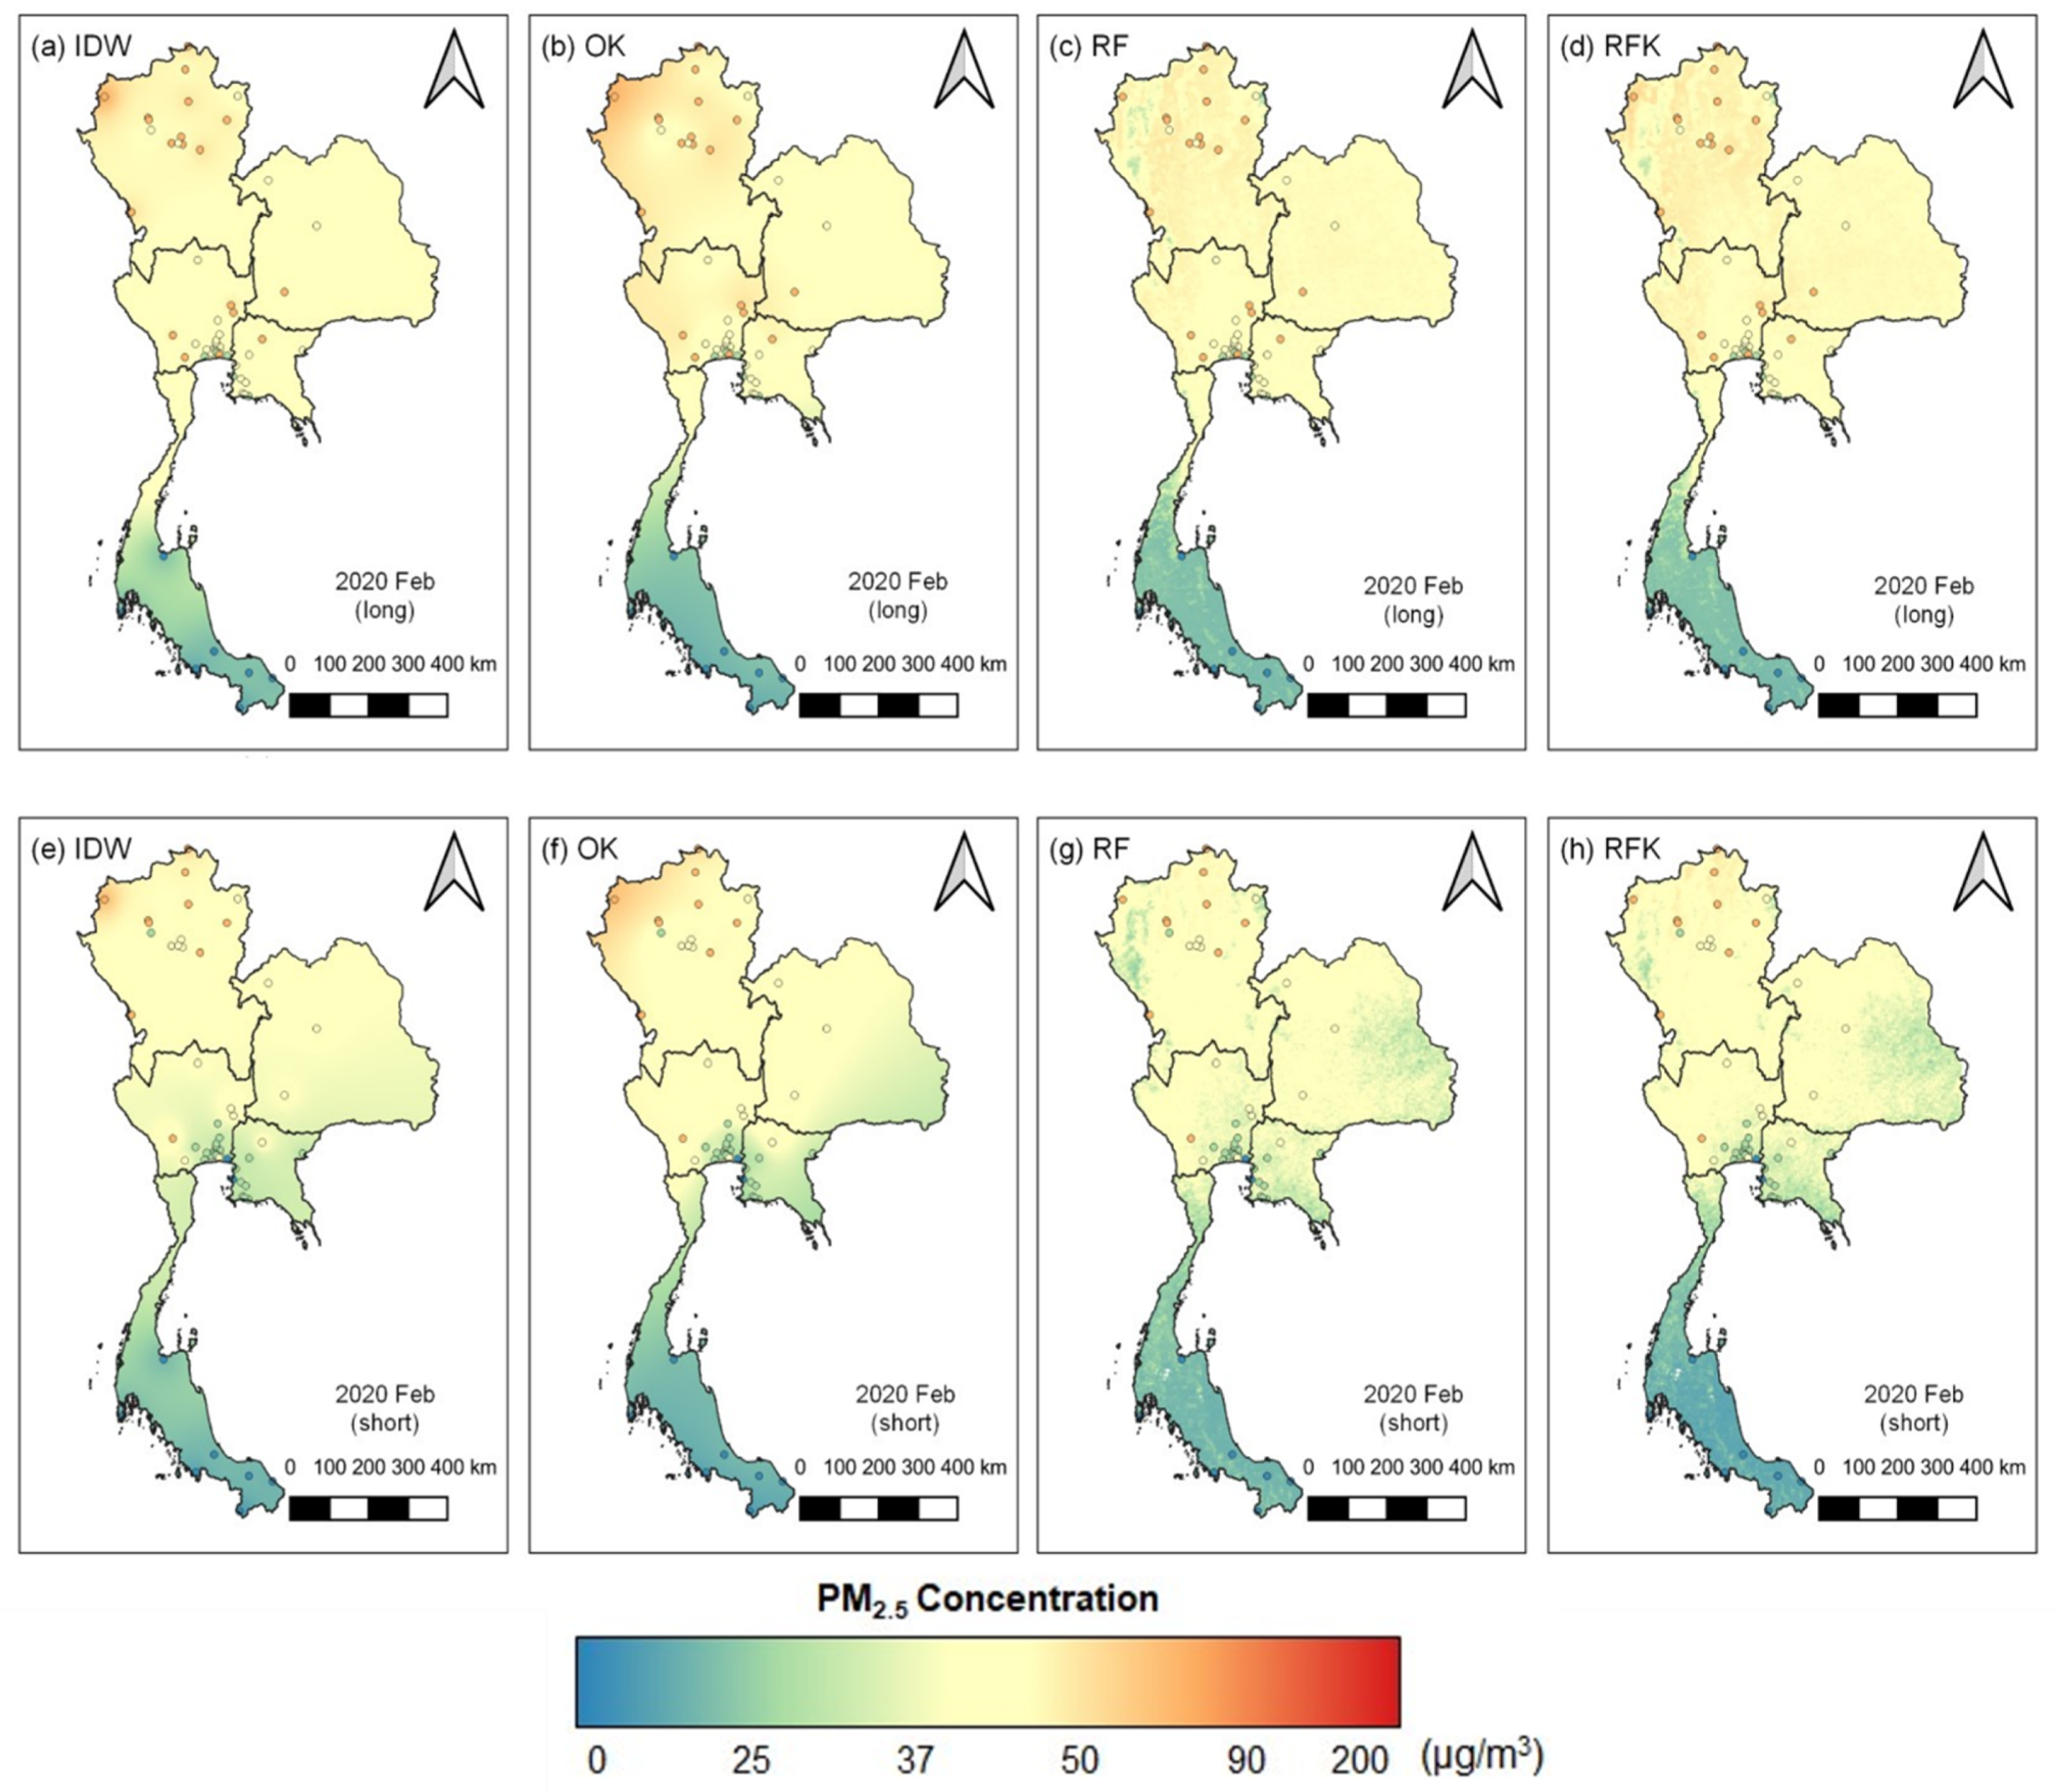
Figure 4.
Interpolated PM2.5 concentrations from different spatial interpolation methods (a–d) from 1–29 February and (e–h) from 8–18 February.
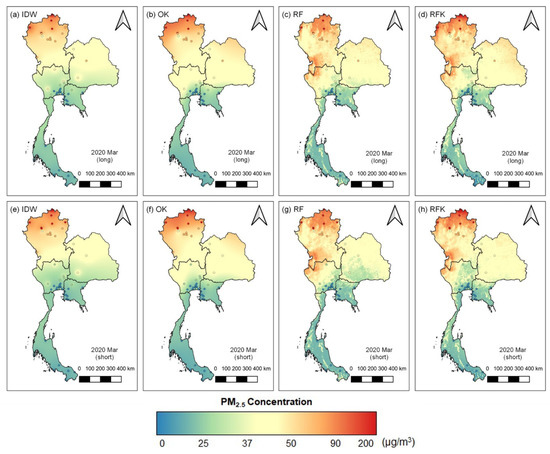
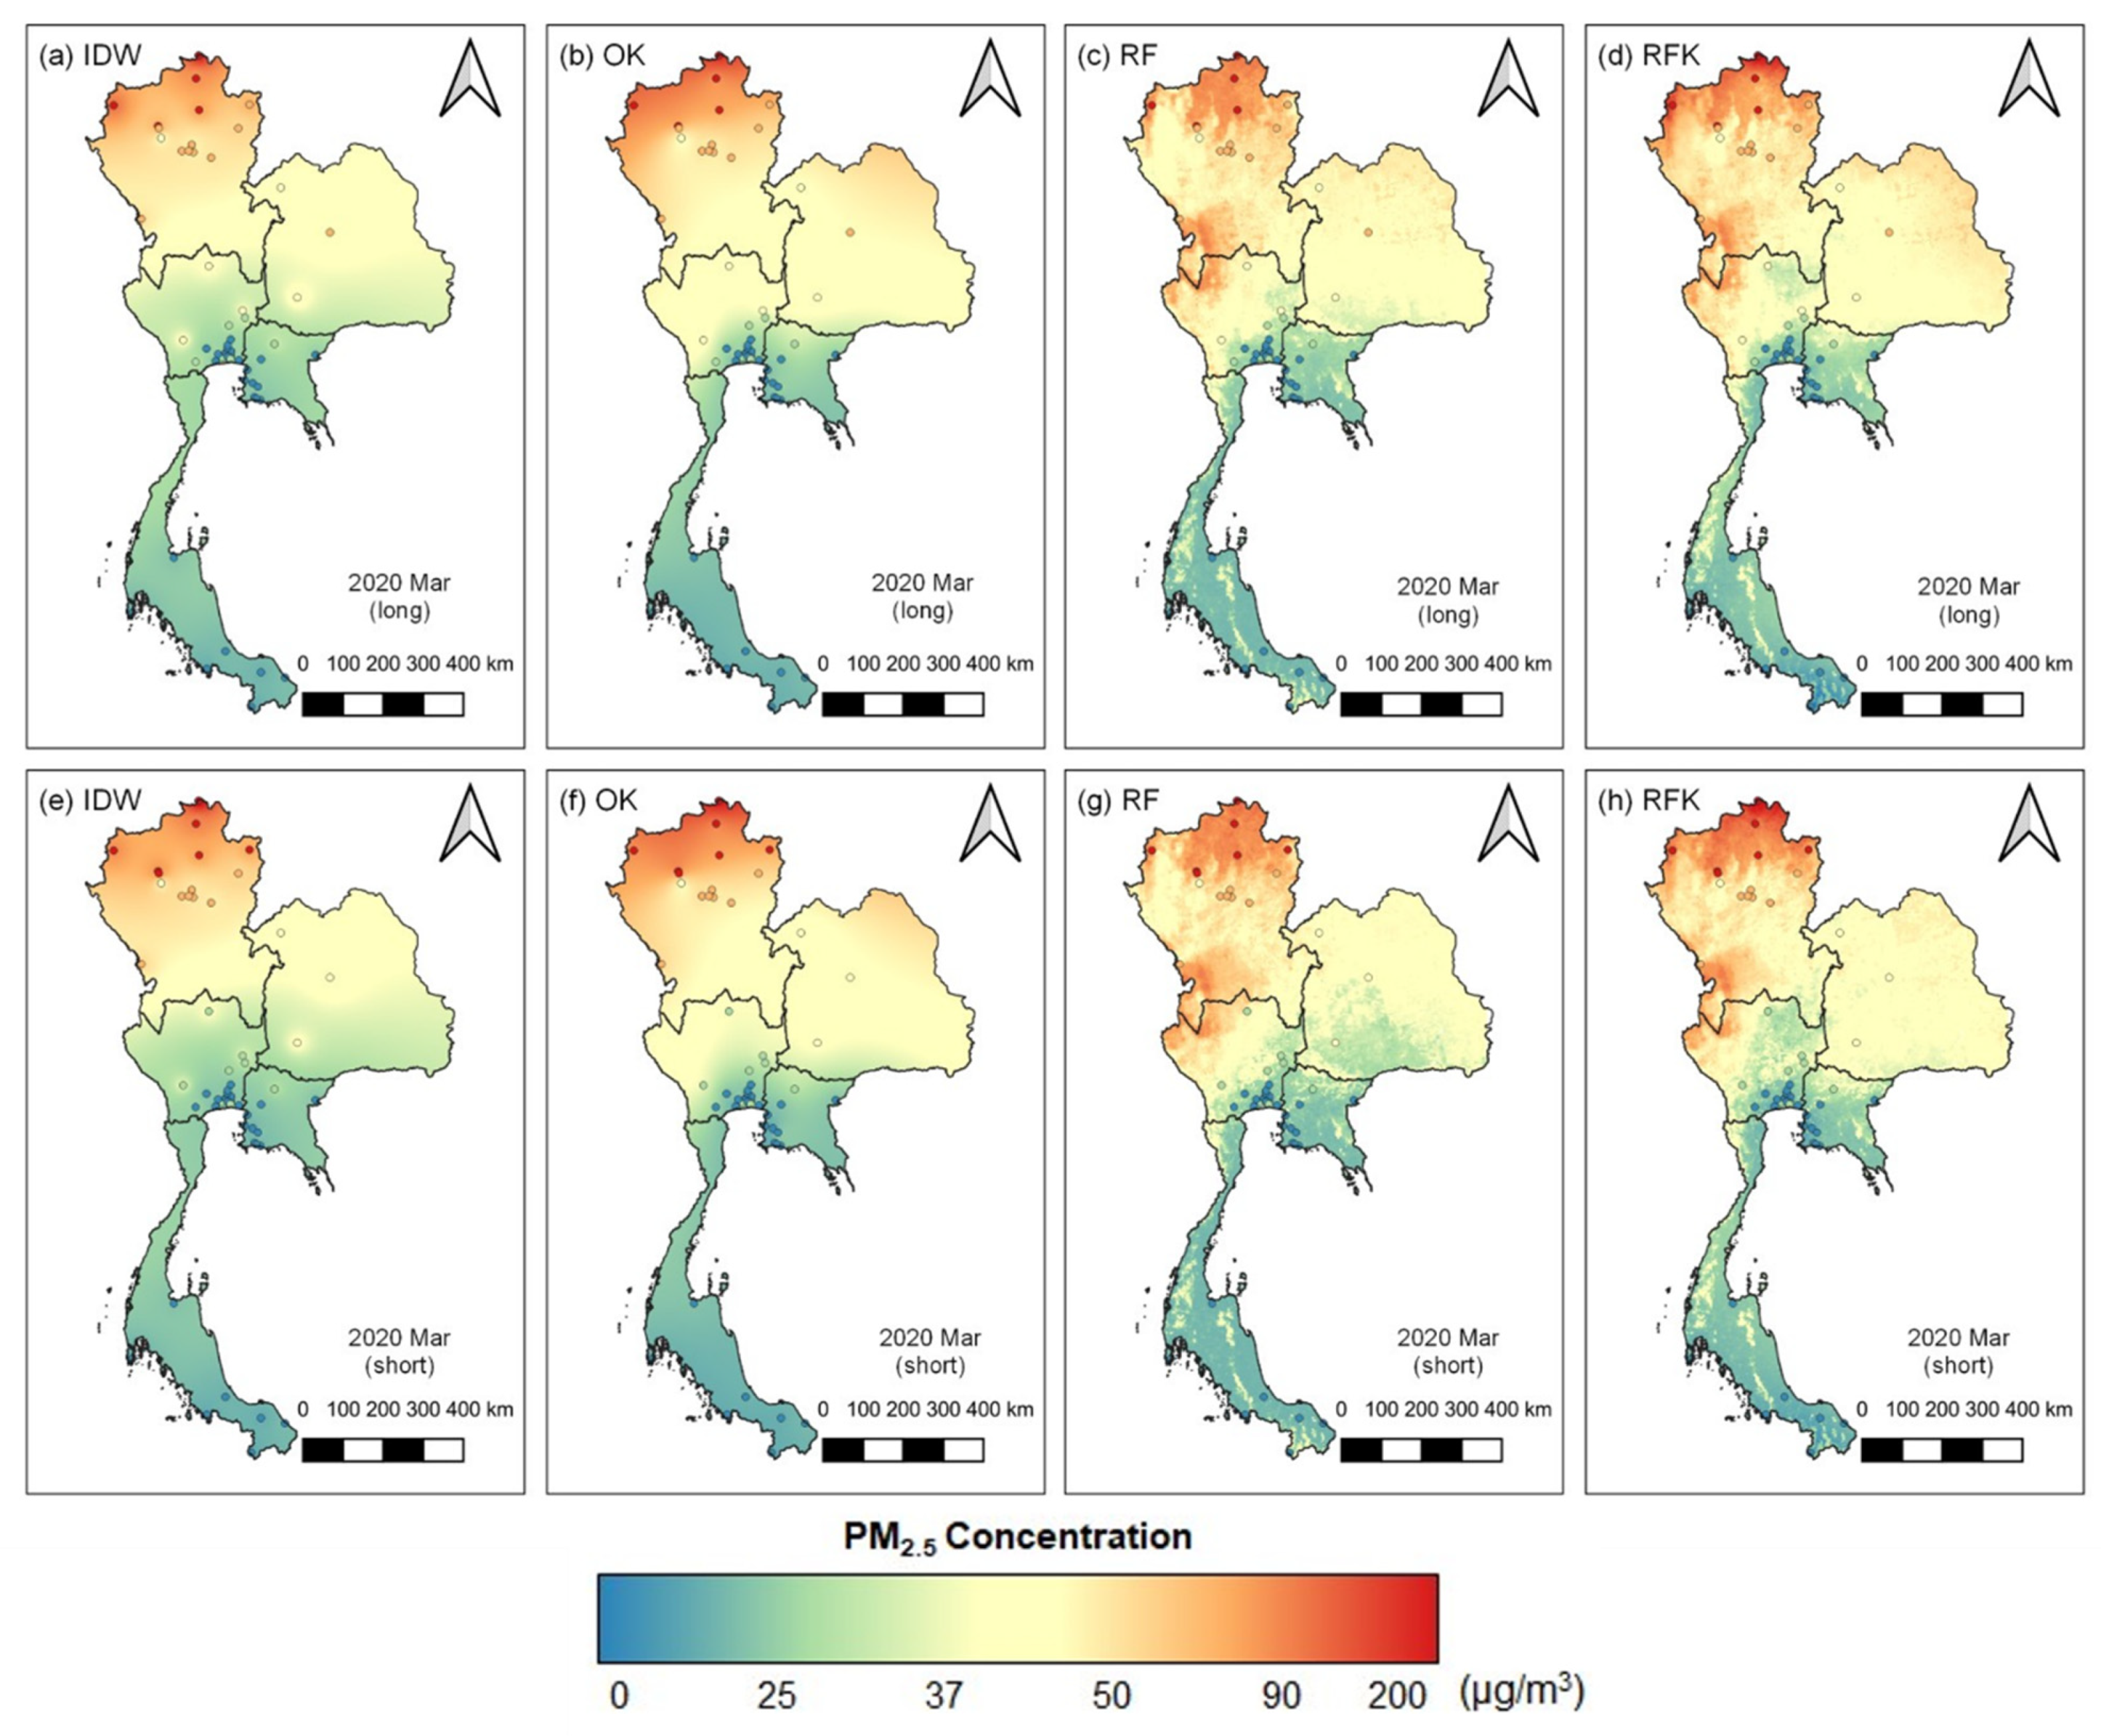
Figure 5.
Interpolated PM2.5 concentrations from different spatial interpolation methods (a–d) from 1–31 March and (e–h) from 19–29 March.
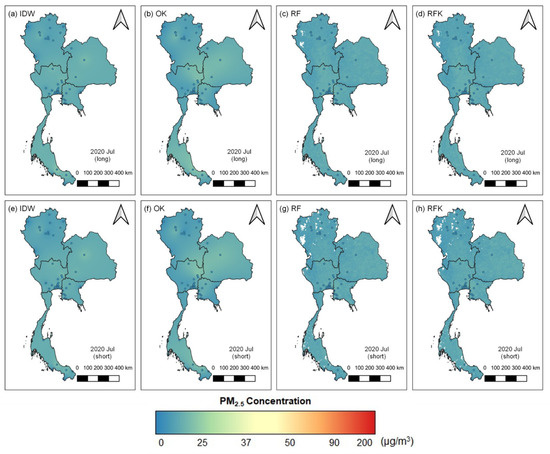
Figure 6.
Interpolated PM2.5 concentrations from different spatial interpolation methods (a–d) from 1–30 July and (e–h) from 9–19 July.
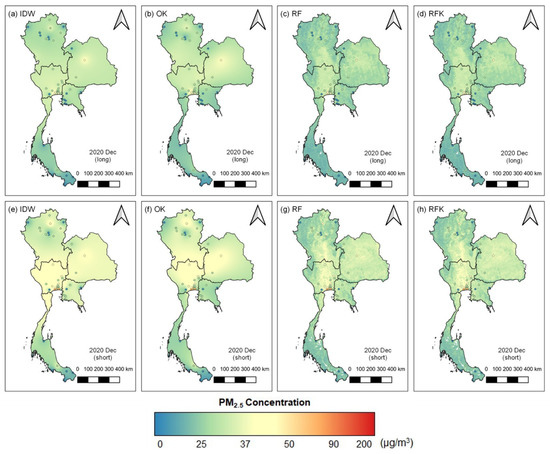
Figure 7.
Interpolated PM2.5 concentrations from different spatial interpolation methods (a–d) from 1–31 December and (e–h) from 5–15 December.
Reference
- Han, S.; Kundhikanjana, W.; Towashiraporn, P.; Stratoulias, D. Interpolation-Based Fusion of Sentinel-5P, SRTM, and Regulatory-Grade Ground Stations Data for Producing Spatially Continuous Maps of PM2.5 Concentrations Nationwide over Thailand. Atmosphere 2022, 13, 161. [Google Scholar] [CrossRef]


Publisher’s Note: MDPI stays neutral with regard to jurisdictional claims in published maps and institutional affiliations. |
© 2022 by the authors. Licensee MDPI, Basel, Switzerland. This article is an open access article distributed under the terms and conditions of the Creative Commons Attribution (CC BY) license (https://creativecommons.org/licenses/by/4.0/).