Article

The Effects of Lake Level and Area Changes of Poyang Lake on the Local Weather

1
Key Laboratory of Land Surface Process and Climate Change in Cold and Arid Regions, Northwest Institute of Eco-Environment and Resources, Chinese Academy of Sciences, Lanzhou 730000, China
2
University of Chinese Academy of Sciences, Beijing 100049, China
3
Institute of Atmospheric Sciences, Department of Atmospheric and Oceanic Sciences, Fudan University, Shanghai 200438, China
4
Shanghai Frontiers Science Center of Atmosphere—Ocean Interaction, Fudan University, Shanghai 200438, China
*
Author to whom correspondence should be addressed.
Atmosphere 2022, 13(9), 1490; https://doi.org/10.3390/atmos13091490
Submission received: 2 August 2022 / Revised: 8 September 2022 / Accepted: 8 September 2022 / Published: 13 September 2022
(This article belongs to the Special Issue The Water Cycle and Climate Change)

Abstract

:
Poyang Lake is the largest freshwater lake in China and is characterized by significant intra-annual variation, with higher water levels and area in the wet season compared to the dry season. However, the effects of the seasonal variation in Poyang Lake on the local weather are still not well-recognized. With the help of the weather research and forecasting (WRF) model, we designed one control experiment (CTL) using the default Poyang Lake level and area data and two sensitivity experiments, EXPT1 and EXPT2, the former representing the higher lake level and the greater area of Poyang Lake in the wet season and the latter representing the lower lake level and the smaller area of Poyang Lake in the dry season, to assess how these changes affect the local weather. The results of EXPT1 show that, as the lake’s level and area increase, the latent heat flux (LH), the sensible heat flux (SH), and the land surface temperature (LST) in the lake area decrease compared to those of the CTL. Meanwhile, the planetary boundary layer height (PBL), the convective available potential energy (CAPE), the wind speed, and the vapor flux over the lake decrease as well, indicating increased atmospheric stratification stability and resulting in a domain-averaged decline in precipitation of −22.3 mm. However, the low lake level and less area in EXPT2 show increasing SH, LST, PBL, and wind speed, and decreasing LH and CAPE compared to those of the CTL. The increasing SH and weakened atmospheric stratification stability in EXPT2 cause a significantly higher wind speed over the eastern part of the lake. As a result, more water vapor is transported to the east side of the lake by westerly upper winds, leading to a decreasing precipitation on the western side of the lake and a slightly increasing precipitation on the eastern side, resulting ultimately in a domain-averaged decline in precipitation of −23.8 mm in the simulation of the low level and less area of Poyang Lake. Although the LH and CAPE decline both in EXPT1 and EXPT2, the main cause is the higher water thermal capacity and lower lake-surface temperature with more lake water for EXPT1 and the lower evaporation with less lake water for EXPT2. Overall, a deeper and larger Poyang Lake will reduce the local temperature, inhibit water evaporation from the lake surface, and make the near-surface atmosphere more stable, resulting in restrained local precipitation. A shrinking lake level and area will raise the local temperature and the instability of the near-surface atmosphere but reduce water vapor and enlarge local wind and circulation, resulting in declining precipitation and a changing fall zone.

1. Introduction

Lakes cover only 3.7% of the global land area but are an important component of the landscape, playing a key role in local water cycles and regional climates [1,2]. Lakes have lower albedo, surface roughness, and a higher heat capacity relative to the land surface and so can substantially adjust the near-surface energy budget. These characteristics make the lake–atmosphere interactions significantly different from the land–atmosphere interactions in terms of local circulation and energy balance, as well as the effects on the local weather and climate [3,4,5,6]. Lakes can also affect the movement and intensity of transiting weather systems, influencing the spatiotemporal distribution of precipitation [7,8,9]. This phenomenon occurs not only because of large and deep lakes but also because of small lakes [10,11]. Therefore, with the significant increase in extreme weather in recent years calling for urgent attention to regional weather, it is important to understand the effects and mechanisms of a lake on the local weather to better understand and forecast the regional weather in lake areas.
With the help of models such as the land surface model (LSM), the advanced regional prediction system (ARPS), and the weather research and forecasting (WRF) model, researchers have carefully studied the impact of lakes on local weather. For example, Nam Co Lake is found to have a cooling effect on the air temperature in July–August and a heating effect on the air temperature in November–December [12,13]. In addition to influencing land surface, lakes have been found to enhance the downwind precipitation [14,15] since lakes also supply sufficient water vapor to the near-surface atmosphere [16,17]. During the late fall and winter, in the Great Lakes region of North America, lakes can warm and humidify the boundary layer atmosphere, which causes precipitation near the lakes [11,18]. Steiner et al. found that an increasing lake surface temperature results in the expansion of the lake-effect snowfall area both along and downwind of the lakeshore [19]. On increasing the lake surface temperature by 3 K in their model, Gohm and Umek noticed a significant rise in precipitation produced by the interaction effect of the lake and neighboring mountains [20].
For lakes that are highly affected by climate change and anthropogenic influences, the weather impact on the local area when the lake level and area change is also of concern. The desiccation of Aral Sea and Lake Chad in Africa has led to an increase in surface temperatures and a more unstable boundary layer in summer, while evaporation has increased in the Aral Sea and decreased in Lake Chad [21,22]. In China, in the wet season, Poyang Lake shows a decreasing Bowen ratio with the increase in the lake level [23]. The application of additional water through irrigation can significantly alter the heat and moisture balance, which is similar to changes in the lake area. Numerous studies have concluded that when the irrigated area increases, the latent heat in the irrigated area increases and the surface temperature, the wind speed, and the planetary boundary layer height decrease [24,25,26]. However, there are few studies on the impact of a lake’s intra-annual level and area change on the local weather and climate.
Poyang Lake is a typical puff-type seasonal lake and the largest freshwater lake in China. The water budget of Poyang Lake is mainly controlled by precipitation and river runoff. The lake is affected by subtropical monsoon, and 55% of the annual precipitation is mostly from March to June, resulting in large intra-annual fluctuations in lake water [27,28]. According to the work of You et al., Poyang Lake has significant intra-annual variations, as we noticed. The water level of Poyang Lake drops to its lowest in winter. With the increase in precipitation and the inflow of tributaries in spring and summer, the lake level rises gradually to the maximum [29]. The area of Poyang Lake is the smallest in January and the largest in July, increasing from January to July and decreasing from August to January [30]. Thus, the changes in the level and area of Poyang Lake should have a non-negligible impact on local weather, but this has not been studied yet. Apart from the seasonal variation, the average water level and area of Poyang Lake have declined in the past decades [30,31,32], mainly because of a change in the precipitation and runoff from the Yangtze River [33,34,35]. Its annual average surface area shrank by 226 km2 in 2000–2010 compared to that in 1991–2000 because of a lack of water. According to Feng et al. [36], the inundation area in Poyang Lake changed from 714.1 km2 in October 2009 to 3162.9 km2 in August 2010. Since the 1990s, the temperature and precipitation in Poyang Lake have increased significantly [27,37]. Based on data from the meteorological stations in Poyang Lake, Tao et al., found that the daily minimum temperature increased significantly during 1959–2010 [38]. Extreme precipitation also intensified during 1960–2012 [39,40]. With the changes in temperature and precipitation in the Poyang Lake area in recent decades, the presence of Poyang Lake will increase lake–land temperature, which is conducive to generating a land–lake breeze and enhancing the convergence [41]. Zou et al. increased the land surface temperature over Poyang Lake in the WRF model and found that the lake-effect convection strengthens [42].
Previous studies have mainly paid attention to the influence of the inter-annual variations in Poyang Lake. The difference in the water level and area of Poyang Lake in the dry and wet seasons is large, and the resulting change of local heat and moisture is worthy of attention. For example, flooding occurred in the Poyang Lake area in 2018 because of heavy precipitation in a short amount of time. In 2022, Poyang Lake entered the dry season on 19 August, the earliest time in a year for the lake to have entered the dry season since 1951 when lake information began to be recorded. Therefore, it will be meaningful to assess its influence on local weather by analyzing its characteristics in the WRF model in the dry and wet seasons. The goal of this research is to access and compare the effects of the intra-annual variations in Poyang Lake, including the water levels and areas, on the regional weather and climate using sensitivity experiments in different lake conditions. Section 2 describes the study area, data, and the model configuration used in this study. In Section 3, we mainly analyze the simulation results of the local weather affected by the different Poyang Lake levels and areas and explain their main mechanisms. Discussions are provided in Section 4, and conclusions are given in Section 5.

2. Study Area, Data, and Model Configuration
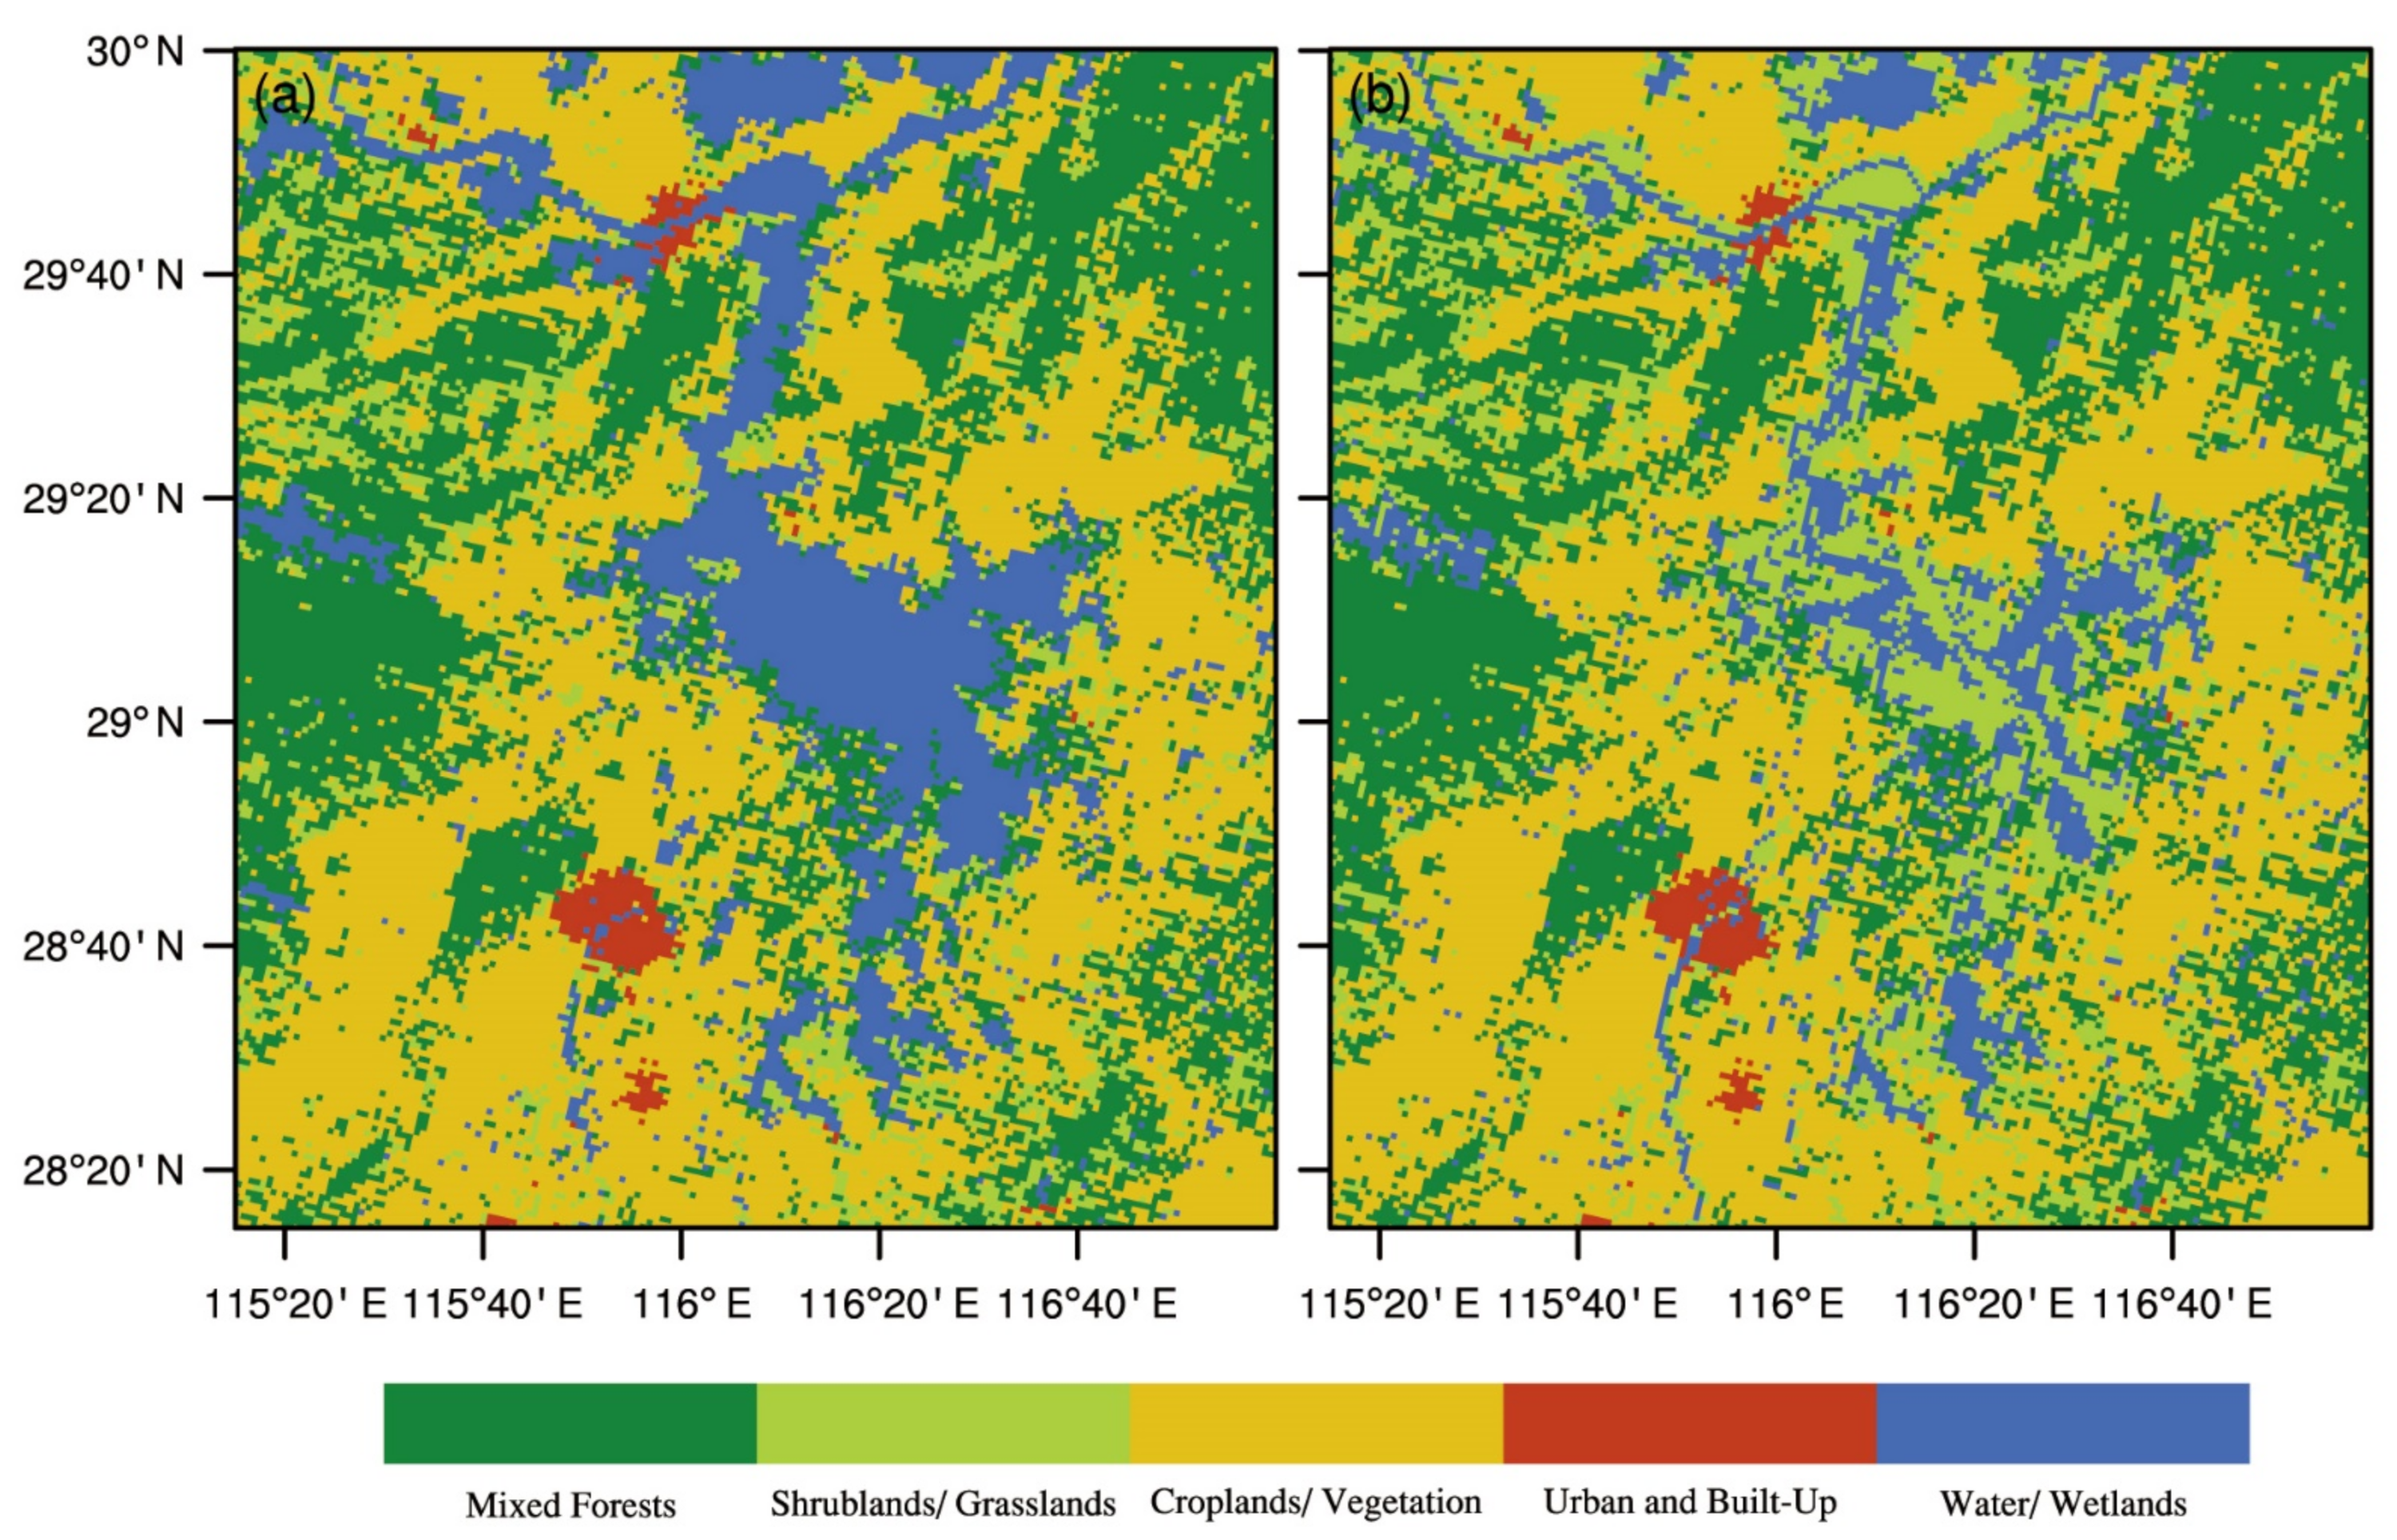
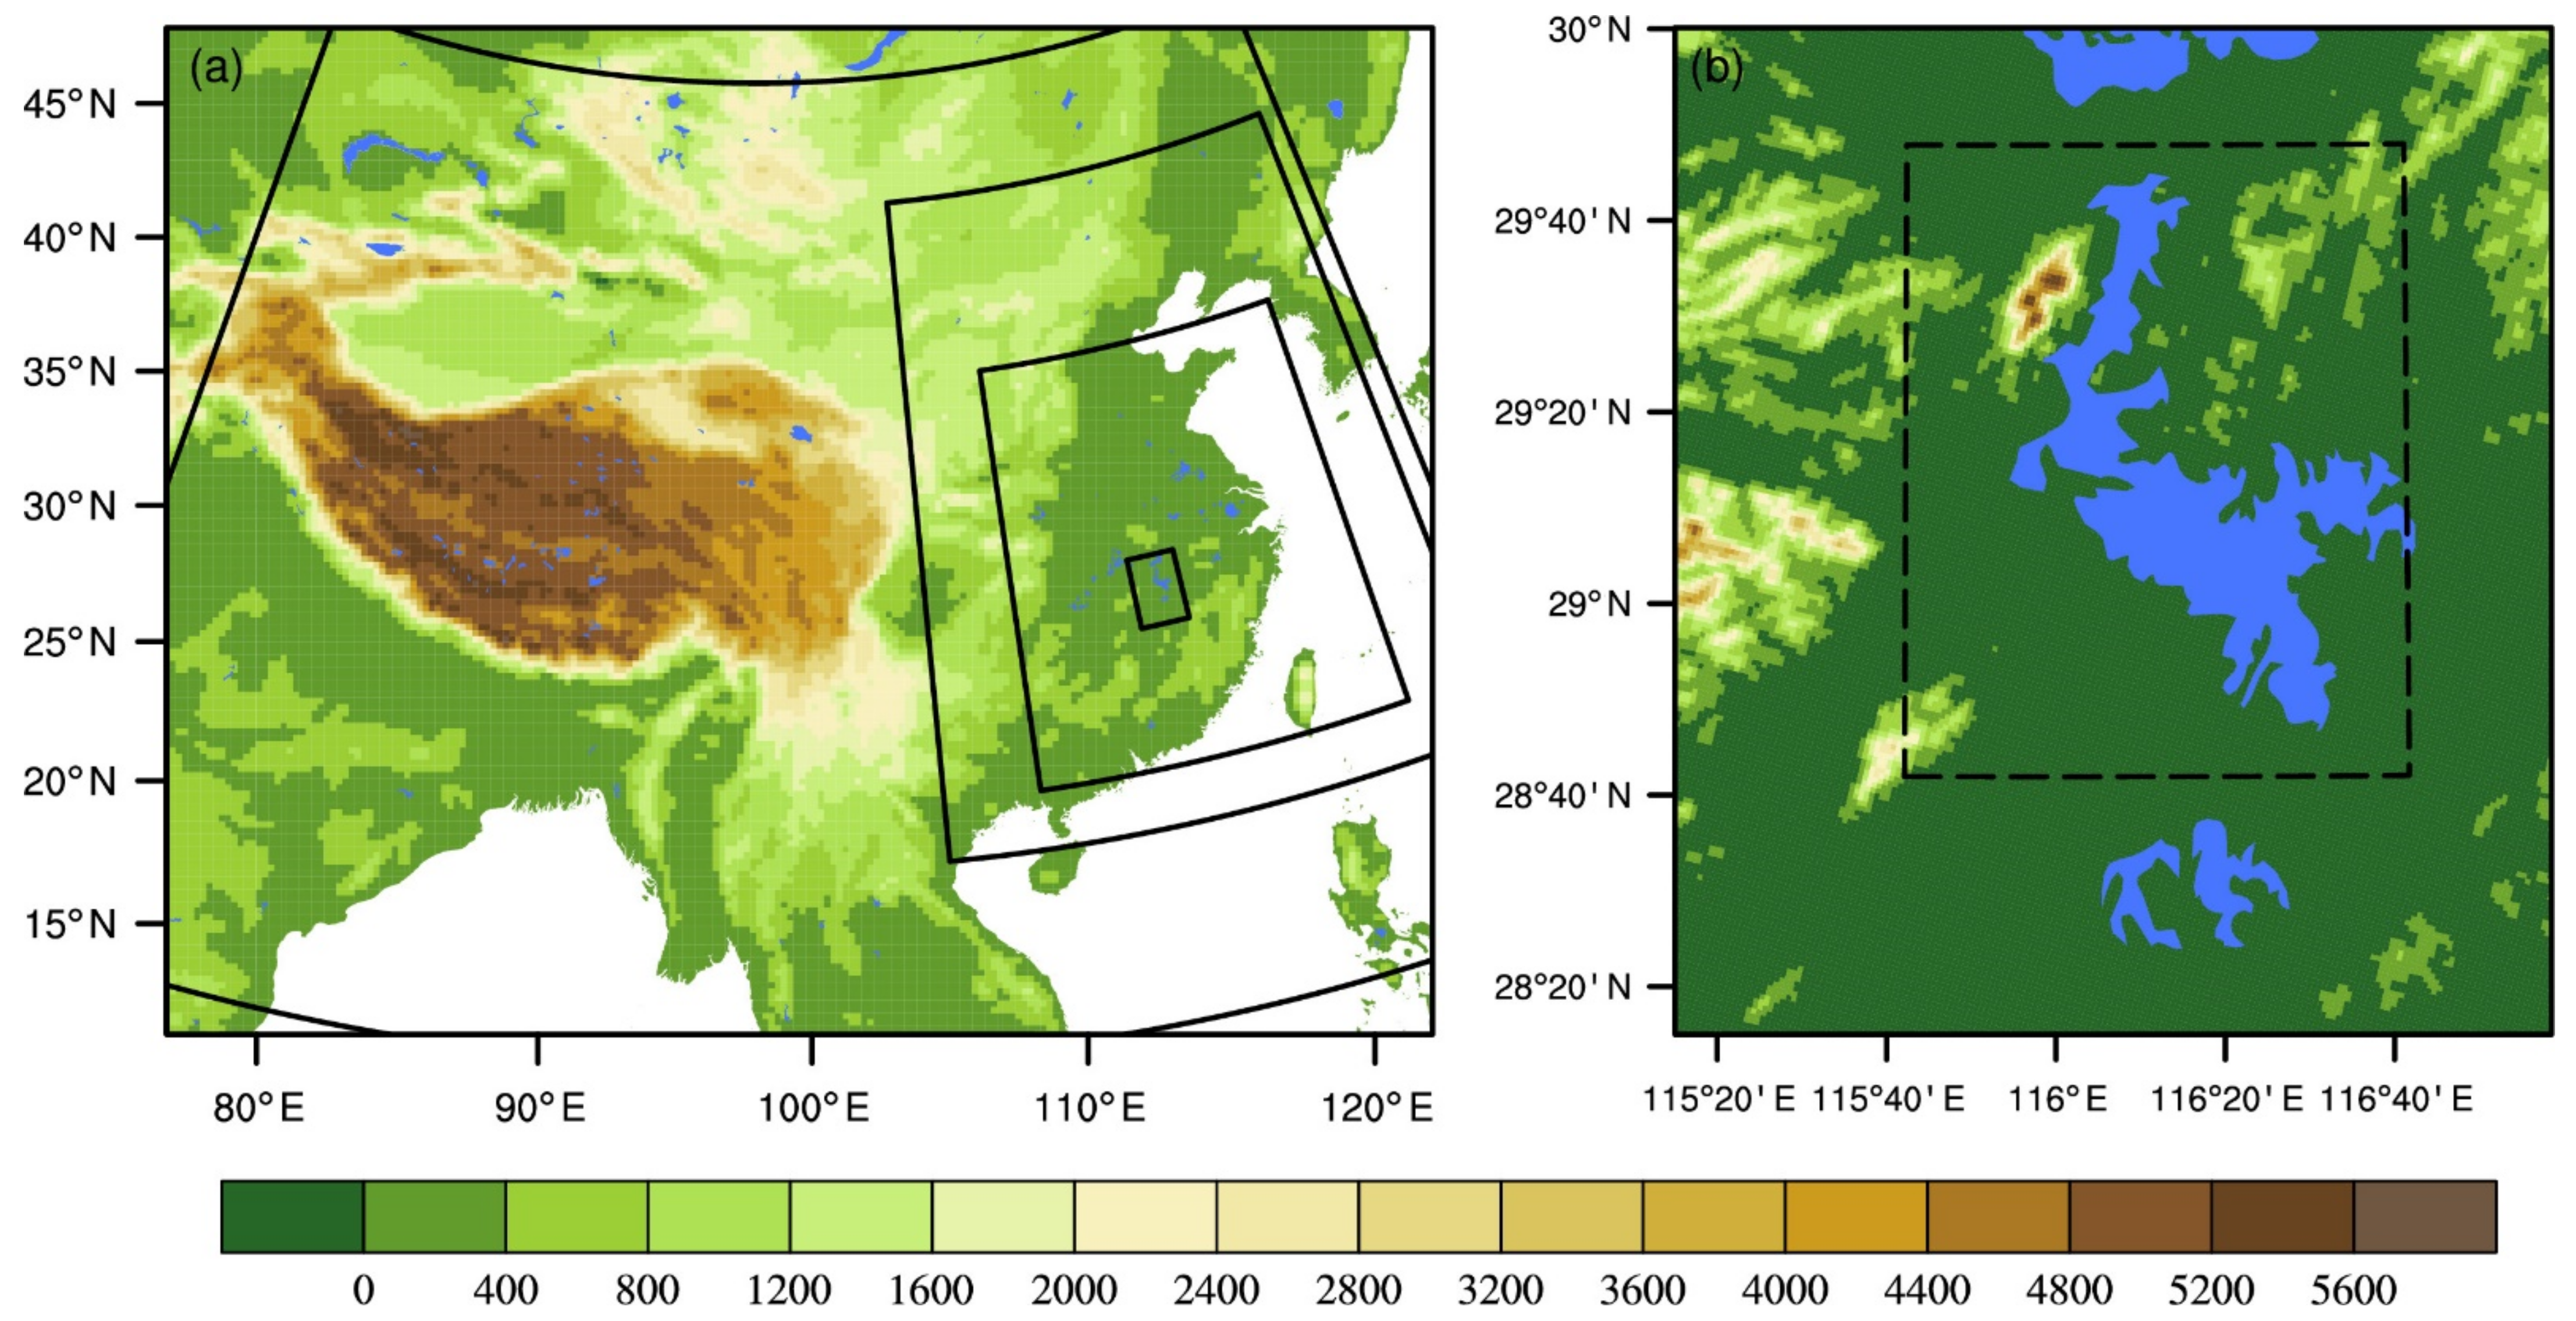
2.1. Study Area

Located in south-central China, Poyang Lake (28°25′–29°45′ N, 115°50′–116°45′ E) is the largest freshwater lake in China and the main tributary of the middle and lower reaches of the Yangtze River. It is also one of China’s most important wetlands, with a diverse ecosystem and many biological resources. As a puff-type seasonal lake, its water budget is mainly controlled by precipitation and runoff from five important tributaries: Raohe River, Xinjiang River, Fuhe River, Ganjiang River, and Xiushui River. The dry season of Poyang Lake is generally from October to March, while the wet season is from April to September. According to Zhang et al., since the 1950s, the highest water level recorded at the Hukou Hydrological Station was 22.59 m, on 31 July 1998, corresponding to a lake inundation area of about 4500 km2 [43]. The lowest lake level was 5.9 m, on 6 February 1963, corresponding to a lake area of 146 km2.

2.2. Data

The Poyang Lake area data used in this study are from the Global Surface Water Explorer (GSW) dataset [44]. The GSW is a set of global-scale continuous surface-water change datasets developed by Pekel et al., using millions of remote sensing images generated by the Landsat satellites [44]. The GSW is updated every year and includes the seasonal variation characteristics of the water basin. In this work, we used the GSW from 2018 to study the influence of the intra-annual variations in Poyang Lake on meteorological conditions.
Figure 1 shows the maximum and minimum lake areas of Poyang Lake in 2018, extracted from the GSW and the land-use map of surrounding areas. It shows that in 2018, compared with the wet season (3175 km2), the lake area in the dry season (1873 km2) had shrunk by 59%. As the lake shrank, the lake surface was gradually covered by grass, until the lake was re-inundated in the following year.
The Poyang Lake levels (Hukou station, Hubei, China) of 2018 were obtained from the Water Information Annual Report of the Ministry of Water Resources of China (available online: https://global-surface-water.appspot.com/#data (accessed on 1 August 2022). The data show that, in 2018, the highest lake level was 17.16 m, on 20 July, and the lowest lake level was 7.59 m, on 1 January, a difference of about 10 m.

2.3. Model Configuration

Developed by the National Center for Atmospheric Research (NCAR), the WRF model is widely used in operational meteorological forecasting and research [45]. The WRF is a fully compressible, non-hydrostatic, and terrain-following coordinate model that offers a variety of parameterization schemes. After years of development and improvement by many researchers, the WRF has been used in the study of complex mesoscale and small-scale landscapes, different geographical features, and meteorological and climate processes. Its lake module is from the CLM 4.5 model, developed and evaluated by Subin et al. [46] and Gu et al. [47]. The lake module mainly includes three parts in terms of computation: the heat flux and temperature on the lake surface, the mixing inside the lake, and the phase transition of the lake. By taking phase transition calculations into account, the model can theoretically simulate the interaction between the lake and the atmosphere under different conditions.
In this study, we used the WRF version 3.8 model for our simulations. The simulations use four layers of nested grids, and the horizontal resolutions are 27 km, 9 km, 3 km, and 1 km. Figure 2 shows the simulation area and terrain conditions overlaying the lake area. The horizontal grid points from the coarsest resolution (domain 1) to the finest resolution (domain 4) are 207 × 165, 238 × 334, 508 × 660, and 217 × 316. In addition, WRF pressure is divided into 30 layers in the vertical direction. The simulation period is from 28 June 2018 to 31 July 2018. Domain 4 is used to evaluate simulation results.
Following the research of Li and Gao [48], we used the following physics parameterizations after proper modification to fit the simulation of Poyang Lake: the WRF double-moment 6-class scheme [49] for microphysics, the RRTMG scheme [50] for both longwave and short wave radiation, the Noah land surface model [51] for land surface, the Yonsei University scheme [52] for the planetary boundary layer, and Grell–Devenyi [53] for cumulus parameterization (for two outer domains).
The forcing data are the National Centers for Environmental Prediction Global Final Analysis data (NCEP-FNL, available online: http://rda.ucar.edu/datasets/ds083.2/ (accessed on 1 August 2022)) with a 1° × 1° horizontal resolution and a 6 h temporal resolution. The Global Data Assimilation System (GDAS) generates the NCEP-FNL dataset by continuously collecting observational data from the Global Telecommunication System (GTS) and other data sources.
In the WRF model, the lake level and area were prescribed. The default data were derived from the 2001 Moderate Resolution Imaging Spectroradiometer (MODIS) satellite. In 2018, the lake level in the default data was 8.4 m and the lake area was 2970 km2, which is 6% smaller than that in the wet season and 37% larger than that in the dry season. In this study, the water level and area of Poyang Lake using the default conditions in the WRF model was the control experiment (CTL). Considering the seasonal variability in Poyang Lake, two sensitive experiments were designed to study the local weather effects of the Poyang Lake landscape changes. The first one (EXPT1) set the lake level to 17.16 m and the area as 3175 km2 (Figure 1a), which was the maximum value in July 2018. The second one (EXPT2) set the lake level to 7.59 m and the area as 1873 km2 (Figure 1b), which was the minimum value in 2018. For the shrunk-lake land surface, the vegetation type was set to grass, according to Hui et al. [54].
Since the maximum lake level of Poyang Lake in 2018 was in July, July 2018 was selected as the simulation period. Although the lowest water level and the smallest water area in Poyang Lake was in January, we still used the simulation period of July 2018 for EXPT2 to better compare the differences between the three experiments (one control experiment and two sensitivity experiments) and their influence on same local weathers and precipitation events. Given the default representing a shallow Poyang Lake, the difference between EXPT1 and the CTL mainly denotes the impacts of lake level increase (8.4 m in the CTL compared to 17.16 m in EXPT1). However, the difference between EXPT2 and the CTL mainly denotes the impacts of lake area reduction (2970 km2 in the CTL compared to 1873 km2 in EXPT2).

2.4. Reference Datasets

The surface air temperature gridded dataset obtained from the National Climate Center (CMA) was used to evaluate the simulation results. It is a daily 0.5° × 0.5° resolution dataset from January 1961, produced by spatial interpolation of the in situ observation data from 2472 national surface meteorological stations in China using the thin plate spline method combined with three-dimensional geospatial information. The hourly precipitation grid dataset of the China automatic station and CMORPH merged data (CMORPH-M) was from the National Meteorological Data Center with a spatial resolution of 0.1° × 0.1°. This dataset merged the precipitation data from more than 30,000 automatic stations in mainland China and the USA Atmospheric Administration CMORPH (CPC morphing technique) satellite-derived precipitation product. The later validation was performed by comparing the simulation results from the different grid data resolutions for temperature and precipitation, respectively.

3. Results

3.1. Simulation Evaluations

Figure 3 shows the daily temporal variation in 2 m air temperature (T2) and precipitation simulated by the CTL simulation and observation data (air temperature grid dataset and CMORPH-M). The simulated T2 agrees well with the in situ observation (Figure 3a). Their correlation is 0.96, which passes the significance test of α = 0.01. The discrepancies between the CTL simulation and observations occur only for a period of a few days. The monthly simulated T2 has a little cold bias, with a difference of −0.15 °C, compared with the observation. The daily precipitation (Figure 3b) from the WRF simulation of the CTL is similar to that from CMOPRH-M. The WRF model captures the main precipitation events fairly well, especially the extreme events, from the 6 to 10 July. We also notice that the precipitation is mainly in the first 12 days, accounting for 81.5% of the total precipitation in July. The correlation between the CTL and the observation for daily precipitation is 0.83, which passes the significance test of α = 0.01. We also compared the relative humidity (RH) and the land surface temperature (LST) between the simulation and the station data in the supplementary material (Figures S1 and S2). Their correlations between the CTL and the station observation are 0.79 and 0.9, respectively, which pass the significance test of α = 0.01. The RH and the LST both show a good accuracy.

3.2. Lake Effects on Surface Variables

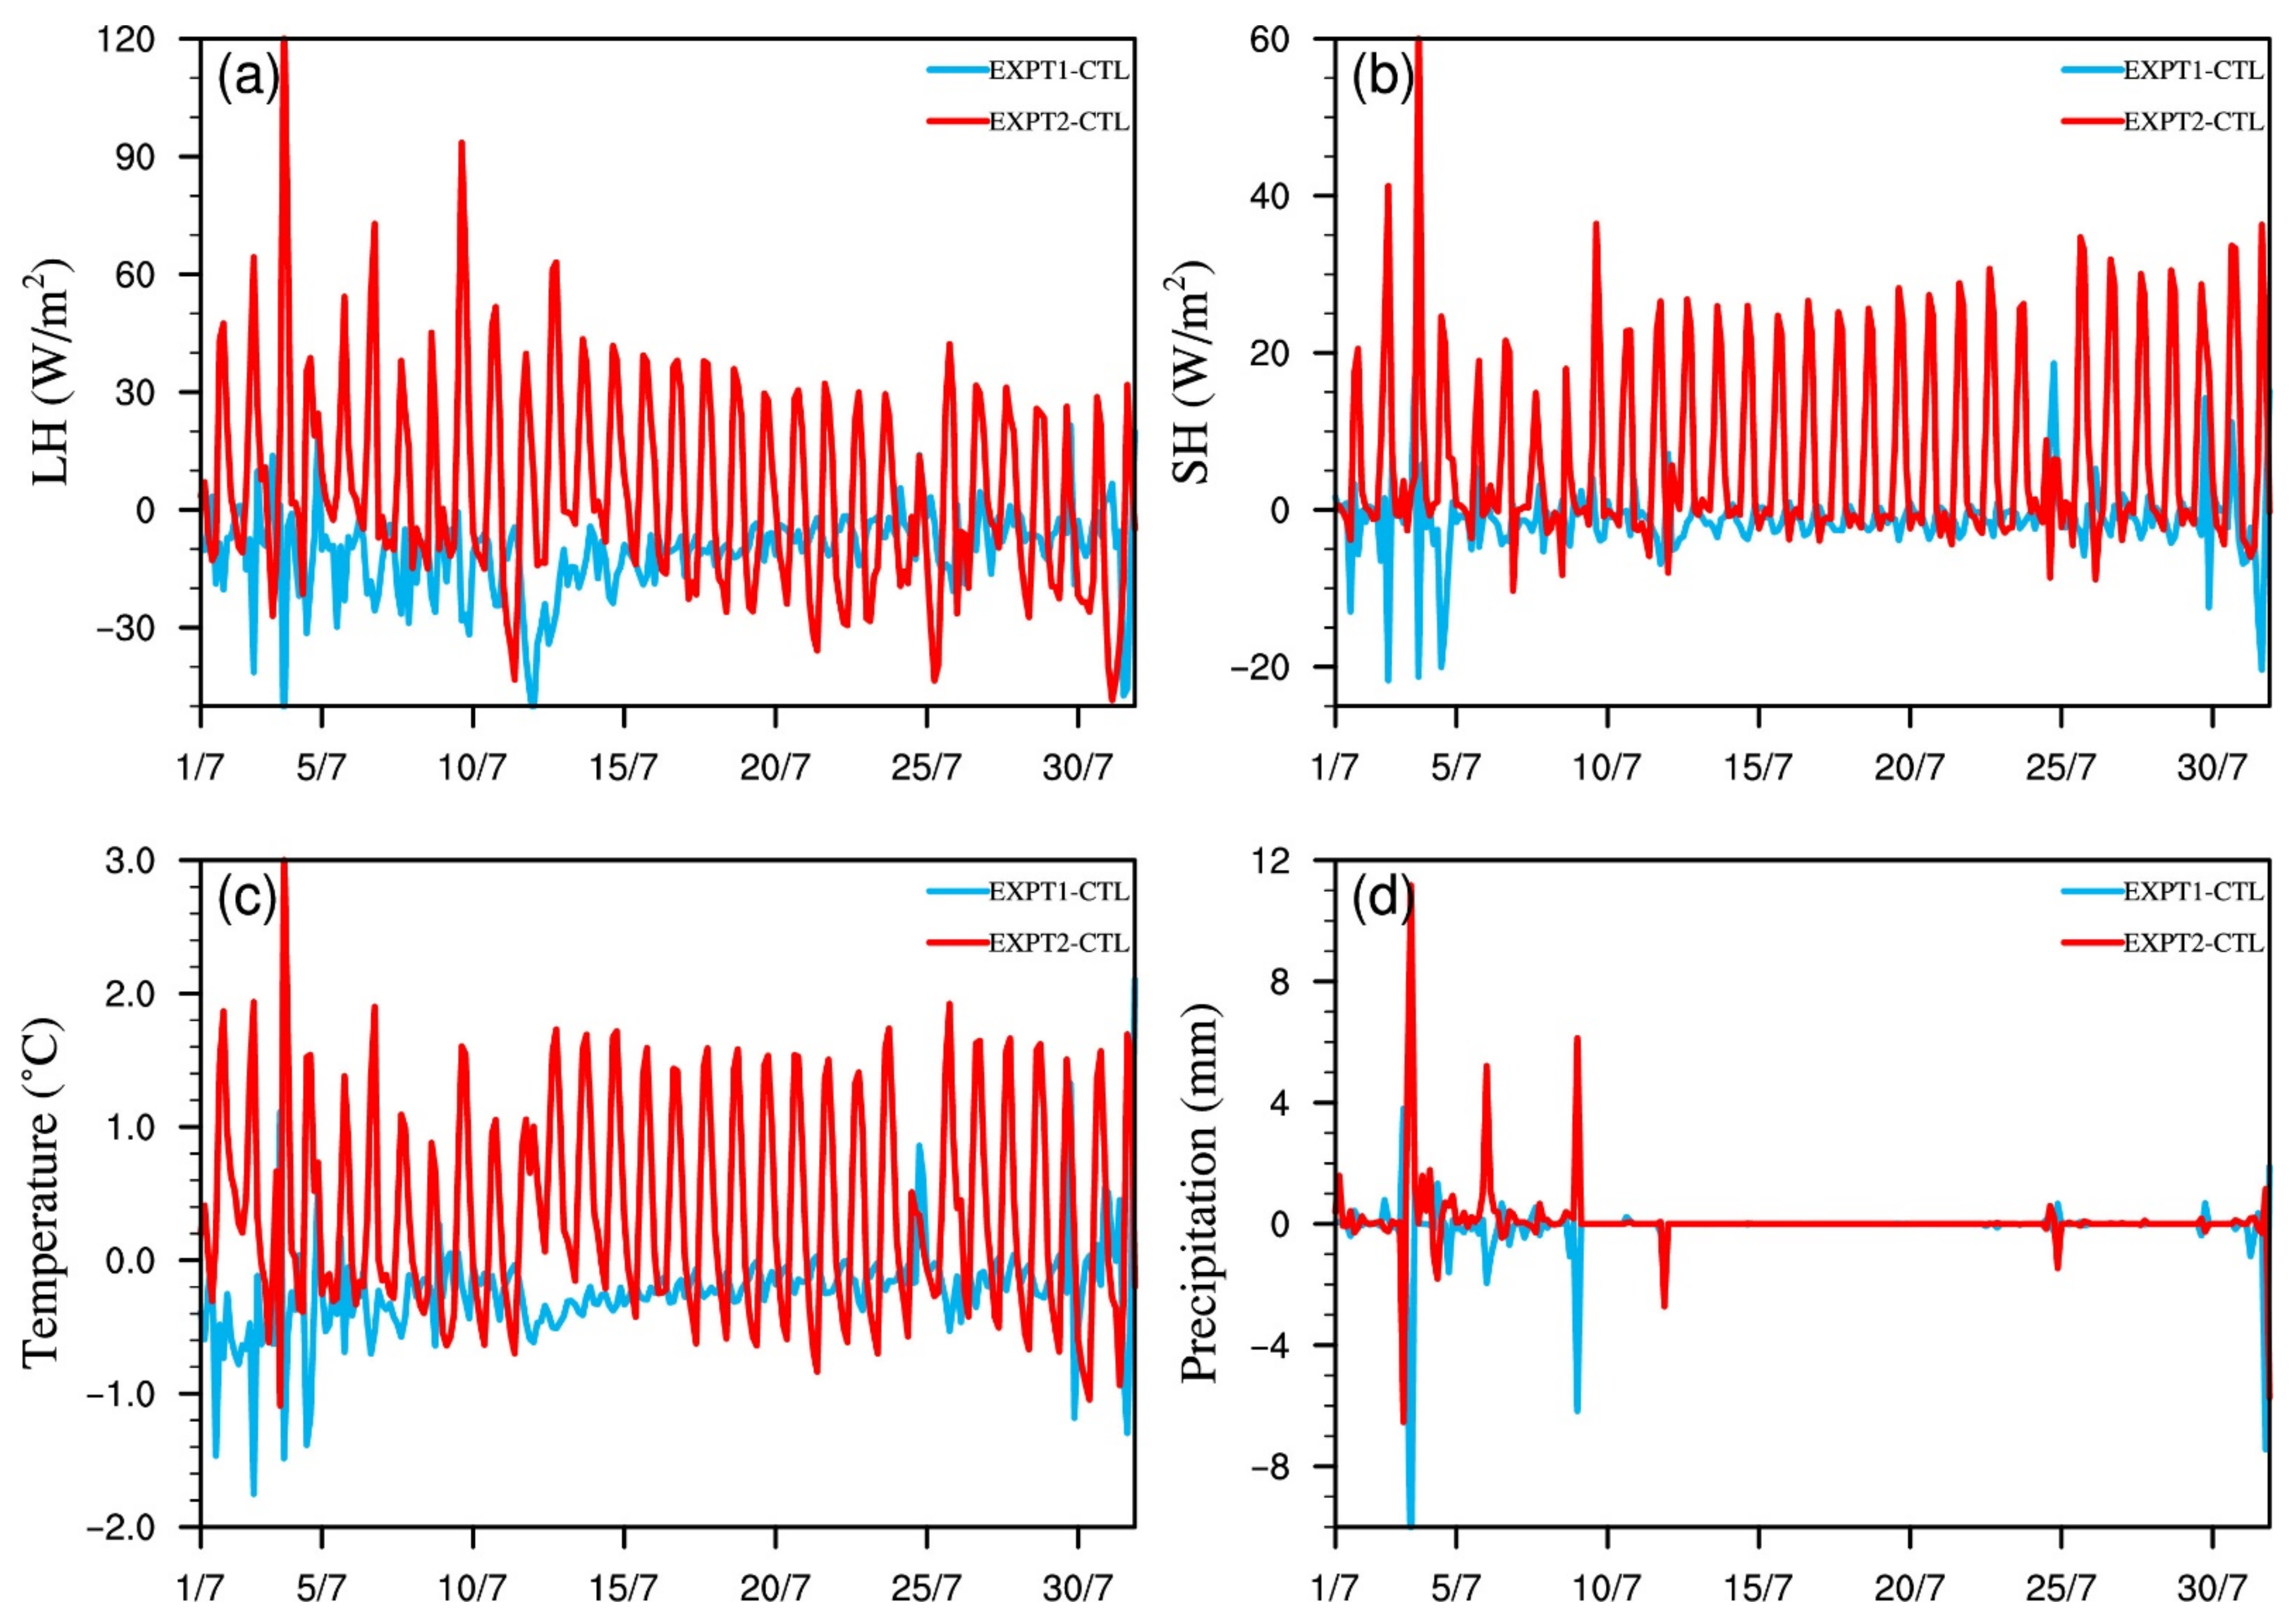
3.2.1. Lake Effects on the Temporal Changes in the Surface Variables

Table 1 shows the latent heat flux (LH), the sensible heat flux (SH), and the LST averaged over domain 4 and the rectangular dashed box in Figure 2b. We find that the statistics averaged over domain 4 are significantly smaller than those averaged in the dashed box in Figure 2b. For example, the difference in the LH between EXPT1 and the CTL in the rectangular area is −4.8 W m−2 lower than the LH in domain 4, as well as the SH in EXPT2. The difference in the SH averaged in two domains is the opposite for the difference between EXPT1 and the CTL due to the influence of the large extent of land surface on domain 4. Therefore, to focus on the effects of lake changes on the LH, the SH, and the LST, in this section, we mainly use the rectangular dashed box in Figure 2b to analyze the changes in these variables over the lake surface.
Figure 4 shows the differences of EXPT1 and EXPT2 compared to the CTL for the LH, the SH, and the LST. Compared to the CTL, the simulated LH, SH, and LST are all reduced in EXPT1. The days with larger reductions are 1–12 and 25–31 July because of the precipitation occurring in this period shown in Figure 4d. The rest of the time in July shows little change in the LH, the SH, and the LST. This indicates that these land surface variables are not sensitive to the increased lake level and area on no-precipitation days. The CTL simulates a monthly mean lake surface temperature of around 30 °C in July, with the latent heat flux dominating the net radiation (Table 1). EXPT1 simulates relatively lower LH (−10.4 W m−2), SH (−1.1 W m−2), and LST (−0.3 °C) than the CTL.
In EXPT2, the simulated LH is substantially higher than that of the CTL from 1 to 12 July but then gradually decreases thereafter (Figure 4a). However, the SH and the LST are significantly higher than those of the CTL in the whole month of July (Figure 4b,c). The changes in the LH, the SH, and the LST are greater in EXPT2 than in EXPT1. For the spatial average, EXPT2 has −11.2 W m−2 lower LH and 13.4 W m−2 and 0.3 °C higher SH and LST, respectively, compared to those of the CTL (Table 1). The possible reason is that when the Poyang Lake level and area decrease, the water volume of the lake decreases and so does the heat that can be stored in the lake. Meanwhile, the increased area of the exposed lakebed covered by grass makes the surface more sensitive to incoming solar radiation. The effects of lake level and area changes on the LH, the SH, and the LST are pronounced during precipitation events. When precipitation occurs, its cooling effect may break the energy balance on the surface, which may have caused irregular fluctuations in the LH, the SH, and the LST during precipitation days from 1 to 12 July. After the precipitation stopped on 12 July, the differences in the heat and moisture change at the surface among the three experiments were mainly contributed to by solar radiation.

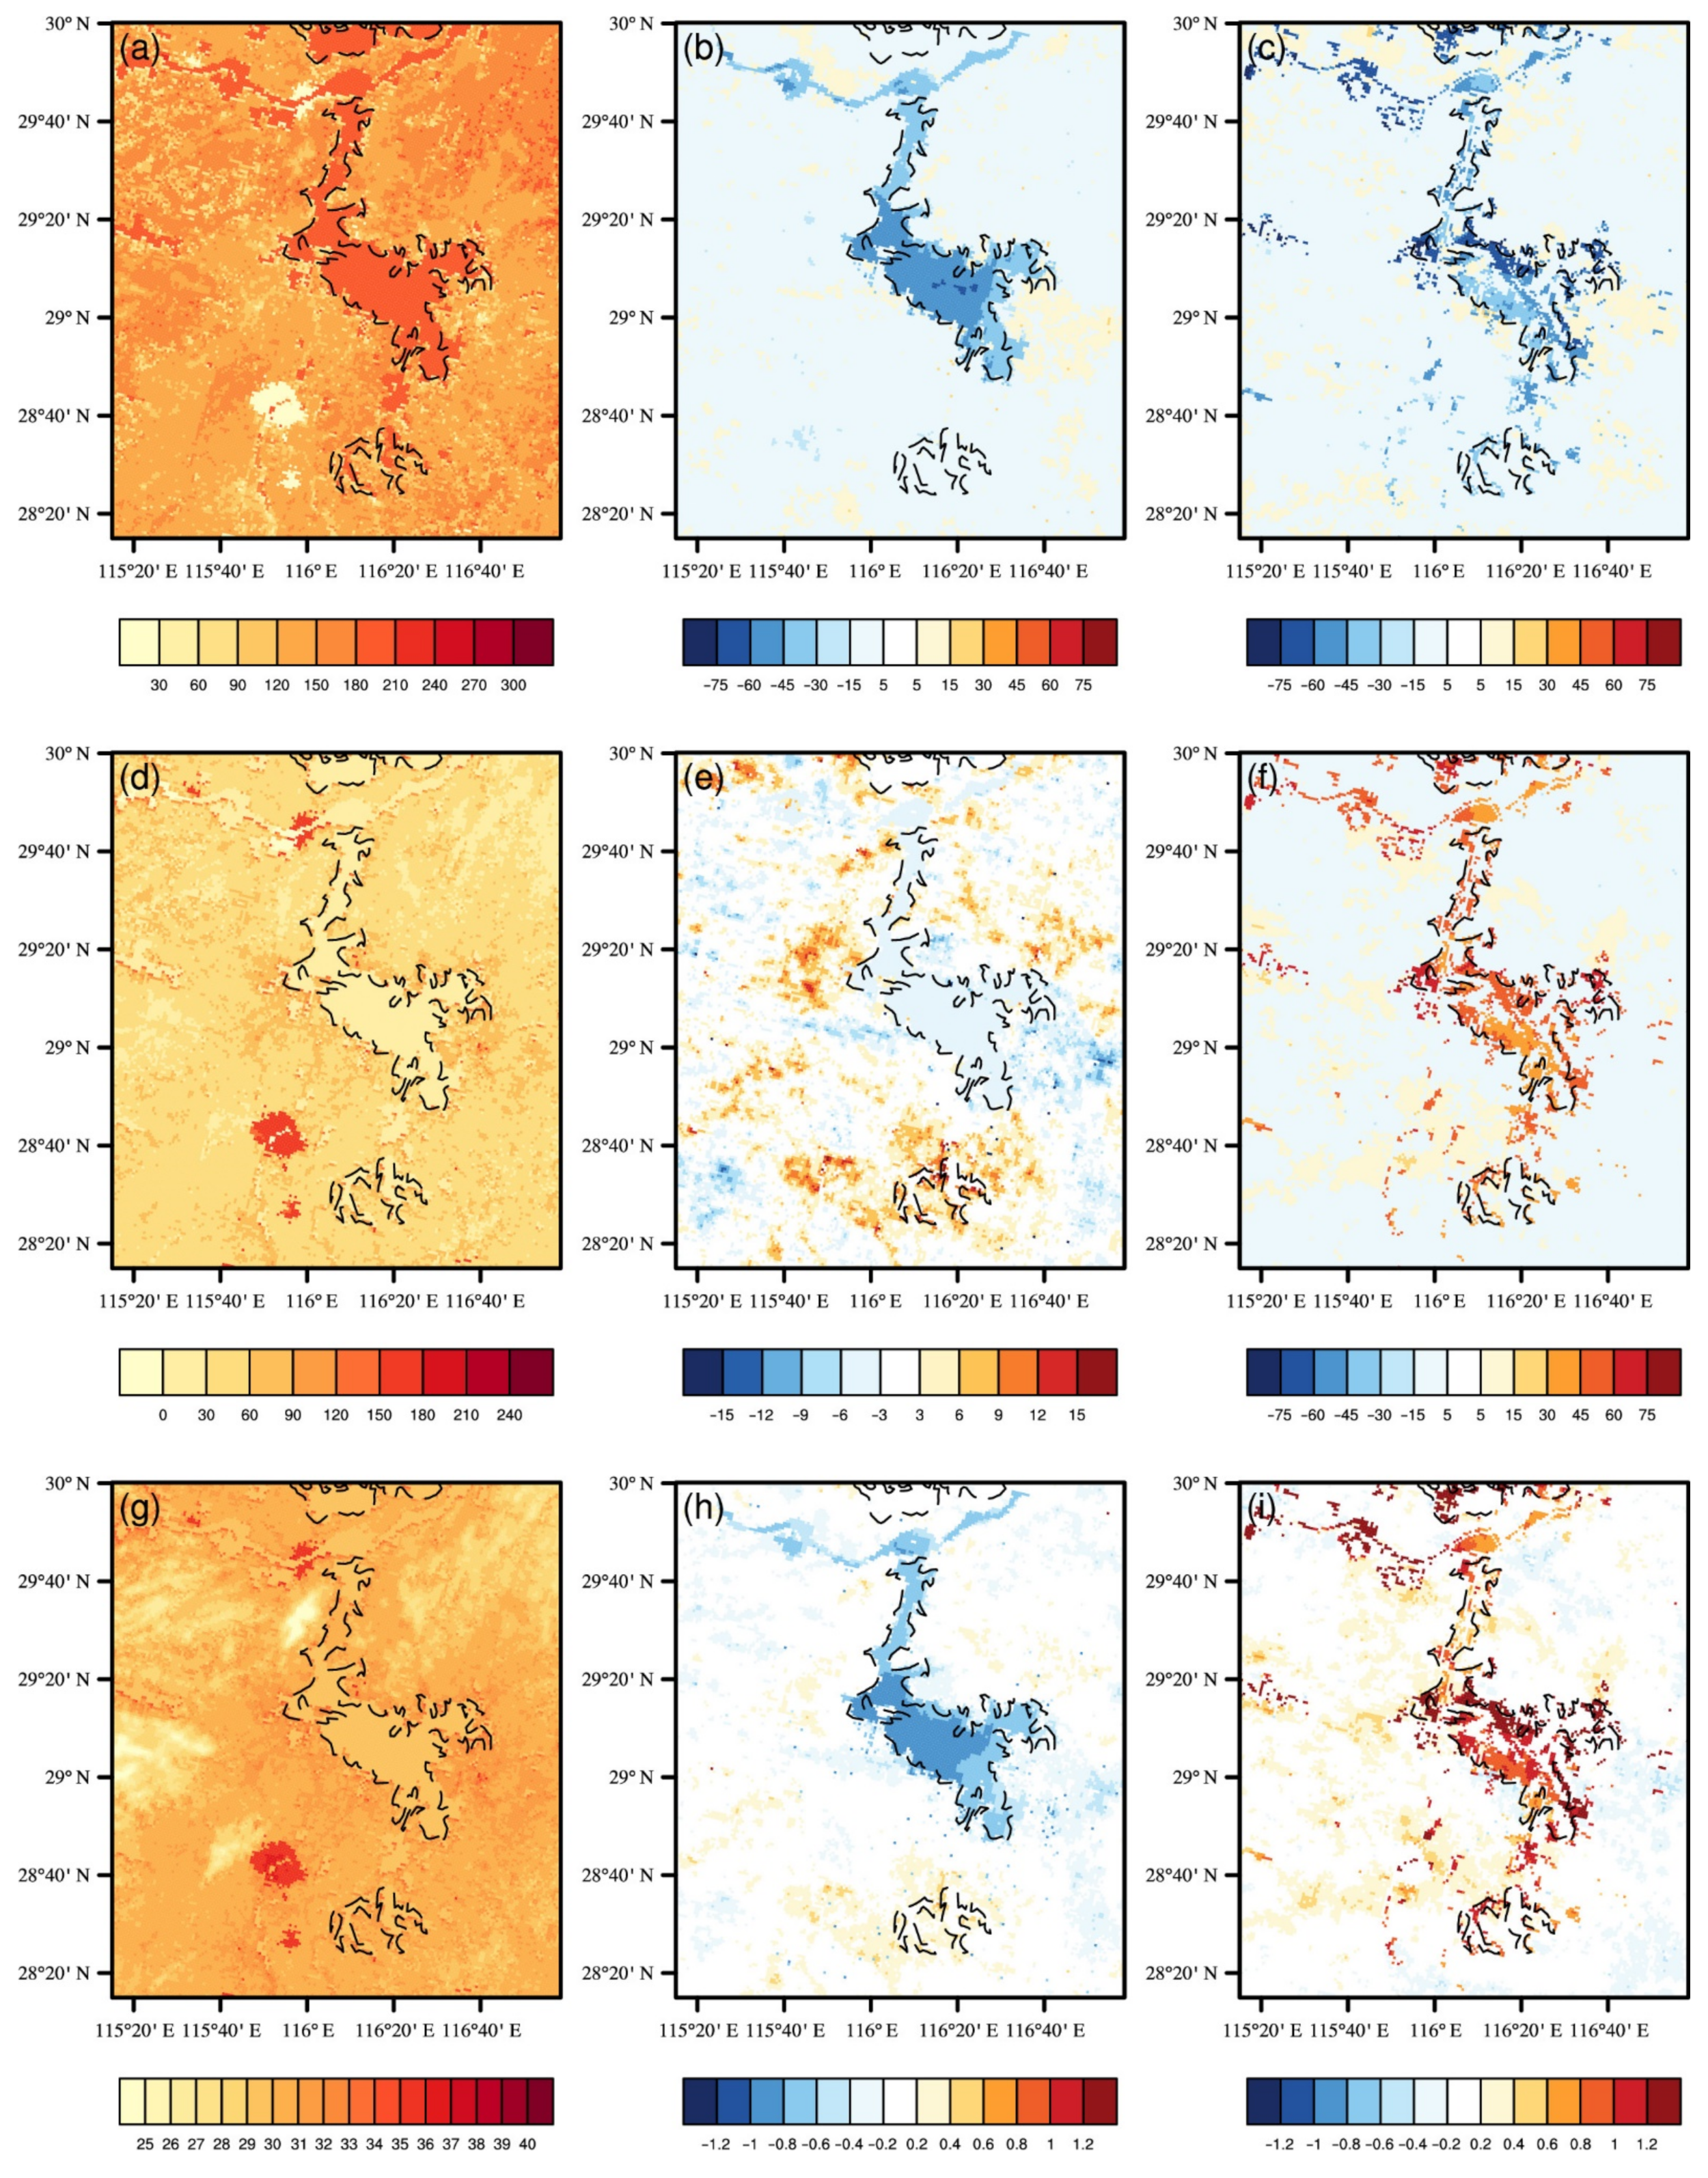
3.2.2. Lake Effects on the Spatial Distribution of the Land Surface Variables

Figure 5 shows the spatial distribution of the LH, the SH, and the LST of the three experiments. A higher lake level and a larger lake area led to a lower LH on the lake surface and most land area, especially for the central region of the lake for EXPT1 (Figure 5b). This indicates that the evaporation from the lake surface is reduced and the energy release is suppressed. The SH shows nearly no change on the lake surface for EXPT1, whereas the SH on the land surface on the west side of the lake is higher than that of the CTL (Figure 5e). The LST decreases over the lake and increases on the land surface, similar to the LH (Figure 5h). Since the solar radiation energy is the same in all three experiments, the energy not used for evaporation and warming the lake surface with lower LH and SH in EXPT1 is possibly absorbed by the lake water. Thus, the increasing lake level and area will reduce the evaporation from the lake surface and inhibit energy release.
In EXPT2, the Poyang Lake level is lowered and the area is reduced, resulting in a significant reduction in the water volume. Figure 5c shows that the LH has decreased mainly in the area where the lake has shrunk, giving way to land. This shrinking area also has a significantly greater SH because the land surface has a lower specific heat capacity than the water and so the SH is more sensitive on the grass-dominated surfaces (Figure 5f). Similar to the SH, the LST also shows a great increase in the area where the lake has shrunk. Thus, the spatial variations in the LH, the SH, and the LST indicate reduced evaporation and enhanced surface warming as the Poyang Lake level and area decrease.

3.3. Lake Effects on the Near-Surface Variables

During precipitation, the humidity near the surface increases and the air temperature decreases. The shading effect of clouds also diminishes the incoming solar radiation at the surface, disrupting the heat and energy balance at the surface. Meanwhile, heat and moisture are redistributed as the landscape changes and the changes in the potential temperature in the vertical direction affect the atmospheric stratification stability [55]. Since the distribution of the near-surface energy is mainly influenced by surface heat and moisture, there are differences in the time-averaged potential temperature at 850 hPa and 1000 hPa (Figure 6a–c) that approximate the change in near-surface atmospheric stratification stability above Poyang Lake. According to the study of Laird, when the LH and the SH increase, the stratification stability of the near-surface atmosphere decreases, and vice versa [56]. To analyze the changes in the near-surface energy more clearly, we choose the almost no precipitation period from 13 to 31 July.
In EXPT1 (Figure 6b), the LH and the SH are reduced to some extent, resulting in the higher differences in potential temperature between 850 hPa and 1000 hPa than those in the CTL. This indicates that the atmospheric stratification stability is enhanced, which does not benefit the upward movement of energy and water vapor transfer. In EXPT2, the LH decreases, while the SH increases, but the variation in the LH is smaller than that in the SH, so the net heat flux at the surface increases, resulting in a decrease in the difference in the potential temperature between 850 hPa and 1000 hPa. Then the atmospheric stratification stability decreases and the atmospheric perturbation in the vertical direction increases (Figure 6c). These results indicate that an increasing level of Poyang Lake will strengthen the stratification stability of the near-surface atmosphere, which is not conducive to local precipitation. However, when its water level and area are less, Poyang Lake will weaken the stratification stability of the near-surface atmosphere and make it more unstable, which is helpful for local precipitation.
The planetary boundary layer (PBL) is the lowest layer in the troposphere, which is also impacted by the LH and the SH through turbulent exchange. Figure 6d–f depicts the distribution characteristics of the time-averaged PBL from 13 to 31 July. Compared with the CTL, the PBL of EXPT1 decreases near Poyang Lake and increases in the rest of the area, which is similar to the distribution of the SH. In EXPT2, however, the PBL dramatically increases by nearly 400 m in the lake’s shrinking area. This indicates that the decrease in the SH as the lake level rises and the area increases leads to a reduced upward heat transport and a decreased PBL for EXPT1. However, when the lake level is low and the area less (EXPT2), and the lake surface turns to grass, the land-surface area replacing water absorbs more solar radiation and allows a stronger SH to heat the atmosphere by upward transport, causing the PBL in this region to rise significantly.
CAPE is one of the indicators to represent the energy possessed by the air in the PBL and determine whether local precipitation events will occur. It is strongly influenced by the upward transfer of heat and vapor from near the surface. Figure 6g–i show the spatial distribution of time-averaged CAPE during 13–31 July. In EXPT1, due to the decrease in the LH and the SH, the lake surface lacks sufficient heat and moisture to generate CAPE. The area where the CAPE is reduced is concentrated in the western section of Poyang Lake (Figure 6h). This is due to the weakening vertical winds in this area, resulting in the inability of the heat and moisture to promote the CAPE accumulation. Although the SH increases in EXPT2, the CAPE is lower than that of the CTL (Figure 6i) because there is not enough water vapor for CAPE accumulation because of the decrease in the lake water volume. The area of CAPE reduction is also concentrated on the west side of Poyang Lake, just as in EXPT1. These results indicate that Poyang Lake causes the CAPE to slightly reduce on the west side of the lake and increase on the east side when the lake level is high and the area large. However, when the lake level is low and the lake area small, it causes a significant decrease in the CAPE on the east side and a slight increase on the west side.

3.4. Lake Effects on Precipitation, Water Vapor Flux, and Wind

Changes in the lake can influence local precipitation by influencing near-surface heat and moisture. Although our previous analysis mainly focuses on the time period of 13–31 July, the precipitation mainly occurs from 1 to 12 July and accounts for 81.5% of the total precipitation in July. To analyze the effect of Poyang Lake on local weather and climate, our analysis time in this section is 1–12 July. As shown in Figure 7a, the CTL precipitation mainly occurs in the areas to the south and west of Poyang Lake, with the center in the south. However, in EXPT1 and EXPT2, precipitation is substantially lower in this region. This means that a change in either the lake level or the lake area will decrease precipitation downwind of Poyang Lake. Compared to the CTL, the domain-averaged total precipitation in EXPT1 is reduced by 22.3 mm, while in EXPT2, it is reduced by 23.8 mm (Table 2). In the meantime, precipitation increases on the east side of the lake in EXPT2. Many factors contribute to precipitation variability: in addition to the changes in near-surface heat and energy analyzed in the previous section, there are changes in other factors, such as local water vapor and wind. The two factors will be discussed further.
To analyze how the Poyang Lake changes influence the precipitation locations, we choose the area with high precipitation to make the cross sections of the wind and vapor flux as shown in Figure 8 to analyze the changes in the vertical direction (the location line of the cross section is shown in Figure 7a). From Figure 8, we can see that the vapor flux exchange mainly occurs under 400 m, which is the most intense in EXPT2, especially in the southwest part of Poyang Lake. This change may be due to the fact that although the water sources are greatly reduced as the lake level and area decrease in EXP2, the higher SH makes the near-surface atmosphere more unstable (as evidenced in Figure 6c). However, the water vapor flux in EXPT1 does not change much. This indicates that when the lake level is higher and the lake area is larger than the default conditions they do not have a significant influence on water vapor flux.
As for the change in wind, it can be seen from Figure 8a that there is a significant updraft over Poyang Lake (around 29° N, 116.5° E). In the near-surface layer (mainly under 400 m), the easterly winds transport the heat and moisture to the west side of the lake and then produce precipitation there. Compared with the CTL, EXPT1 has significantly lower wind speed above the lake. The average decrease in wind speed is 13.2 m s−1 in this area, which means the decreased SH and LH lead to a more stable near-surface atmosphere and weaker vertical motion. The weakened easterly wind under 400 m causes less water vapor to reach the western side of the lake. Moreover, the original westerly winds above 400 m on the western side of the lake are weaker and sink in this region for EXPT1. Thus, the changed wind and reduced CAPE in EXPT1 are not conducive to the formation of convection, which ultimately reduces local precipitation.
In EXPT2, unlike EXPT1, the weakened atmospheric stratification stability causes the wind above the lake to greatly increase. The wind over the lake is also enhanced by the westerly wind above 4000 m. Compared to the CTL, the domain-averaged wind speed at the lake location increases by 2.2 m s−1. The enhanced updraft transports water vapor to the east side of the lake, resulting in increased precipitation on the east side of the lake (Figure 7c), but simultaneously reduces the precipitation on the west side of the lake.

4. Discussion

The great lakes, such as the Great Lakes of North America and Qinghai Lake on the Tibetan Plateau, have garnered a lot of attention from researchers because of their local climatic implications [57,58,59,60]. Comparatively, the climatic effects of Poyang Lake have received less attention. The level and area of Poyang Lake fluctuate throughout the year [61,62,63]. In 2018, the highest lake level was nearly 10 m, and the maximum lake area increased by nearly 60% compared to the minimum. In this paper, we set up three experiments, a control experiment based on the default condition of the Poyang Lake level and area according to WRF model and two sensitivity experiments for the extreme values of the lake in 2018. The aim was to discuss the impact of the lake level and area changes on local weather. Since the study results are based on only two sensitivity experiments, to reduce the resulting uncertainty of the simulation results, we will carry out more robust sensitivity experiments based on long time-series lake data in the future.
In addition, we chose only the extreme data of Poyang Lake in 2018 for the simulation, although, in fact, the lake level and area change throughout the year. Due to the lack of monthly data on lake level and area, we were not able to do a year-round analysis in the study. If dynamic Poyang Lake level and area data are used in the WRF model, it may improve the accuracy of local weather simulation, the way the model simulation accuracy improved by using the dynamic leaf area index, dynamic crop growth, and dynamic lake surface albedo [64,65,66,67]. In future work, it would be of great significance to introduce the monthly lake level and area into the WRF model to analyze the interactions between Poyang Lake and local weather.
It is worth noting that although weather under the two extreme lake conditions from 1951 to 2018 was explored, the extreme dry situation used in this work has come to be true recently since Poyang Lake reached its historically lowest lake level and smallest lake area in the summer of 2022. According to the newest reports, the lake level of Poyang Lake has decreased to less than 8 m in September, which is the lowest level in the same period in history since 1951. It is only the beginning of September, and the water level in the whole middle and lower reaches of the basin has almost dropped to the dry water level in winter. The lake area shrank by 69% in 40 days, transforming it from a lake into a river. By 26 August 2022, it was still shrinking at a rate of more than 20 km2 per day. The research in this study demonstrates that besides the large-scale climate systems, such as the subtropical high, the lake–atmosphere interactions may also play a role in the extreme drought this year.
In fact, Poyang Lake is only a microcosm of the great drought in the Yangtze River Basin this year. A blue drought alert has been issued. The extreme drought is a huge threat for many aspects such as, for instance, the survival of aquatic animals. Today, species such as the baiji dolphin and paddlefish have disappeared, and the finless porpoise is currently the only freshwater mammal in the Yangtze River. As the flagship species of the Yangtze River aquatic ecosystem, the population status of the Yangtze finless porpoise is an important indicator of the health status of the Yangtze River aquatic ecosystem. The extreme drought had direct impacts on the porpoises in Poyang Lake. First of all, the low water level compresses the living space of the finless porpoises; second, extreme dry climate will affect the reproduction of fish in the next year; and third, the extremely low water level may not provide a relatively safe habitat for these newborn porpoises, which will pose a great threat to the newborn population. More importantly, climate extremes have been more frequent in recent years, with more extreme temperature and precipitation events in China [68,69,70], and they are going to keep increasing in the future as well. Therefore, against the background of frequent extreme weather events, the Poyang Lake level and area changes may also intensify and show substantial feedbacks to local weather and climate, and subsequently, the biodiversity of species as well.
Besides the feedbacks of Poyang Lake itself, the nearby cities also have notable impacts on local weather. The significant thermal effects of cities lead to enhanced atmospheric instability [71], and urban buildings can also block and split the transiting weather systems [72]. In addition, irrigation and industrial activities near cities could increase the water vapor content of the lower atmosphere [73]. For lakes that neighbor cities, the interaction of an urban heat island effect and the lake–land breeze have a significant impact on the local circulation and precipitation [74,75,76]. According Li and Gao [48], the interaction of Taihu Lake and its adjacent urbans significantly changes the location of precipitation and enhances the intensity of precipitation. In this paper, we only studied the influence of the changes in Poyang Lake on local meteorological elements. However, there are many cities (such as Nanchang, Jiujiang, Poyang County, and Duchang County) near Poyang Lake; their influences may significantly affect the heat and moisture distribution between Poyang Lake and the cities, and hence change the local circulations and precipitation. Therefore, the interaction between the lake and the surrounding urban areas is also an aspect that we need to focus on in the follow-up work.

5. Conclusions

This study demonstrates the significant effects of intra-annual variations in the level and area of Poyang Lake on local weather. Sensitivity experiments using the WRF model show the spatiotemporal responses of heat and moisture to different lake levels and areas and the subsequent influence on local weather and climate. Our main conclusions are the following:
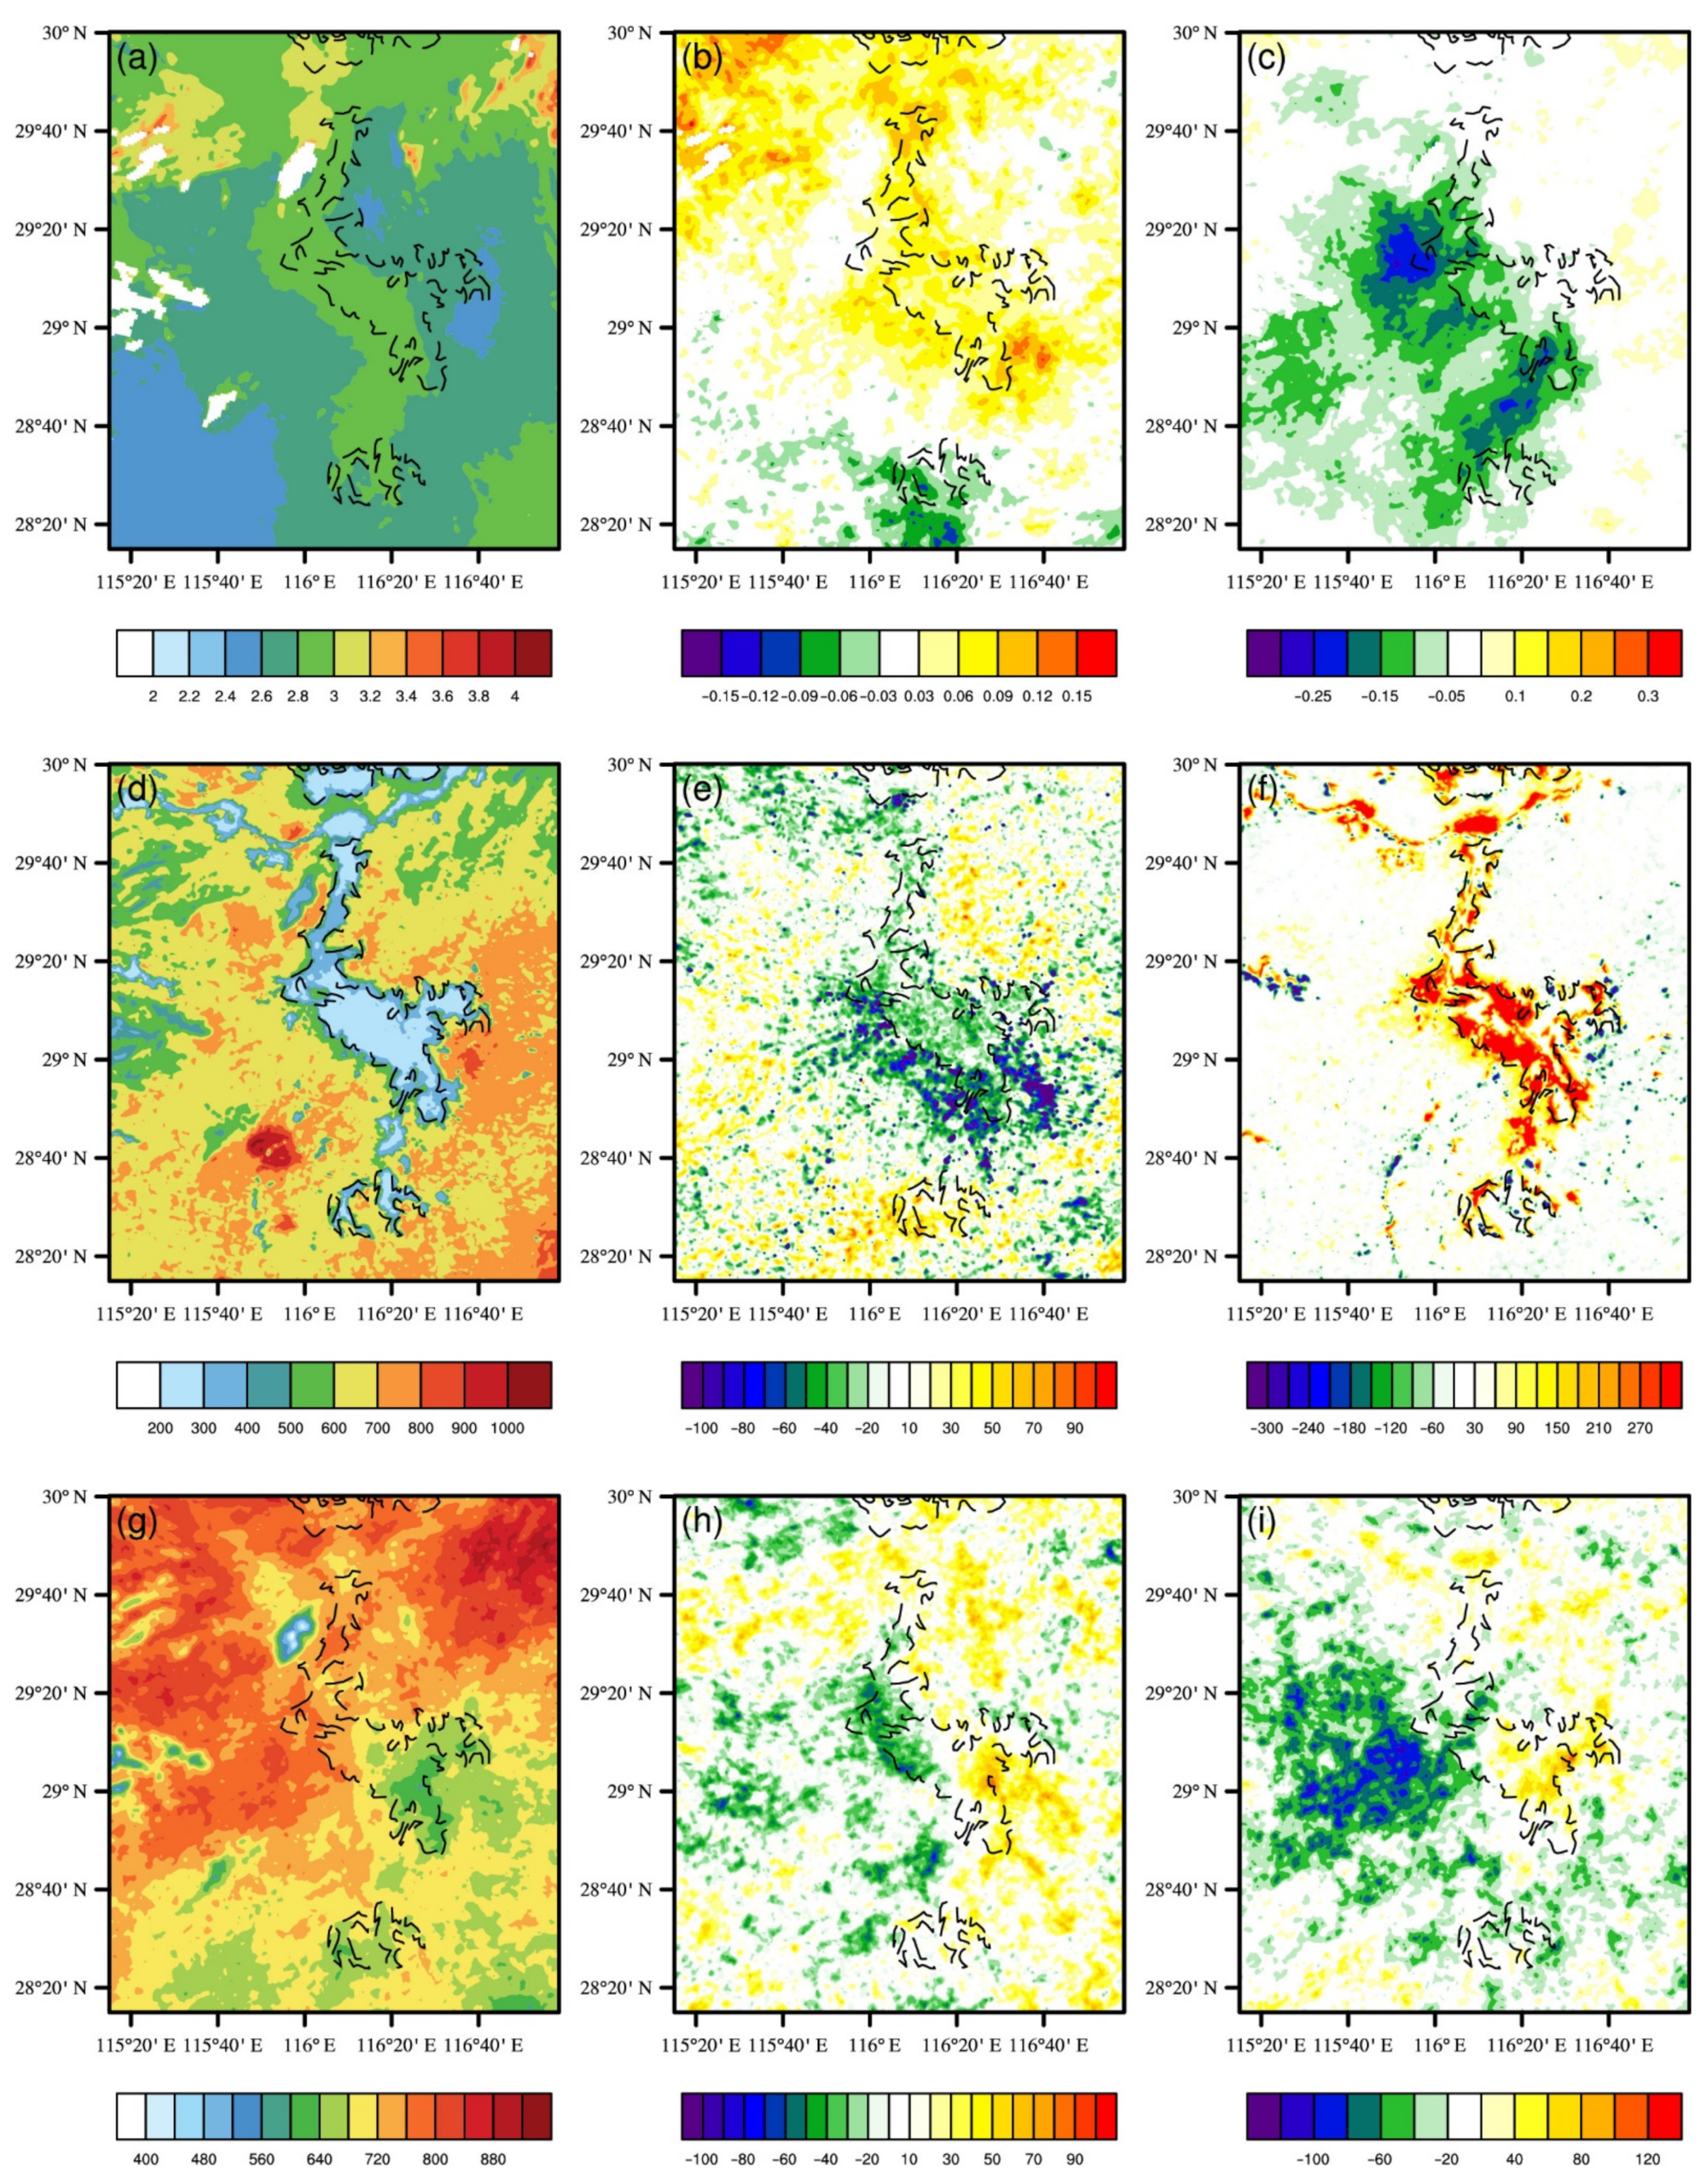
  • The change in the LH, the SH, and the LST when the lake level is low and the lake area is less is greater than when the lake level is high and the lake area is large. Compared to the default lake level and area in WRF, the spatial distribution of the LH, the SH, and the LST on the lake surface decreased when the lake level and area increased, and the domain-averaged LH, SH, and LST decreased by −10.4 W m−2, −1.1 W m−2, and −0.3 °C, respectively. The LH when the lake level is low and the lake area is small decreased by −11.2 W m−2. However, the SH and the LST increased by 13.4 W m−2 and 0.3 °C, respectively.
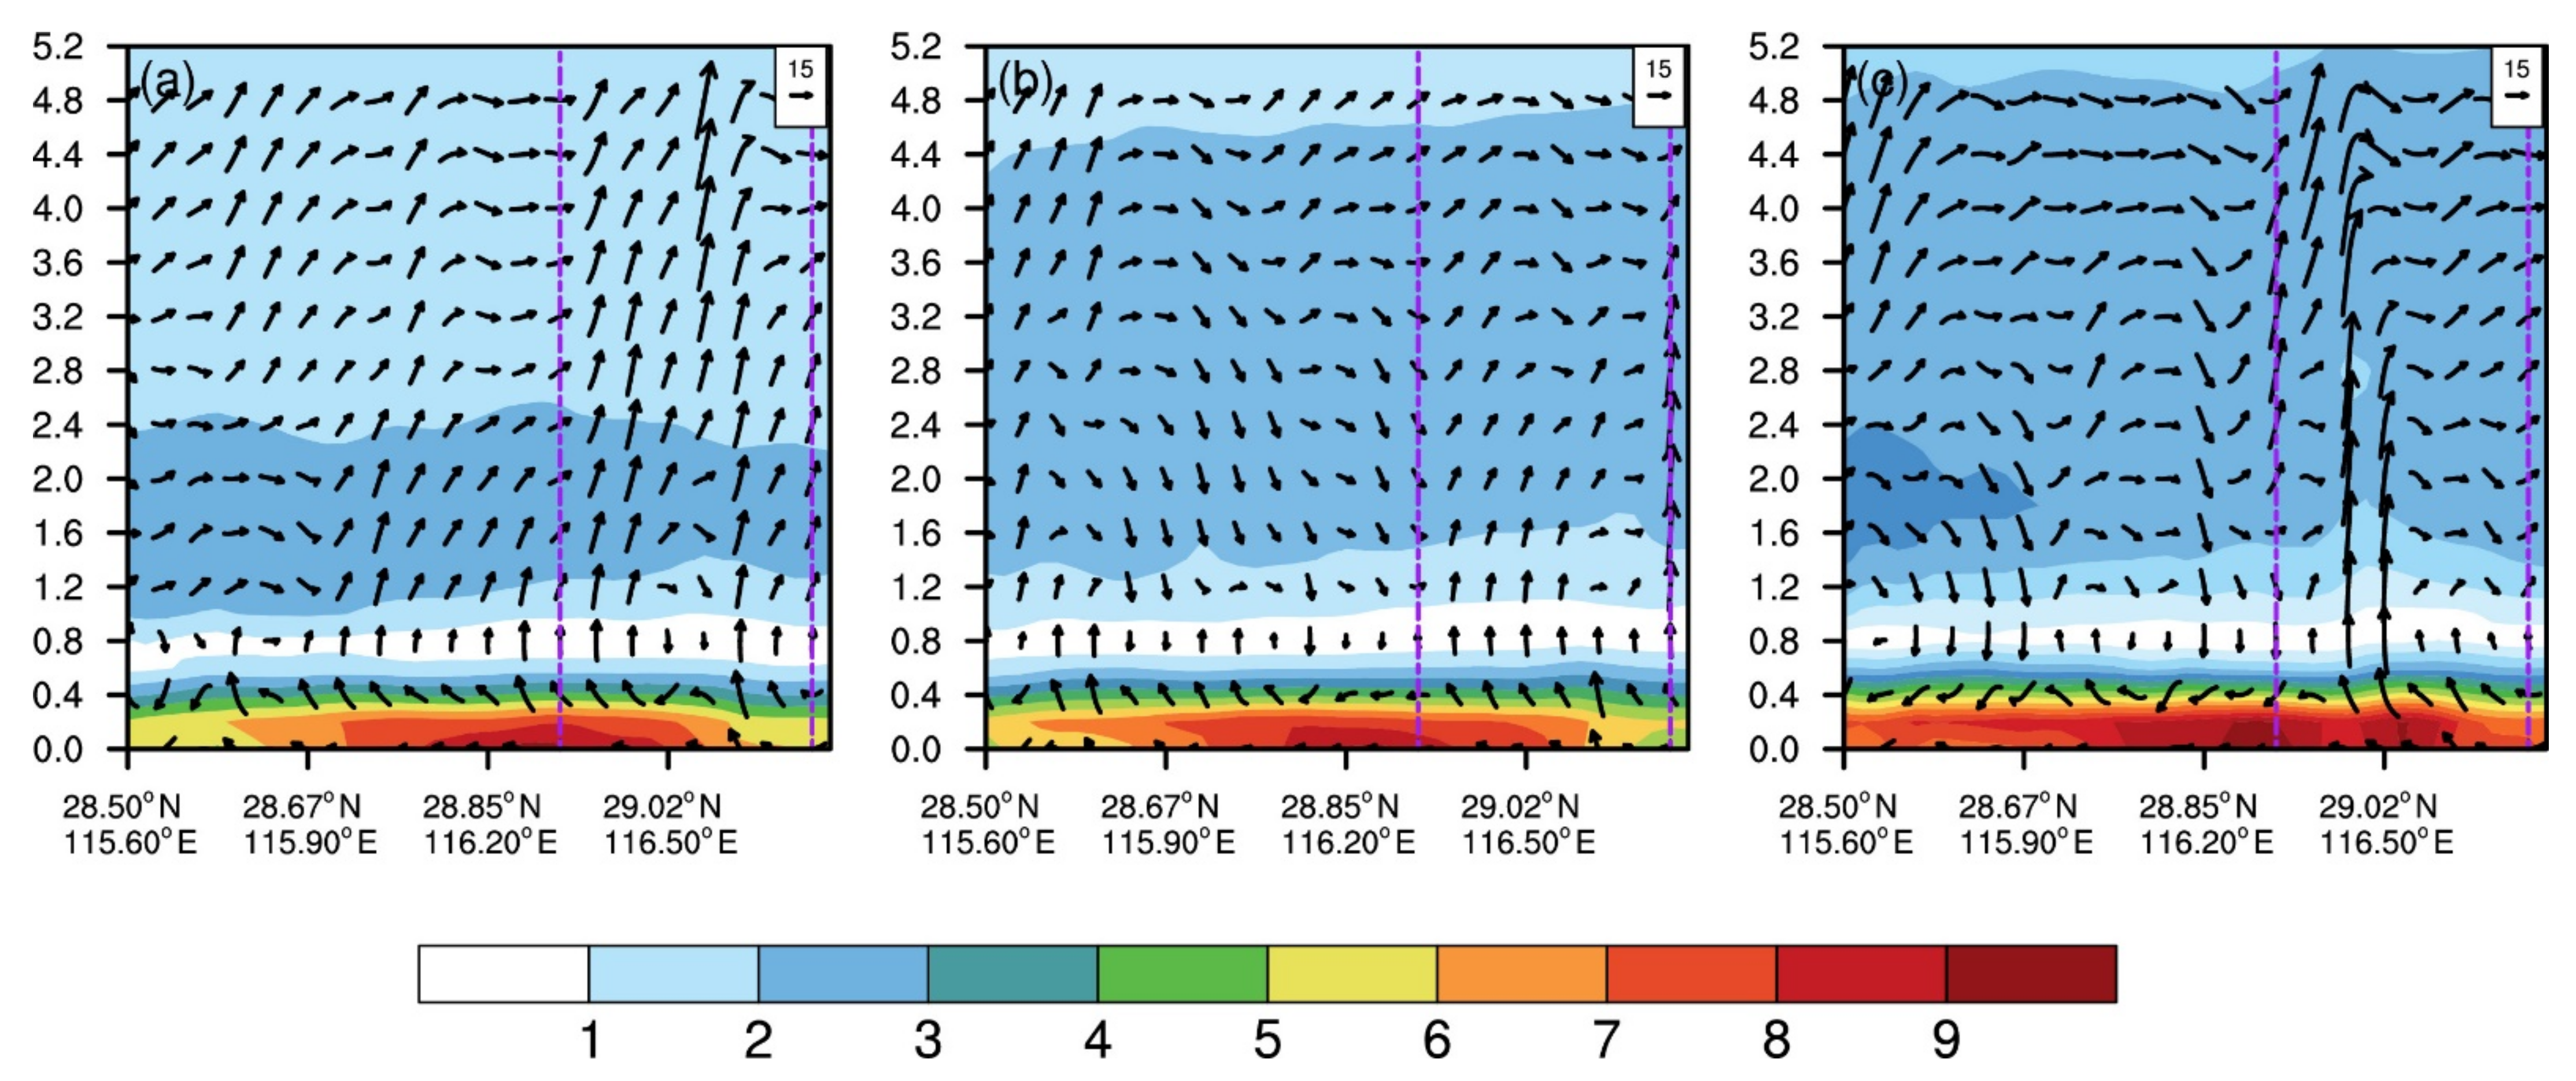
  • The atmospheric stratification stability strengthens and the PBL decreases in the lake area as the lake level and area increase. In addition, the atmospheric stratification stability in the PBL shows an opposite change as the lake level and area decrease. The CAPE decreases on the west side of Poyang Lake but increases on the east side. These changes indicate that as the level and area of the lake change, the spatiotemporal distribution of surface heat, and thus the near-surface energy distribution, is changed.
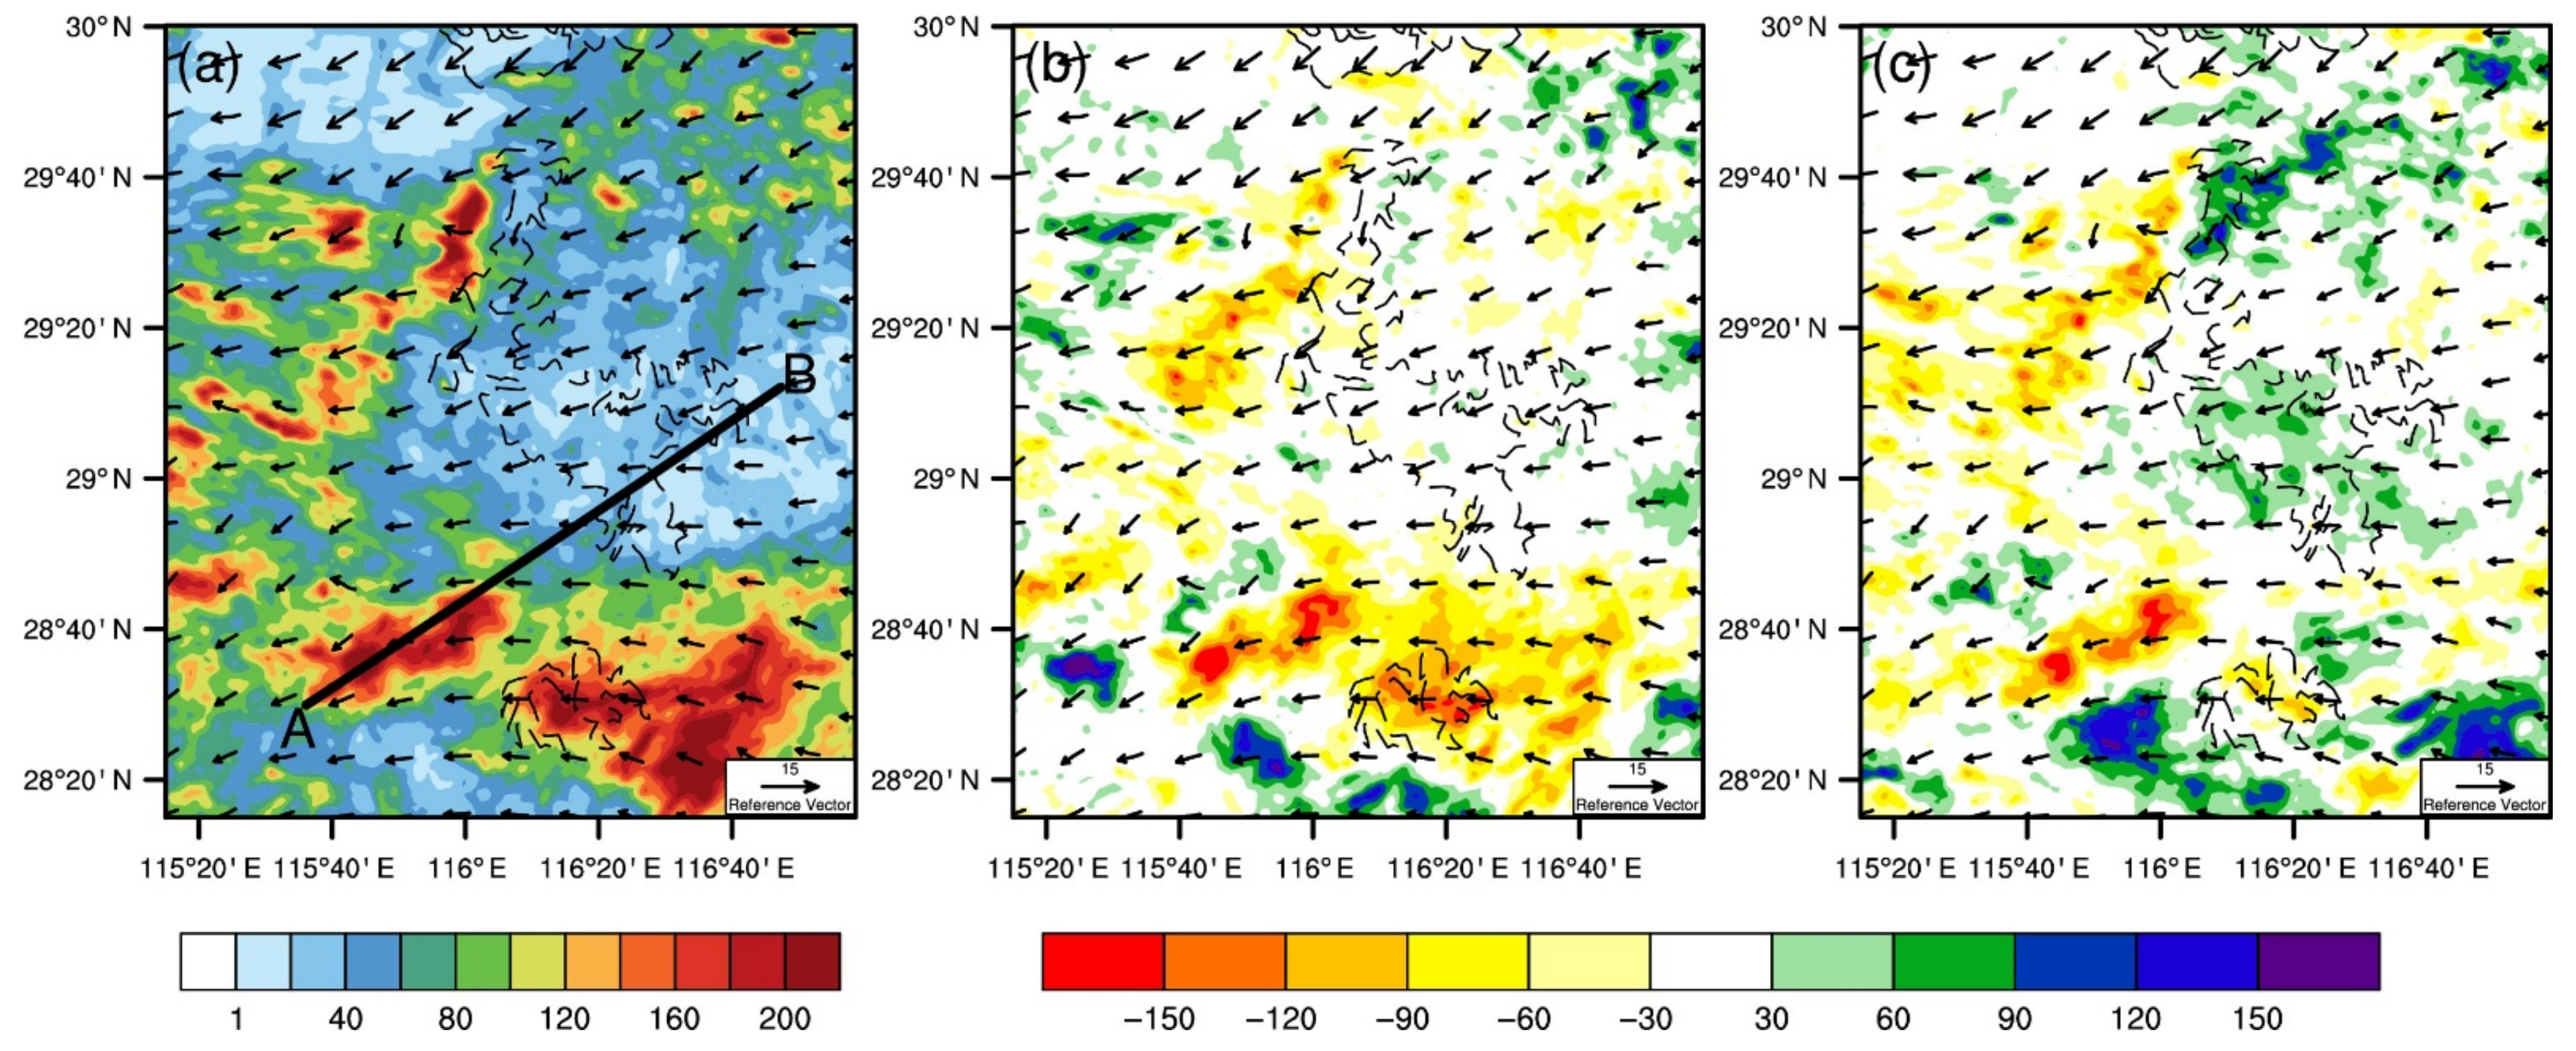
  • The water vapor flux and wind over the lake increase when the lake level and area increase, but the two variables increase when the lake level and area decrease. The wind over the lake weakened by 13.2 m s−1 as the lake level and area increased. When the low level and area of Poyang Lake decreased, the wind increased by 2.2 m s−1. These changes eventually led to a precipitation decrease when the lake level is high and the lake area large, with a domain-averaged decrease of −22.3 mm. In contrast, local circulation and water vapor flux when the lake level is low and the area small, which led to a precipitation decrease on the western side of the lake and a small increase on the eastern side, with a domain-averaged decrease of −23.8 mm.
The results of this study provide a preliminary analysis of the impact of Poyang Lake on local weather, which is a basis for further assessment of the impact of long-term changes in lake level and area on weather and climate in the Poyang Lake region.

Supplementary Materials

The following supporting information can be downloaded at: https://www.mdpi.com/article/10.3390/atmos13091490/s1, Figure S1: Same as the Figure 2 in the manuscript but added stations in the Figure 2b. The domains for WRF simulations and the terrain height (m) for the domain. (a) Domains 1 to 4. (b) The terrain height in domain 4 and Poyang Lake (in blue). The rectangular dashed box in (b) is the area that will be used for analysis later in the work; Figure S2: The daily observed (black lines) and the CTL (blue lines) (a) relative humidity (%) and (b) land surface temperature (°C) from 1 to 31 July.

Author Contributions

Conceptualization, Y.G. and Y.Z.; methodology, Y.Z.; software, Y.Z.; validation, Y.Z.; formal analysis, Y.Z.; investigation, Y.Z.; resources, Y.G. and Y.P.; data curation, Y.Z.; writing—original draft, Y.Z.; writing—review and editing Y.Z., Y.G., Y.P., X.L., Y.J. and P.S.; visualization, Y.Z.; supervision, Y.G. and P.S.; project administration, Y.G. and Y.P.; funding acquisition, Y.G. All authors have read and agreed to the published version of the manuscript.

Funding

This research was funded by the Strategic Priority Research Program of Chinese Academy of Sciences (XDA2006010202) and the National Key Research and Development Program of China (2017YFC1502101).

Institutional Review Board Statement

Not applicable.

Informed Consent Statement

Not applicable.

Data Availability Statement

The surface air temperature grid dataset and the hourly precipitation grid dataset of the China automatic station and CMORPH merged data are available from http://101.200.76.197/data/index/0b9164954813c573.html. In addition, the Poyang Lake level data is available from http://www.mwr.gov.cn/sj/tjgb/sqnb/201912/t20191216_1375043.html. The Poyang Lake area data is available from https://global-surface-water.appspot.com/#data.

Acknowledgments

We would like to acknowledge the support of the National Supercomputer Center in Tianjin. Support of the National Observations and Research Station for Wetland Ecosystems of the Yangtze Estuary is appreciated.

Conflicts of Interest

The authors declare no conflict of interest.

References

  1. Balsamo, G.; Salgado, R.; Dutra, E.; Boussetta, S.; Stockdale, T.; Potes, M. On the contribution of lakes in predicting near-surface temperature in a global weather forecasting model. Tellus A Dyn. Meteorol. Oceanogr. 2012, 64, 15829. [Google Scholar] [CrossRef]
  2. Long, Z.; Perrie, W.; Gyakum, J.; Caya, D.; Laprise, R. Northern lake impacts on local seasonal climate. J. Hydrometeorol. 2007, 8, 881–896. [Google Scholar] [CrossRef]
  3. Farley Nicholls, J.; Toumi, R. On the lake effects of the Caspian Sea. Q. J. R. Meteorol. Soc. 2014, 140, 1399–1408. [Google Scholar] [CrossRef]
  4. Ma, Y.; Yang, Y.; Qiu, C.; Wang, C. Evaluation of the WRF-Lake Model over Two Major Freshwater Lakes in China. J. Meteorol. Res. 2019, 33, 219–235. [Google Scholar] [CrossRef]
  5. Sun, X.; Xie, L.; Semazzi, F.; Liu, B. Effect of lake surface temperature on the spatial distribution and intensity of the precipitation over the Lake Victoria basin. Mon. Weather Rev. 2015, 143, 1179–1192. [Google Scholar] [CrossRef]
  6. Tsujimoto, K.; Koike, T. Land-lake breezes at low latitudes: The case of Tonle Sap Lake in Cambodia. J. Geophys. Res. Atmos. 2013, 118, 6970–6980. [Google Scholar] [CrossRef]
  7. Angel, J.R.; Isard, S.A. The frequency and intensity of Great Lake cyclones. J. Clim. 1998, 11, 61–71. [Google Scholar] [CrossRef]
  8. Owens, N.D.; Rauber, R.M.; Jewett, B.F.; McFarquhar, G.M. The contribution of lake enhancement to extreme snowfall within the Chicago–Milwaukee urban corridor during the 2011 Groundhog Day blizzard. Mon. Weather Rev. 2017, 145, 2405–2420. [Google Scholar]
  9. Schroeder, J.J.; Kristovich, D.A.; Hjelmfelt, M.R. Boundary layer and microphysical influences of natural cloud seeding on a lake-effect snowstorm. Mon. Weather Rev. 2006, 134, 1842–1858. [Google Scholar] [CrossRef]
  10. Alcott, T.I.; Steenburgh, W.J.; Laird, N.F. Great Salt Lake–effect precipitation: Observed frequency, characteristics, and associated environmental factors. Weather Forecast. 2012, 27, 954–971. [Google Scholar] [CrossRef]
  11. Laird, N.F.; Desrochers, J.; Payer, M. Climatology of lake-effect precipitation events over Lake Champlain. J. Appl. Meteorol. Climatol. 2009, 48, 232–250. [Google Scholar] [CrossRef] [Green Version]
  12. Dai, Y.; Yao, T.; Li, X.; Ping, F. The impact of lake effects on the temporal and spatial distribution of precipitation in the Nam Co basin, Tibetan Plateau. Quat. Int. 2018, 475, 63–69. [Google Scholar] [CrossRef]
  13. Yang, K.; Wang, J.; Lei, Y.; Chen, Y.; Zhu, L.; Ding, B.; Qin, J. Quantifying evaporation and its decadal change for Lake Nam Co, central Tibetan Plateau. J. Geophys. Res. Atmos. 2016, 121, 7578–7591. [Google Scholar]
  14. Eichenlaub, V.L. Lake effect snowfall to the lee of the Great Lakes: Its role in Michigan. Bull. Am. Meteorol. Soc. 1970, 51, 403–413. [Google Scholar] [CrossRef]
  15. Niziol, T.A.; Snyder, W.R.; Waldstreicher, J.S. Winter weather forecasting throughout the eastern United States. Part IV: Lake effect snow. Weather Forecast. 1995, 10, 61–77. [Google Scholar] [CrossRef]
  16. Huang, A.; Wang, J.; Dai, Y.; Yang, K.; Wei, N.; Wen, L.; Wu, Y.; Zhu, X.; Zhang, X.; Cai, S. Evaluating and improving the performance of three 1-D Lake models in a large deep Lake of the central Tibetan Plateau. J. Geophys. Res. Atmos. 2019, 124, 3143–3167. [Google Scholar] [CrossRef]
  17. Notaro, M.; Holman, K.; Zarrin, A.; Fluck, E.; Vavrus, S.; Bennington, V. Influence of the Laurentian Great Lakes on regional climate. J. Clim. 2013, 26, 789–804. [Google Scholar] [CrossRef]
  18. Liu, A.; Moore, G. Lake-effect snowstorms over southern Ontario, Canada, and their associated synoptic-scale environment. Mon. Weather Rev. 2004, 132, 2595–2609. [Google Scholar] [CrossRef]
  19. Steiner, A.L.; Posselt, D.J.; Wright, D.M. Sensitivity of Lake-Effect Snowfall to Lake Ice Cover and Temperature in the Great Lakes Region. Mon. Weather Rev. 2013, 141, 670–689. [Google Scholar]
  20. Gohm, A.; Umek, L. Lake and Orographic Effects on a Snowstorm at Lake Constance. Mon. Weather Rev. 2016, 144, 4687–4707. [Google Scholar]
  21. Small, E.E.; Giorgi, F.; Sloan, L.C.; Hostetler, S. The Effects of Desiccation and Climatic Change on the Hydrology of the Aral Sea. J. Clim. 2001, 14, 300–322. [Google Scholar] [CrossRef]
  22. Lauwaet, D.; Van Lipzig, N.; Van Weverberg, K.; De Ridder, K.; Goyens, C. The precipitation response to the desiccation of Lake Chad. Q. J. R. Meteorol. Soc. 2012, 138, 707–719. [Google Scholar] [CrossRef]
  23. Zhao, X.; Liu, Y. Variability of surface heat fluxes and its driving forces at different time scales over a large ephemeral lake in China. J. Geophys. Res. Atmos. 2018, 123, 4939–4957. [Google Scholar] [CrossRef]
  24. Sridhar, V. Tracking the influence of irrigation on land surface fluxes and boundary layer climatology. J. Contemp. Water Res. Educ. 2013, 152, 79–93. [Google Scholar] [CrossRef]
  25. Sridhar, V.; Anderson, K.A. Human-induced modifications to land surface fluxes and their implications on water management under past and future climate change conditions. Agric. For. Meteorol. 2017, 234, 66–79. [Google Scholar] [CrossRef]
  26. Haddeland, I.; Lettenmaier, D.P.; Skaugen, T. Effects of irrigation on the water and energy balances of the Colorado and Mekong river basins. J. Hydrol. 2006, 324, 210–223. [Google Scholar] [CrossRef]
  27. Guo, R.; Zhu, Y.; Liu, Y. A Comparison Study of Precipitation in the Poyang and the Dongting Lake Basins from 1960–2015. Sci. Rep. 2020, 10, 3381. [Google Scholar] [CrossRef]
  28. Junzhi, L.; A-Xing, Z.; Zheng, D. Evaluation of TRMM 3B42 Precipitation Product using Rain Gauge Data in Meichuan Watershed, Poyang Lake Basin, China. J. Resour. Ecol. 2012, 3, 359–366. [Google Scholar] [CrossRef]
  29. You, H.; Fan, H.; Xu, L.; Wu, Y.; Wang, X.; Liu, L.; Yao, Z.; Yan, B. Effects of Water Regime on Spring Wetland Landscape Evolution in Poyang Lake between 2000 and 2010. Water 2017, 9, 467. [Google Scholar] [CrossRef]
  30. Liu, H.; Zheng, L.; Jiang, L.; Liao, M. Forty-year water body changes in Poyang Lake and the ecological impacts based on Landsat and HJ-1 A/B observations. J. Hydrol. 2020, 589, 125161. [Google Scholar] [CrossRef]
  31. Yao, J.; Zhang, Q.; Ye, X.; Zhang, D.; Bai, P. Quantifying the impact of bathymetric changes on the hydrological regimes in a large floodplain lake: Poyang Lake. J. Hydrol. 2018, 561, 711–723. [Google Scholar] [CrossRef]
  32. Zhang, Q.; Ye, X.-C.; Werner, A.D.; Li, Y.-L.; Yao, J.; Li, X.-H.; Xu, C.-Y. An investigation of enhanced recessions in Poyang Lake: Comparison of Yangtze River and local catchment impacts. J. Hydrol. 2014, 517, 425–434. [Google Scholar] [CrossRef]
  33. Zhou, Y.; Jin, S.; Tenzer, R.; Feng, J. Water storage variations in the Poyang Lake Basin estimated from GRACE and satellite altimetry. Geod. Geodyn. 2016, 7, 108–116. [Google Scholar] [CrossRef]
  34. Dai, X.; Wan, R.; Yang, G. Non-stationary water-level fluctuation in China’s Poyang Lake and its interactions with Yangtze River. J. Geogr. Sci. 2015, 25, 274–288. [Google Scholar] [CrossRef] [Green Version]
  35. Liu, Y.; Wu, G.; Zhao, X. Recent declines in China’s largest freshwater lake: Trend or regime shift? Environ. Res. Lett. 2013, 8, 014010. [Google Scholar] [CrossRef]
  36. Feng, L.; Hu, C.; Chen, X.; Cai, X.; Tian, L.; Gan, W. Assessment of inundation changes of Poyang Lake using MODIS observations between 2000 and 2010. Remote Sens. Environ. 2012, 121, 80–92. [Google Scholar] [CrossRef]
  37. Yang, X.; Wu, J.; Liu, J.; Ye, X. Changes of Extreme Precipitation and Possible Influence of ENSO Events in a Humid Basin in China. Atmosphere 2021, 12, 1522. [Google Scholar] [CrossRef]
  38. Tao, H.; Fraedrich, K.; Menz, C.; Zhai, J. Trends in extreme temperature indices in the Poyang Lake Basin, China. Stoch. Environ. Res. Risk Assess. 2014, 28, 1543–1553. [Google Scholar] [CrossRef]
  39. Li, X.; Hu, Q. Spatiotemporal Changes in Extreme Precipitation and Its Dependence on Topography over the Poyang Lake Basin, China. Adv. Meteorol. 2019, 2019, 1253932. [Google Scholar] [CrossRef]
  40. Lei, X.; Gao, L.; Ma, M.; Wei, J.; Xu, L.; Wang, L.; Lin, H. Does non-stationarity of extreme precipitation exist in the Poyang Lake Basin of China? J. Hydrol. Reg. Stud. 2021, 37, 100920. [Google Scholar] [CrossRef]
  41. Zou, H.; Zhang, S.; Liu, Y.; Zhang, W.; Yang, X. Analysis of a Convective Storm Crossing Poyang Lake in China. J. Meteorol. Res. 2020, 34, 529–545. [Google Scholar] [CrossRef]
  42. Zou, H.; Wu, S.; Shan, J. Sensitivity of Lake-Effect Convection to the Lake Surface Temperature over Poyang Lake in China. J. Meteorol. Res. 2022, 36, 342–359. [Google Scholar] [CrossRef]
  43. Zhang, Z.; Chen, X.; Xu, C.-Y.; Hong, Y.; Hardy, J.; Sun, Z. Examining the influence of river–lake interaction on the drought and water resources in the Poyang Lake basin. J. Hydrol. 2015, 522, 510–521. [Google Scholar] [CrossRef]
  44. Pekel, J.F.; Cottam, A.; Gorelick, N.; Belward, A.S. High-resolution mapping of global surface water and its long-term changes. Nature 2016, 540, 418–422. [Google Scholar] [CrossRef]
  45. Wang, W.; Bruyère, C.; Duda, M.; Dudhia, J.; Gill, D.; Lin, H.-C. ARW Version 3 Modelling System User’s Guide. 2009. Available online: https://www2.mmm.ucar.edu/wrf/users/docs/user_guide_V3/contents.html (accessed on 1 August 2022).
  46. Subin, Z.M.; Riley, W.J.; Mironov, D. An improved lake model for climate simulations: Model structure, evaluation, and sensitivity analyses in CESM1. J. Adv. Modeling Earth Syst. 2012, 4, 2001. [Google Scholar] [CrossRef]
  47. Gu, H.; Jin, J.; Wu, Y.; Ek, M.B.; Subin, Z.M. Calibration and validation of lake surface temperature simulations with the coupled WRF-lake model. Clim. Chang. 2015, 129, 471–483. [Google Scholar] [CrossRef]
  48. Li, Z.; Gao, Y. Impact of Interaction between Metropolitan Area and Shallow Lake on Daily Extreme Precipitation over Eastern China. Atmosphere 2022, 13, 306. [Google Scholar] [CrossRef]
  49. Hong, S.-Y.; Lim, J.-O.J. The WRF single-moment 6-class microphysics scheme (WSM6). Asia-Pac. J. Atmos. Sci. 2006, 42, 129–151. [Google Scholar]
  50. Iacono, M.J.; Delamere, J.S.; Mlawer, E.J.; Shephard, M.W.; Clough, S.A.; Collins, W.D. Radiative forcing by long-lived greenhouse gases: Calculations with the AER radiative transfer models. J. Geophys. Res. Atmos. 2008, 113, D13. [Google Scholar] [CrossRef]
  51. Chen, F.; Dudhia, J. Coupling an advanced land surface–hydrology model with the Penn State–NCAR MM5 modeling system. Part I: Model implementation and sensitivity. Mon. Weather Rev. 2001, 129, 569–585. [Google Scholar] [CrossRef]
  52. Hong, S.-Y.; Noh, Y.; Dudhia, J. A new vertical diffusion package with an explicit treatment of entrainment processes. Mon. Weather Rev. 2006, 134, 2318–2341. [Google Scholar] [CrossRef]
  53. Grell, G.A.; Dévényi, D. A generalized approach to parameterizing convection combining ensemble and data assimilation techniques. Geophys. Res. Lett. 2002, 29, 38-1–38-4. [Google Scholar] [CrossRef]
  54. Hui, F.; Xu, B.; Huang, H.; Yu, Q.; Gong, P. Modelling spatial-temporal change of Poyang Lake using multitemporal Landsat imagery. Int. J. Remote Sens. 2008, 29, 5767–5784. [Google Scholar] [CrossRef]
  55. Stull, R.B. Static stability—An update. Bull. Am. Meteorol. Soc. 1991, 72, 1521–1530. [Google Scholar] [CrossRef]
  56. Laird, N.F.; Kristovich, D.A. Variations of sensible and latent heat fluxes from a Great Lakes buoy and associated synoptic weather patterns. J. Hydrometeorol. 2002, 3, 3–12. [Google Scholar] [CrossRef]
  57. Carpenter, D.M. The lake effect of the Great Salt Lake: Overview and forecast problems. Weather Forecast. 1993, 8, 181–193. [Google Scholar] [CrossRef]
  58. Dai, Y.; Wang, L.; Yao, T.; Li, X.; Zhu, L.; Zhang, X. Observed and simulated lake effect precipitation over the Tibetan Plateau: An initial study at Nam Co Lake. J. Geophys. Res. Atmos. 2018, 123, 6746–6759. [Google Scholar] [CrossRef]
  59. Lee, H.; Shum, C.K.; Tseng, K.-H.; Guo, J.-Y.; Kuo, C.-Y. Present-Day Lake Level Variation from Envisat Altimetry over the Northeastern Qinghai-Tibetan Plateau: Links with Precipitation and Temperature. Terr. Atmos. Ocean. Sci. 2011, 22, 169–175. [Google Scholar] [CrossRef]
  60. Steenburgh, W.J.; Halvorson, S.F.; Onton, D.J. Climatology of lake-effect snowstorms of the Great Salt Lake. Mon. Weather Rev. 2000, 128, 709–727. [Google Scholar] [CrossRef]
  61. Han, X.; Chen, X.; Feng, L. Four decades of winter wetland changes in Poyang Lake based on Landsat observations between 1973 and 2013. Remote Sens. Environ. 2015, 156, 426–437. [Google Scholar] [CrossRef]
  62. Huang, F.; Yan, B.; Zhang, X.; Zhao, D.; Guo, L.; Wang, Y.; Xia, Z. Water Regime Evolution of Large Seasonal Lakes: Indicators for Characterization and an Application in Poyang Lake, China. Int. J. Environ. Res. Public Health 2018, 15, 2598. [Google Scholar] [CrossRef] [PubMed]
  63. Jiang, X.; Wang, J.; Liu, X.; Dai, J. Landsat Observations of Two Decades of Wetland Changes in the Estuary of Poyang Lake during 2000–2019. Water 2022, 14, 8. [Google Scholar] [CrossRef]
  64. Partridge, T.F.; Winter, J.M.; Kendall, A.D.; Hyndman, D.W. Cross-scale evaluation of dynamic crop growth in WRF and Noah-MP-Crop. Agric. For. Meteorol. 2021, 296, 108217. [Google Scholar] [CrossRef]
  65. Warrach-Sagi, K.; Ingwersen, J.; Schwitalla, T.; Troost, C.; Aurbacher, J.; Jach, L.; Berger, T.; Streck, T.; Wulfmeyer, V. Noah-MP With the Generic Crop Growth Model Gecros in the WRF Model: Effects of Dynamic Crop Growth on Land-Atmosphere Interaction. J. Geophys. Res. Atmos. 2022, 127, e2022JD036518. [Google Scholar] [CrossRef]
  66. Xiao, C.; Lofgren, B.M.; Wang, J.; Chu, P.Y. Improving the lake scheme within a coupled WRF-lake model in the L aurentian G reat L akes. J. Adv. Modeling Earth Syst. 2016, 8, 1969–1985. [Google Scholar] [CrossRef]
  67. Li, S.; Gao, Y.; Lyu, S.; Liu, Y.; Pan, Y. Response of surface air temperature to the change of leaf area index in the source region of the Yellow River by the WRF model. Theor. Appl. Climatol. 2019, 138, 1755–1765. [Google Scholar] [CrossRef]
  68. Wang, X.; Li, Y.; Yan, M.; Gong, X. Changes in temperature and precipitation extremes in the arid regions of China, 1960–2016. Front. Ecol. Evol. 2022, 10, 902813. [Google Scholar] [CrossRef]
  69. Guan, Y.; Zhang, X.; Zheng, F.; Wang, B. Trends and variability of daily temperature extremes during 1960–2012 in the Yangtze River Basin, China. Glob. Planet. Chang. 2015, 124, 79–94. [Google Scholar] [CrossRef]
  70. Hong, L.; Si-rong, C.; Yuan, G.; Hui, H.; Sheng-xuan, X. Spatio-temporal variation characteristics of extremely heavy precipitation frequency over South China in the last 50 years. J. Trop. Meteorol. 2014, 20, 279. [Google Scholar]
  71. Shepherd, J.M.; Burian, S.J. Detection of urban-induced rainfall anomalies in a major coastal city. Earth Interact. 2003, 7, 1–17. [Google Scholar] [CrossRef]
  72. Bornstein, R.; Lin, Q. Urban heat islands and summertime convective thunderstorms in Atlanta: Three case studies. Atmos. Environ. 2000, 34, 507–516. [Google Scholar] [CrossRef]
  73. Diem, J.E.; Brown, D.P. Anthropogenic impacts on summer precipitation in central Arizona, USA. Prof. Geogr. 2003, 55, 343–355. [Google Scholar]
  74. Keeler, J.M.; Kristovich, D.A. Observations of urban heat island influence on lake-breeze frontal movement. J. Appl. Meteorol. Climatol. 2012, 51, 702–710. [Google Scholar] [CrossRef]
  75. Yang, L.; Smith, J.A.; Baeck, M.L.; Bou-Zeid, E.; Jessup, S.M.; Tian, F.; Hu, H. Impact of urbanization on heavy convective precipitation under strong large-scale forcing: A case study over the Milwaukee–Lake Michigan region. J. Hydrometeorol. 2014, 15, 261–278. [Google Scholar] [CrossRef]
  76. Wang, Y.; Gao, Y.; Qin, H.; Huang, J.; Liu, C.; Hu, C.; Wang, W.; Liu, S.; Lee, X. Spatiotemporal characteristics of lake breezes over Lake Taihu, China. J. Appl. Meteorol. Climatol. 2017, 56, 2053–2065. [Google Scholar] [CrossRef]
Figure 1. Land-use maps in wet (a) and dry (b) season.
Atmosphere 13 01490 g001
Figure 2. The domains for WRF simulations and the terrain height (m) for the domain. (a) Domains 1 to 4. (b) The terrain height in domain 4 and Poyang Lake (in blue). The rectangular dashed box in (b) is the area that will be used for analysis later in the work.
Atmosphere 13 01490 g002
Figure 3. The daily domain-averaged observed (black lines) and CTL (blue lines): (a) 2 m air temperature (°C) and (b) precipitation (mm) from 1 to 31 July. The domain calculated is in Figure 2b.
Atmosphere 13 01490 g003
Figure 4. Time series at 3 h intervals of (a) latent heat flux (W m−2), (b) sensible heat flux (W m−2), (c) land surface temperature (°C), and (d) precipitation (mm). The blue lines are the difference between the CTL and EXPT1 (EXPT1–CTL). The red lines are the difference between the CTL and EXPT2 (EXPT2–CTL). The areas used to calculate these four variables have been marked with dashed lines in Figure 2b.
Atmosphere 13 01490 g004
Figure 5. The distribution of the mean (ac) latent heat flux (W m−2), (df) sensible heat flux (W m−2), and (gi) land surface temperature (°C) from 1 to 31 July. The control experiment (CTL) is shown in (a,d,g). The difference between the CTL and EXPT1 (EXPT1–CTL) is shown in (b,e,h). The difference between the CTL and EXPT2 (EXPT2–CTL) is shown in (c,f,i). The black dashed line maps the Poyang Lake area in the CTL.
Atmosphere 13 01490 g005
Figure 6. The distribution of the mean (ac) potential temperature difference between 850 hPa and 1000 hPa (K), (df) the planetary boundary layer height (PBL) (m, and (gi) CAPE (J kg−1) from 13 to 31 July. The control experiment (CTL) is shown in (a,d,g). The difference between the CTL and EXPT1 (EXPT1–CTL) is shown in (b,e,h). The difference between the CTL and EXPT2 (EXPT2–CTL) is shown in (c,f,i). The black dashed line maps the Poyang Lake area in the CTL.
Atmosphere 13 01490 g006
Figure 7. The distribution of the mean total precipitation (mm) and 10 m wind speed (m s−1) from 1 to 12 July. (a) Total precipitation in the CTL; (b) difference between the CTL and EXPT (EXPT1–CTL) in total precipitation and the 10 m wind speed in EXPT1; (c) difference between CTL and EXPT2 (EXPT2–CTL) in total precipitation and the 10 m wind speed in EXPT2. The line AB in (a) is the cross section used in Figure 8.
Atmosphere 13 01490 g007
Figure 8. The mean cross sections of the wind (m s−1) and water vapor flux (g s−1 hPa−1 cm−1) from 1 to 12 July along Figure 7a for (a) CTL, (b) EXPT1, and (c) EXPT2. The dashed purple vertical lines indicate the extent of the Poyang Lake area. The Y-axis is the height in kilometers.
Atmosphere 13 01490 g008
Table 1. The averaged latent heat flux (W m−2), the sensible heat flux (W m−2), and the land surface temperature (°C) in Poyang Lake. The calculation domains are domain 4 and the rectangular dashed box in Figure 2b.
CTLEXPT1–CTLEXPT2–CTL
Domain4RectangularDomain 4RectangularDomain 4Rectangular
LH148.6150.6−5.6−10.4−7.0−11.2
SH48.137.10.8−1.15.213.4
LST30.430.5−0.1−0.30.10.3
Table 2. The domain-averaged wind speed (m s−1) and precipitation (mm) in Poyang Lake. The domain for calculating the wind speed is between the purple vertical lines in Figure 8 and the domain for calculating the precipitation is shown in Figure 7a.
CTLEXPT1EXPT2
Wind24.010.826.2
Precipitation89.867.566.0
Publisher’s Note: MDPI stays neutral with regard to jurisdictional claims in published maps and institutional affiliations.

