Abstract
The surface atmospheric O3 concentration in Kunming shows a significant upward trend, with high values mainly occurring in March–May. Volatile organic compounds (VOCs) are one of the most important precursors of O3. However, the sources of VOCs are complex and difficult to identify. In order to understand the pollution levels, the spatial distribution characteristics, and possible sources of VOCs, we conducted simultaneous offline sampling at representative sites in six different functional areas of Kunming using SUMMA canisters for one week. The VOC samples were analyzed via GC/MS. The VOC data were analyzed (using the feature ratio method, ozone formation potential (OFP), and Positive Matrix Factorization (PMF) model). Some important conclusions were drawn. Firstly, VOCs during the spring in Kunming were mainly derived from oxygenated VOCs, aromatic hydrocarbons, and halogenated hydrocarbons, with significant spatial differences. Secondly, we found that the potential for atmospheric ozone formation is higher in Kunming for aromatic hydrocarbons and oxygenated VOCs. Finally, the results of the Positive Matrix Factorization model (PMF) showed that Kunming’s ambient atmospheric VOCs mainly originate from anthropogenic source emissions. These conclusions can provide useful reference information for O3 pollution control in Kunming.
1. Introduction
VOCs represent a significant category of air pollutants with profound implications for human health [1,2]. Exposure to VOCs can lead to a range of digestive, kidney, cardiac, and nervous disorders when ingested, when they come into contact with the skin, or when inhaled [2,3]. For example, BTEX (i.e., the group of VOCs that comprise benzene, toluene, ethyl-benzene, and xylenes) are toxic upon inhalation and cause cancer [4]. In particular, benzene is listed as a first-class carcinogen by the International Institute of Cancer (IARC).
VOCs in the atmosphere are mainly derived from natural sources (woods and shrubs) and anthropogenic sources (industrial activities and vehicle emissions). A global VOC emissions inventory of anthropogenic sources was established in 1990, where wood fuel combustion, savannah combustion, gasoline production, waste treatment, the organic chemical industry, and other sectors were found to be the main emission sources [5].
The first inventory of anthropogenic sources of VOCs was found in China from 1990 to 2000 and was established by referring to the emission factors from Western countries [6]. After that, more studies began to focus on VOC emission inventories from anthropogenic sources in China. For example, Wei [7] and Gong [8] established a VOC emission inventory from 2005 to 2010 in China, which was more accurate than its predecessor owing to its refinement and localization of emission factors. In 2000, the AVOCs emissions inventory of anthropogenic sources at the county level in China was compiled based on an investigation into activity data for all cities, prefecture-level cities, and counties throughout the country [8,9]. Moreover, a couple of studies focused on VOC emission inventories for some key regions, such as north China, the Yangtze River Delta (YRD), the Pearl River Delta (PRD), and other areas [10,11,12,13].
Along with the rapid expansion of the economy and urbanization, ozone pollution in Southwest China has escalated, causing growing concerns [14]. NOX and VOCs can undergo photochemical reactions in the presence of sunlight, leading to the production of ozone and secondary organic aerosols [15], which can adversely affect crop yield [16], air quality [17], and human health [18,19]. Ozone diagnostic studies are essential to determine appropriate strategies, as O3–NOX relationships are highly non-linear. The sensitivity of O3 to NOX and VOCs can be determined by analyzing the concentration or reactivity ratios of precursor VOCs to NOX (VOCs/NOX) [20,21,22]. Previous studies have demonstrated that most cities in China are in the VOC-limited regime [23]. Kunming is situated in the southwest of China, in the center of the Yunnan–Guizhou Plateau, and is, thus, subject to the influence of subtropical monsoons.
From 2014 to 2017, anthropogenic VOCs in Kunming mainly originated from industries with a proportion of 32–87% [24]. During the spring, ozone pollution appeared to intensify, which is largely attributed to the long-range transport of pollutants originating from biomass–burning activities in Southeast Asia. Nevertheless, it is worth noting that the primary source of VOCs in Kunming remains a subject of uncertainty and warrants further investigation [25].
In this study, we strategically set up six sampling sites across Kunming, encompassing diverse environmental settings, including suburban, urban, and industrial areas. Atmospheric samples were collected at these locations using SUMMA canisters for a comprehensive analysis of the composition of VOCs. This study further entailed the calculation of the ozone formation potential (OFP). Employing the Positive Matrix Factorization model (PMF), we investigated the sources and contributions of VOCs. Our research delved into the spatial distribution of VOCs in Kunming, ultimately contributing to a better understanding of VOCs’ origin during the spring season and their role in ozone formation. This study, in turn, furnishes valuable insights and recommendations for enhancing air pollution control measures in Kunming.
2. Materials and Methods
2.1. Sampling Site and Method
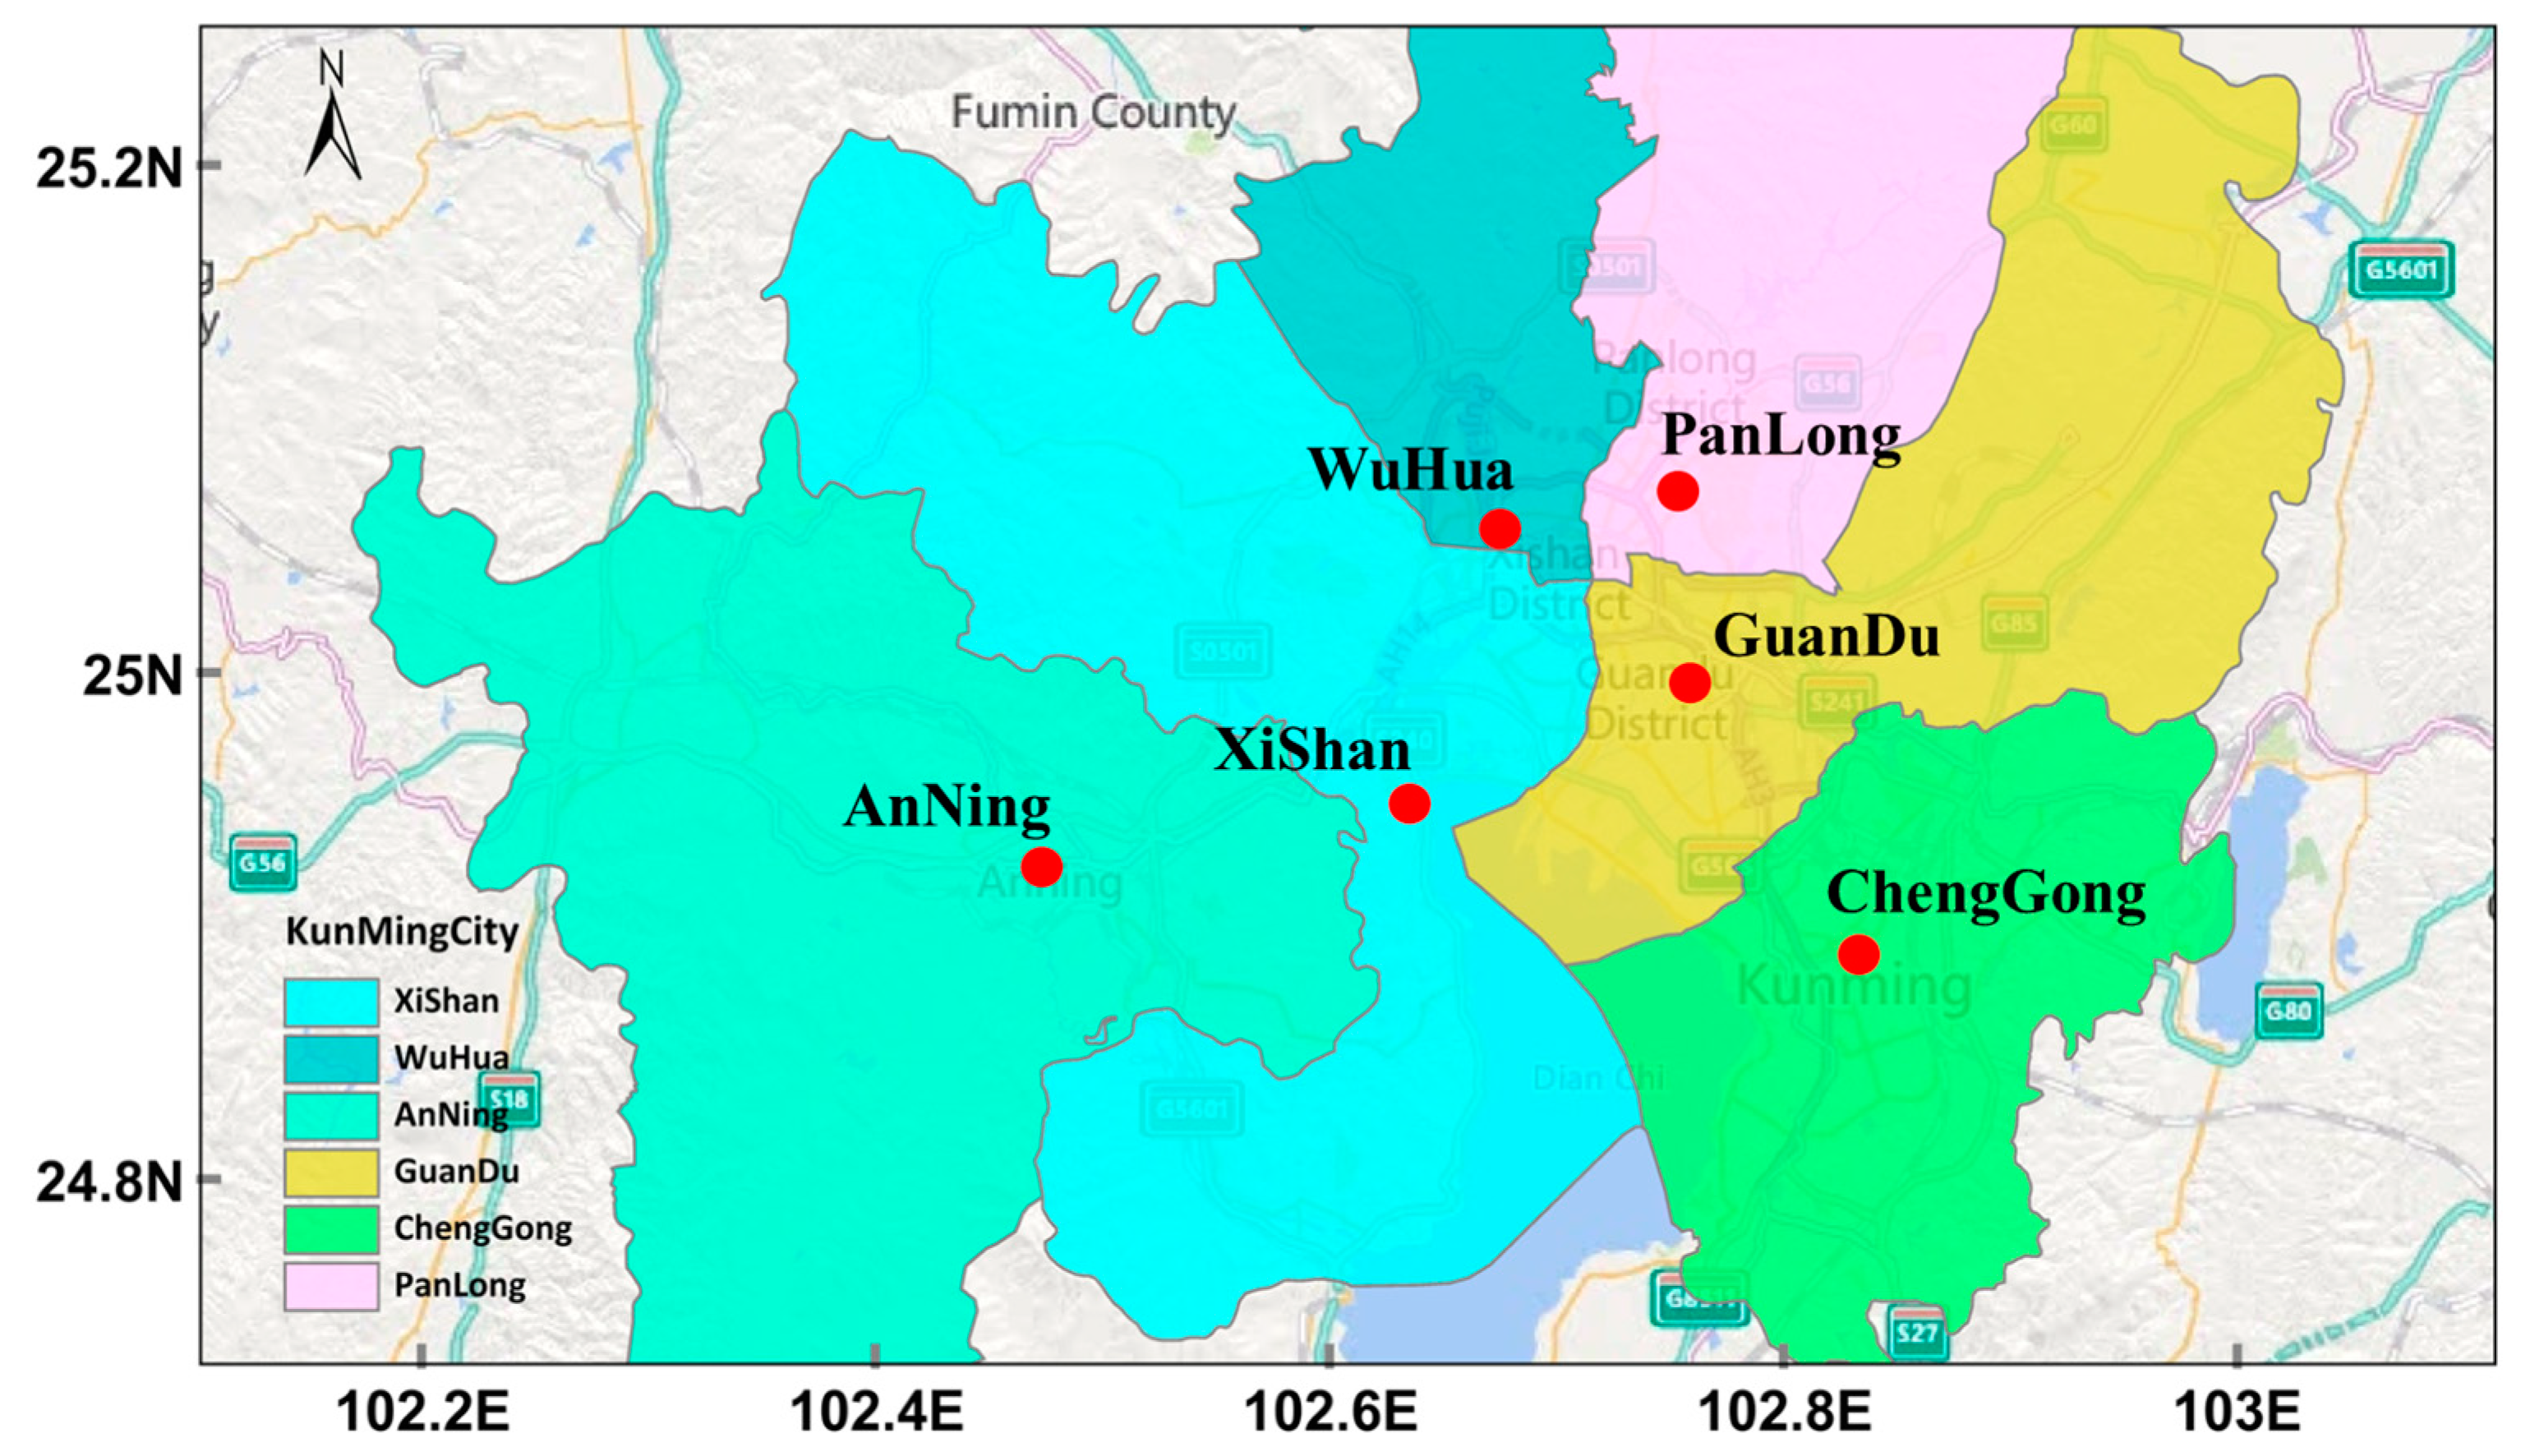
Based on the “Technical Specification for the Layout of Ambient Air Quality Monitoring Sites (Trial)” (HJ 664-2013) [26], the “2018 Ambient Air Volatile Organic Compounds (VOCs) Monitoring Program for Key Areas” (EIAO Monitoring Letter (2017) No. 2024) [27] and other relevant requirements, in combination with the gradient of Kunming’s urbanization development and functional zoning, meant that one site was selected in each of the six jurisdictions in Kunming (Figure 1, Table 1) during the spring of 2021. The offline collection of ambient atmospheric VOC samples was also carried out. Six monitoring sites were proposed to cover different wind directions (upwind and downwind), different urbanization characteristics (urban areas, suburban areas), and major land use types (industrial areas, urban sites) in Kunming. In spring 2021, we conducted one week (19–25 April) of VOC sample collection and analysis during a period of favorable meteorological conditions in the high ozone pollution season.
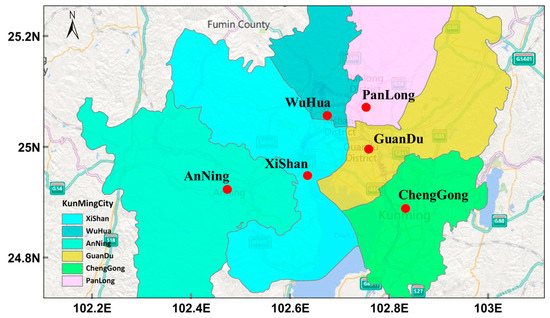
Figure 1.
Sampling points for VOCs in ambient atmosphere.

Table 1.
Environmental atmospheric sampling information for VOCs.
2.2. Sampling and Analysis
Monitoring VOCs is mainly based on the “Technical Requirements for Manual Monitoring of Ozone Precursor Organic Compounds in Ambient Air (Trial)” (Environmental Office Monitoring Letter [2018] No. 240) [28]. This monitoring involves the use of SUMMA canisters equipped with 1 h restriction valves. According to the diurnal variation in VOCs in other studies [6], the concentration of VOCs from 9:00 to 10:00 and from 14:00 to 15:00 is similar to the average value of VOCs over the whole day, which basically represents the daily concentration level of VOCs. Combined with the actual situation of the experiment, we carried out a one-hour offline sampling from 9:00 to 10:00 and from 14:00 to 15:00. The preconcentration gas chromatography/mass spectrometry (GC/MS) method was utilized in the laboratory to conduct a comprehensive quantitative analysis of 57 VOCs considered to be ozone precursors, as well as 65 industrial toxic and hazardous compounds present in the samples.
In this study, atmospheric VOC samples were analyzed using the EPA TO-15 analytical method. When the samples arrived at the laboratory, each SUMMA canister was pressurized to a dilution factor of 2, and then 1 L of the gas sample was enriched in a cold trap using an Entech 7100 pre-cooling concentrator (Entech Instruments Inc., Simi Valley, CA, USA), and then analyzed using GC-MS (Agilent 6890N-5973N, Agilent Technologies, Inc., Wilmington, DE, USA.). GC-MS was performed on a GS-GASPRO column (GS-GASPRO, 60 m × 0.32 mm, Agilent Technologies, Inc., Wilmington, DE, USA). The temperature increase program was 80 °C (0.5 min), 25 °C/min to 175 °C (2 min), and 15 °C/min to 250 °C (15 min). The inlet temperature of the mass spectrometer was set to 250 °C, the temperature of the ion source was set to 230 °C, and the scanning mode selected was ion scanning.
2.3. Positive Matrix Factorization (PMF) Model
The main sources of atmospheric VOCs in Kunming were quantitatively analyzed using the Positive Matrix Factorization (PMF) 5.0 model to clarify the contributions of transport sources, combustion sources, domestic sources, industrial sources, and the use of paints and coatings to urban atmospheric VOCs. PMF is a widely used receptor modeling method for air pollutant source analysis [29]. The goal of modeling with PMF is to identify the number of factors p, the species profile fk of each factor k, and the amount of mass gk contributed by each factor k to each individual sample (Equation (1)). In this study, PMF version 5.0, provided by the U.S. Environmental Protection Agency (U.S. EPA), was used, and its calculation principle is as follows:
where xij represents the mass concentration of the species j measured in the sample I, p denotes the number of factors contributing to the sample, gik is the mass concentration of the factor k contributing to the sample I, fkj represents the mass percentage of the species j in the factor k, and eij is the residual of the concentration of the species j in the sample i. Meanwhile, the concentration value of the contributing factor g and the mass percentage of each species in the contributing factor f constantly changed during the running of the model until it obtained a minimum value of Q. Q, which is calculated as follows [30]:
where uij represents the uncertainty of the concentration of the species j in the sample i, and EF (Error Fraction) is the error factor selected based on the experience. In this study, the EF is 10%, and MDL is the minimum detection value for the concentration of the chemically composed species.
2.4. Methodology Parameters for Analyzing the Ozone Formation Potential of VOCs
The ozone generation potential of different VOC components is characterized by ozone formation potential (OFP), which is calculated as the product of the atmospheric concentration of a VOC species and its maximum incremental reactivity [31]:
where OFPi denotes the O3 production contribution of compound i; [VOC]i denotes the observed concentration of species i; and MIRi denotes the maximum O3 concentration that can be produced by increasing the concentration of species i per unit of VOCs at different ratios of VOCs/NOX in g (O3)/g (VOCs). The values of the MIR for different compounds at different ratios of VOCs/NOX can be obtained via consulting the relevant literature [32]. Through a comparison of the OFP among various VOC fractions, we identified VOCs with a higher OFP, designating them as pivotal VOC precursors.
3. Results and Discussion
3.1. Meteorology Data and Ozone Concentration during Sampling Period
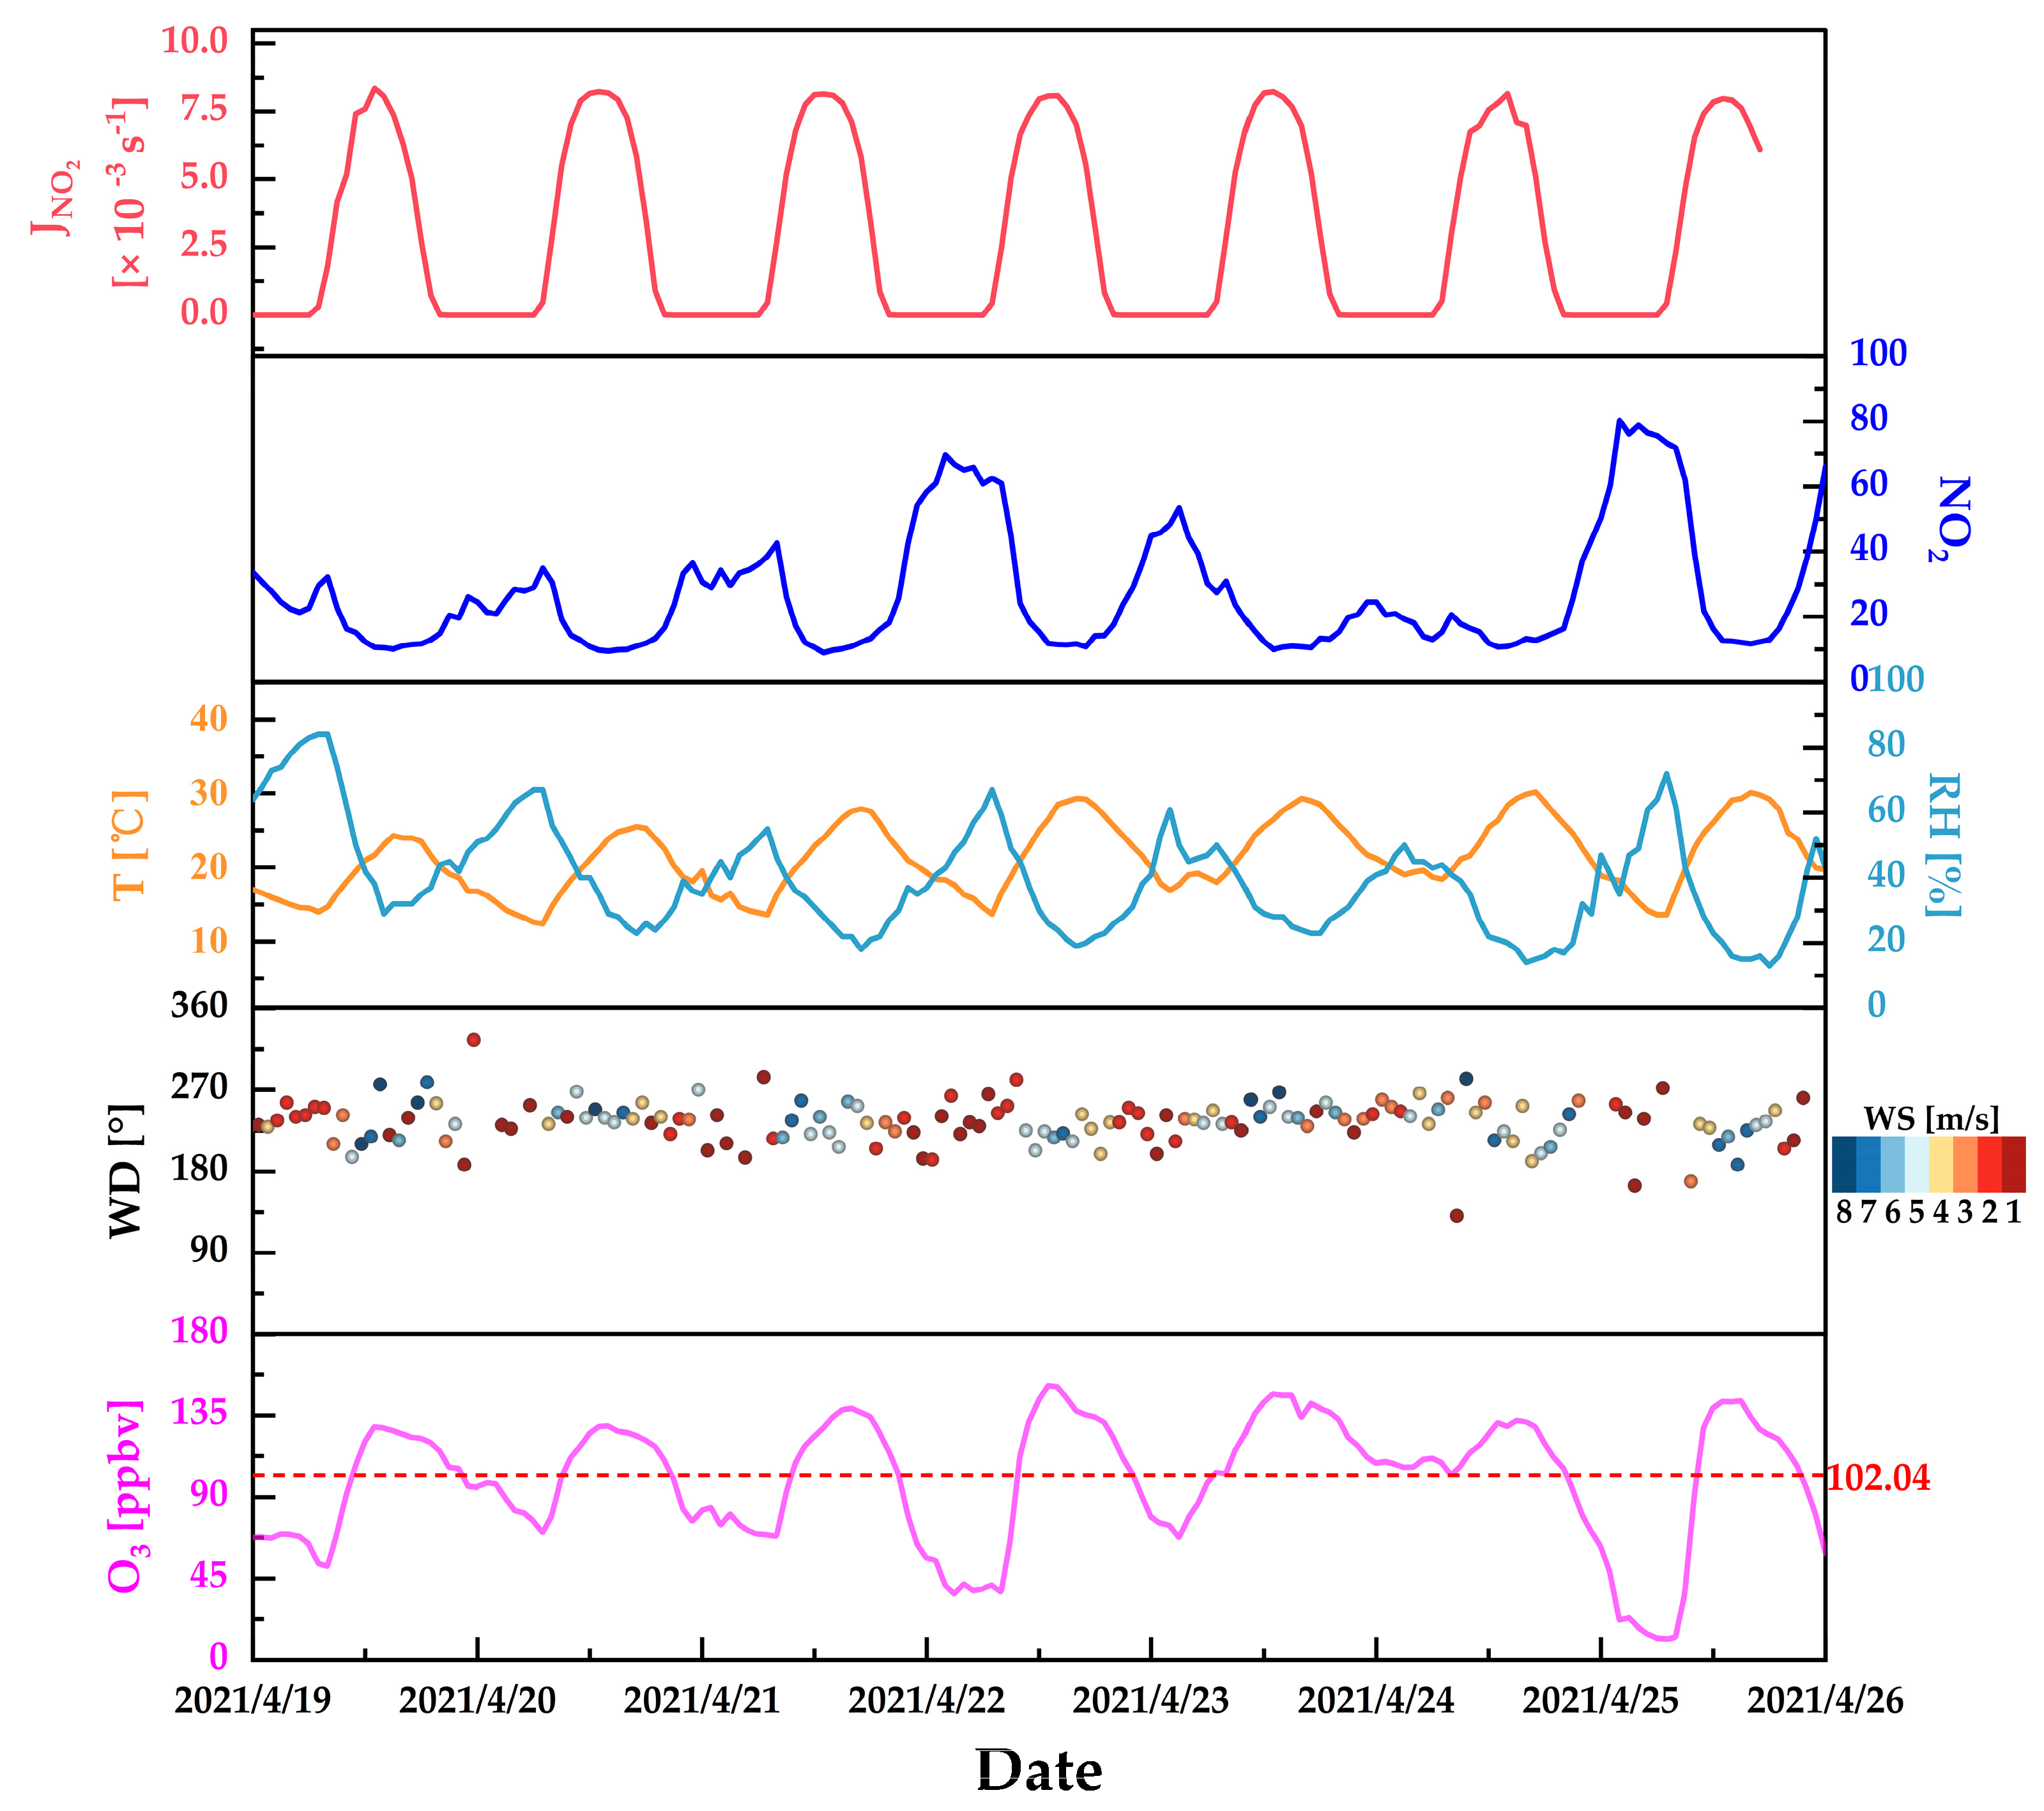
Figure 2 shows the meteorology data and ozone concentration during the sampling period. The Jvalue of NO2 () showed that, during the sampling period, sunlight was sufficient and easily photochemically reacted to produce ozone. The average NO2 concentration was 27 ppbv. NO2 is significantly negatively correlated with the ozone concentration, and the peaks and troughs of the two correspond well. The atmospheric pressure did not change much, indicating that the weather conditions were relatively stable. The highest temperature was 30.2 °C, and the lowest was 12.4 °C; the average temperature during the sampling period was 21.3 °C. The average daytime humidity was 34.7%. High temperature and low humidity conditions were conducive to the occurrence of photochemical reactions, resulting in ozone pollution. The dominant wind was from the southwest, with higher mean wind speeds during the daytime (5.5 m/s) than during the nighttime (2.7 m/s). Furthermore, the ozone concentration (hourly average) exceeded the standard (102.4 ppbv, according to the secondary standard of the Ambient Air Quality Standard (GB 3095-2012) [33]), with an average concentration of 115 ppbv during the daytime. The highest concentration of 151 ppbv was recorded at 13:00 on 22 April.
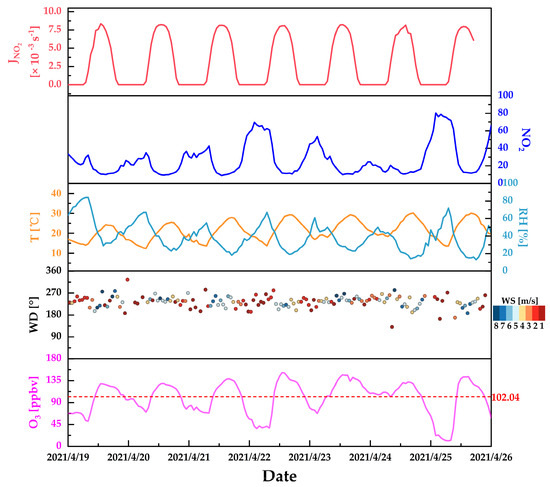
Figure 2.
Time series of Jvalue for NO2 (), NO2 concentration, temperature (T), relative humidity (RH), wind direction (WD), wind speed (WS) and O3 concentration during sampling period.
3.2. Ambient Levels of VOCs in Kunming
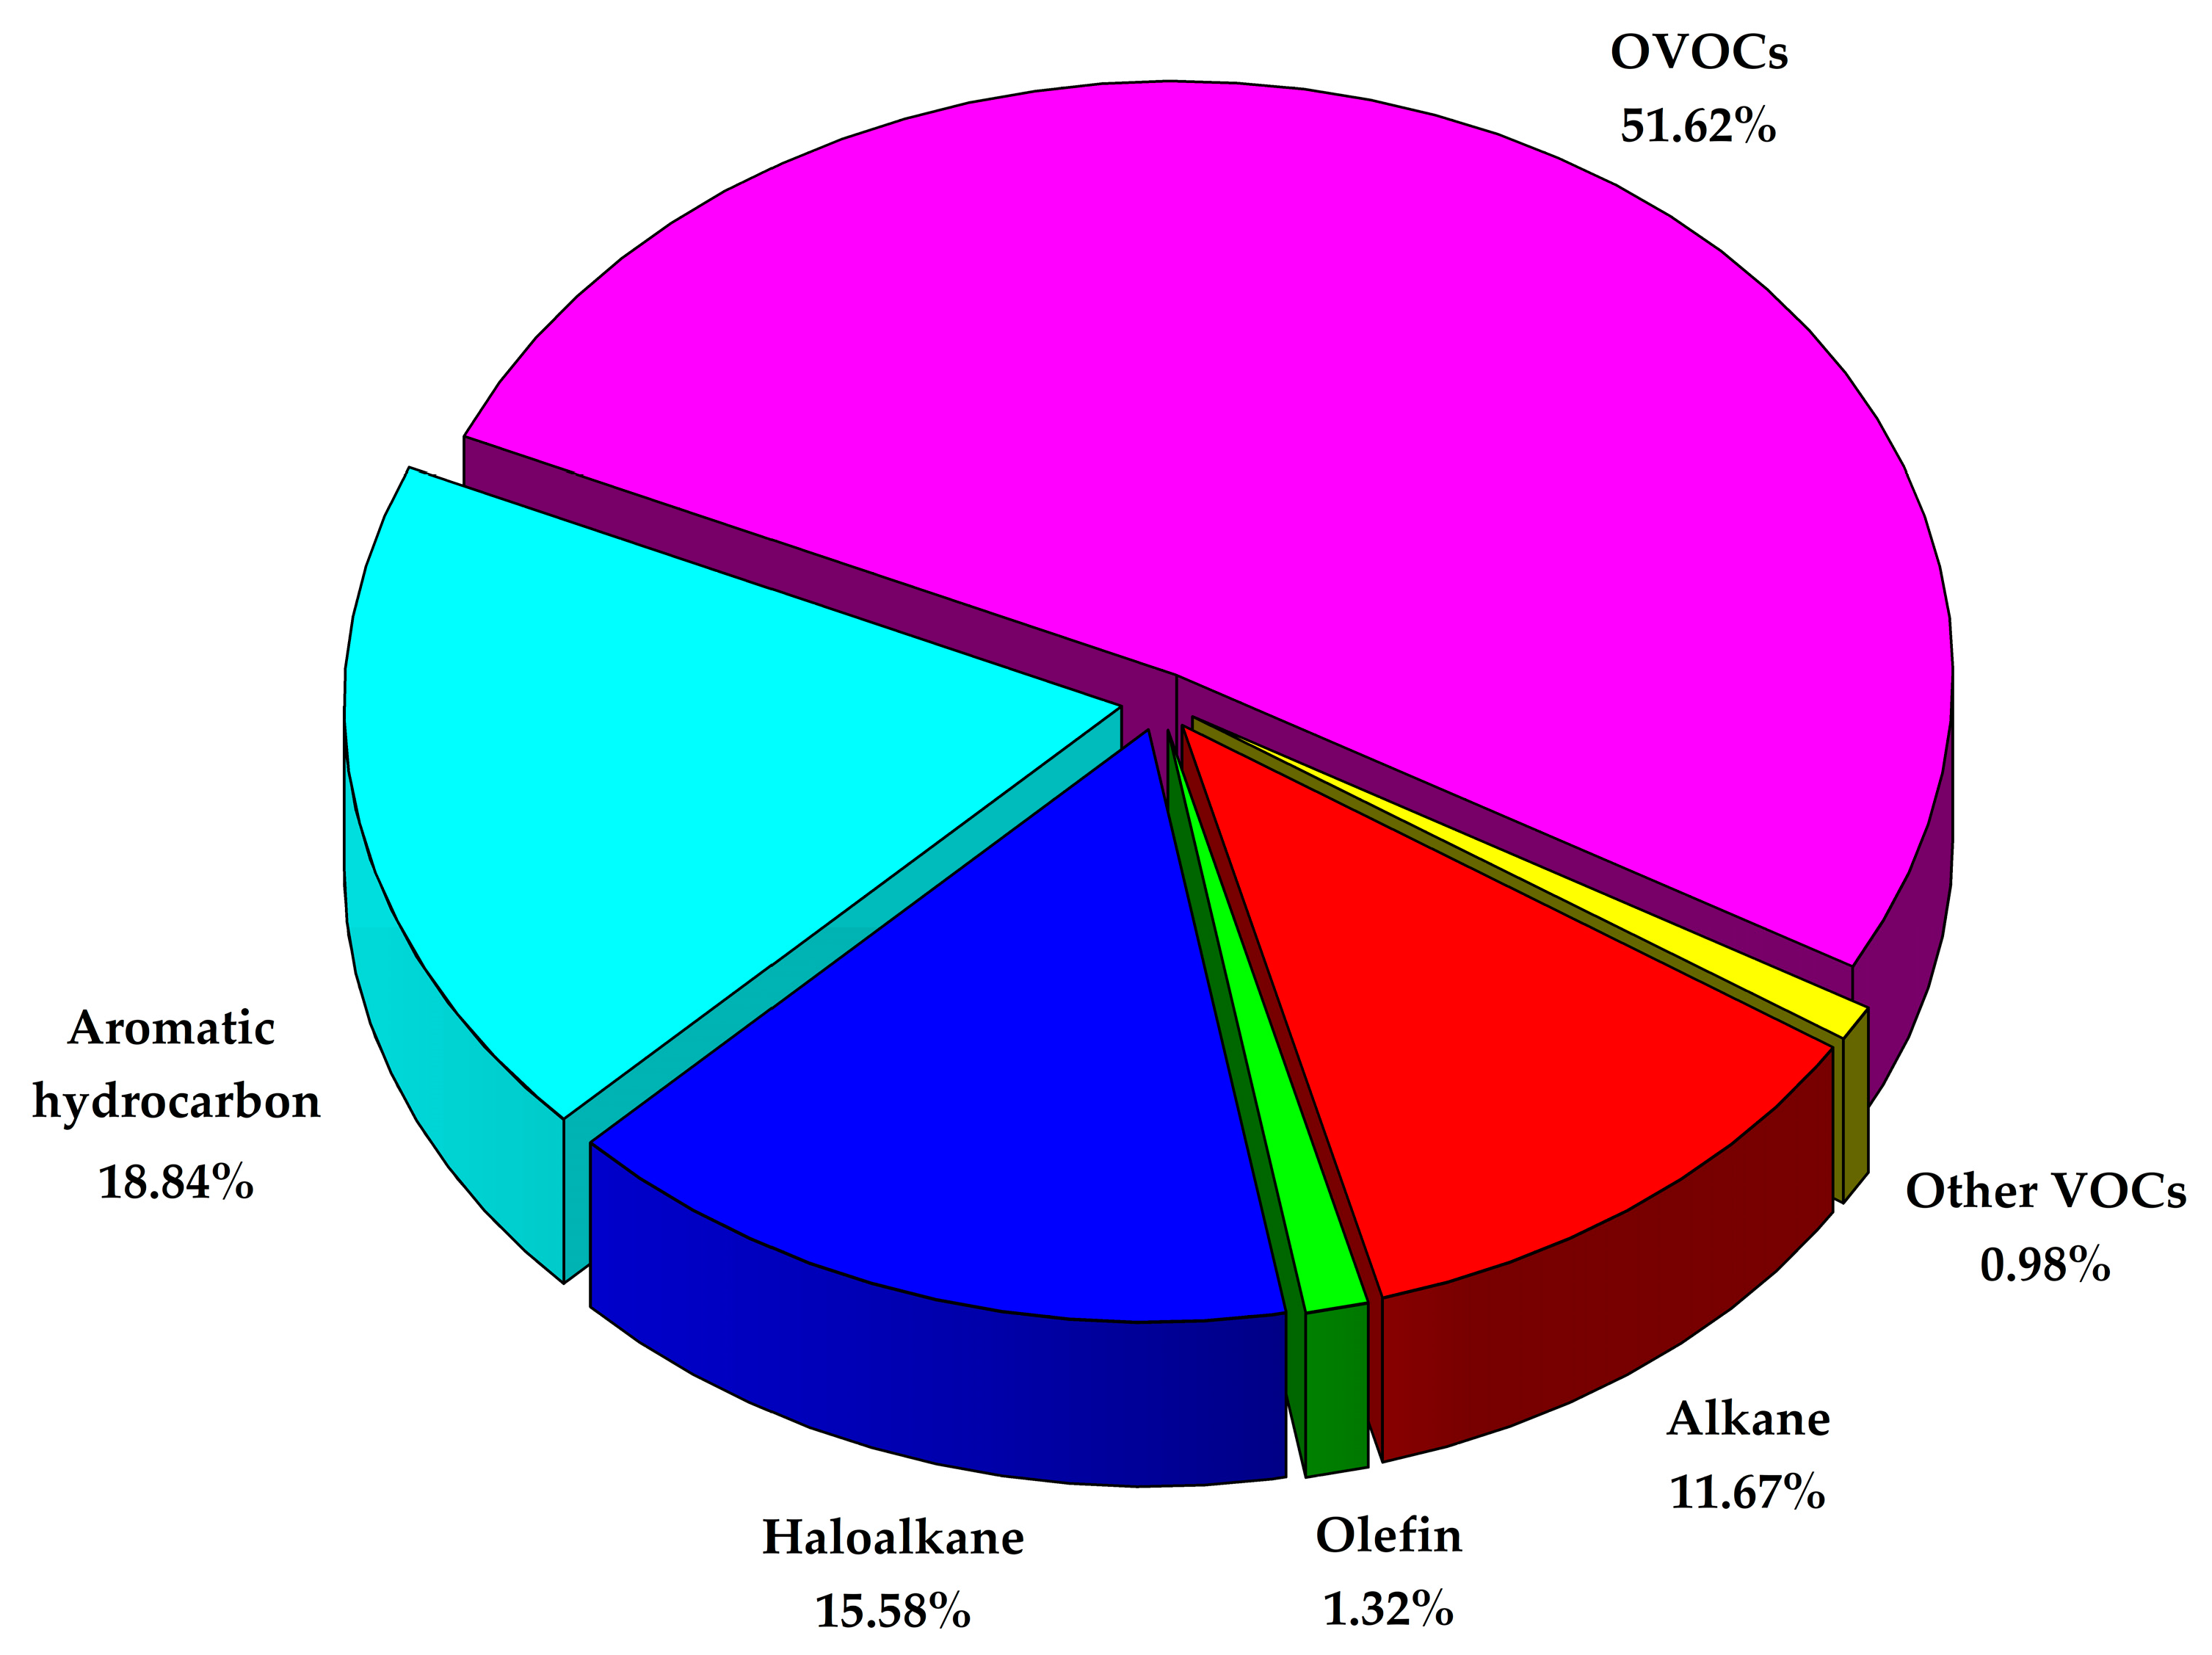
In spring, Kunming exhibited an average VOC concentration of 130.4 μg/m3, with the detection of 100+ VOC components categorized into six distinct types (olefins, alkanes, halogenated hydrocarbons, aromatic hydrocarbons, oxygenated VOCs (OVOCs), and others, as shown in Figure 2). Notably, OVOCs constituted the largest proportion in Kunming during the spring season, accounting for 51.62% of the total. Additionally, other VOC types with relatively high proportions included aromatic hydrocarbons (18.84%), halogenated hydrocarbons (15.58%), and alkanes (11.67%), as illustrated in Figure 3. The detected concentrations of ambient atmospheric VOC components at each sampling point in spring ranged from 98.66 to 176.07 μg/m3, and the individual components with higher concentrations included acetone (53.22 μg/m3, 45.36%), toluene (12.65 μg/m3, 10.78%), 1,2-dichloroethane (4.81 μg/m3, 4.10%), m,p-xylene (3.04 μg/m3, 2.59%), dichlorodifluoromethane (2.85 μg/m3, 2.43%), dichloromethane (2.73 μg/m3,2.33%), isopentane (2.38 μg/m3, 2.03%), isopropyl alcohol (2.08 μg/m3, 1.77%), isobutane (2.02 μg/m3, 1.72%), and benzene (2.01 μg/m3, 1.71%).

Figure 3.
Composition of ambient atmospheric VOCs species in Kunming (an average of six sampling sites).
The average concentration of VOCs in this study was 33.50 ppbv during the campaign. The VOC level was relatively lower than those observed in Chengdu (57.54 ppbv, 12.36 to 456.04 ppbv) [34], Heshan (61 ± 35.5 ppbv) [6], Beijing (33.2 ± 23.4 ppbv) [35], the mid-lower Yangtze River (Shanghai–Jiangsu section (82.1 ± 13.4 ppbv), Hubei–Jiangxi section (59.2 ± 12.9 ppbv), Anhui section (48.6 ± 9.8 ppbv)) [36], Dianshan Lake (15.41 ± 11.39 ppbv) [37], Changzhou (39.52 ± 23.14 ppbv) [38], and Liucheng (27.52 ppbv) [39].
3.3. Spatial Distribution Charaacteristics of VOCs
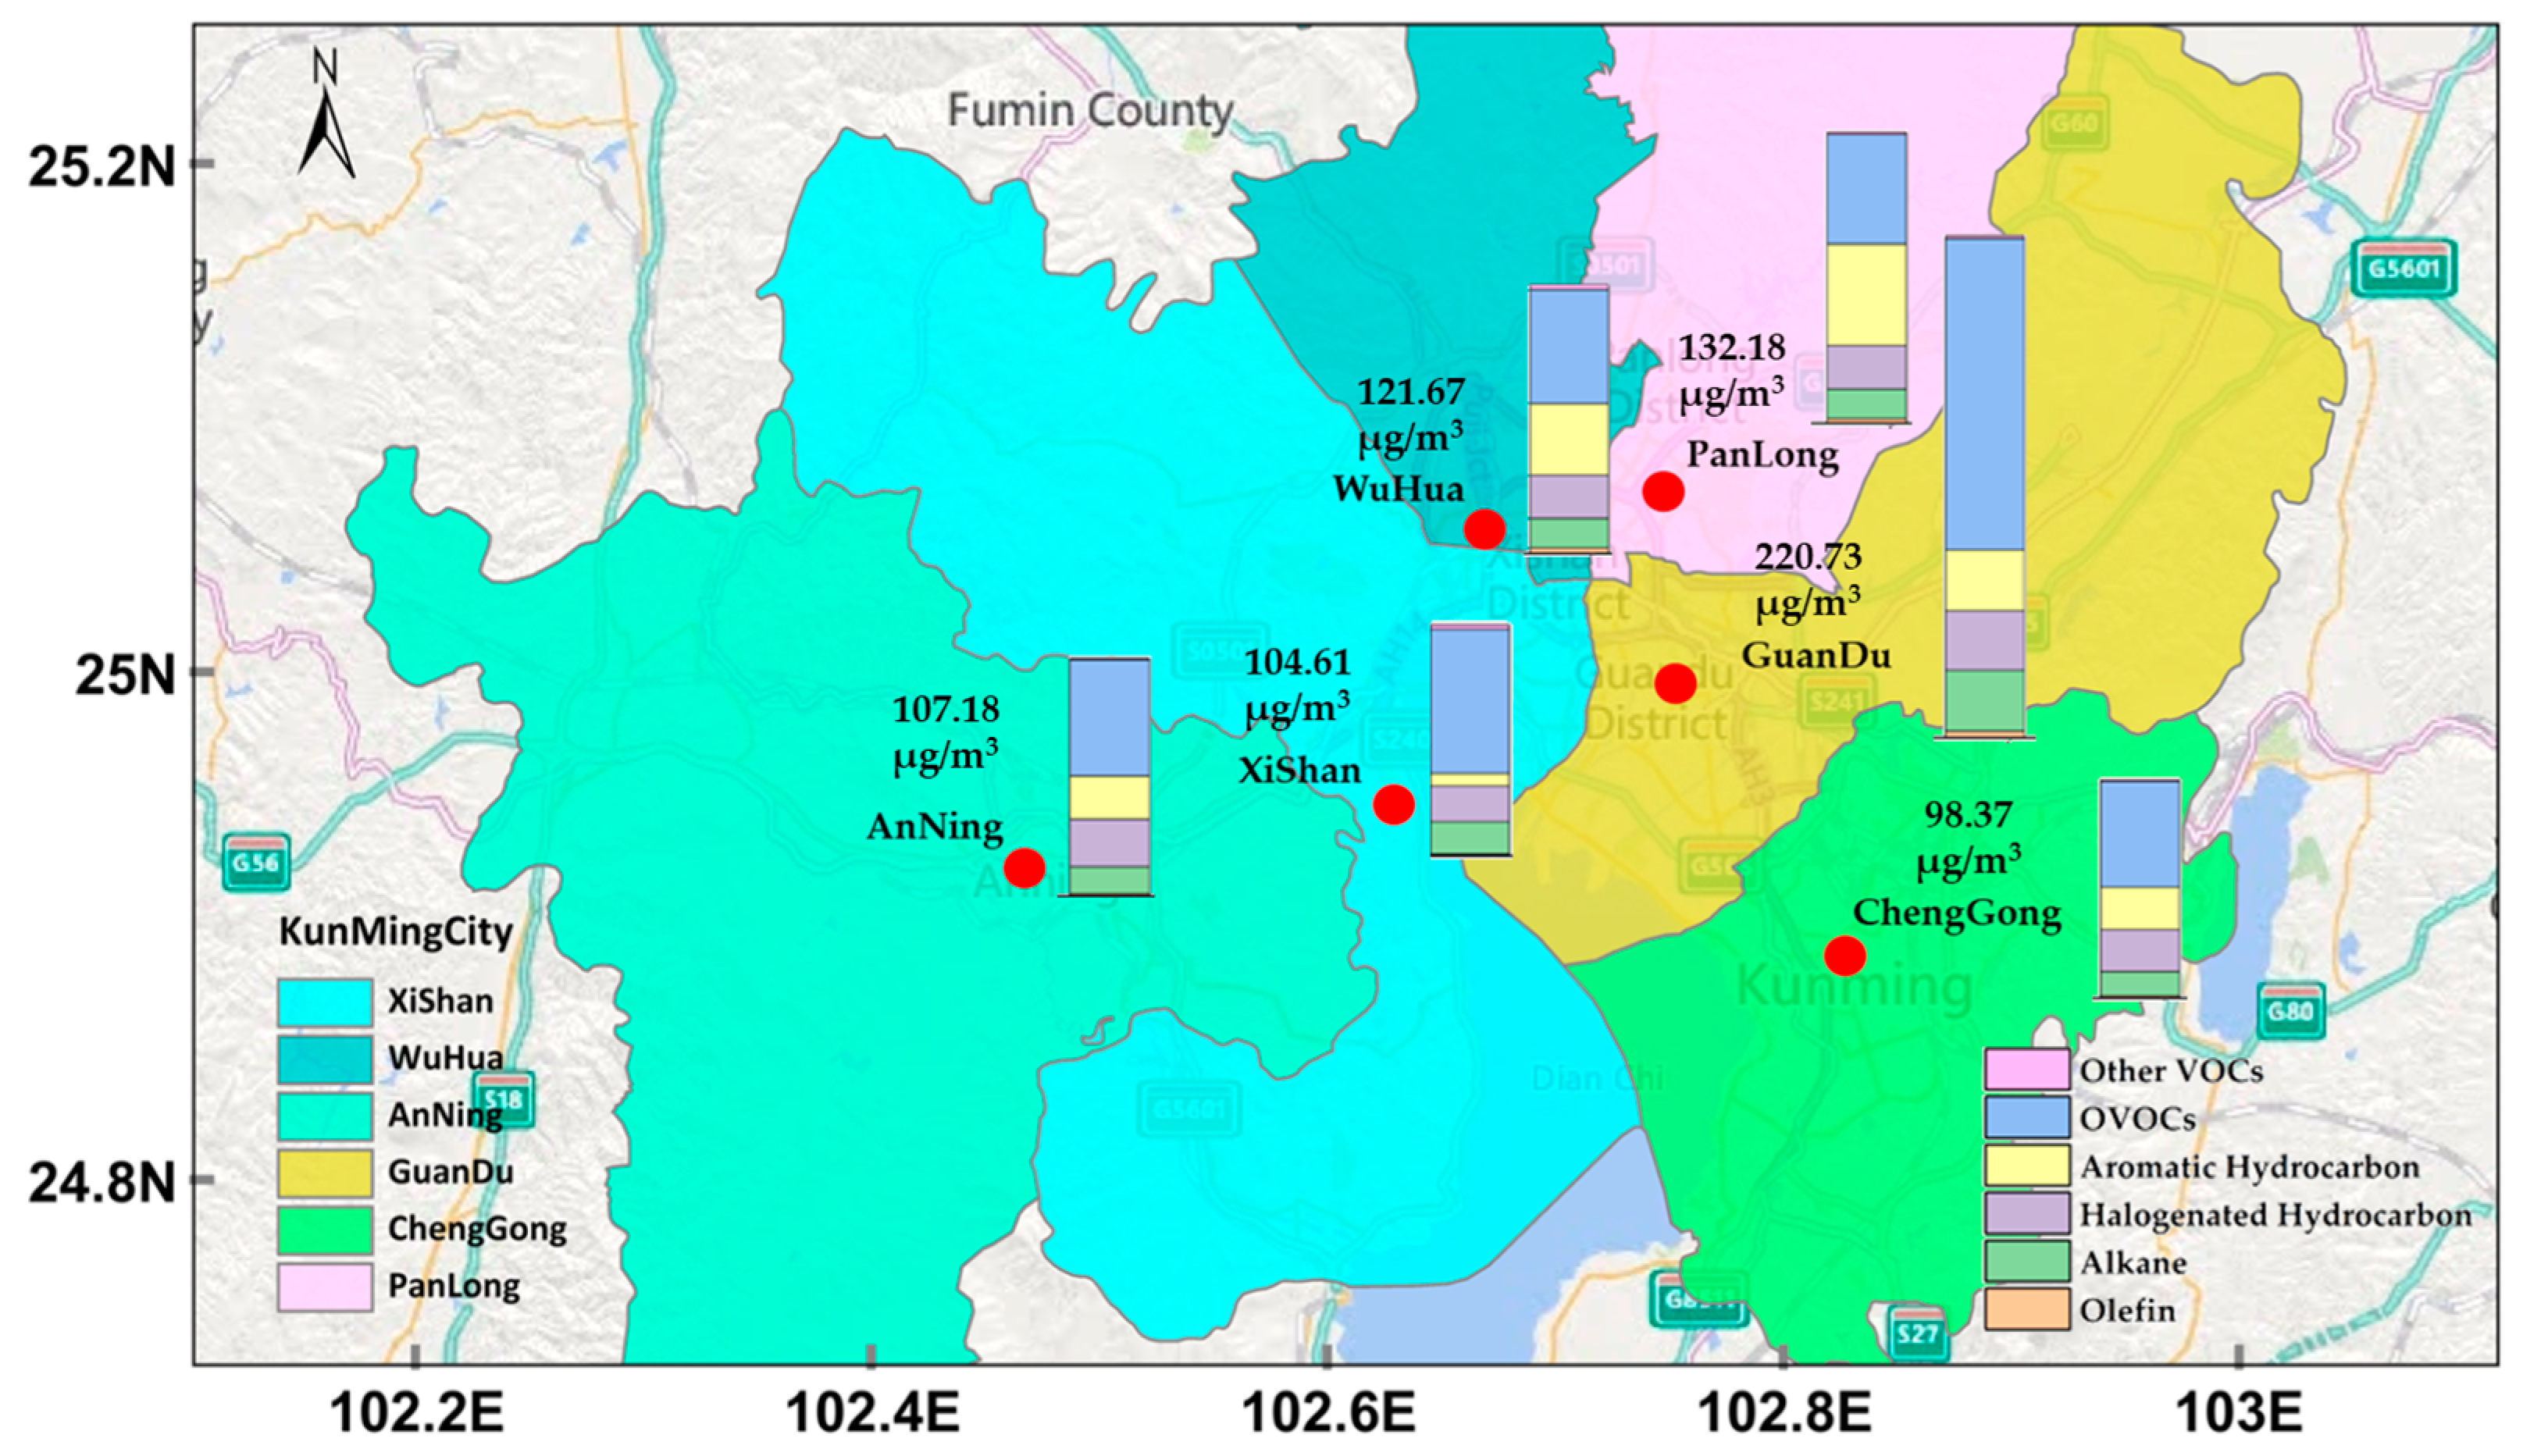
Throughout the sampling period, the atmospheric VOC concentrations exhibited significant fluctuations at each sampling location, with a range of 98.37 to 220.73 μg/m3 for the 1% to 99% quartiles of all VOCs data at each sampling point during the spring season. Specifically, the GuanDu district and ChengGong district experienced more pronounced fluctuations in ambient atmospheric VOCs. In contrast, the XiShan district and AnNing district had the smallest range of fluctuations for atmospheric VOCs.
Figure 4 shows the concentration and composition of VOCs at different sample sites. We observed a higher concentration of VOCs in the GuanDu district. This may be due to the fact that there are more small industrial enterprises and several large logistics hubs with more trucks traveling to and from the area, resulting in greater VOC emissions. The XiShan district has comparable levels of VOC concentrations to the AnNing district and ChengGong district; overall, pollution levels are low. The sampling point in the XiShan district serves as a background point, with no direct emissions from transportation and industrial sources in the vicinity, which may be affected more by transmission.
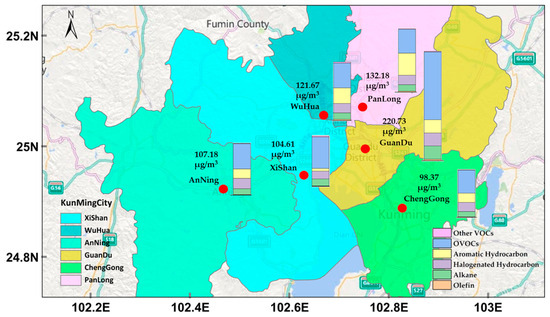
Figure 4.
VOC concentrations and compositions at different sample sites.
3.4. Analysis of Tracer Species Characterizing Anthropogenic Sources
Due to the specificity of VOCs emitted by different emission sources, the feature ratio method can be used to preliminarily judge the pollution sources of VOCs [40]. In this study, propane, toluene, benzene, m-p-xylene, and ethylbenzene were selected for species characteristic ratio analysis, and the results are shown in Table 2.
Table 2.
Characteristic tracer species and source identification of atmospheric VOCs.
Based on the analytical results, our aim is to elucidate the concentration levels and spatial distribution characteristics of atmospheric VOCs in Kunming City. We also sought to identify the key reactive VOC components with significant potential contributions to atmospheric O3 formation. Furthermore, we intended to systematically analyze the atmospheric environmental samples using various techniques, including characteristic ratios (benzene/toluene, etc.) [41], as well as receptor modeling methods like the Positive Matrix Factorization (PMF) model [42]. This comprehensive approach allows us to systematically analyze the primary industrial sources of atmospheric VOCs.
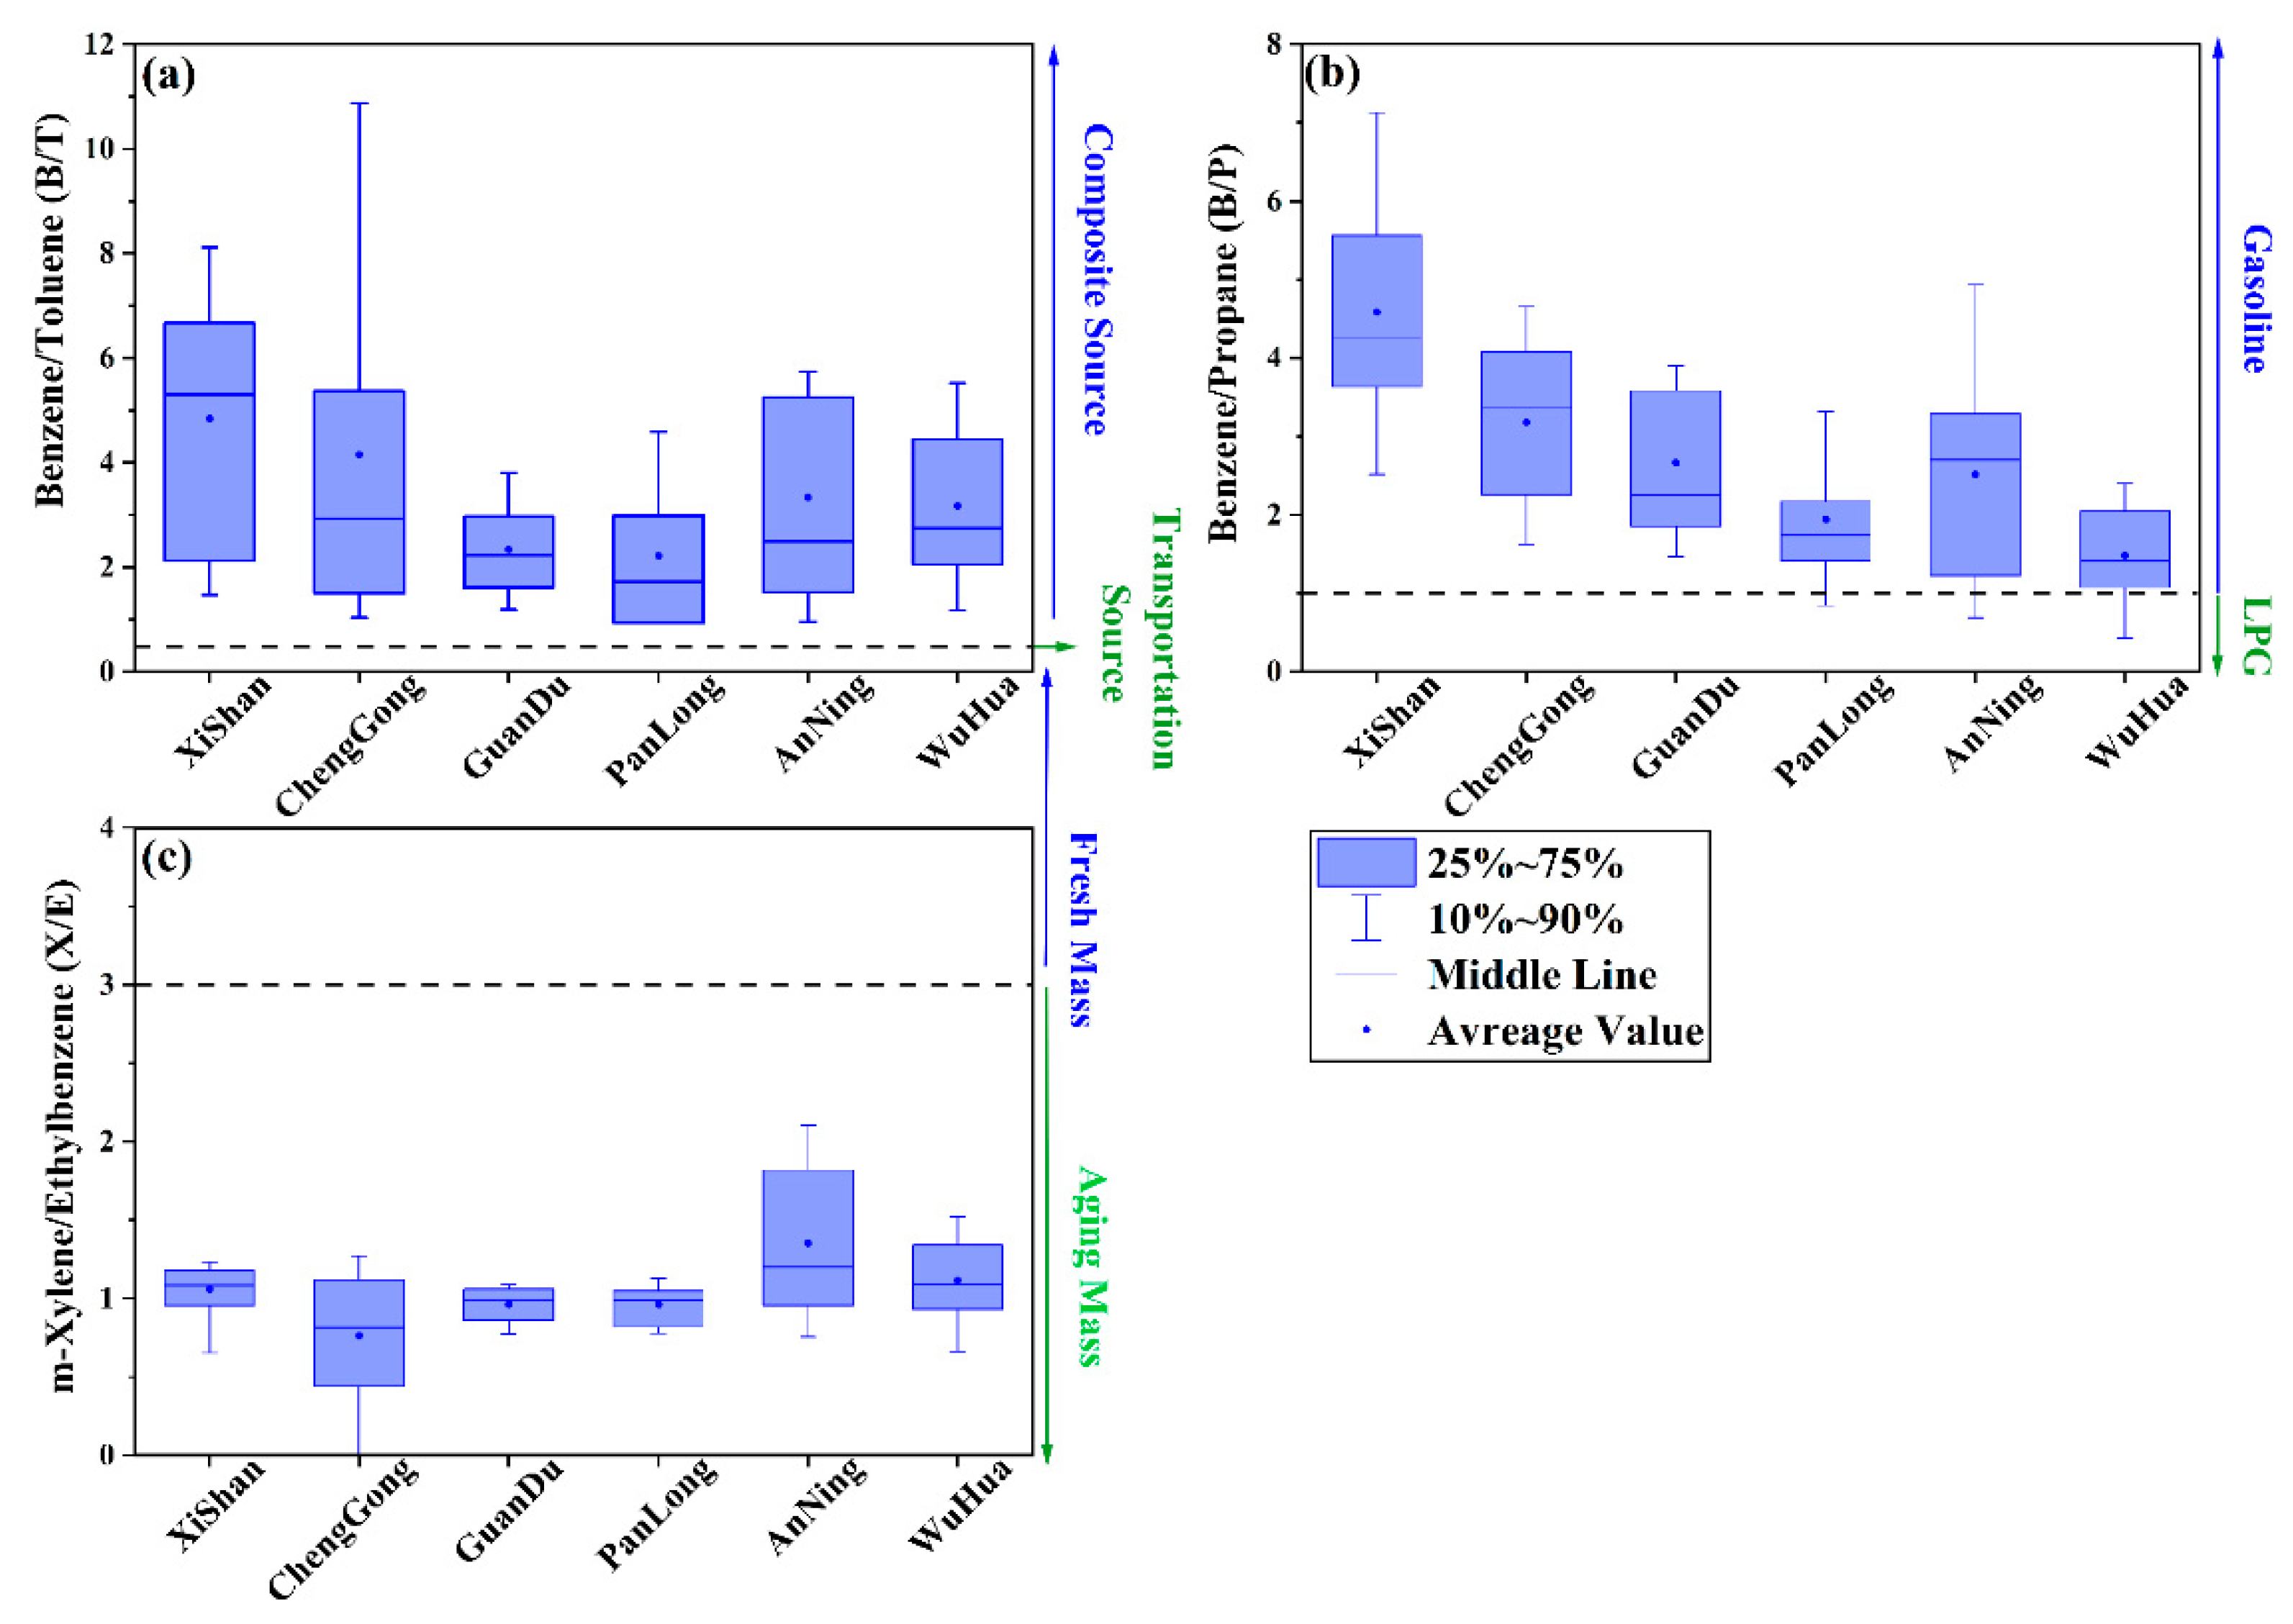
The results of the characteristic ratio analysis of ambient atmospheric tracer VOCs in Kunming are shown in Figure 5. It is evident that the average B/T values (ranging from 1.18 to 4.23) at all monitoring sites during the spring season exceeded the threshold of 0.5. This implies that the atmospheric composition of VOCs in Kunming is influenced by multiple pollutant sources, suggesting the presence of additional sources, such as industrial emissions, alongside the contributions from transportation sources. Among all the monitoring points, the average B/T value of the PanLong district was lower (1.40) and closest to the B/T critical value of the motor vehicle exhaust (0.5), indicating that transportation sources are likely to contribute more significantly to atmospheric VOCs in the PanLong district than in other areas. As far as the B/P ratio is concerned, the mean B/P values of all monitoring sites in spring were greater than one, indicating that gasoline use contributes significantly to atmospheric VOCs in Kunming compared to the use of LPG [43]. A notable finding is that the mean B/P value in the XiShan district (4.58) markedly exceeded that of other locations, strongly suggesting that the XiShan district is the area most impacted by the use of gasoline as a source of VOCs. The average X/E values (ranging from 0.76 to 1.35) were consistently below three at all monitoring sites, indicating that during the spring season in Kunming, the atmospheric composition of VOCs is significantly shaped by external transport, emphasizing the substantial influence of sources outside the local area.

Figure 5.
Spatial variation in the characteristic ratio of anthropogenic source tracer VOCs in the Kunming ambient atmosphere. (a) Benzene/Toluene (B/T), (b) Benzene/Propane, (c) m–Xylene/Ethylbenzene.
3.5. Source Analysis of Ambient Atmospheric VOCs
The source analysis of VOCs was performed on ambient atmospheric samples from six conventional sites in Kunming using PMF5.0 software. The VOC species participating in the modeling analysis were screened before simulation, and the species with a larger percentage of concentration were selected for simulation. After the Bootstrap Results test, when five source factors were selected, the simulation misclassification rate was small (<20%), and the correlation between the simulated and detected concentrations of the species was in the range of 0.5–0.9, so the model was determined to have five factors.
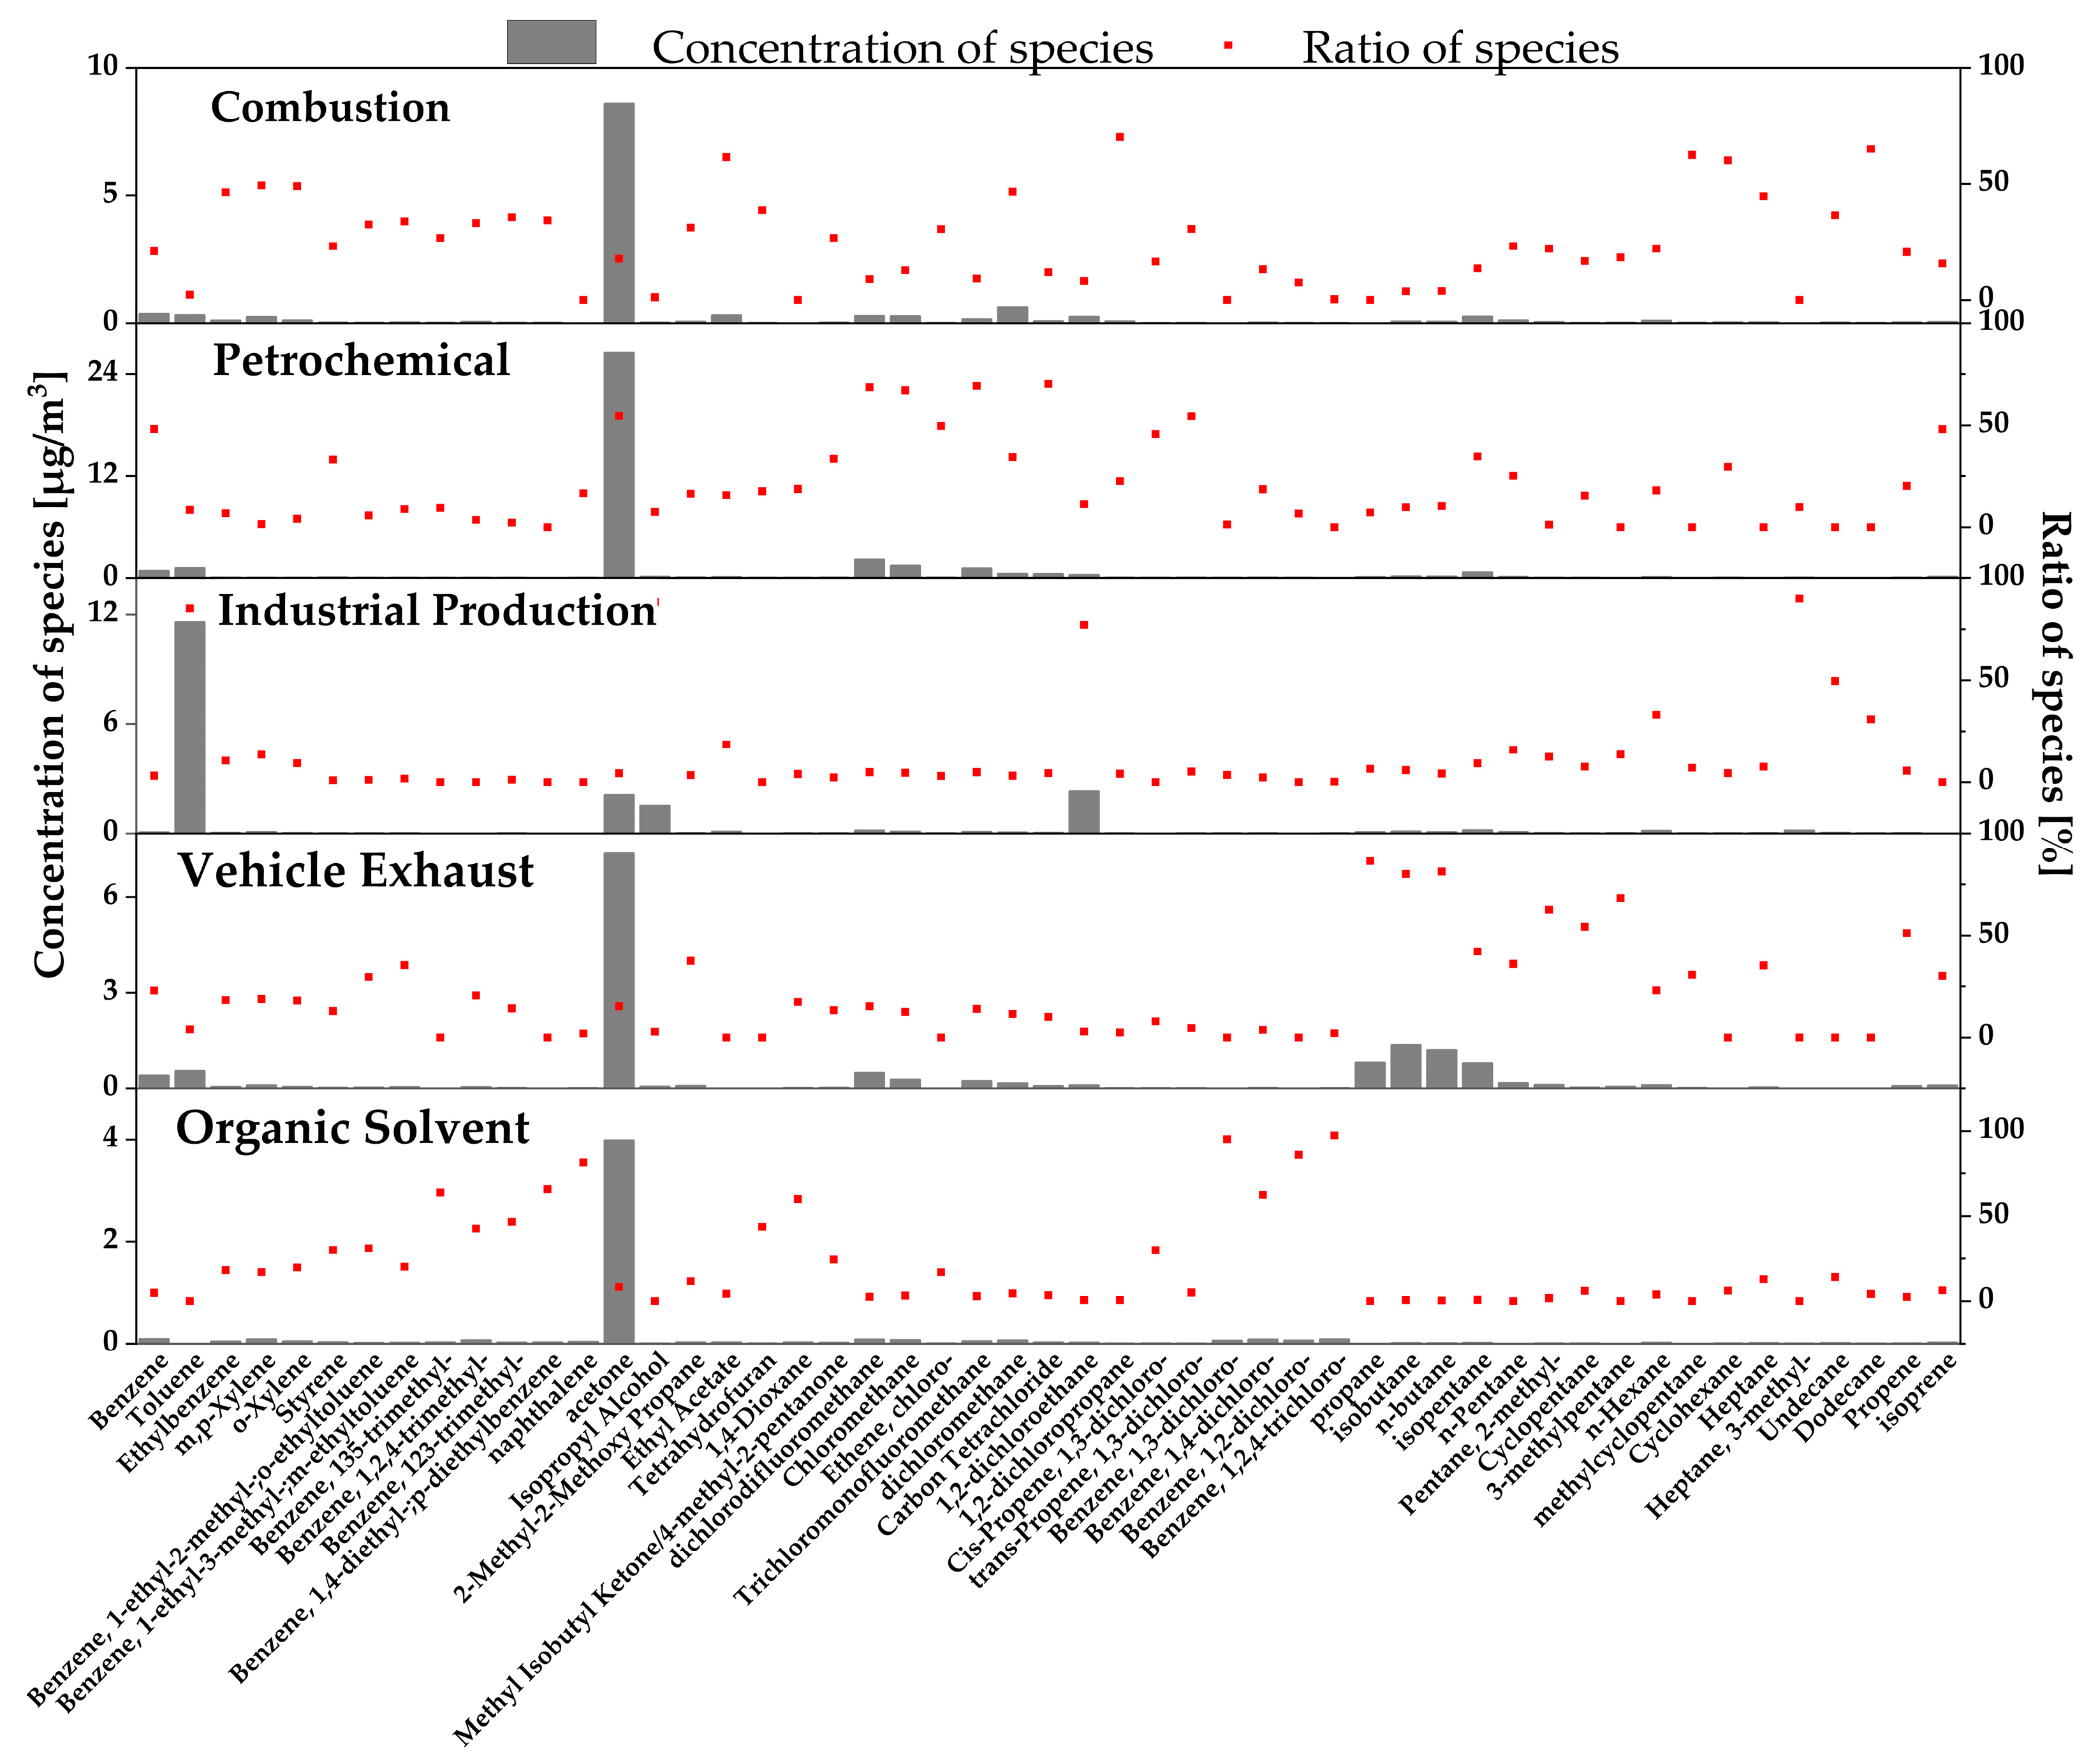
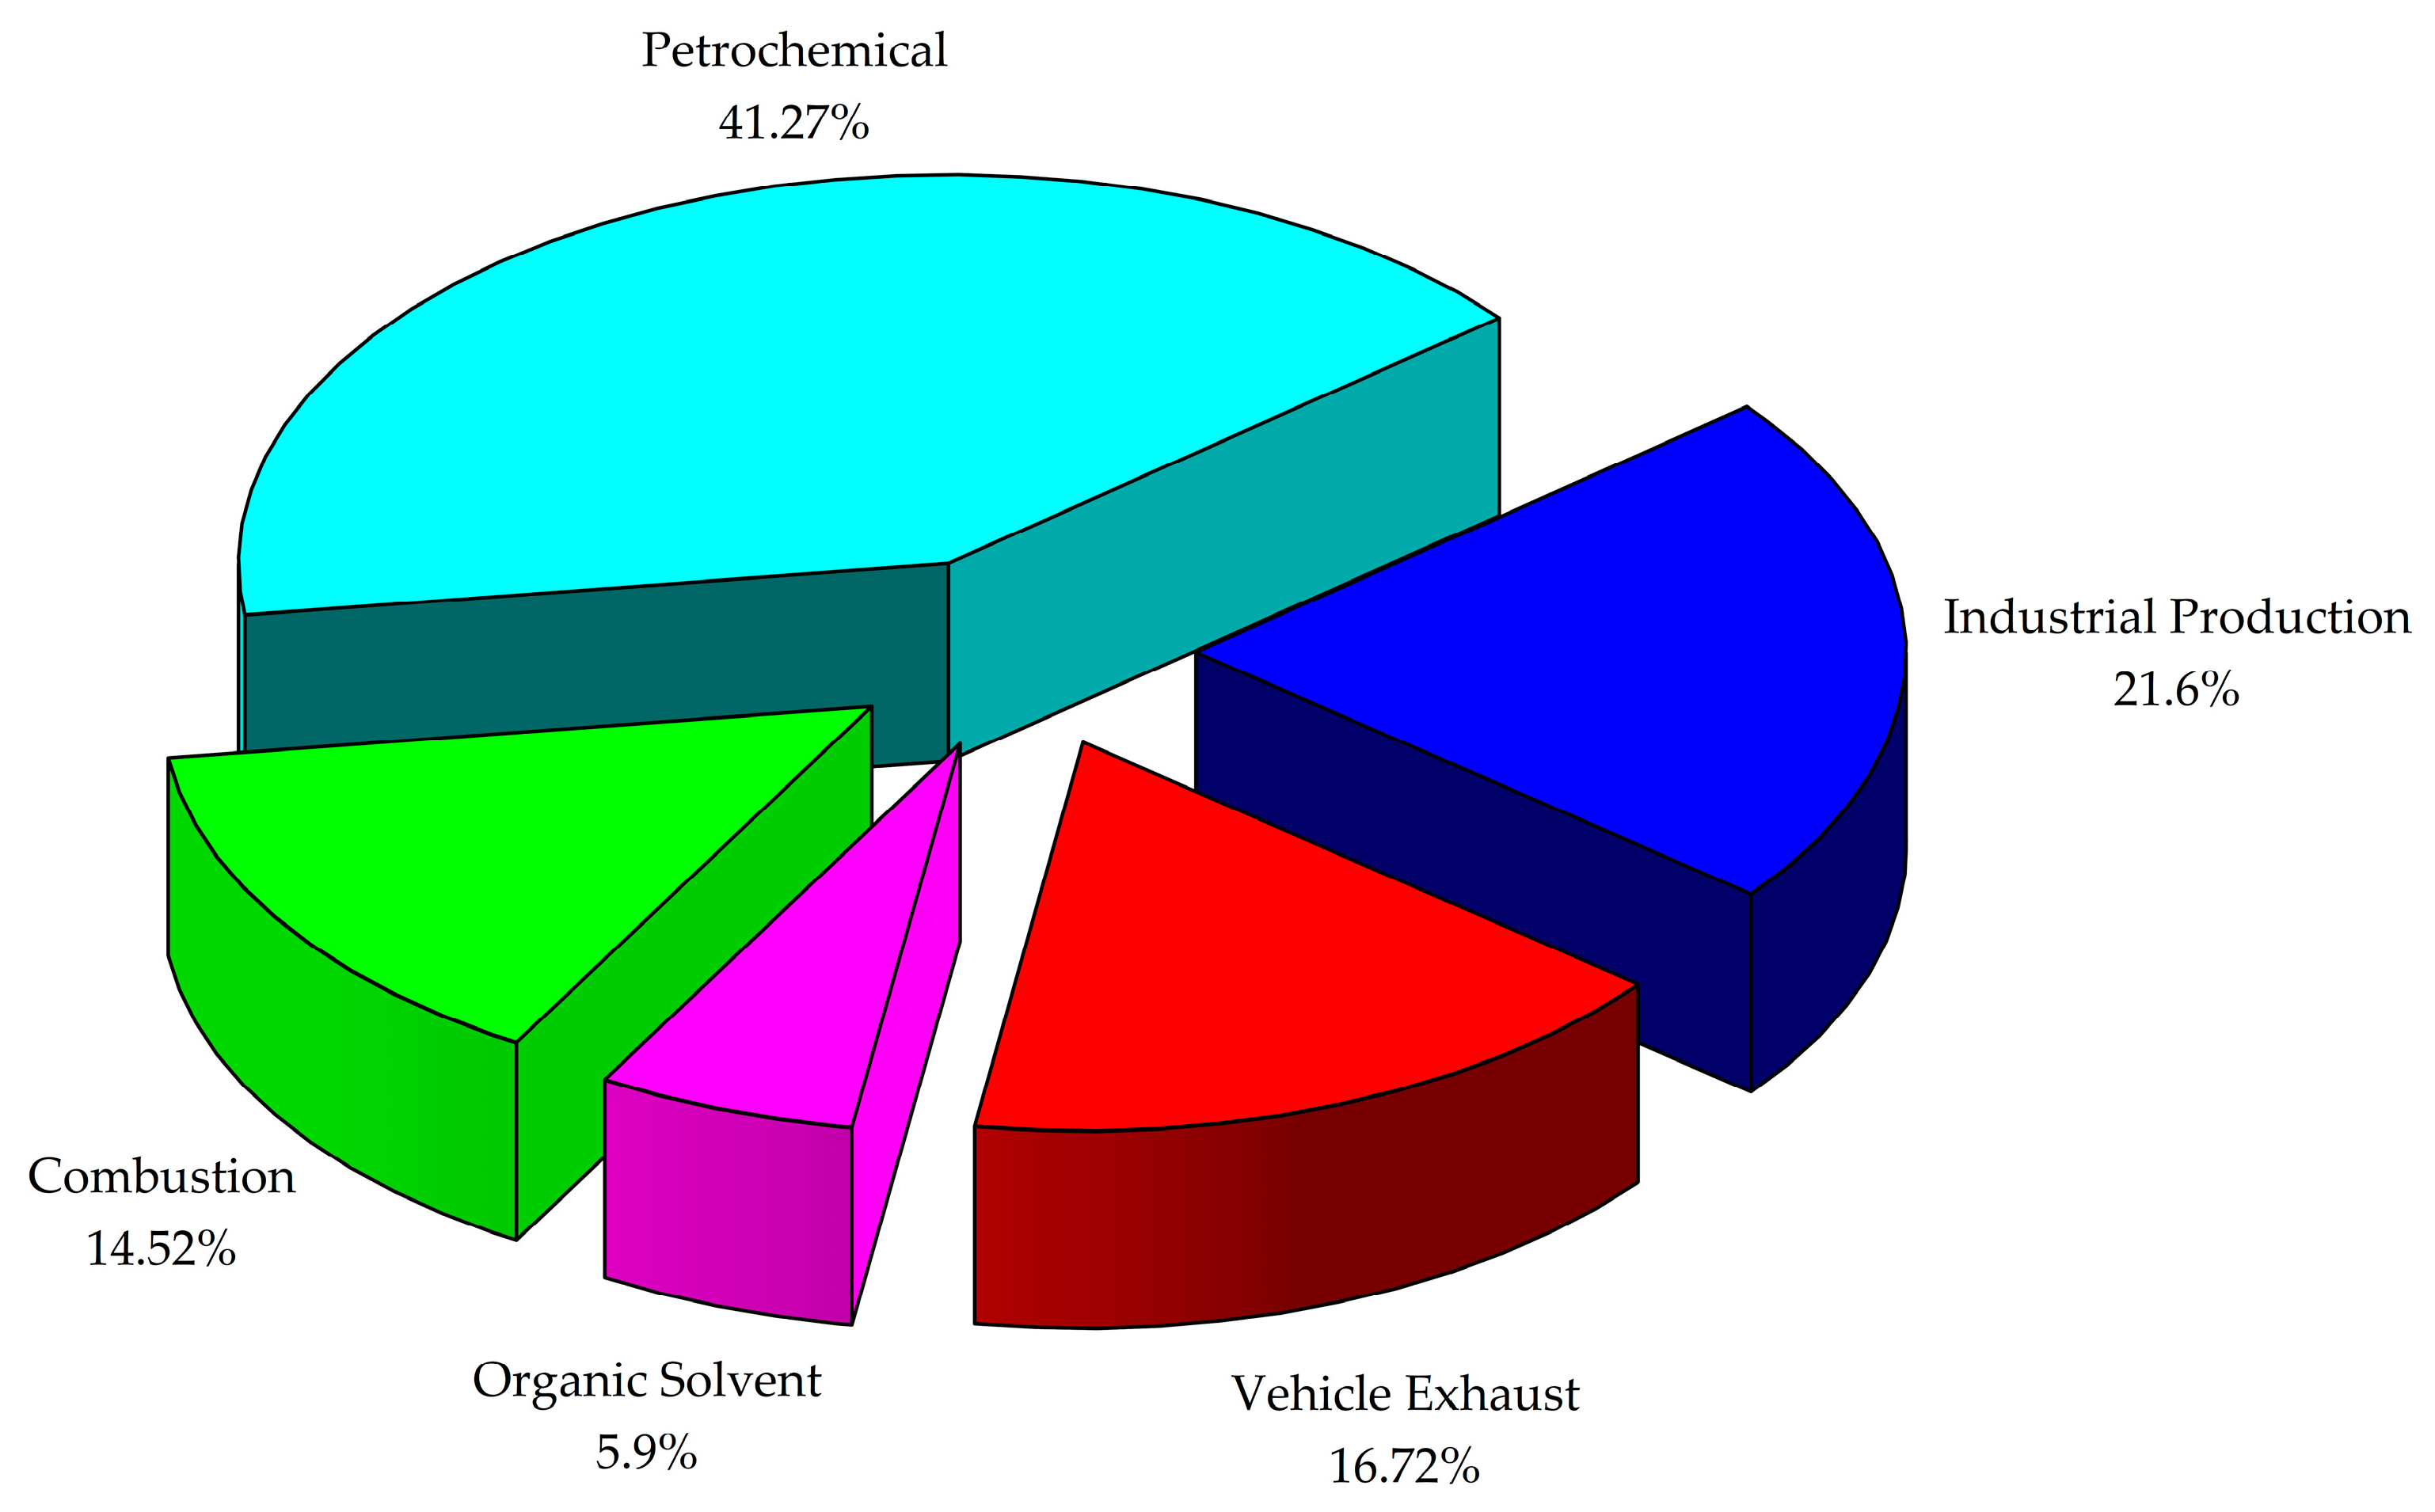
As far as the PMF source analysis results of spring VOC samples are concerned (Figure 6), the components with higher contributions in Factor 1 are benzene, ethylbenzene, xylene, ethyl acetate, methylene chloride, dichloropropane, cyclohexane, methylcyclopentane, styrene, heptane, hexane, undecane, and dodecane, which are mainly benzene, chlorinated hydrocarbons, and high-chained alkanes, and are similar to the characteristic components of combustion sources. The benzene to toluene ratio (1.17) in this factor is greater than one, which is significantly higher than the mobile source, and Factor 1 is defined as a combustion source with a contribution rate of 14.52% (Figure 7). The main components in Factor 2 were benzene, acetone, chloromethane, vinyl chloride, trichlorofluoromethane, 1,3-chloropropene, carbon tetrachloride, isoprene, etc., which are mainly oxygenated VOCs, aromatic hydrocarbons and halogenated hydrocarbons with a more complex composition, reflecting the diversity of emissions from the petrochemical industry. Isoprene may originate from anthropogenic emissions (fractionated crude gasoline, crude oil combustion, etc.) in addition to biogenic emissions, so such factors are categorized as petrochemical emissions with a contribution rate of 41.27%. The characteristic components of Factor 3 are toluene, isopropanol, ethylene dichloride, 3-methylheptane, undecane, and hexane. Isopropanol, toluene, and methylene chloride are typically derived from industrial sources. This type of factor was initially designated as an industrial source and contributed 21.6% to VOCs. The characteristic components of Factor 4 are propylene, propane, n-butane, isobutane, 2-methylpentane, 3-methylpentane, and cyclopentane, etc., accompanied by a certain amount of benzene and benzene series, which are similar to the source spectrum of domestic gasoline vehicle exhaust emissions. The ratio of benzene and toluene was 0.72, which was close to the relevant ratio for domestic roadside sampling (B/T = 0.5). Considering the clear characteristics of atmospheric aging in the spring of the monitoring site (Figure 5) and considering that toluene is more prone to reacting with hydroxyl radicals, leading to increases in the B/T ratio, the factor was defined as automobile tailpipe emissions, with a contribution of 16.72% from VOCs. The components with higher contributions in Factor 5 are 1,3,5-trimethylbenzene, 1,2,3-trimethylbenzene, naphthalene, diethylbenzene, 1,3-dichlorobenzene, 1,4-dichlorobenzene, 1,2-dichlorobenzene and 1,2,4-trichlorobenzene, which are aromatic hydrocarbons and common organic chemical synthesis reagents; therefore, this factor is defined as the use of organic solvents, which accounted for 5.9% of the VOCs.
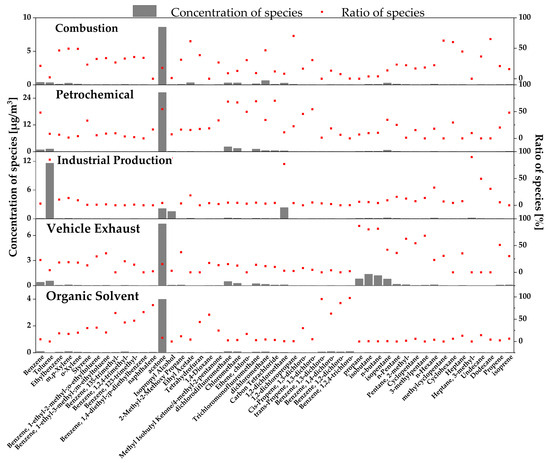
Figure 6.
Compositional profiles of PMF-resolving factors and component interpretations of spring VOC samples.
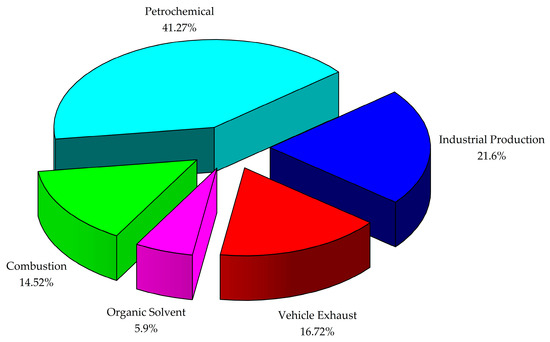
Figure 7.
The contribution of VOCs of different PMF factors to spring VOC samples.
3.6. Analysis of OFP for VOCs
Due to variations in their chemical properties, distinct VOCs exhibit varying capacities to participate in atmospheric ozone formation. This study delves into an analysis of the contribution ratio of ambient atmospheric VOCs to ozone generation during the spring of 2021, focusing on key VOC components and regional disparities in their contributions. The results show that the citywide average OFP of ambient atmospheric VOCs in Kunming was 179.13 μg/m3. In terms of percentages, as shown in Figure 8, aromatic hydrocarbons contributed up to 60.34% (108.09 μg/m3) of the OFP in Kunming city in spring, indicating that aromatic hydrocarbons were the most dominant contributing species to the local ambient atmospheric ozone, followed by OVOCs (18.62%, 33.35 μg/m3), olefins (10.07%, 18.04 μg/m3), and alkanes (9.81%, 17.57 μg/m3), whereas halogenated hydrocarbons and other VOCs had lower percentages (<3%, below 5 μg/m3).
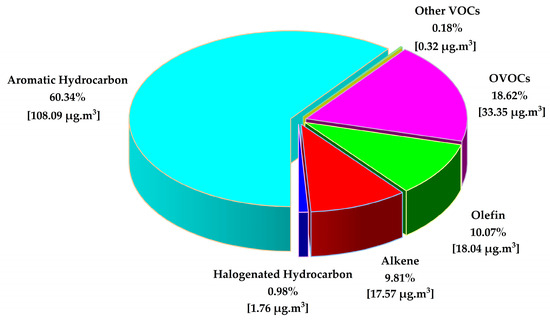
Figure 8.
The proportion of ozone formation potential for different types of VOCs in Kunming.
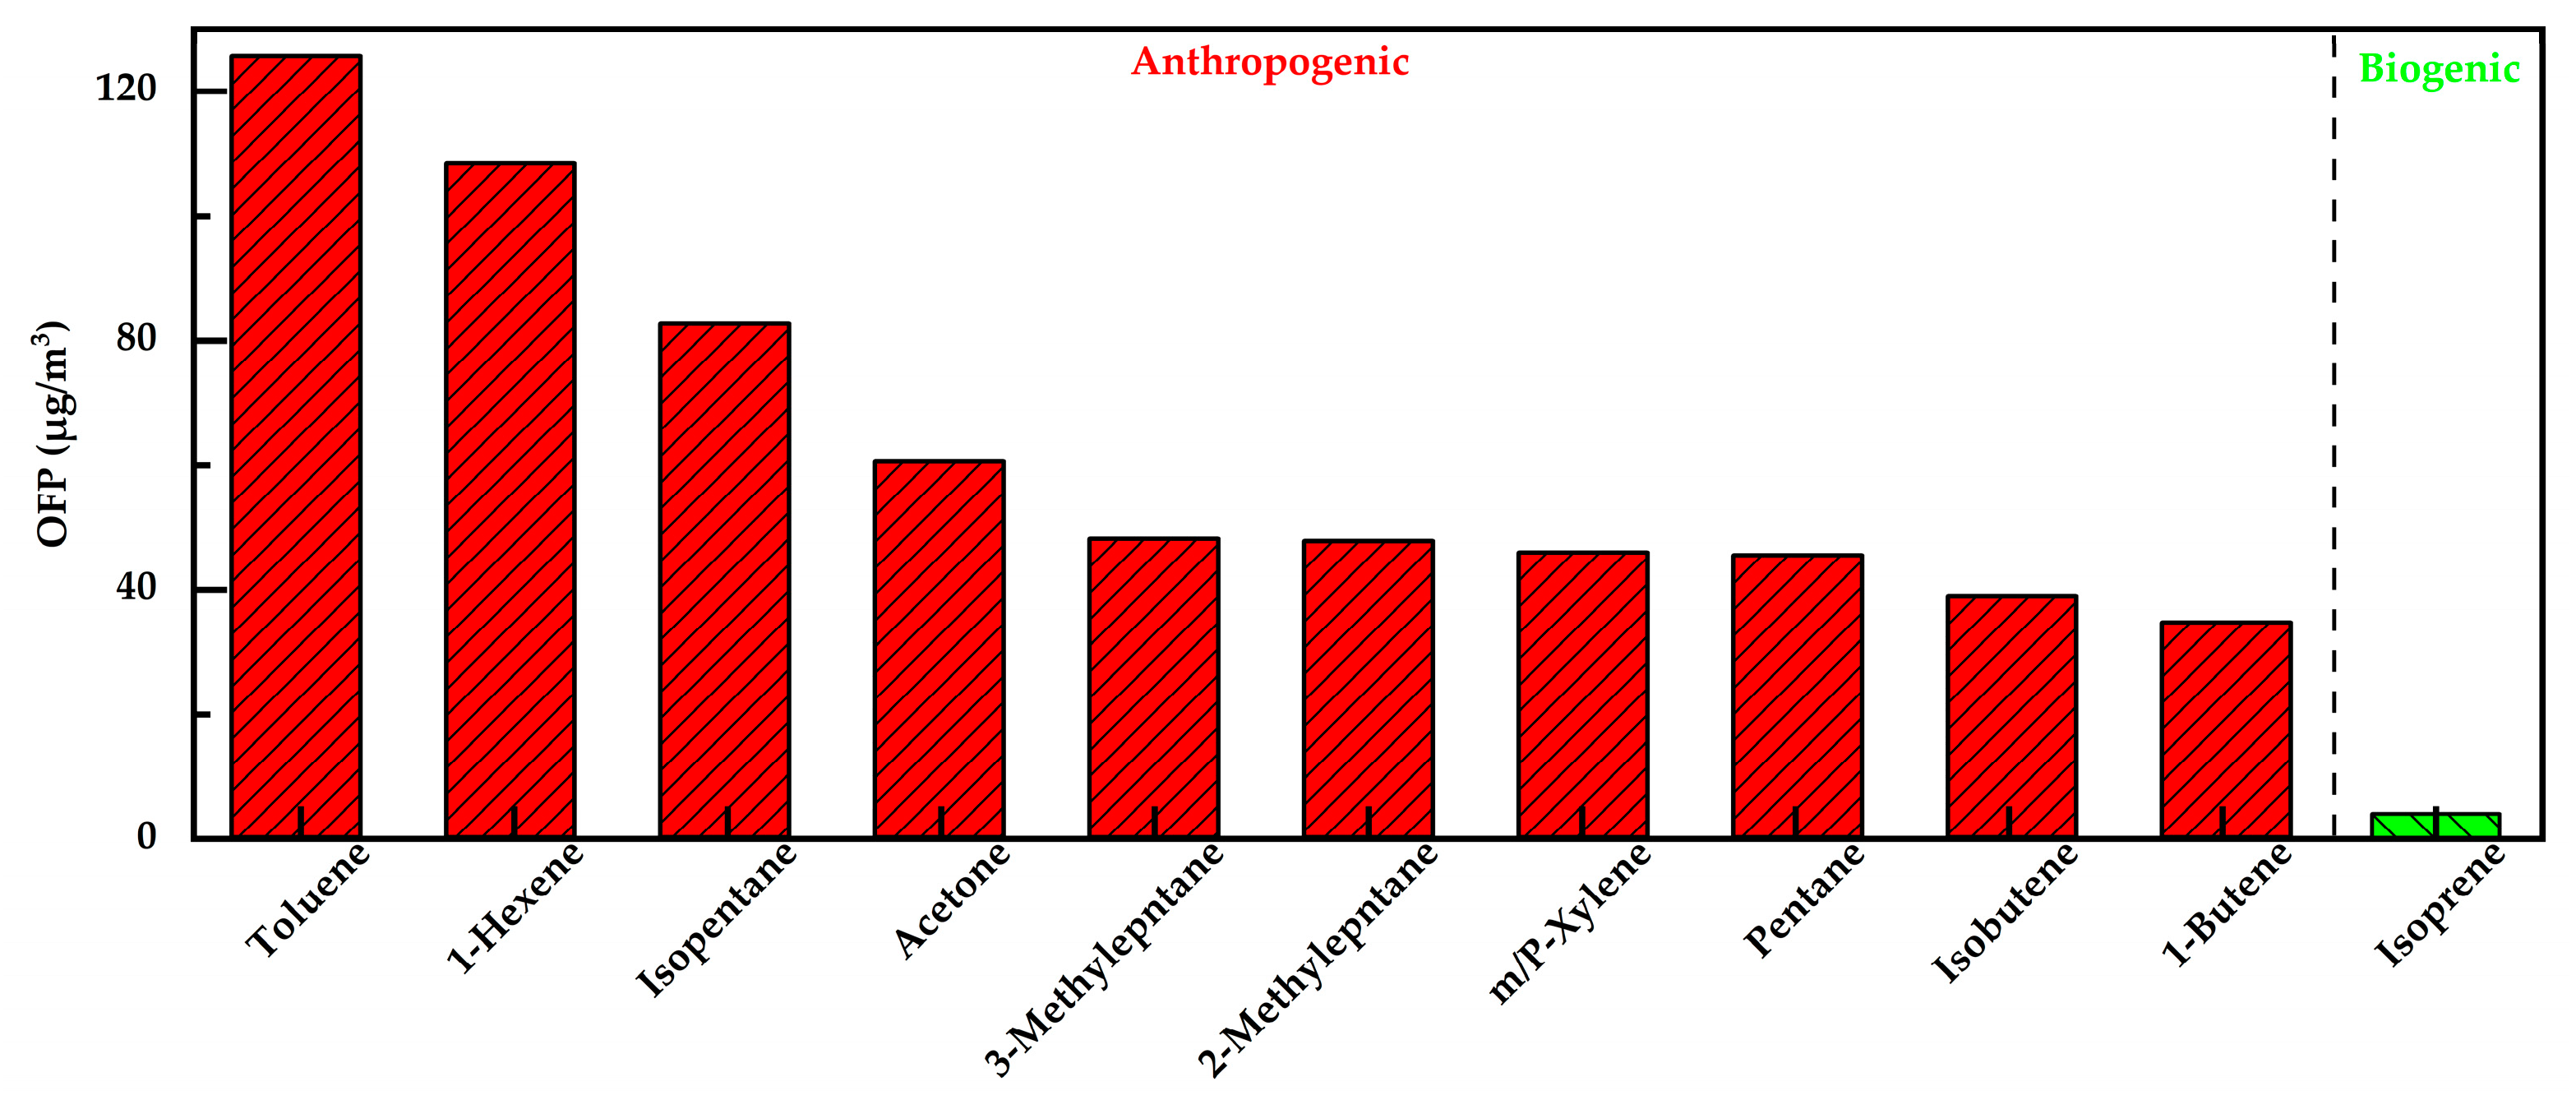
In terms of specific VOC components, the major contributors to OFP in different monitoring regions in Kunming were slightly different (Table 3). The 10 dominant VOC species affecting ambient atmospheric ozone generation in Kunming in spring were toluene, m, p-xylene, acetone, o-xylene, naphthalene, ethylbenzene, iso-pentane, iso-butane, n-hexane, and vinyl acetate, with a city-wide average OFP in the range of 3 to 60 μg/m3. The OFPs of toluene, m-, p-xylene, and acetone were significantly higher than those of the other components, and they were the main contributing species to ambient atmospheric ozone pollution in Kunming (Figure 9). The above VOC components mainly come from chemical, automobile exhaust, oil volatilization, spraying, printing, and other industries, and their prevention and control need to form the focus of future research.
Table 3.
The main contributing component of OFP for atmospheric VOCs in each region. Differences in color indicate the magnitude of OFP contribution of different species. Green to red color indicates an increase in the contribution.

Figure 9.
The main contributing component of the OFP of VOCs in the atmosphere of Kunming.
In terms of spatial variation, there were obvious regional differences in the OFP of ambient atmospheric VOCs in Kunming. As depicted in Figure 10, the OFP of atmospheric VOCs at the three monitoring sites in the GuanDu district, PanLong district, and WuHua district were all high (243.50–252.18 μg/m3). Conversely, the OFP of atmospheric VOCs at all three monitoring sites in the AnNing district, ChengGong district, and XiShan district were significantly lower (<130 μg/m3). This spatial pattern in OFP values aligns closely with the spatial trends observed in atmospheric VOC concentrations throughout Kunming.
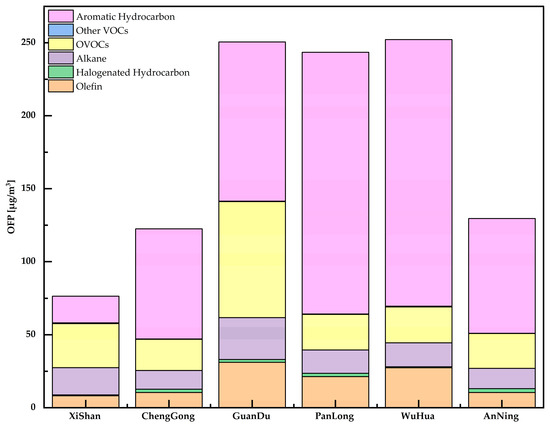
Figure 10.
OFP of atmospheric VOCs at each sampling site in Kunming.
In terms of the percentage of VOC components (Figure 10), OVOCs contributed the most to the atmospheric OFP in the XiShan district, and aromatic hydrocarbons contributed the most to the atmospheric OFP in the remaining five monitoring regions. In terms of the spatial variation in the OFP of each type of VOC, the OFP of olefins, OVOCs, alkanes, and halogenated hydrocarbons were higher in the GuanDu district in spring, and those of aromatic hydrocarbons were higher in the PanLong district and WuHua district. The higher OFP of the GuanDu district, PanLong district, and WuHua district are more susceptible to atmospheric ozone pollution events in this season. Consequently, there is a pressing need to prioritize efforts aimed at reducing, preventing, and controlling the emissions of aromatic hydrocarbons in these areas.
4. Conclusions
During the spring in Kunming, we recorded an average VOC concentration of 130.4 μg/m3. Notably, during this season, OVOCs dominated the composition of ambient atmospheric VOCs, forming the largest proportion. The city-wide average ozone formation potential (OFP) for ambient atmospheric VOCs in Kunming was measured at 159.80 μg/m3. Aromatic hydrocarbons significantly contributed to this, accounting for up to 60.34% of the overall OFP. Furthermore, it is evident that spatial and temporal disparities characterize the concentration levels of atmospheric VOCs and their OFP in Kunming. Specifically, during the spring, both the average atmospheric VOC concentration and OFP were considerably higher in the GuanDu district and PanLong district, indicating their heightened susceptibility to ozone pollution compared to other areas.
The contribution of ambient atmospheric VOCs in Kunming is predominantly attributed to external transport influence, evidenced by the elevated aging levels of air masses at all monitoring sites. Industrial emissions emerged as the primary source of ambient atmospheric VOCs in Kunming, constituting over two-thirds of the VOCs during the spring season. The contributions to the atmospheric composition of VOCs in Kunming from transportation and biomass combustion sources were notably smaller.
Regarding spatial disparities in the contributions of distinct emission sources, industrial emissions played a relatively significant role in shaping the atmospheric profile of VOCs in the ChengGong district and GuanDu district. Conversely, transportation sources exhibited a relatively higher influence on atmospheric VOCs in the ChengGong district and WuHua district.
Author Contributions
Data curation, S.X., Y.G., K.L. and J.L.; funding acquisition, Y.C. and J.L.; methodology, Y.G.; project administration, Y.C. and K.L.; software, Y.G.; supervision, Y.C., K.L. and J.L.; writing—original draft, S.X.; writing—review and editing, S.X., Y.C., K.L. and J.L. All authors have read and agreed to the published version of the manuscript.
Funding
This work is supported by the National Natural Science Foundation of China (No. 21976190) and Kunming Municipal Ecology and Environment Bureau (ZD20200007).
Institutional Review Board Statement
Not applicable.
Informed Consent Statement
Not applicable.
Data Availability Statement
The data presented in this study are available on request from the corresponding author. The data are not publicly available due to privacy.
Conflicts of Interest
The authors declare no conflict of interest.
References
- Jo, W.; Chun, H.; Lee, S.-O. Evaluation of Atmospheric Volatile Organic Compound Characteristics in Specific Areas in Korea Using Long-Term Monitoring Data. Environ. Eng. Res. 2012, 17, 103–110. [Google Scholar] [CrossRef]
- Valach, A.C.; Langford, B.; Nemitz, E.; MacKenzie, A.R.; Hewitt, C.N. Concentrations of selected volatile organic compounds at kerbside and background sites in central London. Atmos. Environ. 2014, 95, 456–467. [Google Scholar] [CrossRef]
- Boyjoo, Y.; Sun, H.; Liu, J.; Pareek, V.K.; Wang, S. A review on photocatalysis for air treatment: From catalyst development to reactor design. Chem. Eng. J. 2017, 310, 537–559. [Google Scholar] [CrossRef]
- Franco, M.; Chairez, I.; Poznyak, T.; Poznyak, A. BTEX decomposition by ozone in gaseous phase. J. Environ. Manag. 2012, 95, S55–S60. [Google Scholar] [CrossRef]
- Piccot, S.D.; Watson, J.J.; Jones, J.W. A global inventory of volatile organic compound emissions from anthropogenic sources. J. Geophys. Res. Atmos. 1992, 97, 9897–9912. [Google Scholar] [CrossRef]
- Song, M.; Liu, X.; Zhang, Y.; Shao, M.; Lu, K.; Tan, Q.; Feng, M.; Qu, Y. Sources and abatement mechanisms of VOCs in southern China. Atmos. Environ. 2019, 201, 28–40. [Google Scholar] [CrossRef]
- Klimont, Z.; Streets, D.G.; Gupta, S.; Cofala, J.; Lixin, F.; Ichikawa, Y. Anthropogenic emissions of non-methane volatile organic compounds in China. Atmos. Environ. 2002, 36, 1309–1322. [Google Scholar] [CrossRef]
- Gong, F. Anthropogenic Volatile Organic Compounds Emission Inventory and Characteristics. Master’s Thesis, Xi’an University of Architecture and Technology, Xi’an, China, May 2013. (In Chinese). [Google Scholar]
- Liu, J.F.; Zhao, J.; Li, T.T.; Bai, Y.H.; Liu, Z.R. Establishment of Chinese Anthropogenic Source Volatile Organic Compounds Emission Inventory. China Environ. Sci. 2008, 28, 496–500. (In Chinese) [Google Scholar]
- Wu, X.L. Study on Air Pollution Emission Inventory for Yangtze River Delta. Master’s Thesis, Fudan University, Shanghai, China, May 2009. (In Chinese). [Google Scholar]
- Yu, Y.F.; Lu, Q.; Zheng, J.Y.; Zhong, L.J. VOC emission inventory and its uncertainty from the key VOC-related industries in the Pearl River Delta Region. China Environ. Sci. 2011, 31, 195–201. (In Chinese) [Google Scholar]
- Zheng, J.; Shao, M.; Che, W.; Zhang, L.; Zhong, L.; Zhang, Y.; Streets, D. Speciated VOC Emission Inventory and Spatial Patterns of Ozone Formation Potential in the Pearl River Delta, China. Environ. Sci. Technol. 2009, 43, 8580–8586. [Google Scholar] [CrossRef]
- Fu, X.; Wang, S.; Zhao, B.; Xing, J.; Cheng, Z.; Liu, H.; Hao, J. Emission inventory of primary pollutants and chemical speciation in 2010 for the Yangtze River Delta region, China. Atmos. Environ. 2013, 70, 39–50. [Google Scholar] [CrossRef]
- Li, Q.; Han, Y.; Huang, D.; Zhou, J.; Che, H.; Zhang, L.; Lu, K.; Yang, F.; Chen, Y. Springtime reactive volatile organic compounds (VOCs) and impacts on ozone in urban areas of Yunnan-Guizhou plateau, China: A PTR-TOF-MS study. Atmos. Environ. 2023, 307, 119800. [Google Scholar] [CrossRef]
- Sillman, S. The relation between ozone, NOx and hydrocarbons in urban and polluted rural environments. Atmos. Environ. 1999, 33, 1821–1845. [Google Scholar] [CrossRef]
- Feng, Z.Z.; Xu, Y.S.; Kobayashi, K.; Dai, L.L.; Zhang, T.Y.; Agathokleous, E.; Calatayud, V.; Paoletti, E.; Mukherjee, A.; Agrawal, M.; et al. Ozone pollution threatens the production of major staple crops in East Asia. Nature Food 2022, 3, 47–56. [Google Scholar] [CrossRef] [PubMed]
- Lyu, X.; Li, K.; Guo, H.; Morawska, L.; Zhou, B.; Zeren, Y.; Jiang, F.; Chen, C.; Goldstein, A.H.; Xu, X.; et al. A synergistic ozone-climate control to address emerging ozone pollution challenges. One Earth 2023, 6, 964–977. [Google Scholar] [CrossRef]
- Pugliese, S.C.; Murphy, J.G.; Geddes, J.A.; Wang, J.M. The impacts of precursor reduction and meteorology on ground-level ozone in the Greater Toronto Area. Atmos. Chem. Phys. 2014, 14, 8197–8207. [Google Scholar] [CrossRef]
- Villanueva, F.; Tapia, A.; Notario, A.; Albaladejo, J.; Martínez, E. Ambient levels and temporal trends of VOCs, including carbonyl compounds, and ozone at Cabañeros National Park border, Spain. Atmos. Environ. 2014, 85, 256–265. [Google Scholar] [CrossRef]
- Li, Y.; Yin, S.; Yu, S.; Bai, L.; Wang, X.; Lu, X.; Ma, S. Characteristics of ozone pollution and the sensitivity to precursors during early summer in central plain, China. J. Environ. Sci. 2021, 99, 354–368. [Google Scholar] [CrossRef]
- Martin, R.V.; Fiore, A.M.; Van Donkelaar, A. Space-based diagnosis of surface ozone sensitivity to anthropogenic emissions. Geophys. Res. Lett. 2004, 31. [Google Scholar] [CrossRef]
- Tan, Z.; Lu, K.; Dong, H.; Hu, M.; Li, X.; Liu, Y.; Lu, S.; Shao, M.; Su, R.; Wang, H.; et al. Explicit diagnosis of the local ozone production rate and the ozone-NOx-VOC sensitivities. Sci. Bull. 2018, 63, 1067–1076. [Google Scholar] [CrossRef]
- Wang, Y.; Zhao, Y.; Liu, Y.; Jiang, Y.; Zheng, B.; Xing, J.; Liu, Y.; Wang, S.; Nielsen, C.P. Sustained emission reductions have restrained the ozone pollution over China. Nat. Geosci. 2023, 16, 964–974. [Google Scholar] [CrossRef]
- Li, P.; Chen, C.; Liu, D.; Lian, J.; Li, W.; Fan, C.; Yan, L.; Gao, Y.; Wang, M.; Liu, H.; et al. Characteristics and source apportionment of ambient volatile organic compounds and ozone generation sensitivity in urban Jiaozuo, China. J. Environ. Sci. 2023, 138, 607–625. [Google Scholar] [CrossRef]
- Xue, L.; Ding, A.; Cooper, O.; Huang, X.; Wang, W.; Zhou, D.; Wu, Z.; McClure-Begley, A.; Petropavlovskikh, I.; Andreae, M.O.; et al. ENSO and Southeast Asian biomass burning modulate subtropical trans-Pacific ozone transport. Natl. Sci. Rev. 2020, 8, nwaa132. [Google Scholar] [CrossRef] [PubMed]
- Ministry of Ecology and Environment of the People’s Republic of China. Technical Specification for the Layout of Ambient Air Quality Monitoring Sites (on trial), HJ 664-2013. Available online: https://www.mee.gov.cn/ywgz/fgbz/bz/bzwb/jcffbz/201309/t20130925_260810.shtml (accessed on 29 November 2023).
- Ministry of Ecology and Environment of the People’s Republic of China. 2018 Ambient Air Volatile Organic Compounds (VOCs) Monitoring Program for Key Areas, EIAO Monitoring Letter (2017) No. 2024; Ministry of Ecology and Environment of the People’s Republic of China: Beijing, China, 2017.
- Ministry of Ecology and Environment of the People’s Republic of China. Technical Requirements for Manual Monitoring of Ozone Precursor Organic Com-pounds in Ambient Air (Trial), Environmental Office Monitoring Letter [2018] No. 240. Available online: https://www.mee.gov.cn/gkml/hbb/bgth/201802/t20180228_431887.htm (accessed on 29 November 2023).
- Paatero, P.; Tapper, U. Positive matrix factorization: A non-negative factor model with optimal utilization of error estimates of data values. Environmetrics 1994, 5, 111–126. [Google Scholar] [CrossRef]
- Paatero, P.; Eberly, S.; Brown, S.G.; Norris, G.A. Methods for estimating uncertainty in factor analytic solutions. Atmos. Meas. Tech. 2014, 7, 781–797. [Google Scholar] [CrossRef]
- Bufalini, J.J.; Dodge, M.C. Ozone-forming potential of light saturated hydrocarbons. Environ. Sci. Technol. 1983, 17, 308–311. [Google Scholar] [CrossRef]
- Carter, W.P.L. Development of the SAPRC-07 chemical mechanism. Atmos. Environ. 2010, 44, 5324–5335. [Google Scholar] [CrossRef]
- Ministry of Ecology and Environment of the People’s Republic of China. Ambient Air Quality Standard (GB 3095-2012). Available online: https://www.mee.gov.cn/ywgz/fgbz/bz/bzwb/dqhjbh/dqhjzlbz/201203/t20120302_224165.htm (accessed on 29 November 2023).
- Simayi, M.; Shi, Y.; Xi, Z.; Li, J.; Yu, X.; Liu, H.; Tan, Q.; Song, D.; Zeng, L.; Lu, S.; et al. Understanding the sources and spatiotemporal characteristics of VOCs in the Chengdu Plain, China, through measurement and emission inventory. Sci. Total Environ. 2020, 714, 136692. [Google Scholar] [CrossRef]
- Shao, M.; Lu, S.; Liu, Y.; Xie, X.; Chang, C.; Huang, S.; Chen, Z. Volatile organic compounds measured in summer in Beijing and their role in ground-level ozone formation. J. Geophys. Res. Atmos. 2009, 114. [Google Scholar] [CrossRef]
- Zhu, H.; Wang, H.; Jing, S.; Wang, Y.; Cheng, T.; Tao, S.; Lou, S.; Qiao, L.; Li, L.; Chen, J. Characteristics and sources of atmospheric volatile organic compounds (VOCs) along the mid-lower Yangtze River in China. Atmos. Environ. 2018, 190, 232–240. [Google Scholar] [CrossRef]
- Zhang, K.; Li, L.; Huang, L.; Wang, Y.; Huo, J.; Duan, Y.; Wang, Y.; Fu, Q. The impact of volatile organic compounds on ozone formation in the suburban area of Shanghai. Atmos. Environ. 2020, 232, 117511. [Google Scholar] [CrossRef]
- Liu, Z.; Hu, K.; Zhang, K.; Zhu, S.; Wang, M.; Li, L. VOCs sources and roles in O3 formation in the central Yangtze River Delta region of China. Atmos. Environ. 2023, 302, 119755. [Google Scholar] [CrossRef]
- Wu, Y.; Mo, Z.Y.; Wu, Q.Q.; Lu, J.H.; Mao, J.Y.; Chen, X.M.; Su, S.L.; Qin, W.; Liu, H.L.; Wei, M. Characterization of Ambient Volatile Organic Compounds, Source Apportionment, and the Ozone-NOx-VOC Sensitivities in Liucheng County, Guangxi. Environ. Sci. 2023, 44, 75–84. (In Chinese) [Google Scholar]
- Jobson, B.T.; McKeen, S.A.; Parrish, D.D.; Fehsenfeld, F.C.; Blake, D.R.; Goldstein, A.H.; Schauffler, S.M.; Elkins, J.W. Trace gas mixing ratio variability versus lifetime in the troposphere and stratosphere: Observations. J. Geophys. Res. Atmos. 1999, 104, 16091–16113. [Google Scholar] [CrossRef]
- Russo, R.S.; Zhou, Y.; White, M.L.; Mao, H.; Talbot, R.; Sive, B.C. Multi-year (2004–2008) record of nonmethane hydrocarbons and halocarbons in New England: Seasonal variations and regional sources. Atmos. Chem. Phys. 2010, 10, 4909–4929. [Google Scholar] [CrossRef]
- Yurdakul, S.; Civan, M.; Tuncel, G. Volatile organic compounds in suburban Ankara atmosphere, Turkey: Sources and variability. Atmos. Res. 2013, 120–121, 298–311. [Google Scholar] [CrossRef]
- Ma, Z.; Liu, C.; Zhang, C.; Liu, P.; Ye, C.; Xue, C.; Zhao, D.; Sun, J.; Du, Y.; Chai, F.; et al. The levels, sources and reactivity of volatile organic compounds in a typical urban area of Northeast China. J. Environ. Sci. 2019, 79, 121–134. [Google Scholar] [CrossRef]


Disclaimer/Publisher’s Note: The statements, opinions and data contained in all publications are solely those of the individual author(s) and contributor(s) and not of MDPI and/or the editor(s). MDPI and/or the editor(s) disclaim responsibility for any injury to people or property resulting from any ideas, methods, instructions or products referred to in the content. |
© 2023 by the authors. Licensee MDPI, Basel, Switzerland. This article is an open access article distributed under the terms and conditions of the Creative Commons Attribution (CC BY) license (https://creativecommons.org/licenses/by/4.0/).