Article

Bioaerosol Exposure during Sorting of Municipal Solid, Commercial and Industrial Waste: Concentration Levels, Size Distribution, and Biodiversity of Airborne Fungal

1
Process Engineering Division, National Research and Safety Institute (INRS), 1 Rue du Morvan CS 60027, CEDEX, 54519 Vandœuvre-lès-Nancy, France
2
Polluants Metrology Division, National Research and Safety Institute (INRS), 1 Rue du Morvan CS 60027, 54519 Vandœuvre-lès-Nancy, France
3
Caisse Régionale d’Assurance Maladie d’Ile-de-France (CRAMIF), 75954 Paris, France
*
Author to whom correspondence should be addressed.
Atmosphere 2024, 15(4), 461; https://doi.org/10.3390/atmos15040461
Submission received: 23 February 2024 / Revised: 27 March 2024 / Accepted: 2 April 2024 / Published: 8 April 2024
(This article belongs to the Special Issue Bioaerosol Composition and Measurement)

Abstract

:
A study was carried out in a waste sorting plant (WSP) located in France, treating dry recyclable household waste (DRHW) as well as dry recyclable commercial and industrial waste (DRCIW). Stationary and personal inhalable samples were collected in the WSP in order to investigate bioaerosols (sampling on a filter; 2 L/min and 10 L/min) and airborne dust (CIP; 10 L/min). The aim of the study was to assess the extent to which the measurement of concentration, species composition, and particle size distribution contributes to a better assessment of the biological risks associated with exposure. The results confirmed that waste and waste sorting activities are sources of airborne fungi. Indeed, ambient concentrations ranged from 7.3 × 10³ to 8.5 × 10⁵ colony-forming units (CFU)/m3 for culturable fungi and up to 4 mg/m3 for dust. Personal exposure to inhalable dust was found up to 3 mg/m3 for dust and ranged from 8.6 × 10³ to 1.5 × 10⁶ CFU/m3 for fungi. Airborne fungal communities were found to be dominated by the Penicillium genera in both bioaerosols and settled dust samples, followed by the Aspergillus, Cladosporium, Wallemia, Mucor, and Rhizopus genera. Fungi were carried by particles of aerodynamic diameters, mainly between around 2.0 and 10.0 µm. The findings dealing with size distribution and biodiversity of bioaerosols suggest that employees are exposed to complex bioaerosols during their work and help to make a finer diagnosis of the risks involved, which is often difficult in the absence of any occupational exposure limit (OEL) value for bioaerosols in general.

1. Introduction

In the European Union, the Waste Framework Directive 2008/98/EC (Article 3) defines waste as “any substance or object which the holder discards or intends or is required to discard” and stipulates that the priorities of waste management must be prevention and recycling as alternatives to landfill disposal [1]. The EU directive also set targets for the types and tonnages of collected, sorted and recycled waste and a timetable for achieving these targets. They are transposed into the legislation of the various EU Member States that organise waste treatment and disposal on their own territory.
In France, municipal waste is waste collected by or for local authorities and includes (i) waste from households, including bulky waste; (ii) waste produced by small businesses (or administrations) and collected at the same time as household waste (so-called “assimilated waste”); and (iii) waste from municipalities (maintenance of green spaces, road cleaning, and market waste). Local authorities also collect 55 kg/inhabitant/year of rubble, bringing the total to 580 kg/inhabitant/year. Of the waste managed by local authorities, approximately 80% comes from households, and 20% is produced by companies or public bodies [2]. In 2016, about 399 waste sorting plants (WSP) treated 11.6 million tons of non-hazardous household or industrial waste over the year [2]. The population of workers employed in WSPs was estimated at about 7000 persons in 2013, 5500 of whom work on the sorting chain [3], involved in different tasks such as sorting waste manually, cleaning and maintaining facilities, and driving, handling, or loading machines.
Sorting activities and processes are known for their potency to emit dust as well as biological and chemical agents into the air of WSPs. Indeed, workers’ exposure to bioaerosols, including dust, bacteria, and fungi, as well as microbial compounds and metabolites, has been documented in WSPs from numerous countries. The occupational exposure reported in WSPs is associated with respiratory, gastrointestinal, or dermatologic symptoms among workers handling household waste ([4,5]). However, epidemiological studies have not been able to clearly link the measured exposures to the observed symptoms, and occupational exposure limit values (OELs) are still not available for airborne biological agents. Thus, the interpretation of measurement results in terms of risk is still delicate.
Previously published studies have brought significant knowledge regarding the exposure of workers in WSPs. Thus, ambient concentrations and individual exposures to airborne dust, microorganisms (bacteria, fungi), microbial compounds (endotoxins, (1,3)-β-D-glucans), and metabolites (mycotoxins) found in WSPs have been documented to improve diagnosis [6,7,8,9,10]. Knowledge about the taxa composition of microbial communities in bioaerosols from WSPs has been improved through studies using methods based on the identification of cultivated isolates [11,12,13] and based on high throughput sequencing (HTS) [14,15]. In addition, studies have allowed investigation of the size distribution of airborne microorganisms (SDAM) found in the air of WSPs and their deposition in the lungs of workers [16,17,18]. Several studies have also encouraged the completion of the measurement strategy of health effect indicators [19,20,21]. Indeed, gathering information on exposure levels, SDAM, and taxa composition of microbial communities in bioaerosols from WSPs during a measurement campaign appears to be a helpful approach to improve the interpretation of measurements in terms of risk. However, the deployment of such strategies remains relatively undocumented in the literature.
The aim of this study was to assess the extent to which the measurement of concentration, species composition, and particle size distribution can contribute to a better assessment of the biological risks associated with exposure to fungi.

2. Materials and Methods

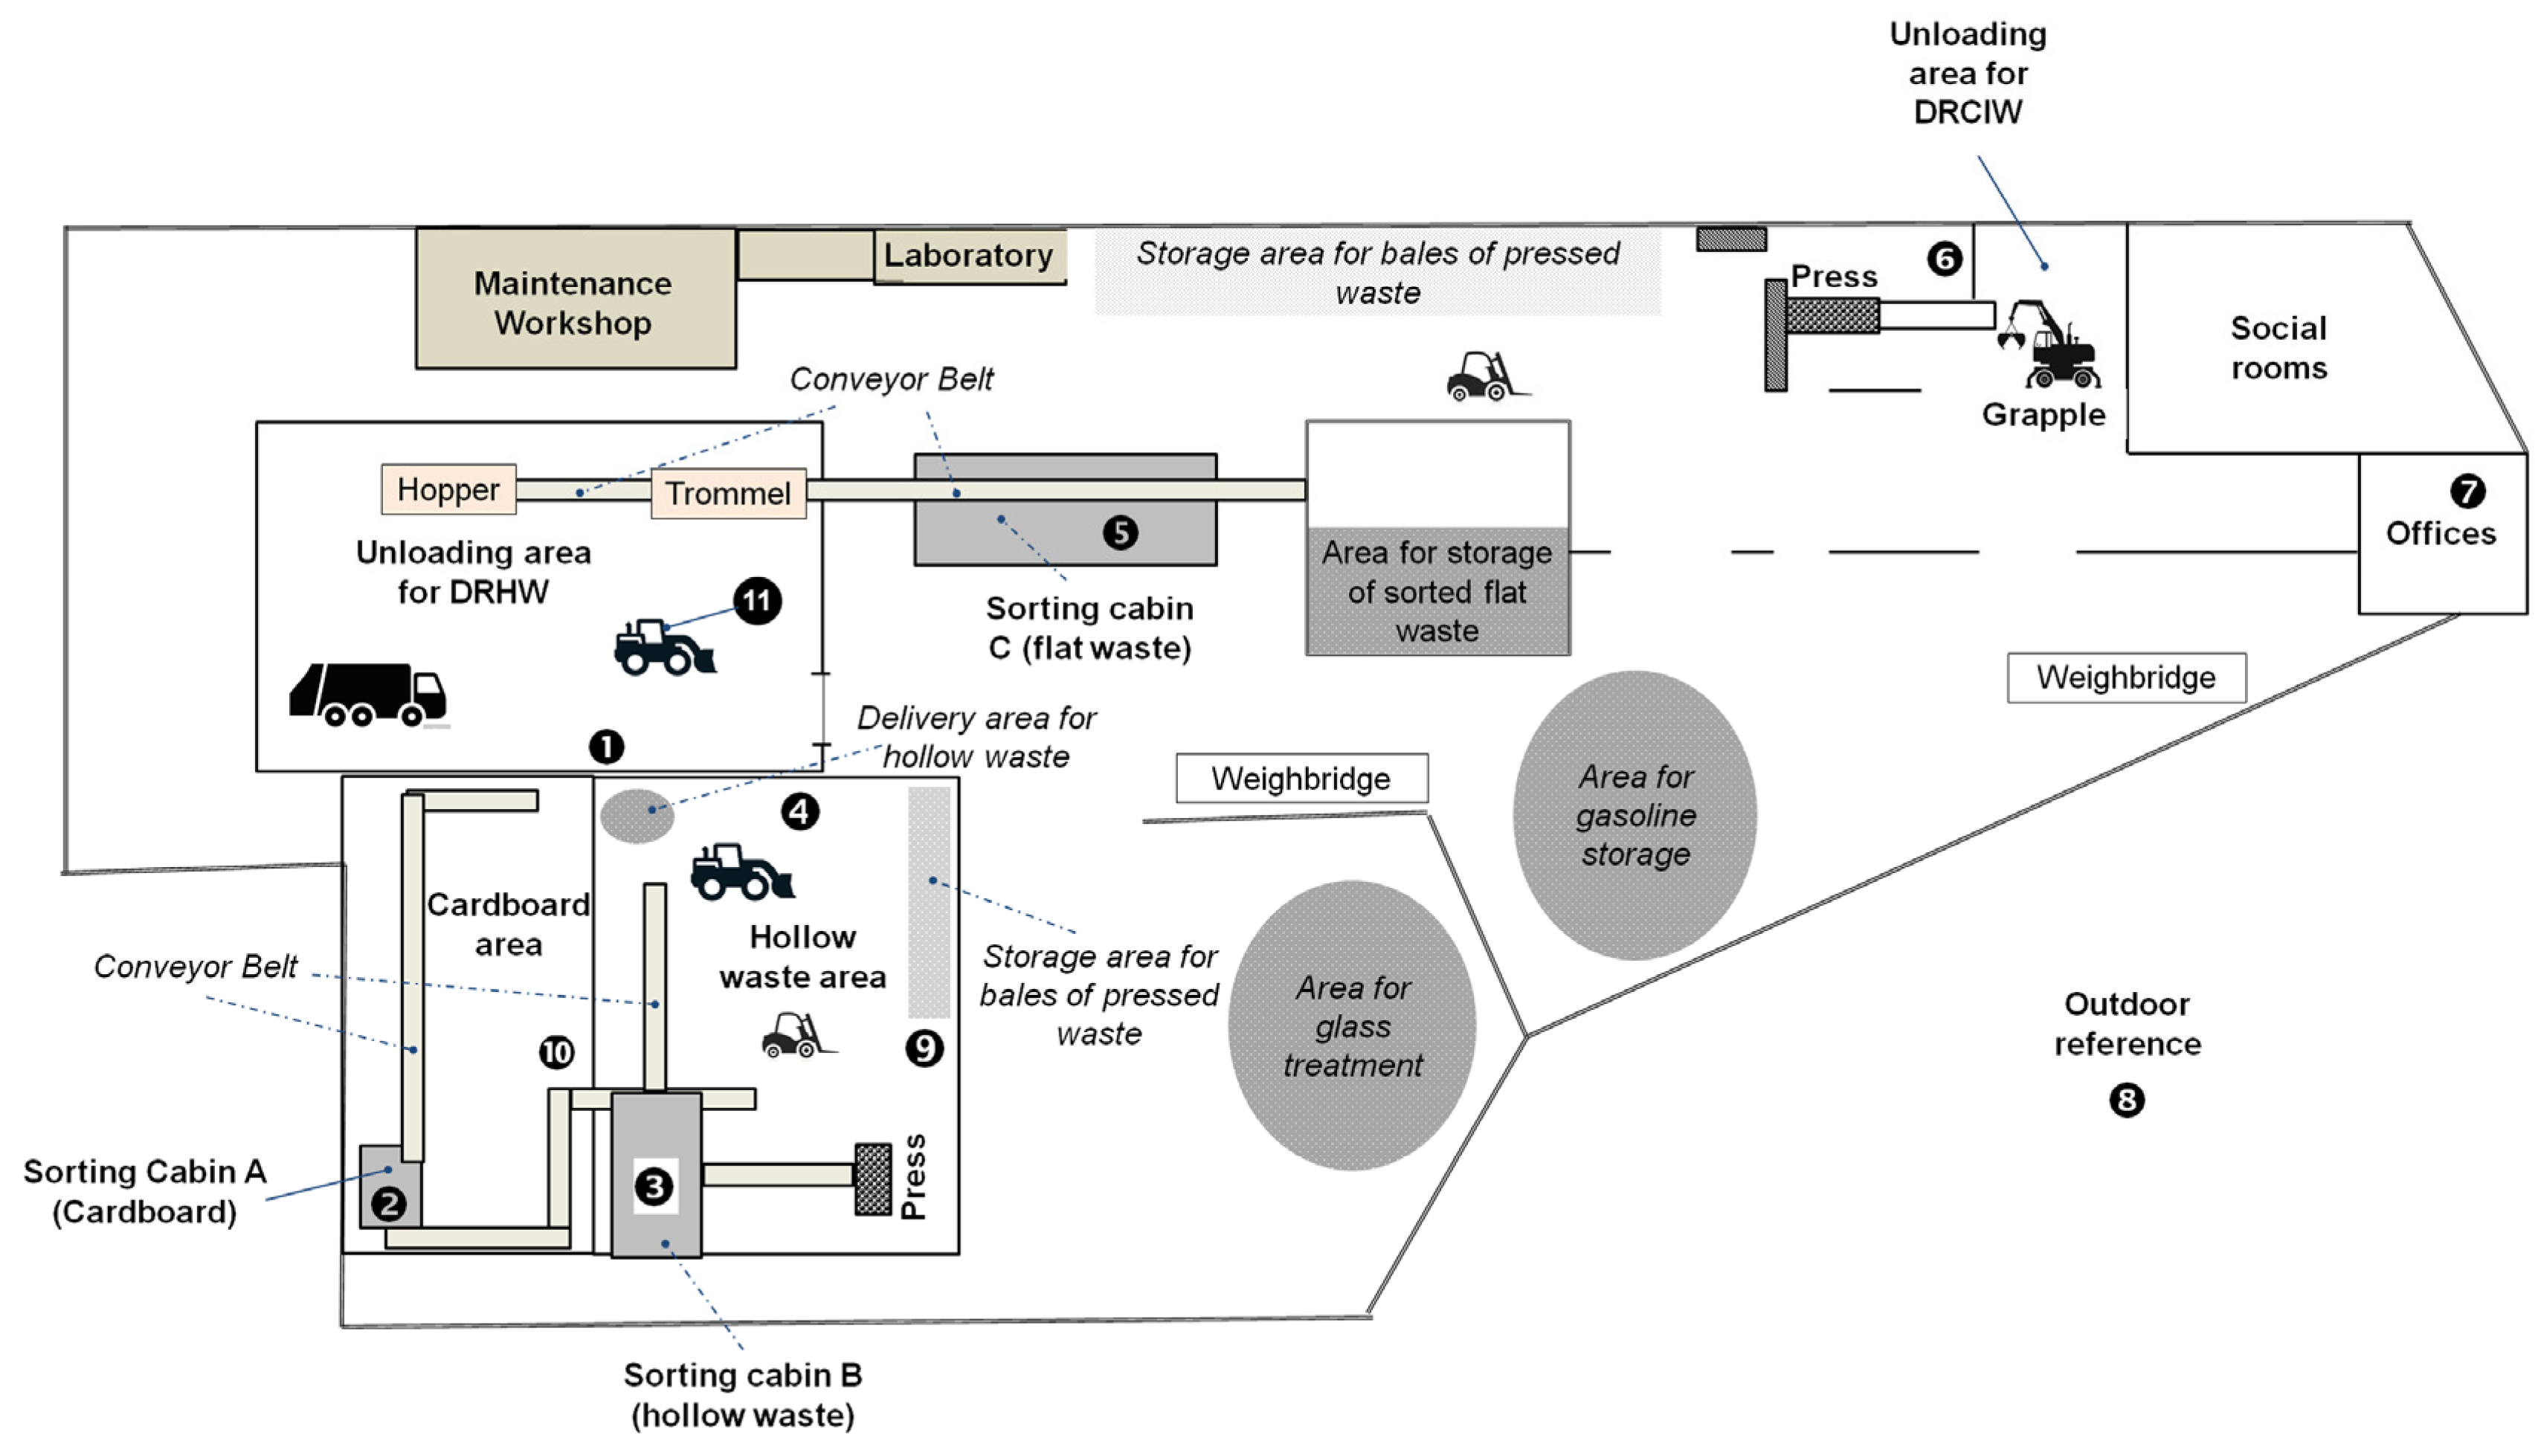
2.1. General Information about the Investigated Waste Sorting Plant (WSP)

The investigated waste sorting plant (WSP) was an industrial plant located in France that treated dry recyclable household waste (DRHW) as well as dry recyclable commercial and industrial waste (DRCIW), both collected in the surrounding municipalities. It employed about 50 workers, who were mainly dedicated to the manual sorting of waste. Sorted DRHW included paper (newspapers, magazines, journals, leaflets, envelopes, catalogues, etc.), cartons and cardboard boxes for packaging, plastic bottles and flasks, food bricks, steel, and aluminum metal packaging (metals beverage cans and tins). It accounted for approximately 4000 tons per month when measurements were made and came from the selective collection of source-separated waste. The DRCIW consisted of papers, cardboard, plastics, and non-dangerous waste coming from industries, artisans, and shops; it accounted for approximately 1200 tons per month.
The WSP also treated glass packaging (jars, bottles, and pots) that was only collected as a voluntary contribution in the glass columns set up in each municipality. The corresponding activity was performed outdoors and was not in the scope of the present paper.

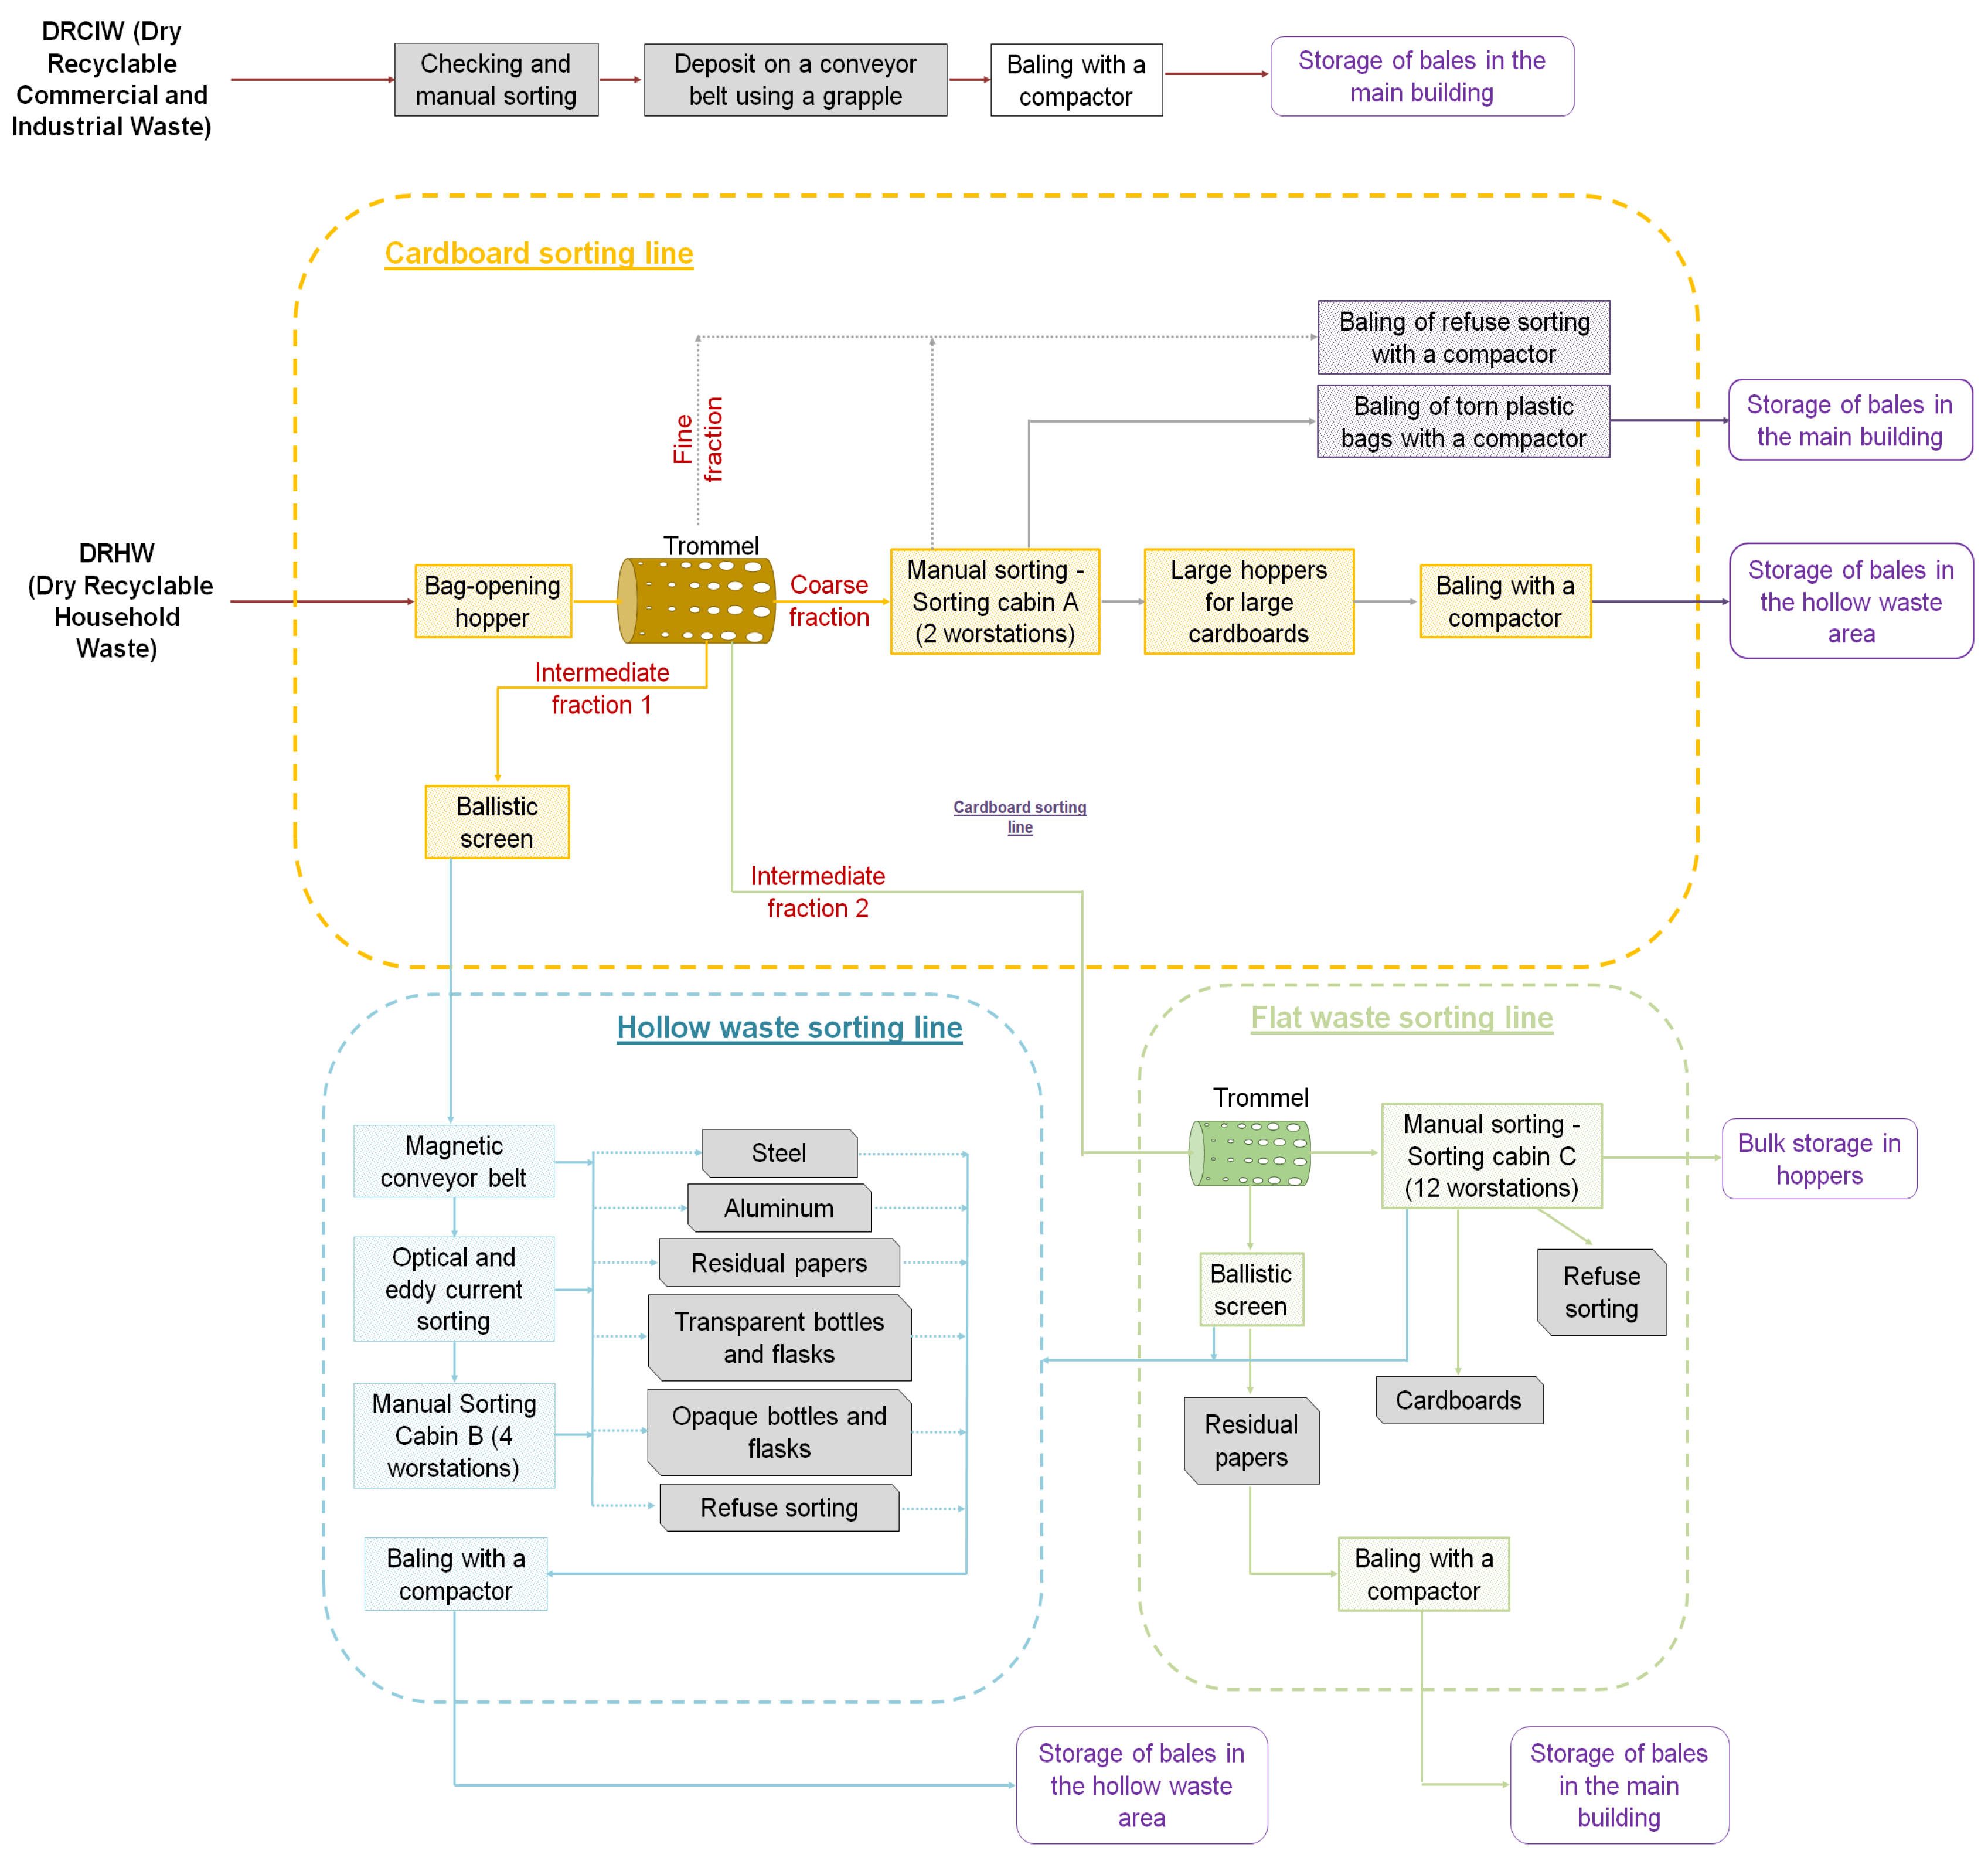
2.2. Description of the WSP and the Sorting Process

The investigated WSP was a totally indoor plant consisting of a large hangar-like building in which the different sorting operations were performed. The organization of the different work areas is shown in Figure 1 (a network of conveyor belts that do not appear on the plan connects the different production areas of the company). The workflow for waste sorting is schematized in Figure 2. DRHW and DRCIW were sorted in two different workflows.
DRCIW comes from separate collections or from containers containing only one type of waste and is unloaded from dump trucks in a dedicated area (Figure 1). It is then checked, possibly manually sorted, loaded onto a conveyor belt using a grapple, and then baled using a bale press (Figure 2). At the exit of the baler, a mechanical loader stores the bales in a dedicated storage area. The activity employs 2 sorting operators and 3 machine operators and drivers.
Mixed DRHW is brought to the WSP by dump trucks. It is received either in plastic bags (from door-to-door collection from residents) or in bulk (from collection at voluntary drop-off points) and is deposited in a dedicated large area called the “unloading area for DRHW” (Figure 1). A mechanical loader introduces the waste into a bag-opening hopper and the waste is then transported on a conveyor belt to a first trommel sieve (Figure 2). The workflow for DRHW sorting includes: (i) sorting cabin A (two workstations), where the operators manually remove the pieces of cardboard as well as the torn plastic bags, and then the two types of waste are sent separately to a press to be baled; (ii) sorting cabin B (4 workstations) for manual sorting of “flat waste”, and (iii) the large Sorting cabin C (12 workstations). The sorted flat waste is stored in bulk in a dedicated area adjacent to the DRCIW area.

2.3. Ventilation System in the WSP

In the WSP, only sorting cabins 1 and 2 were equipped with a ventilation system at the time of measurements, consisting of a plenum blowing new air over each workstation to ensure that the operator works in “clean” air. The ventilation in the hanger was rather natural (e.g., open door or roof windows), while the engine cabins were not equipped with ventilation.

2.4. Measurement Strategy

Stationary and personal bioaerosol and airborne dust samples were collected in 2014 for two consecutive days in July (D1 and D2) and for two other days in October (D3 and D4). The characterization of the aerosol was more complete in sorting cabin A (cardboards) by adding several measurements of particle size distributions and real-time concentrations.

2.4.1. Stationary Measurements

Stationary measurements were carried out in different working areas of the company (Figure 1) in order to assess the general contamination of the air, with both on-line and off-line methods. This was undertaken in order to assess (i) the ambient concentration levels of airborne culturable fungi and inhalable dust, (ii) the real-time total number concentration of airborne particles, (iii) the biodiversity of fungal communities in bioaerosols, and (iv) the size distribution of airborne fungi. For that purpose, the sampling and measuring devices were placed at the height of the respiratory tract, about 1.7 m from the floor. The stationary sampling plan was designed in order to make at least three measurements for each investigated area, spread over the 4 days of the campaign.
The description of the sampling points as well as the detail of the sampling plan is given in Table S1, and the locations of the sampling points ➊, ➋, ➌, ➍, ➎, ➏, ➒, and ➓ inside the WSP are given in Figure 1. Measurements were also carried out in the cabins of the motorized vehicles operating in the different working areas (sampling point 11); the vehicles were the grapple of the DRCIW waste area; and the vehicles circulating (loaders, pallet trucks, etc.) in the hollow waste area and in the unloading area for the DRHW. Each day, stationary samples were also collected in two reference areas assumed to be not under the influence of waste sorting activities that were located outside the company (sampling point ➑) and in an administrative office (sampling point ➐).

2.4.2. Personal Measurements

Personal measurements were carried out by placing the sampling heads of the devices directly on the workers, as close as possible to the breathing zone for the assessment of exposure to culturable bacteria and fungi, dust, and endotoxins. The personal sampling plan was designed in order to make several measurements for the main working tasks, spread over the 4 days of the campaign. This was undertaken in order to assess the exposure of workers to airborne endotoxins and culturable microorganisms as well as to inhalable dust during their work shifts. The tasks considered were sorting operations, drivers, operation of compactors, and maintenance. The detail of the sampling plan for personal exposure is given in Table S2.

2.5. Air Sampling Methods

An overview of the measurement process used during the campaign is provided in Figure S1.
Samples for the measurement of culturable fungi and Eucaryota biodiversity in bioaerosols were taken with 37-mm CFCs mounted with a sterile polycarbonate filter (Whatman®, Nuclepore® polycarbonate membrane, 0.8 µm pore size, Sigma Aldrich Chimie S.a.r.l Saint-Quentin-Fallavier, France) and a backing cellulose pad (Millipore®, thick cellulose absorbent pad), as previously described [14,22]. The duration of the culturable fungi sampling (minimum = 187 min; median = 364 min; maximum = 494 min) often corresponded to a large proportion of the work shift but was sometimes adapted to assess specific shorter activities. For samples dedicated to the study of biodiversity, the durations of sampling were: minimum = 205 min; median = 350 min; maximum = 500 min.
Inhalable dust was sampled using the sampling device CIP 10-I (Tecora, Fontenay sous Bois, France) operating at 10 L/min. The durations of sampling for inhalable dust have also been adapted to follow specific tasks or the entire duration of the workstation: minimum = 192 min; median = 358 min; maximum = 495 min. The CIP 10-I was equipped with an omnidirectional particle selector targeting the conventional inhalable fraction [23] and a plastic rotating cup containing a polyurethane foam filter (grade 60 pores per linear inch [24]) for aerosol collection. After sampling, the rotating cup was removed from the CIP 10-I and closed with its lid in order to be transported to the laboratory at room temperature.
The size distribution of the workplace aerosol-carrying airborne fungi was assessed using a Marple Cascade Impactor (MCI, model 298, Tisch Environmental, Inc., Village of Cleves, OH, USA) as previously described [22]. In order to maximize the recovery efficiency of microorganisms during the extraction step, no grease was applied to the Mylar collection media in the case of culturable analysis. The Marple impactor was connected to a sampling pump (Gilian®, GilAir-3 R, Sensidyne LP, St. Petersburg, FL, USA) to achieve an overall flow rate of 2 L/min, and the duration of the sampling was between 259 and 409 min. At the end of each sampling day, the collection supports of the MCI dedicated to the enumeration of culturable microorganisms were carefully removed from the device, in aseptic conditions, and transferred to empty Greiner tubes (50 mL).
For sampling with the MCI and the CFC, the flow rate of the device (sampling head connected to a pump) was calibrated and measured before and after sampling using a soap film bubble flowmeter (Gilian, Gilibrator, St. Petersburg, FL, USA—2 L/min) or a mass flow meter (Mass Flow Meter 4140, TSI Inc., Shoreview, MN, USA). For sampling with the CIP-I, the flow rate was controlled with an optical tachymeter before and after each sampling day, as described previously [25].

2.6. Real-Time Measurement of Airborne Particles Number Concentration and Size Distribution

The monitoring over time of the number concentration of airborne particles was carried out using the GRIMM® 1.109 optical particle counter (OPC GRIMM® 1.109, GRIMM Aerosol Technik GmbH, Muldestausee, Germany). The ambient aerosol is captured through a dedicated omnidirectional annular slot with a 1.2 L/min air flow rate, and each individual particle is exposed to an incident laser beam in an optical measuring cell; the detection and the measurement of particles number concentration and particle sizes are based on the principle of light scattering providing the optical diameter (dopt) of particles [26,27]. The results were expressed by the number of particles per cubic meter of air (#/m3).

2.7. Sampling of Settled Dust

Settled dust was also collected in the cardboard sorting area for biodiversity analysis using a sterile 50 mL tube.

2.8. Transport and Preservation of Samples

Samples dedicated to microbial analysis were transported to the laboratory after each sampling day using a cold box and stored at 4 °C until analysis. Samples dedicated to gravimetric analysis were transported to the laboratory after the two sampling days of July and October and stored at room temperature.

2.9. Measurement of Temperature and Relative Humidity

Temperature and relative humidity of the air were monitored using a portable device (Thermohygrometer B6285C Pocket, Fischer, Strasbourg, France) at each sampling point.

2.10. Sample Analysis

Microbiological samples (culturable fungi and Eucaryota biodiversity) were analyzed within 24 h after being collected. All equipment and dilution water used in our experiments were sterile and DNA-free when required. The analyses were performed in aseptic conditions in a biological safety cabinet. Gravimetric samples were analyzed a few days later after staying in the weighing room. An overview of the sampling process used for assessing the concentration levels and size distribution of airborne particles is provided in Figure S1.

2.10.1. Cullturable Microorganisms

Culturable mesophilic fungi were enumerated in the CFCs and the MCI samples as described previously [22], by cultivation on the Malt Extract Agar medium and incubation at 25 °C for 5 days, after elution of sampled particles in a sterile extraction solution. The number of grown colonies on the surface of the culture media was counted every day for five days to determine the microbial concentration in the extract and then in the sample. Results were expressed in colony forming units (CFU) per cubic meters of air (CFU/m3).

2.10.2. Analysis of Fungal Biodiversity in Samples

The genomic DNA from bioaerosol and dust samples was extracted using the FastDNA® SPIN kit for soil kit (MP Biomedicals, Illkirch, France) according to the manufacturer’s instructions. After DNA concentration measurement by spectrophotometry (Nanodrop 2000c, Thermo Fischer Scientific, Illkirch, France), the samples were stored at −20 °C until their sequencing.
The DNA sequencing was performed by INRA Transfert Environnement (Narbonne, France), as described previously [14]. Briefly, the V1 variable region of Eukaryota 18S rDNA was sequenced using MiSeq technology (Illumina, San Diego, CA USA) and a GS-FLX pyrosequencer (454 Life Sciences, Branford, CT, USA), respectively. The preprocessing of sequence analysis (trimming, denoising, and removing of barcodes, primers, and homopolymers longer than 8 pb) was performed using a Mothur pipeline version 1.33.2 [28] developed by INRA Transfert Environnement. Reads with 100% identity were clustered into a unique sequence. Then, sequences were clustered into operational taxonomic units (OTU) at a threshold of 97% sequence similarity. The dominant eukaryotic OTUs were identified at the genus rank at 95% sequence similarity using the BLASTn algorithm in Genbank (NCBI database; https://blast.ncbi.nlm.nih.gov, access on the 1 January 2018).

2.10.3. Gravimetric Dust Analysis

The mass of the collected particles was determined in all the CIP 10-I samples. The substrate weighing was achieved using a 10.0 µg precision balance (AE163, Mettler-Toledo, Greifensee, Switzerland) for the CIP 10-I rotating cup containing the polyurethane foam. Prior to weighing, the substrates were dried in an oven at 50 °C for at least 4 h and were then left for at least one night in the weighing room. Electrostatic charges were neutralized just before the weighing (anti-static ionizing bars, Elcowa or Haug). Weight differences between final and initial weighing operations were corrected for weight variations observed in the field blanks (caused by different environmental conditions or handling of the substrates, for example).

2.11. Data Analysis

The statistical analysis of data, including linear regression and ANOVA at the 95% confidence level, was made using the StatGraphics 5.1 software (Statistical Graphics Corp., The Plains, VI, USA) and OriginPro® (OriginPro 2019b—9.6.5.169, OriginLab® Corporation, Northampton, MA, USA).

3. Results

3.1. Sampling Conditions

The measurement campaign allowed the collection of a relatively large number of samples in the summer and in the fall for inhalable culturable fungi (41 stationary, including 8 references and 16 personal samples), for inhalable dust (16 stationary and 8 personal samples), and for biodiversity of microbial communities in bioaerosols (24 stationary air samples). One settled dust sample was also collected in the plant for the biodiversity analysis and 4 samples were also taken with the Marple cascade impactor.
The measurement campaign took place under normal operating conditions for the company. A few production stoppages were observed during the measurement days, but these did not exceed half an hour.
The monitoring of climatic conditions in July (D1 and D2) revealed temperature values of the air at the different working areas were between 24.0 and 31.3 °C inside the WSP (Table S3). In October (D3 and D4), the temperature and relative humidity inside the WSP were between 21 and 25 °C, and the relative humidity of air was between 55 and 65%. The outdoor air temperature and relative humidity values are in good agreement with the measurements recorded by the nearest weather station (Table S3).

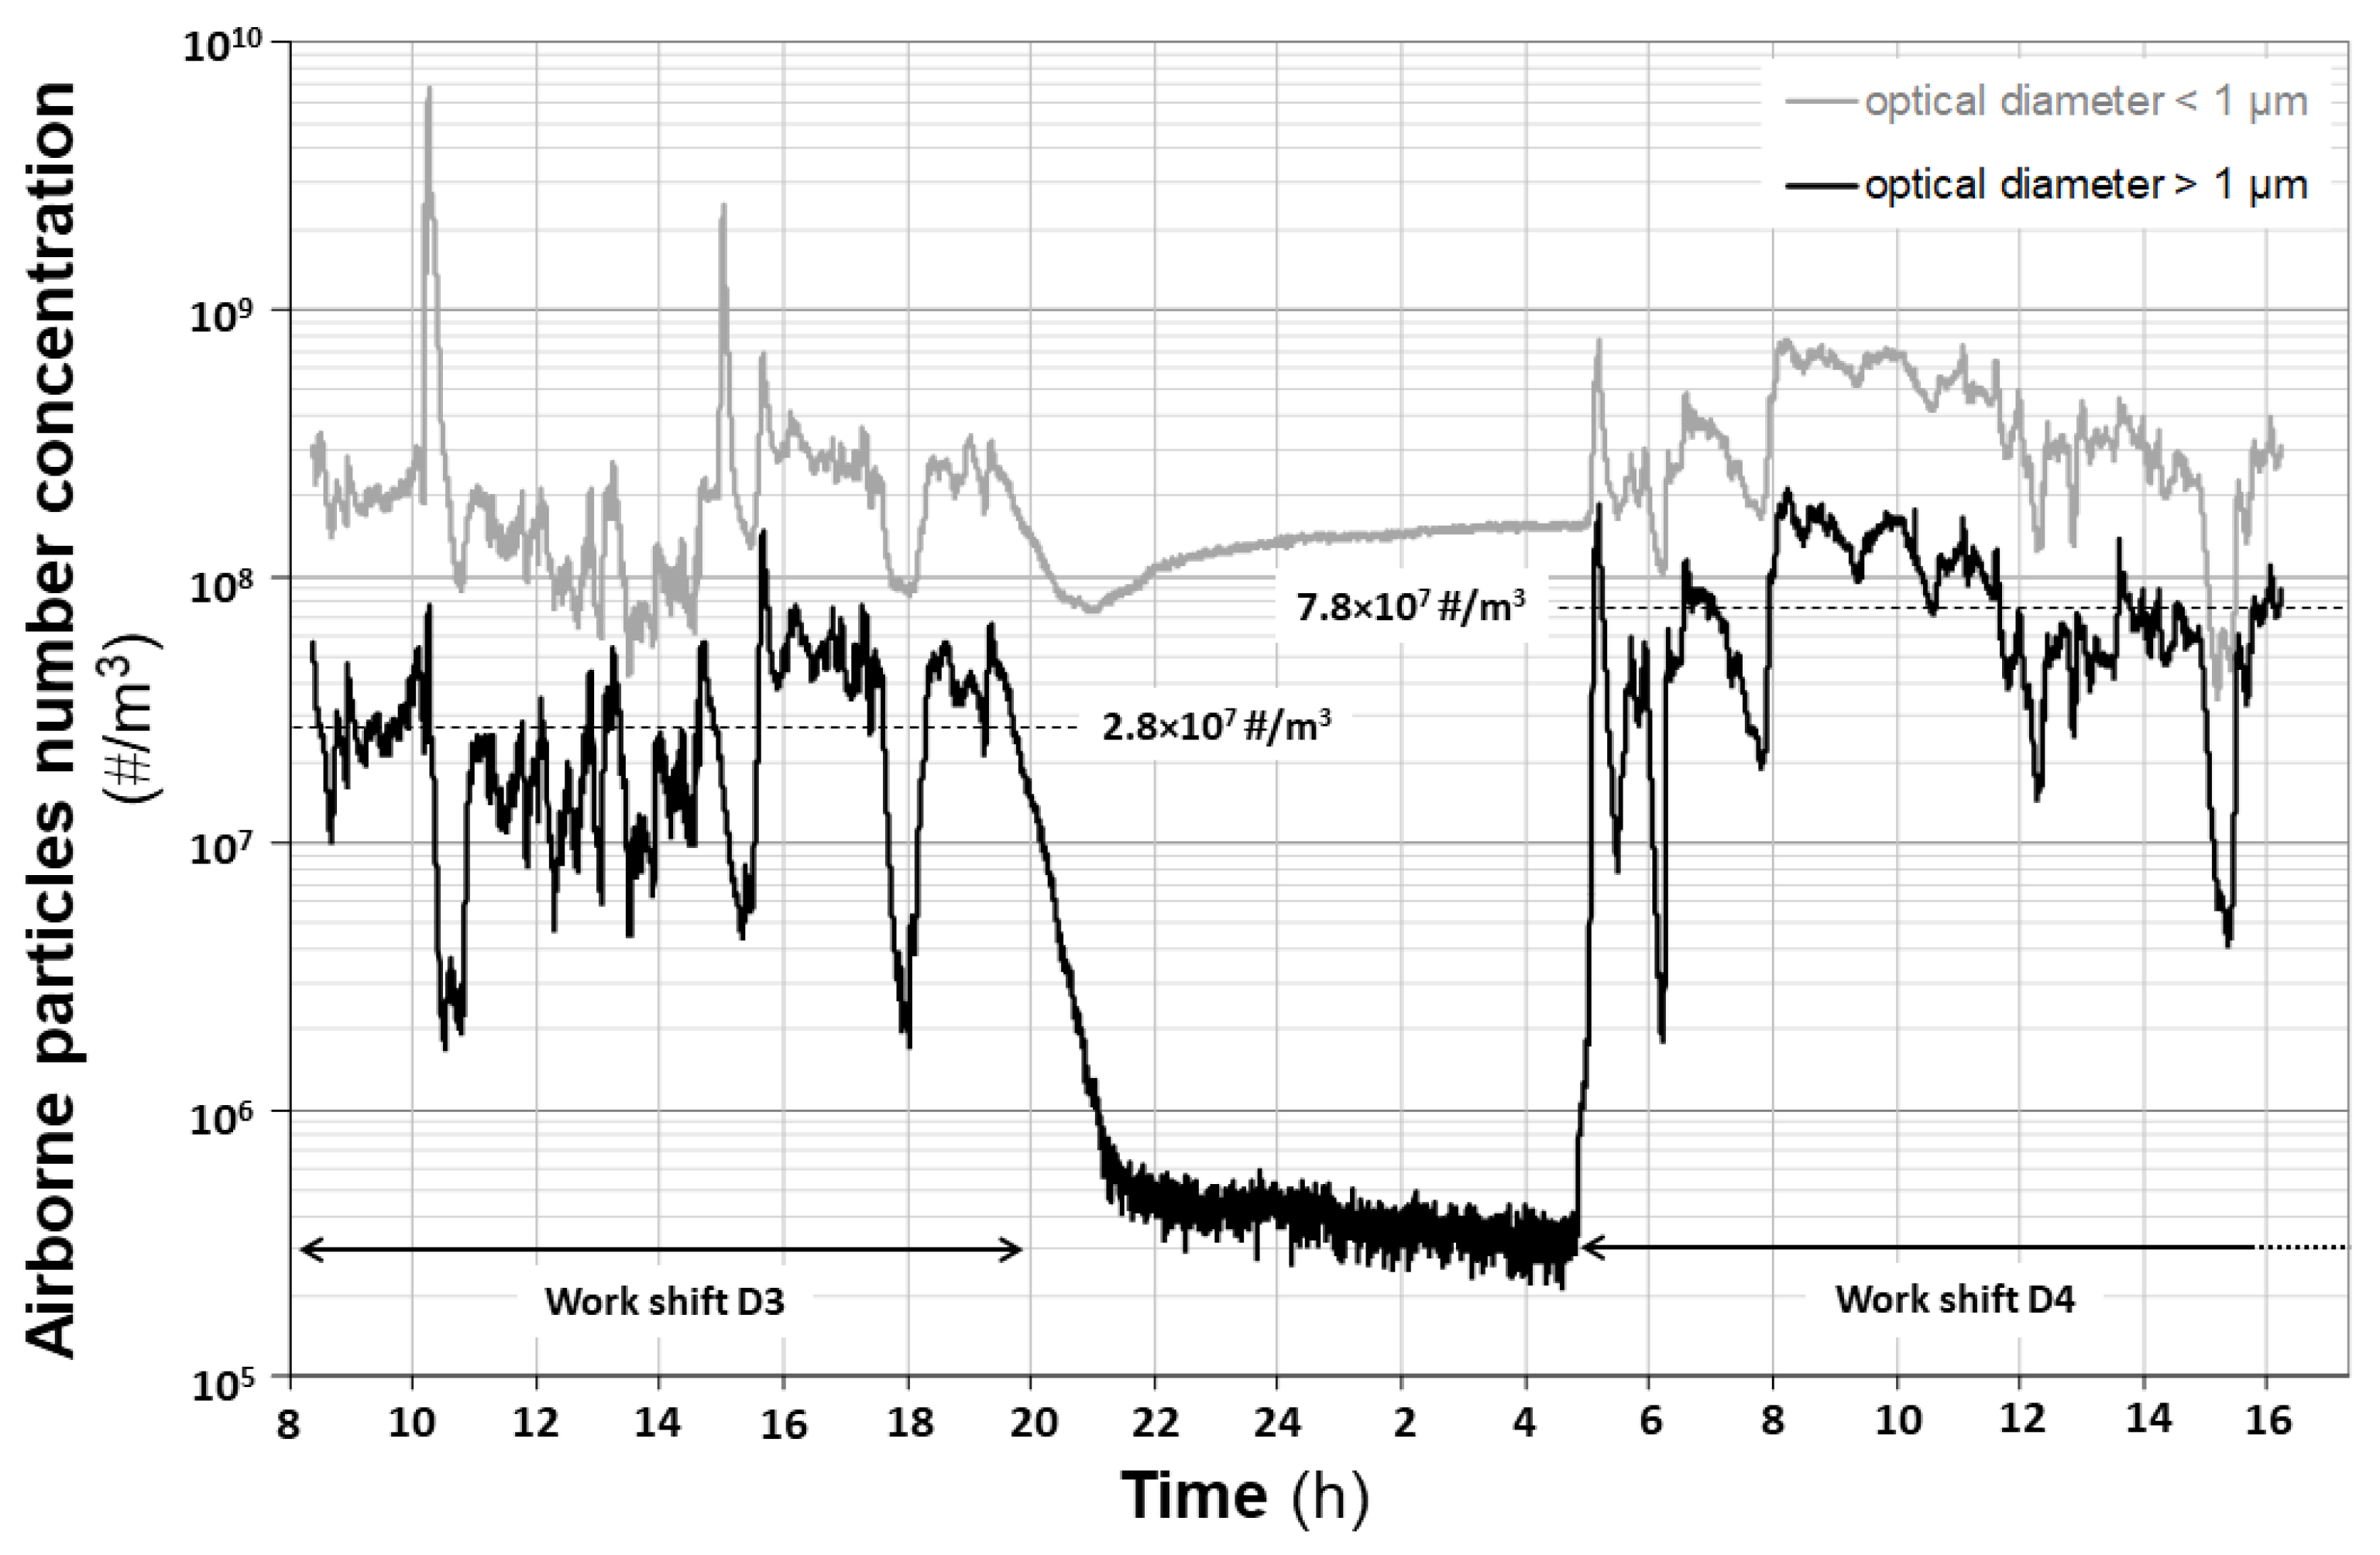
3.2. Real-Time Number Concentration of Airborne Particles

The real-time monitoring of airborne particles with the OPC was carried out in sorting cabin A for the four sampling days, close to the manual cardboard sorting activity. As an example, Figure 3 shows the evolution of the particle number concentration over the entire duration of days D3 and D4 (including during the intermediate night).
For particles with optical diameters greater than 1.0 µm, the working periods were characterized by airborne particle concentrations between 2 × 10⁶ and 2 × 10⁸ #/m3. On D3, the average concentration between 8:15 a.m. and 7:30 p.m. was equal to 2.8 × 10⁷ #/m3 with a series of concentration peaks up to 5 × 10⁷ #/m3. The occurrence of concentration peaks was related to the types and the amount of waste entering the cabin as well as to the work rate. The end of the work-shift on day D3 led to a drop in particle concentration. Between 10:00 p.m. on day D3 and 4:00 a.m. on day D4, working operations ceased, and the average measured concentration dropped to approximately 4 × 10⁵ #/m3 (i.e., 69 and 195 times lower than during the periods of activity on the days D3 and D4, respectively). D4 started with a high-level concentration peak monitored at the beginning of the work shift (about 5 a.m.). The average concentration between 5:00 a.m. and 4:15 p.m. was equal to 7.8 × 10⁷ #/m3 on day D4, with peaks of concentration that often reached higher levels than those monitored on day D3 (Figure 3). For submicronic particles with optical diameters below 1.0 µm, the time profile was similar to that of micronic particles but with a number concentration that was higher, between 5 × 10⁷ and more than 1 × 10⁹ #/m3 during the working periods of D3 and D4.
The measurements carried out on days D1 and D2 were not organized in such a way as to cover the night and the entire working day. They covered only limited periods of the two working days. However, the measurements indicate results similar to those observed for days D3 and D4.

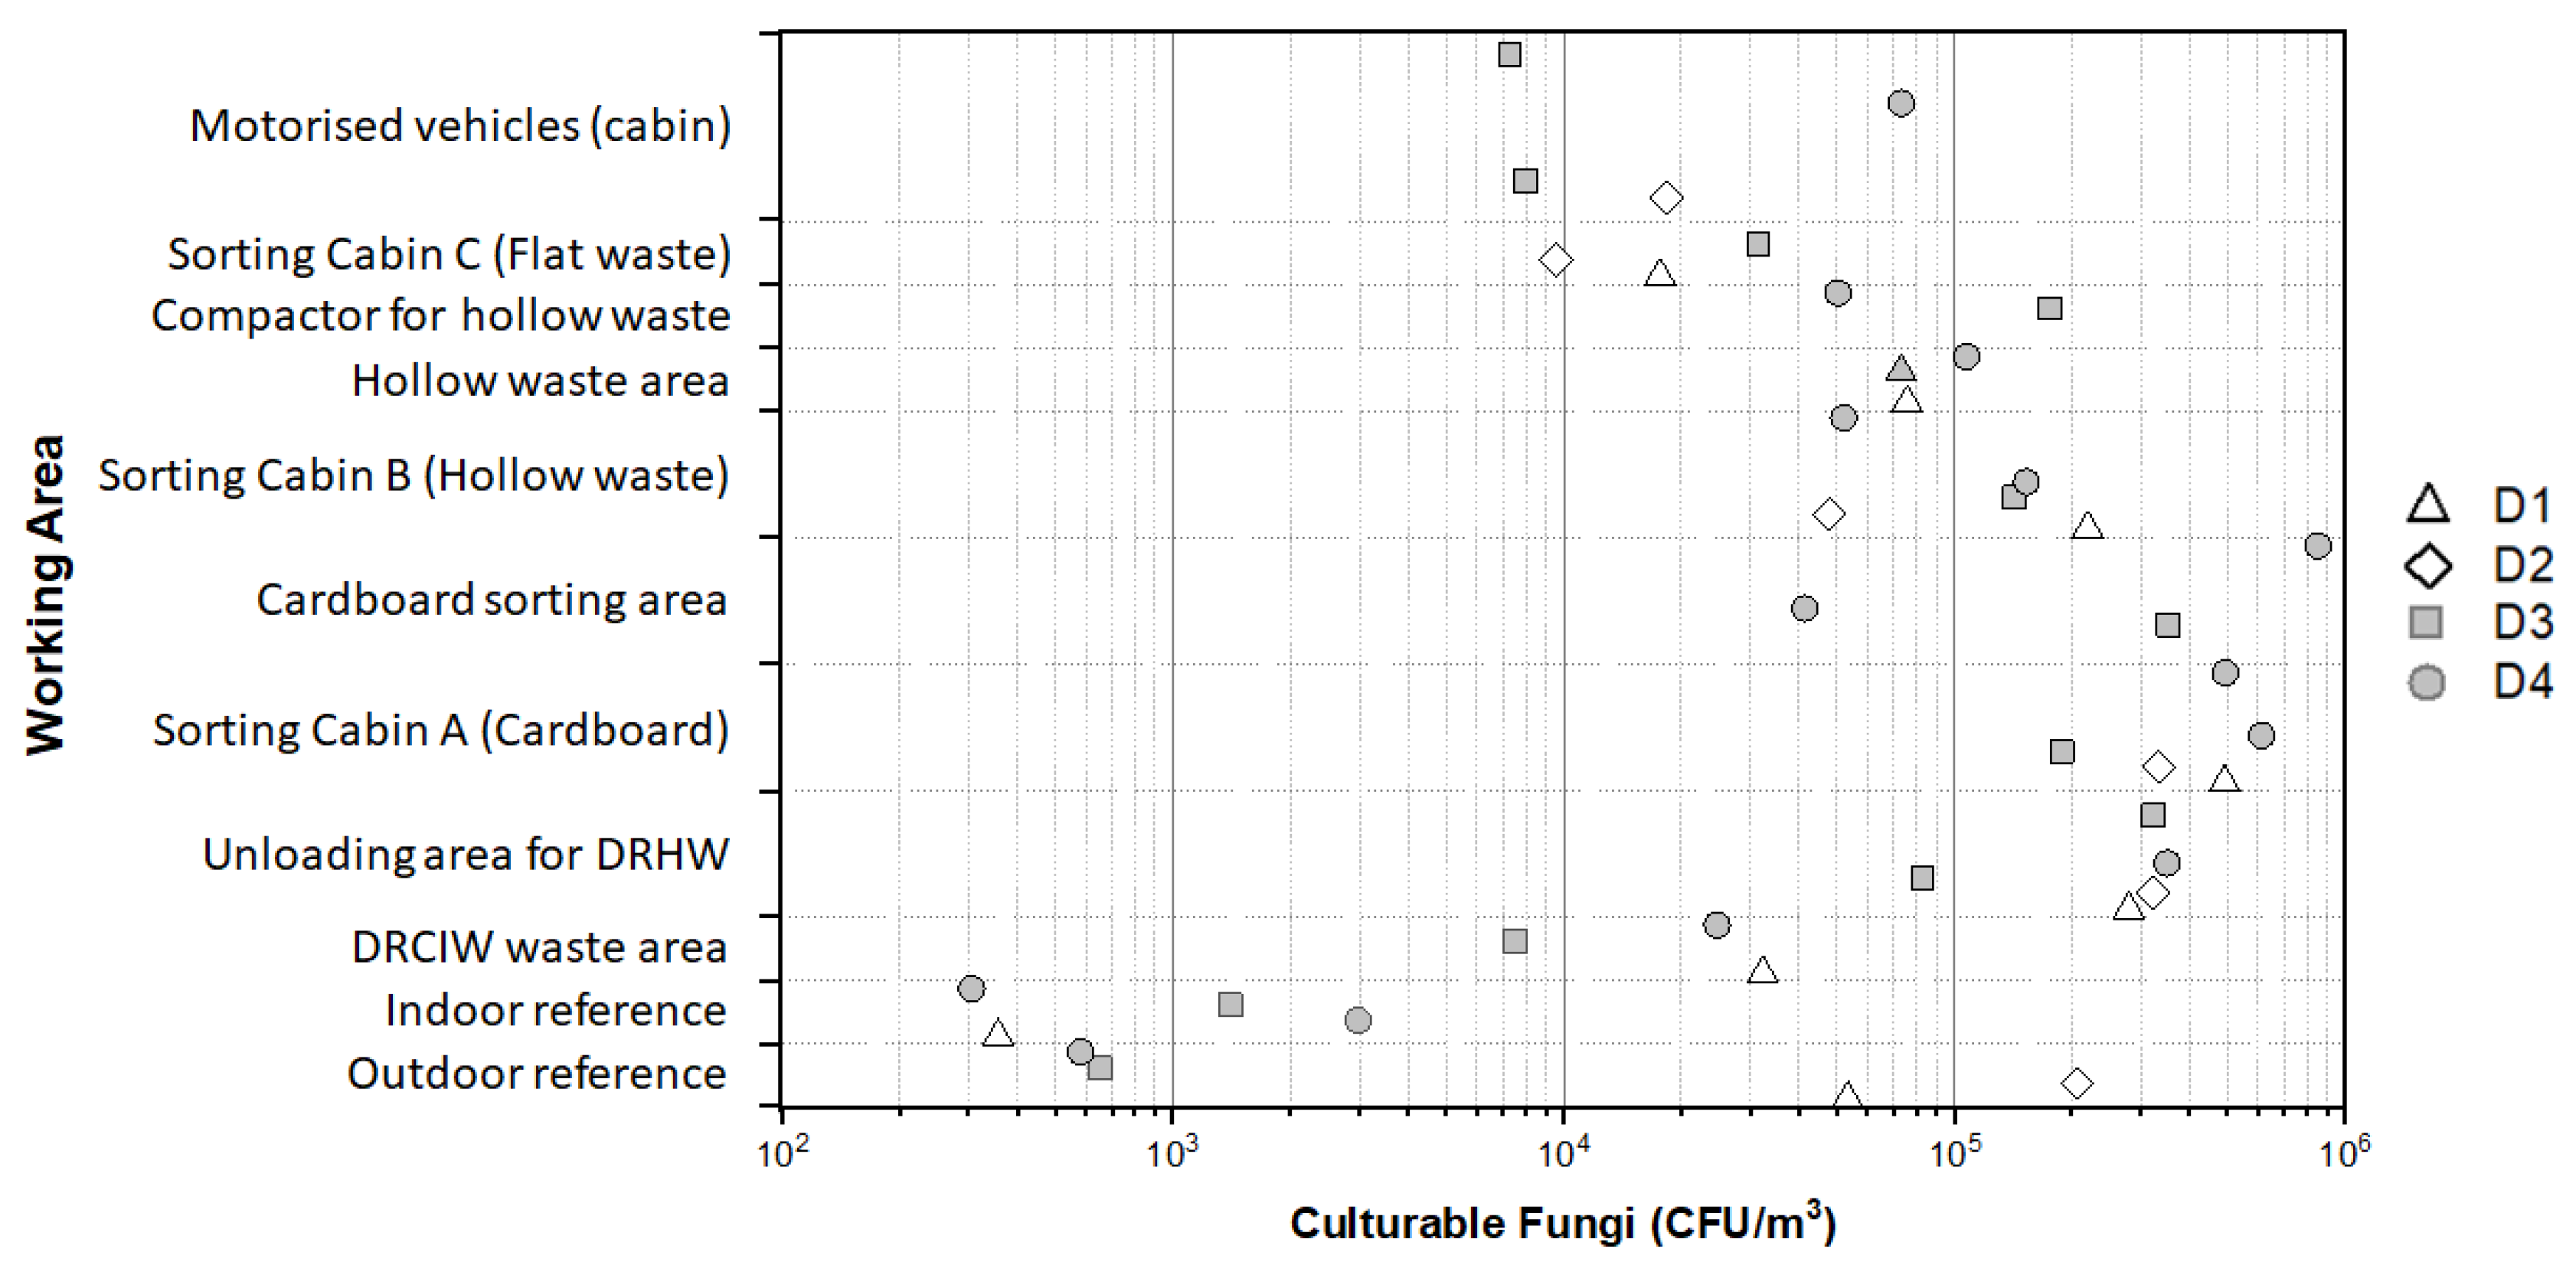
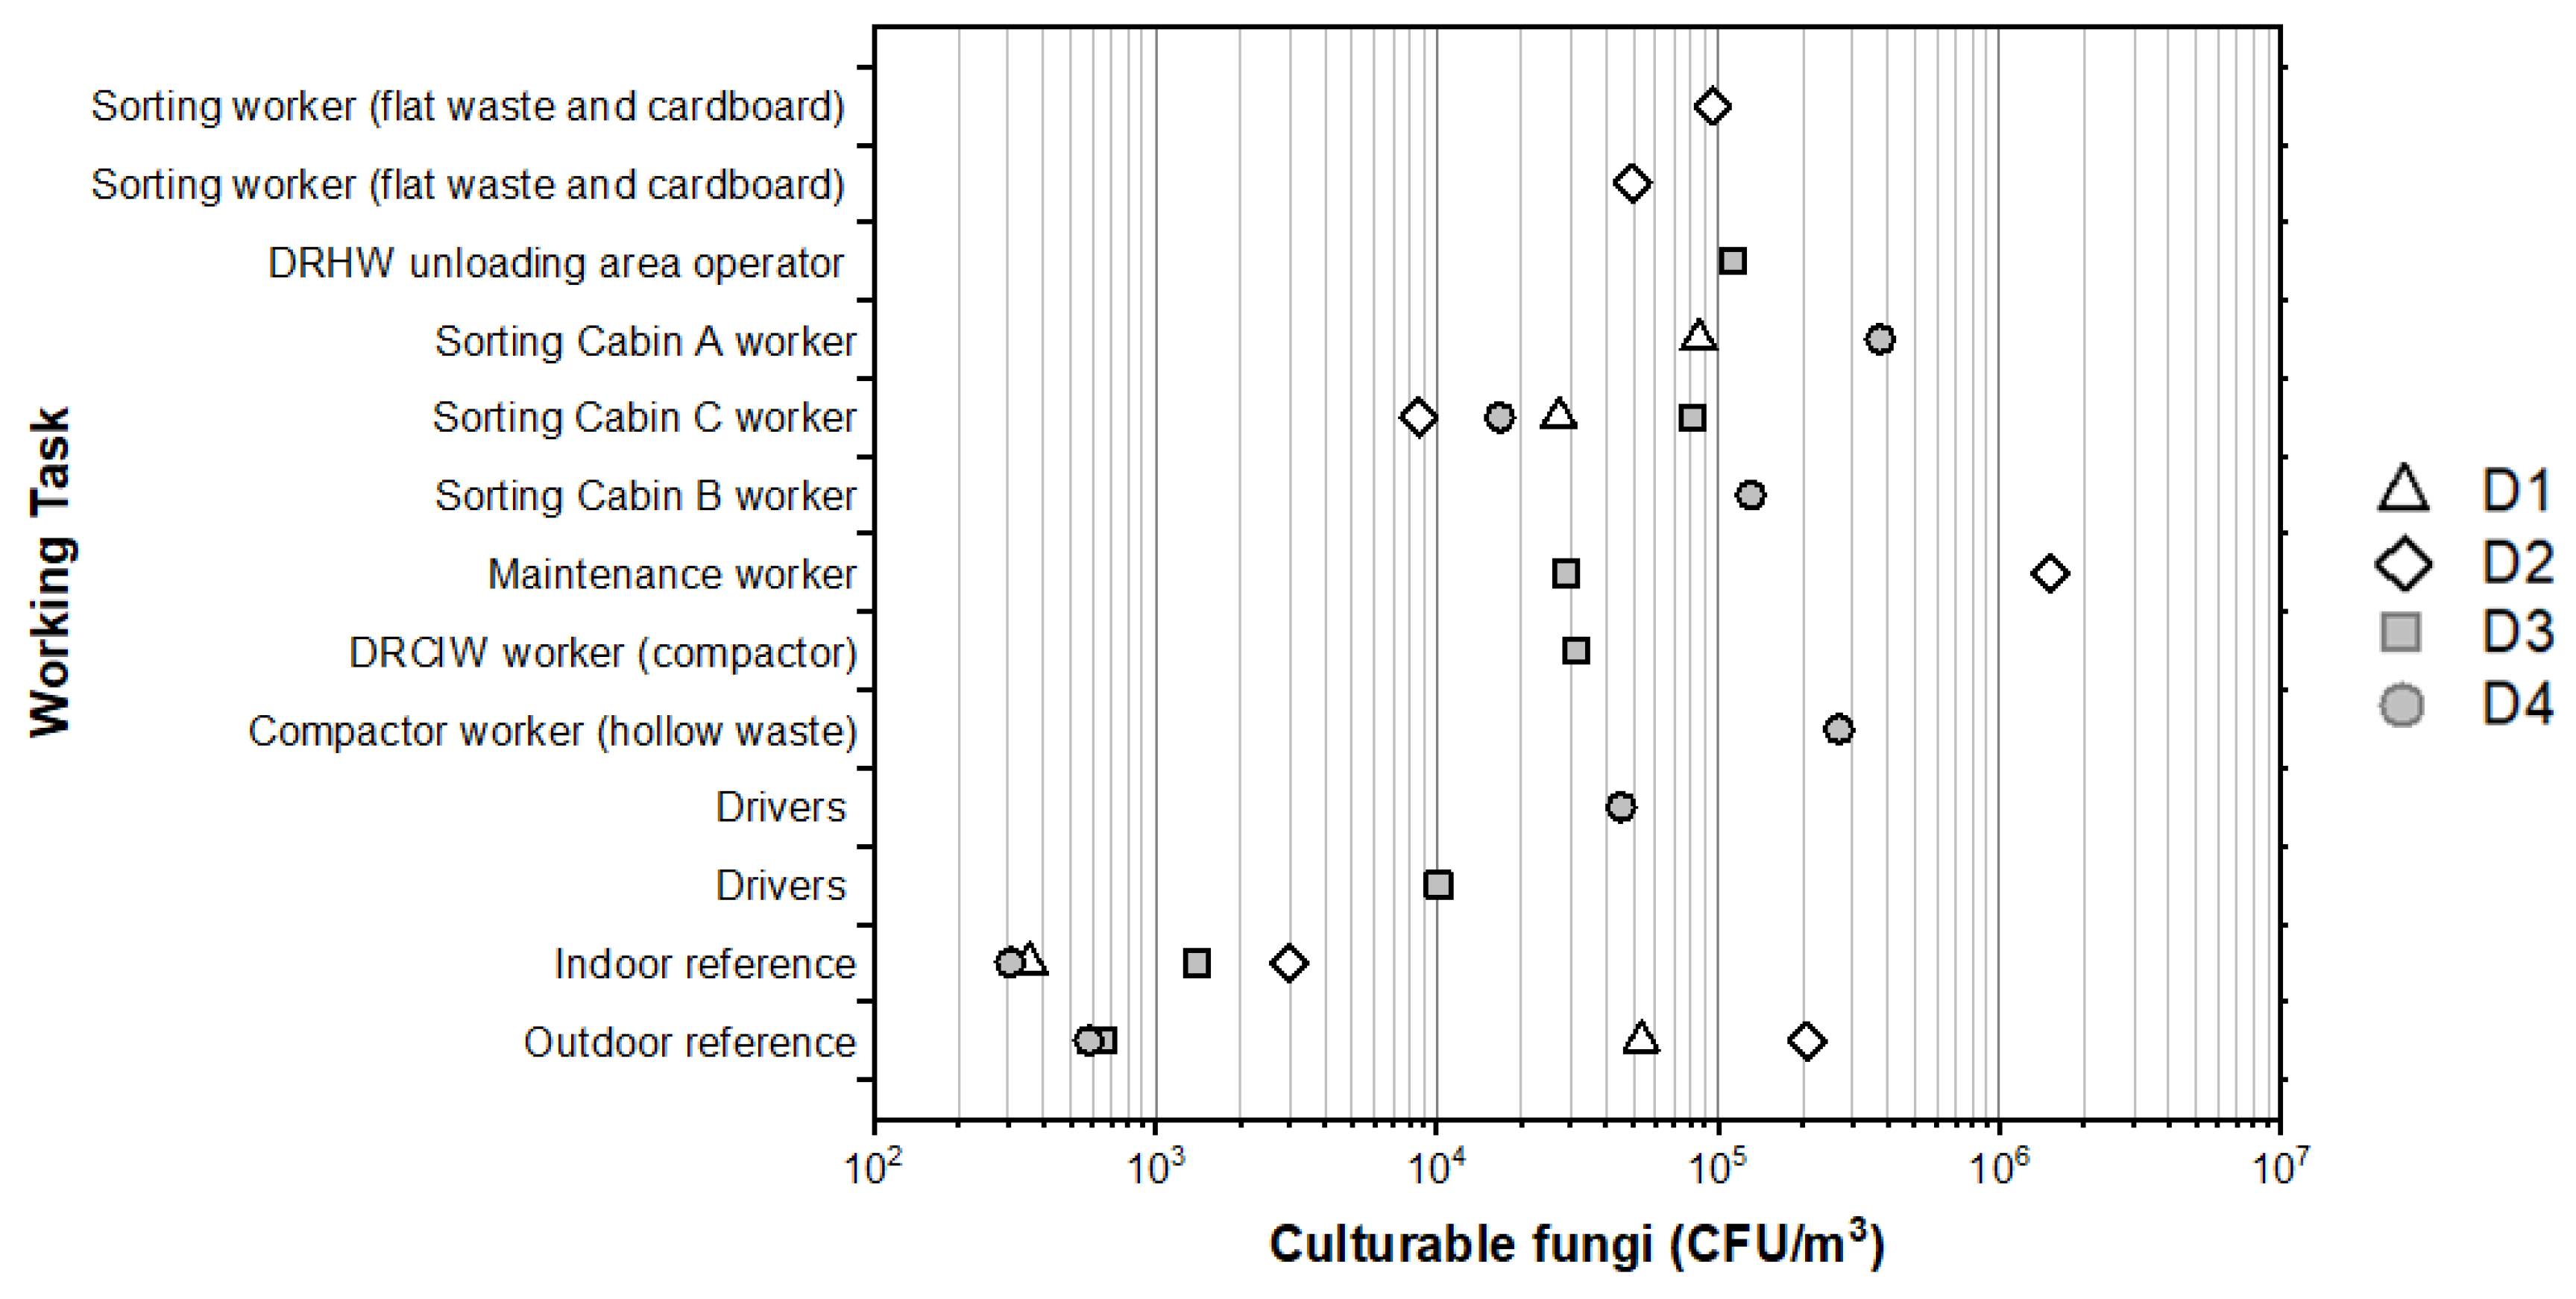
3.3. Exposure Levels to Airborne Fungi

In October, the ambient concentrations of airborne culturable fungi were measured under 1.0 × 10³ CFU/m3 in the outdoor air (Figure 4).
In contrast, those measured in July were 5.3 × 10⁴ and 2.1 × 10⁵ CFU/m3 for the first and second day, respectively. In the meeting room, the measured concentrations ranged from 3.1 × 10² to 3.0 × 10³ CFU/m3. Measurements in the different working areas of the WSP showed ambient concentrations of culturable fungi ranging from 7.3 × 10³ to 8.5 × 10⁵ CFU/m3 with a median concentration of 8.3 × 10⁴ CFU/m3 (Figure 4). The highest ambient concentrations were measured in the cardboard area (8.5 × 10⁵ CFU/m3), and all values obtained in the DRHW unloading area and in sorting cabin A (cardboards) were higher than 8.5 × 10⁴ CFU/m3 (Figure 4).
The ambient concentrations measured in the working area for a given day were from ~3 to ~1470 times higher than those measured at the outdoor reference point (or in the meeting room for July measurements) on the same day (Figure 4).
Personal exposures of workers to airborne culturable fungi ranged from 8.6 × 10³ to 1.5 × 10⁶ CFU/m3 (Figure 5). The highest personal exposures were measured for a maintenance operator cleaning in the cardboard sorting area (1.5 × 10⁶ CFU/m3). Exposures above 1.0 × 10⁵ CFU/m3 were also found for operators working at the hollow waste press, for sorting workers in sorting cabin B (hollow waste) and A (cardboards), as well as for operators in the DRHW unloading area. For a given day, the measured personal exposures were from ~3 to ~650 times higher than those measured at the outdoor reference.

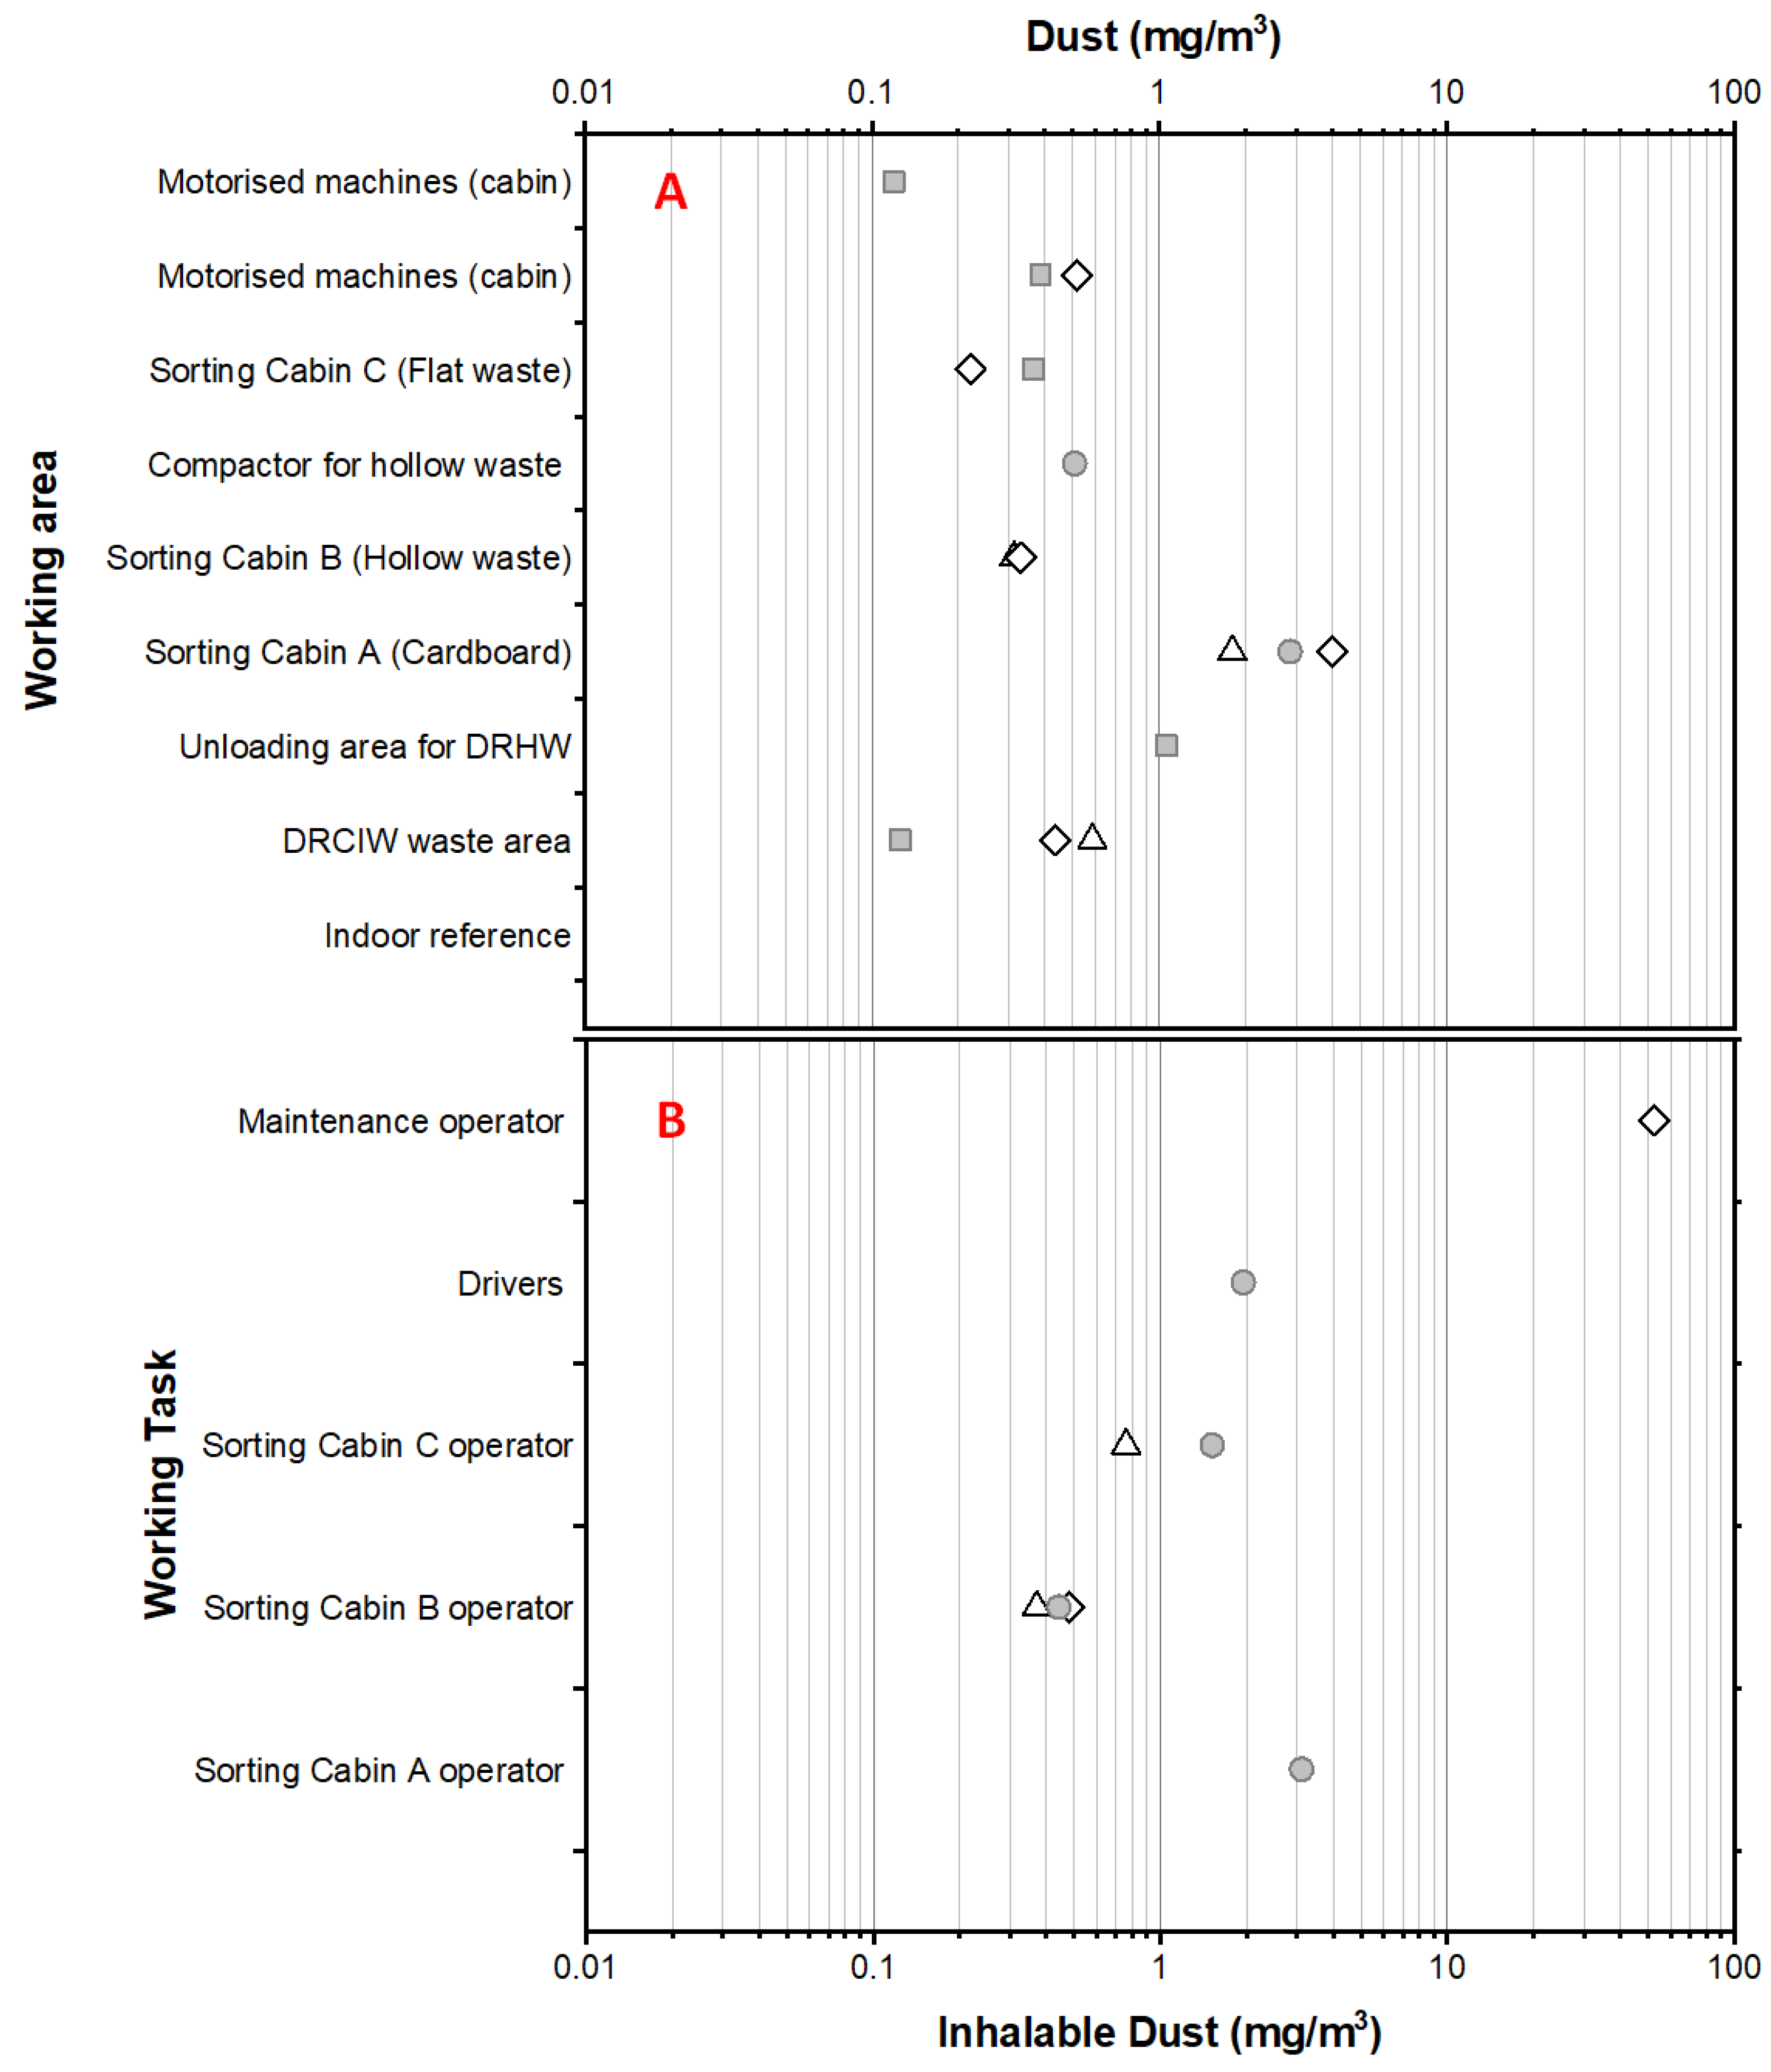
3.4. Exposure Levels to Inhalable Dust

The ambient concentrations of inhalable dust were found at a level less than or equal to 1 mg/m3 in most of the investigated working areas of the WSP, with the exception of sorting cabin A, in which they were found between 1.8 and 4.0 mg/m3 (Figure 6A).
A measurement carried out at the indoor reference indicates below the limit of quantification of 0.1 mg/m3. The personal exposure to airborne dust was between ~0.1 and 2.0 mg/m3 for drivers as well as for workers involved in sorting hollow wastes (sorting cabin B) and flat wastes (sorting cabin C).
One personal exposure measurement carried out for a worker involved in cardboard sorting (sorting cabin A) revealed a concentration of 3.0 mg/m3. Another one revealed an exposure level of 52.5 mg/m3 for a worker in charge of the maintenance/cleaning activity in the cardboard sorting area (Figure 6B). The ambient concentration levels measured with a CIP 10-I inhalable sampler in sorting cabins A and C were in good agreement with those measured with MCI when taking into account the sum of the nine collection stages (Figure 6).

3.5. Biodiversity among Fungal Communities in the Emitted Bioaerosols

3.5.1. General Data and Alpha Biodiversity

All the 21 samples were successfully sequenced for the genetic target 18S rDNA. The read number was from 858 to 23,952 (hollow waste sorting area) for eukaryota. Fungal OTUs number was lower in samples with a minimum at the outdoor reference (15 OTUs) and a maximum in sorting cabin A (436 OTUs) for a median value of 59 (Table 1). The Simpson index for fungal alpha biodiversity was between 0.0105 and 0.4 (median = 0.1), and the Shannon index was between 1.70 and 4.40 (median = 2.34). These values indicate that all fungal OTUs were not present in equal abundance, which means that some fungal genera were overrepresented as compared to others (Table 1).

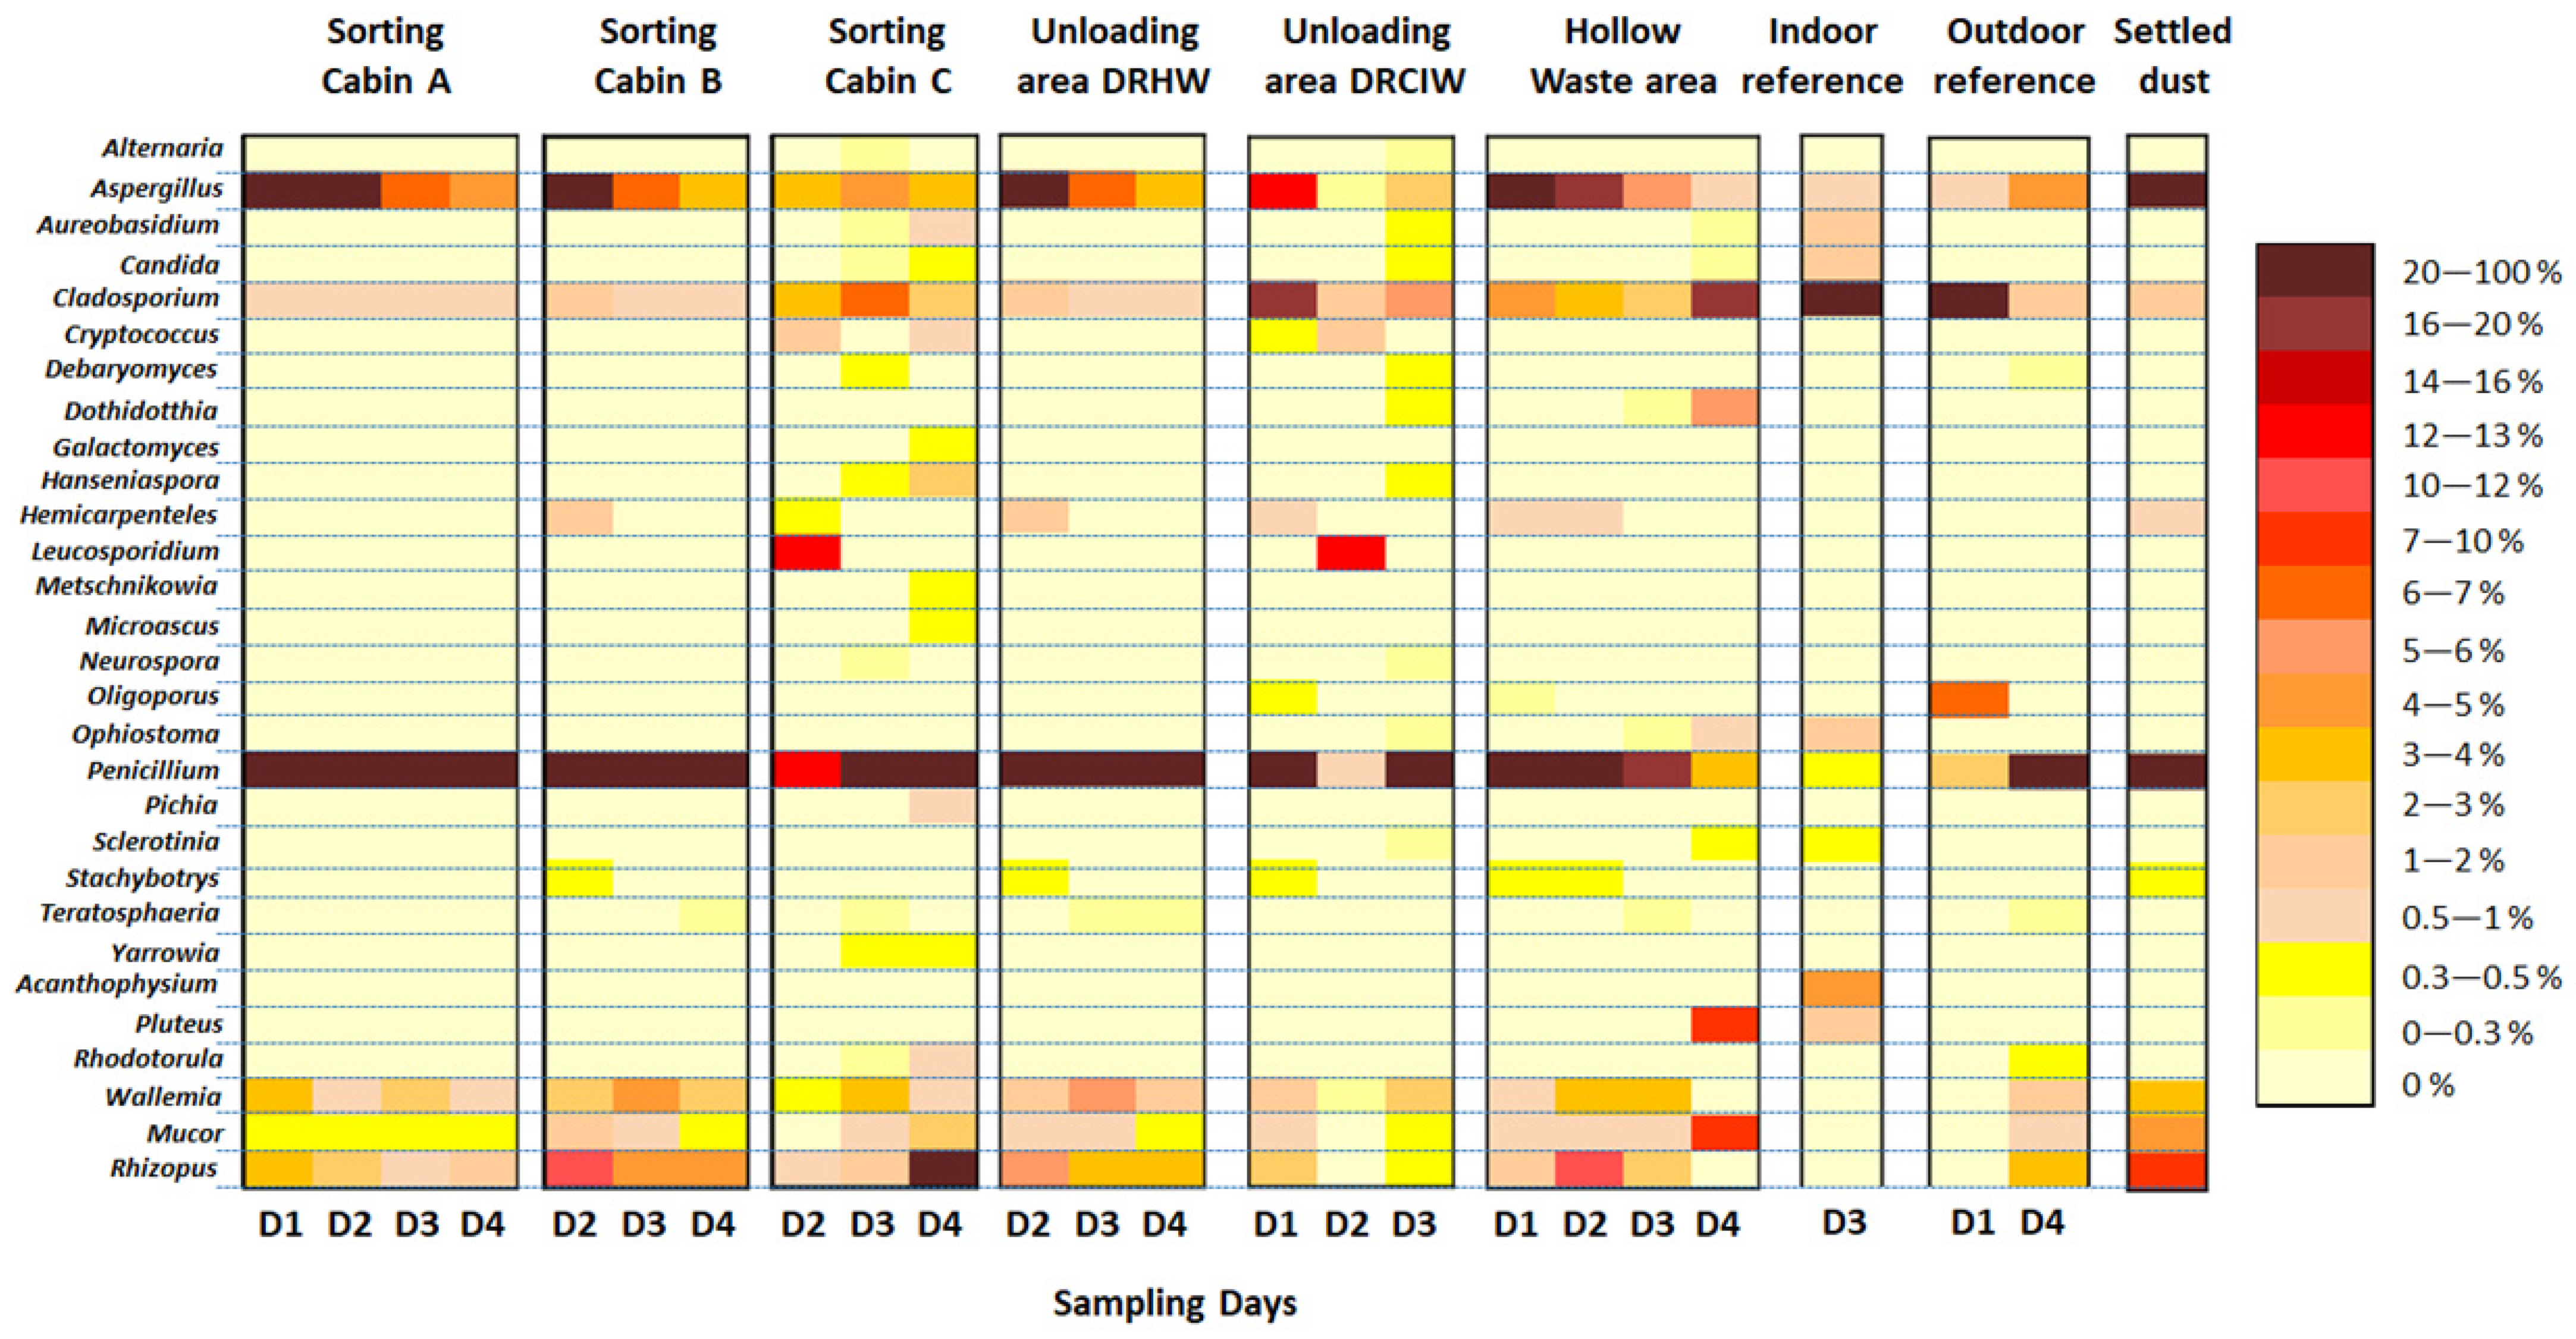
3.5.2. Biodiversity among Eukaryota Communities

Most of the Eukaryota sequences were assigned to fungi. Ascomycota was the main fungal phylum with a median value of 85% relative abundance (from 21% to 93%) followed by Basidiomycota with 5% (from 2% to 27%). The same trend was observed for both months. As for bacterial biodiversity, few fungal genera represented most of the fungal sequences. The fungal core microbiome consisted of 15 genera representing 92% (18% to 96%) of the Eukaryota sequences in the WSP, 70% (58% to 91%) in the references, and 92% in the settled dust sample (Figure 7).
Penicillium was the predominant fungal genera in the WSP, with a relative abundance higher than 20% in most of the collected samples, with a median value of 62% (10 to 80%). The Aspergillus genus was also present in high relative abundance, followed by Cladosporium, Wallemia, Mucor, and Rhizopus. Fungal biodiversity in settled dust mainly consisted of Penicillium and Aspergillus. In the indoor reference, Cladosporium and Acanthophysium were in the majority, whereas Cladosporium and Penicillium were the most present fungi in the outdoor reference.
Furthermore, the composition of the airborne fungal communities showed significant similarities from one day of sampling to another one in sorting cabin A (cardboards), sorting Cabin B (hollow waste), sorting cabin C (Flat waste), and the unloading area for DRHW. On the contrary, it was more variable for the unloading area for DRCIW and the hollow waste sorting area (Figure 7).

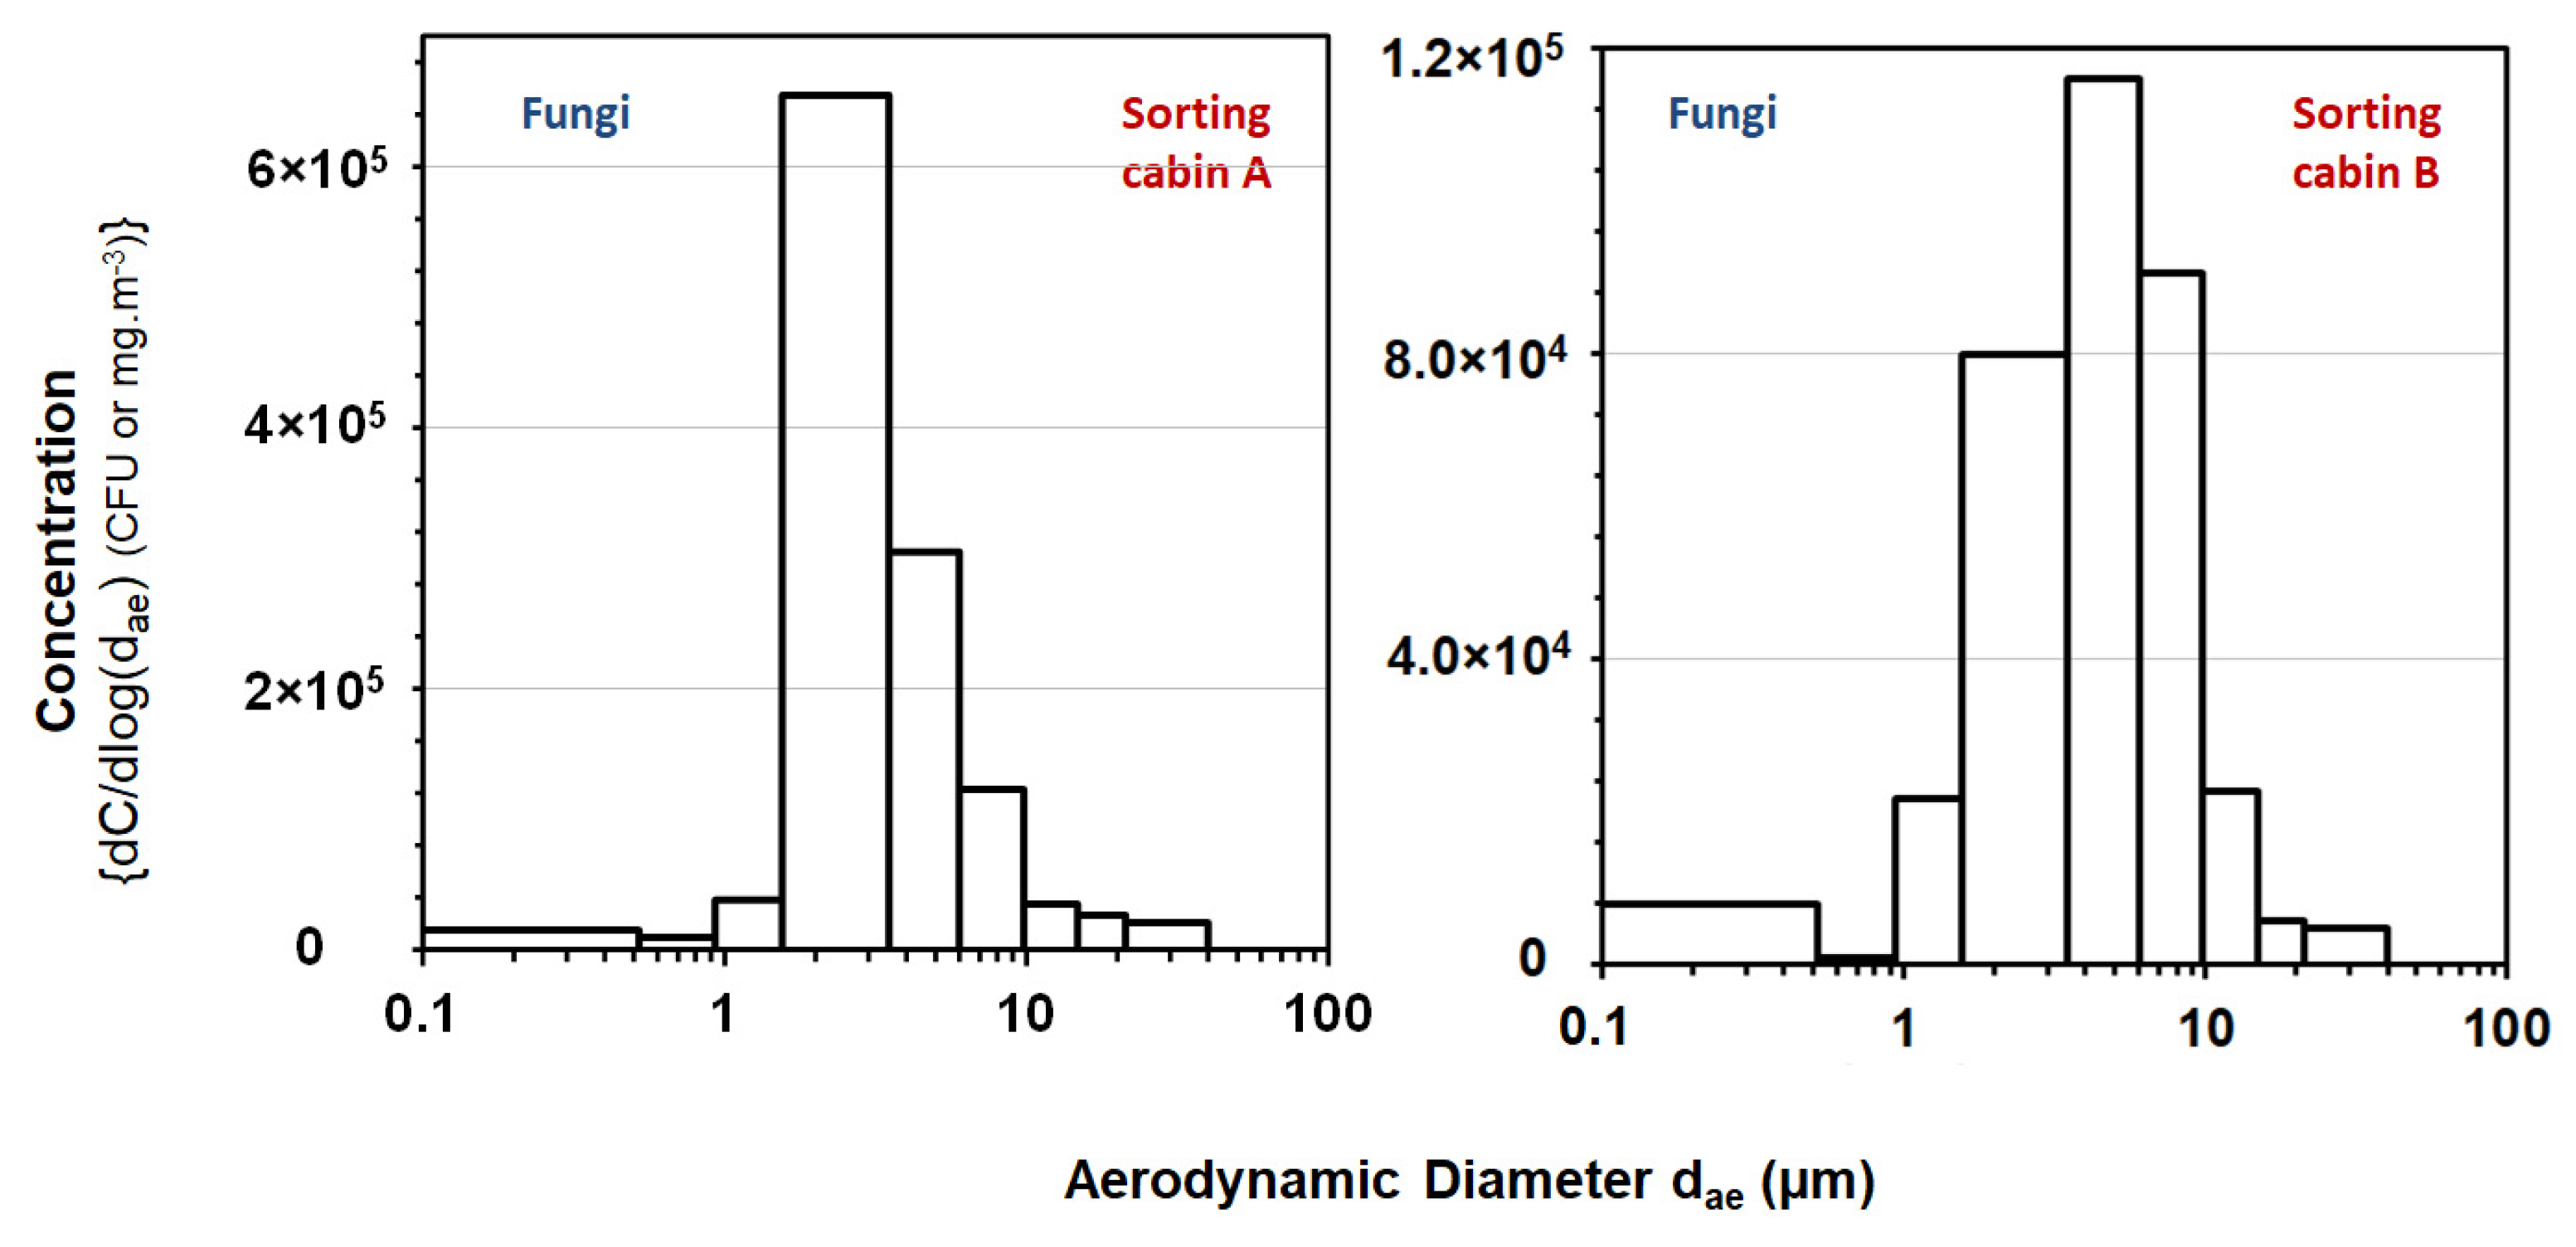
3.6. Size Distribution of Airborne Culturable Fungi

The size distribution of airborne culturable fungi and gravimetric dust were investigated with the MCI in sorting cabins in which cardboard (sorting cabin A) and hollow waste (sorting cabin B) were manually sorted. In sorting cabin A, the distribution of culturable fungi according to the aerodynamic diameter indicated a monomodal population with a median aerodynamic diameter close to 3.0 μm and a geometric standard deviation of about 1.7 (Figure 8). In sorting cabin B, the size distribution of culturable fungi was also a monomodal population with larger particles. Indeed, the airborne fungal entities emitted in sorting cabins A and B have aerodynamic diameters mainly between 2.0 and 10.0 µm. Other measurements made in sorting cabin A (cardboard) on days D1 and D2 and in sorting cabin B (hollow waste) on day D4 revealed similar patterns regarding the size distribution of airborne culturable fungi and gravimetric dust.

4. Discussion

4.1. Ambient Concentration Levels in the WSP

4.1.1. Level of Total Airborne Particles Measured with the OPC

The results from the OPC clearly show that working periods were responsible for the release of large amounts of particles in the air of sorting cabin A (Figure 3). The airborne particle number concentration was highly variable (between 5 × 10⁷ and >109 #/m3 for particles with dopt > 0.25 µm, between 2 × 10⁶ and 2 × 10⁸ #/m3 for dopt > 1.0 µm). Such variability and the additional occurrence of several peaks of concentration depend on the work rate, the occasional stoppages in the processing chain, or the type and amount of waste handled in the cabin.
The above-mentioned levels are comparable with the number concentration measured with similar or different OPCs in other companies belonging to the waste treatment sector. OPC GRIMM® 1.108 (dopt > 0.3 µm) number concentrations were measured between 2 × 10⁷ and >108 #/m3 in composting enclosed facilities, also with the existence of concentration peaks related to activities such as waste delivery and shredding [29,30]. OPC GRIMM® 1.108 (dopt > 0.3 µm) number concentrations remained greater than 107 #/m3 at 100 m upwind and 50 m downwind distances from a green waste composting open plant [31]. A four-channel handheld OPC (Met One Instruments, model 804) measured particle number concentration values (dopt > 0.3 µm) between ~3 × 10⁷ and >8 × 10⁷ #/m3 in the waste processing shed of a materials recycling facility [32]. Number concentrations (particle size mainly between 0.3 and 5 µm) were measured near 1.3 × 10⁶ #/m3 in a dry waste treatment plant in Finland using an Airborne Particle Counter APC-plus 1000 [33]. In the same article, Tolvanen specified that he previously measured much higher number concentrations (107 to 108 #/m3) in other Finnish waste treatment plants.
The OPCs’ measurements are non-specific and do not provide any information on the nature, chemical or biological composition, or the shape and density of the numerous detected particles. Therefore, the particles counted are not all microorganisms or biological components but are mixed in a complex way with other organic (or inorganic) dust present in the workplace. Moreover, because the different real-time instruments do not necessarily have the same diameter measurement ranges or specifications, it remains all the more difficult to compare studies with each other. However, the COP real-time measurements used in the present study demonstrated the existence of a significant (concentration ~70 to ~200 times higher than during the night, sometimes >109 #/m3, which corresponds to the upper range of number concentrations found in the literature) and variable particle emissions in the air of cabin A during the work shift and the progress of waste sorting activities. The release of such a large amount of various particles was unsurprisingly associated with high inhalable gravimetric dust mass concentrations that ranged from 1.8 to 4.0 mg/m3 (Section 3.4). In addition, the COP confirmed that the work periods were indeed at the origin of the emission of particles into the air in cabin A (day/night difference). The real-time measurement also allows us to identify the most emissive tasks or work events (concentration peaks observed). The decrease in concentration for particles of dopt ≥ 1 µm during the night (Figure 3) can be attributed to the cessation of emission activities in the WSP as well as to the deposition by gravity of particles emitted into the air before the work stoppage. The decrease in concentration for particles of dopt ≥ 1 µm was much less pronounced, and particle concentration reached only a background level. The corresponding population of particles was largely dominated by small size particles (opt < 0.4 µm) which are known to remain suspended in the air much longer [34].The information collected is essential for establishing appropriate prevention strategies.

4.1.2. Airborne Inhalable Gravimetric Dust

Our results confirm that WSPs can be dusty work environments. Sorting cabin A (cardboards) was the area where concentrations of inhalable gravimetric dust mass concentrations were the highest (up to 4 mg/m3 Figure 6A). In the other areas, mass concentrations were between >0.1 and 1 mg/m3. These stationary sampling concentrations are close to some examples reported in previously published studies, which reported ambient concentrations between LOD to 13.33 mg/m3 in the waste treatment sector of different countries [6,11,20,33,35,36].
As previously mentioned with the measurement results of the OPC, huge amounts of particles are emitted into the air during the working day from the treated waste and greatly contribute to the ambient dust pollution at the different workstations. Dust deposits, sometimes significant, were also observed during the sampling campaign on handrails, vehicles, and floors, especially in waste storage areas and under conveyor belts. Such settled dusts were also reported in previous studies [10,36] and may be secondary sources of aerosol emission in the work area and may promote exposure through contact with hands or clothing.

4.1.3. Airborne Culturable Fungi

Measurements carried out in the different working areas of the WSP revealed ambient concentrations ranging from 7.3 × 10³ to 8.5 × 10⁵ CFU/m3 for culturable fungi. The emission of culturable fungi into the ambient air of sorting centers has been reported in several previous studies. Indeed, the ambient concentration of culturable mesophilic fungi was measured between 4.5 × 10² and 2.2 × 10⁶ CFU/m3 in the air of household waste treatment plants located in Germany, Finland, the Netherlands, Denmark, Portugal, and Canada [6,11,33,35,37,38,39,40,41,42]. In the waste processing shed of a materials recycling Brazilian facility, using a combined settle plate passive method and a 100 L/min MAS-100 active sampling, the mean fungal concentration values ranged from 1.6 × 10³ to 4.7 × 10³ CFU/m3, depending on the season [32]. Thus, our findings corroborate results from previously published studies indicating the occurrence of fungi in the ambient air of WSPs at concentration levels that vary over a wide range.
These results confirm that waste and waste sorting activities are sources of airborne fungi. Firstly, waste is a favorable environment for the growth and survival of microorganisms. Indeed, the sorted dry recyclable household waste delivered at the WSP consists of many different elements and matters such as plastic, paper, cardboard, metal, glass, organic waste, and residuals, which depend on the national or local consumer habits as well as the sorting regulation for household waste collection. It usually contains significant amounts of microorganisms; for example, microbial concentration in waste was found to be over 107 CFU/g of matter in freshly collected waste in India [43]. The survival and growth of microbial communities in waste are favored not only by the materials that constitute the waste but also by the residual organic matter that remains on the packaging when it is thrown in the bin. Previous studies carried out during waste collection [13,44] and sorting [45] also suggested that they are influenced by season and prolonged duration of waste storage. Secondly, sorting activities (moving conveyor belts, workers’ gestures, vehicle traffic, etc.) are conducive to the emission of particles from contaminated waste or deposited dust.
Thus, dry household waste generally contains a significant amount of microorganisms that become airborne when the waste is handled. In the present study, significant concentrations of airborne dust and microorganisms were found in all the working areas, especially in the unloading area for the DRHW, in the main building of the cardboard area, and in the associated sorting cabin A.

4.2. Biodiversity of Airborne Fungal Communities

4.2.1. Overview of Fungal Biodiversity in the Air of the WSP

Biodiversity data from the present study revealed a high number of OTUs in the bioaerosol samples collected in the WSP, which suggests a high diversity even if only 15 taxa accounted for the majority. This is far higher than the richness observed in studies carried out in the same occupational environment using culture-based methods [11,12,16,33,46,47,48], for which usually less than 10 genera are detected, and in the range of the published ones carried out using molecular biology-based methods [14,15], for which up to 430 genera have been reported. Such differences in results from the different methods have already been reported and discussed, and it is acknowledged that culture-based methods and molecular biology-based ones are complementary for the assessment of biodiversity in bioaerosols [49,50].

4.2.2. Dominant Fungal Taxa and Possible Origins

The present study also revealed an overwhelming prevalence of the Penicillium fungal genera in both bioaerosols and settled dust samples taken in the WSP, followed by the Aspergillus, Cladosporium, Wallemia, Mucor, and Rhizopus genera. The genera Stachybotrys, Oligoprus, and Leucosporidium were also detected in relevant proportions but only for some sampling days. These findings corroborate the biodiversity among microbial communities found in bioaerosols emitting in WSPs that were reported all over the world. Indeed, published studies carried out with the culture-based method in Finland [11,33], Portugal [46,47], Denmark [12], Czech Republic [48], and Poland [16] have revealed that bioaerosols emitted in municipal solid waste treatment plants were dominated by cultivated fungal species belonging to the genus Penicillium, with other common genera including Aspergillus, Rhizopus, Cladosporium, Geotrichum, and Chrysonilia. In studies that have been able to identify isolates to species level, cultivated fungal species mentioned were Aspergillus niger [11,46], A. fumigatus [12,33,46], A. flavus [46], Chrysonilia sitophila [33], Cladosporium cladosporioides [48], and a series of more or less well-identified species belonging to the genus Penicillium, including Penicillium nalgiovense [33,48]. In a study on household waste collection, Madsen et al. found that the most common culturable fungi in the air of the delivery waste area of the WSP were Penicillium species belonging to P. brevicompactum, P. commune, P. expansum, and P. italicum [13]. Biodiversity of culturable fungi have also been investigated on surfaces in WSP facilities [46].
Fewer biodiversity studies have been carried out in WSPs using molecular-based methods. A study reported the occurrence of Stachybotrys chartarum and Aspergillus fumigatus using direct qPCR in bioaerosol samples taken from a WSP in Portugal [47]. This was not the case in another WPS investigated with the same method in the same country [46]. Two studies carried out in France reported the biodiversity of airborne fungal communities assessed by high-throughput sequencing. The first one, based on 18S sequencing, revealed 22 identified fungal genera belonging to Ascomycota, an early diverging fungal lineage, and Basidiomycota in bioaerosol samples [14]. The second one, based on ITS1 sequencing, reported 592 identified fungal genera in bioaerosol samples, with a fungal core microbiome composed of five genera, mainly belonging to Ascomycota, Basidiomycota, and Mucoromycota [15]. In both studies, the dominant fungal genera were Cladosporium, Alternaria, Debaryomyces, Penicillium, Candida, Wallemia, Cryptococcus, Rhizopus, and Mucor, which is in line with the findings in the present study. The same taxa were also found by NGS among microbial communities sampled in the filtration systems of forklifts used in a WSP [51]. As previously discussed [14], the use of ITS as a target gene for the assessment of fungal biodiversity in bioaerosols would have provided a better taxonomic resolution for Fungi than 18S rDNA. Therefore, further studies on fungi would be more appropriate if ITS were used as a target gene.
The composition of microbial communities in bioaerosols from WSPs may be determined by numerous factors that are not fully elucidated. These factors include the waste and its history, the WSP (geographical location, organization, etc.), season and associated meteorological conditions, sorting activity (amount of treated waste, the intensity of production, etc.), settled dust, possible external sources, as well as methodological aspects. They may explain the differences observed between studies.
The taxa airborne microbiome in WPS originates from waste and waste handling during the sorting process, the surrounding air, microorganisms generated from workers, and other sources and activities. Interestingly, the dominant fungal genera in bioaerosols from the WSP reported in the present study are the ones previously reported in the air of WSPs in studies carried out for waste collection [52]. This suggests that the main source of airborne fungal communities is waste and waste handling during the sorting process. The dominance of some fungal taxa can be explained by both nutrient and environmental conditions occurring in the waste and WSPs, which would be favorable for the growth and survival of fungal species belonging to the taxa concerned. The materials that constitute the waste and the presence of food packaging among waste (trays, yogurt pots and sauce jars, beverage bottles, etc.) on which food residue remains, would create favorable conditions for growth and survival of microorganisms. Residues coming from foodstuffs with initially low water activity (aw) or with aw reduced by dehydration before sorting may be favorable for microorganisms able to grow at low aw. This is the case for species belonging to Penicillium and Cladosporium, which were shown to be able to grow at low aw and a large range of temperatures [53]. Their growth and survival on paper and cardboard have also been shown [54]. The case of Wallemia is interesting, as the genera was found in studies carried out using molecular biology-based methods [14,15] and not in those conducted with culture-based ones. Wallemia was also found by NGS among microbial communities sampled in the filtration systems of forklifts used in a WSP [51]. Reasons for discrepancies between biology-based studies and culture-based ones have been previously detailed [14,15] and are mainly attributed to the slow growth rate of Wallemia species, as well as their nutrient requirements for their growth on culture media. The several species belonging to Wallemia are xerophilic [55] and are reported as spoiler microorganisms of foodstuffs with low aw [56]. Some were reported in bioaerosols and in settled dust from both occupational environments and dwellings [57,58,59].
The composition of microbial communities in settled dust samples reflect the ones in bioaerosol samples, which is not surpising since dust is deposited on the floor and on the machinery of the WSP from waste and waste processing. On the other hand, it can also be assumed that the resuspension of settled dust into the air would contribute partly to the airborne microbiome. However, the collection of additional dust samples is necessary to comfort the tendencies. We were not able to find published data regarding biodiversity among microbial communities in settled dust from WSPs. However, a study revealed that the composition of culturable fungal communities was very close for both bioaerosol and surface samples collected in a WSP in Portugal [46].

4.2.3. Spatio-Temporal Variation in Biodiversity

We have observed spatio-temporal variations of fungal biodiversity in bioaerosols from the WSP. Several previously published studies reported seasonal variations of microbial biodiversity in bioaerosols from outdoor air [59,60], in swine houses [61,62], and during the sorting of household waste [15]. However, no general tendencies can be deduced regarding the role of environmental parameters in observed variations. Degois et al. [15] investigated the airborne fungal communities during one year in a WSP located in France and showed that biodiversity was significantly affected by the season of the sampling, irrespective of the working areas where samples were taken.
Indeed, the composition of microbial communities in bioaerosols from WSPs may be determined by numerous factors that are not fully elucidated. These factors include waste and its history (which may vary from one geographical area to another due to consumers’ habits), the WSP (location, organization, etc.), season and associated meteorological conditions, geographical area, sorting activity (amount of treated waste, intensity of production, etc.), settled dust, possible external sources as well as methodological aspects. They can explain the discrepancies between the studies.

4.3. Size Distribution of Bioaerosols

The results from our study revealed two size distribution patterns for airborne fungi (median aerodynamic diameter = 3.0 µm).
The size distribution of particles carrying microbial entities in bioaerosols emitted in WSPs has received little attention over the past. Airborne fungal entities were associated with particles < 5 µm in aerodynamic diameters in municipal solid waste treatment plants in Finland [11] and in the range of 3.3–7.0 µm in Poland [17,63]. Thus, results from published studies are contradictory regarding the size of particles carrying microorganisms and are not totally in line with our findings. On the other hand, our results are consistent with those published in the waste sector, which indicates that the size distribution of airborne particles carrying bacteria and those carrying fungi is strongly different [64]. The sources of the inconsistencies between the studies regarding the size distribution of particles carrying fungi are probably to be found in the multiple and varied factors that affect size distribution. These factors include the studied environment, the season, and more generally, climatic conditions, time of the day, type of activities, sampling methods, etc. [64]. It should also be noted that all the cited published studies carried out in WSPs used the six-stage Andersen sampler for the investigation of SDAM.
Our findings confirm that the emitted bioaerosols are complex, with different patterns for bacteria and fungi. The measured SDAM suggests that airborne microorganisms from bioaerosols sampled in the WSP, once inhaled, can be deposited in different regions of the human respiratory tract [65,66].

4.4. Personal Exposure Levels

4.4.1. Personal Exposure to Inhalable Dust

We were able to collect only a few personal samples for the analysis of gravimetric dust, but they indicate that workers of the WSP were exposed to inhalable dust, mainly between 0.3 and 3 mg/m3. A specific case of excessive exposure level to dust was also highlighted by our personal measurements, with a mass concentration of 52.5 mg/m3 during maintenance and cleaning activity in the cardboard area close to sorting cabin A.
Such levels of personal exposure to inhalable dust for workers in WSPs corroborate previous findings. Indeed, personal exposure to inhalable dust among WPS workers has been investigated for WSPs located in Denmark, Poland, Germany, England and Wales, Korea, the Netherlands, France, and Canada [6,8,10,12,20,38,39,40,45,67,68,69]. They revealed personal exposure levels from 0.1 to 62.6 mg/m3 with a wide range of variation between studies.
The heterogeneity of mass concentrations measured between the previously published articles is not surprising and can be explained by the diversity of the situations encountered, in particular, the nature of the handled waste, the aerosol samplers used, or the quality of the ventilation system. For example, Schlosser et al. [45] demonstrated that a reduction in dust exposure by a factor of ~3 occurred when the investigated sorting room was fitted with a ventilation system that enabled operators to work directly under a unidirectional clean air flow as opposed to a less-effective ventilation system. Likewise, their results also showed that the age of the sorted waste (since collection) and the order in which waste is treated could lead to variability in the exposure to dust in sorting rooms.
Our results also confirmed the conclusions of some other previous articles on the fact that workers performing mobile, and possibly dusty, tasks away from the rooms (i.e., cleaning or maintenance) may be exposed to personal mass concentrations as abnormally high as 10 mg/m3, or even 50 mg/m3.
Some areas or personal exposures may present low dust levels but, at the same time, very high concentrations of culturable microorganisms. This result highlights the fact that only using the regulatory limit for dust with no specific effects to assess the risk associated with bioaerosol emitted in WSP is not a suitable approach.

4.4.2. Personal Exposure to Culturable Fungi

The results indicate that personal exposures to airborne culturable fungi for workers of the WSP varied in a very wide range. The highest exposure levels were found for workers involved in maintenance and cleaning, but workers in the sorting cabins, at the hollow waste press, in the DRHW unloading area, as well as drivers, were also found to be exposed to airborne fungi. Indeed, personal exposure to airborne culturable fungi is well documented, and our results corroborate those from previously published studies. Especially in France, a recent study measured personal exposures between 910 and 2.7 × 10⁶ CFU/m3 for fungi [45]. In the same country, Duquenne and Facon reported personal exposures between 240 and 9.1 × 10⁶ CFU/m3 for culturable fungi [10]. Similar exposure levels were reported for fungi in Germany [6], in Denmark [12], and in [69]. These published studies indicate that the most exposing tasks in WPSs are unloading, shredding, and sorting of waste, as well as maintenance operations.

4.5. Risks Associated with the Measured Exposures

4.5.1. Risks Associated to the Exposure to Airborne Dust

The decree 2021-1763 of 23 December 2021 amends article R 4222-10 of the French Labour Code, setting the concentrations of total (e.g., inhalable) dust not to be exceeded in specific pollution areas at 4.0 mg/m3, respectively [70]. Indeed, most of the personal inhalable dust mass concentrations measured in the investigated WSP were over one-tenth of this proposed value. The maintenance/cleaning activity in the cardboard area was associated with a very high exposure level to dust, equal to 52.5 mg/m3, more than 10 times over the French value. Moreover, the dust produced during such a cleaning activity of the zone has undeniably degraded the air quality in sorting cabin A (cardboard) at the same time.

4.5.2. Risks Associated to the Exposure to Airborne Fungi

Levels of exposure to airborne fungi reached high levels compared to other working situations. However, the lack of any occupational exposure limit value (OEL) makes it difficult to interpret the results in terms of risk. Several guide values were proposed to assist the experts in judging exposure levels for fungi; the corresponding values generally vary from country to country, but are not available in all countries and there are not health base values [71]. For example; in Switzerland, the guide values that can be described as acceptable in workplaces are 103 CFU/m3 fungi [72]. In Germany, a guide value of 5 × 10⁴ CFU/m3 is proposed for fungi in the air of household waste sorting plants [73]. In France, guide values were published for airborne fungi [74]. The recommendation is as follows: the work situation is qualified as acceptable when the exposure level to culturable fungi is below 105 CFU/m3; it is qualified as unsatisfactory between 105 and 106 CFU/m3 and as unacceptable above 106 CFU/m3. Furthermore, a scientific synthesis of numerous works (including a large number of different sectors) concluded that the majority of effects related to fungal exposure are observed from levels of approximately 105 spores/m3 [75]. In the present study, about 62% of measured personal exposures were over 104 CFU/m3, about 31% were over 105 CFU/m3 and 6% where over 106 CFU/m3. Thus, one-third of the personal exposures for bacterifungi exceeded the proposed guide values, which indicate significant exposures for the concerned workers.
Data from the present study regarding the size distribution fugal airborne particles in the air of sorting cabins indicate that the majority of inhaled particles carrying fungi deposit in the respiratory tract and especially in the lower airways (Figure 8).
The information provided by the analysis of biodiversity in fungal aerosol contribute to a better appreciation of risk. However, it should be remembered that the biodiversity measurements were made in an ambient environment and do not correspond to measurements of personal worker exposure. Moreover, the identification was only made at the genera level. Since the main pathogenic effects of fungi on health are often species-related, the scope of the interpretation is limited to qualitative speculation. Anyway, the composition of airborne microbiomes shows a mixture of microbial genera that may be involved in symptoms among workers. Indeed, several dominant fungal genera identified in the air of the investigated WSP, as well as in settled dust, include species that are opportunistic pathogens of allergenic ones for humans or known as MVOC or mycotoxin producers. Thus, the exposure to several Penicillium species such as P. nalgiovense in the food industry [76] and P. glabrum in the cork one [77], was associated with respiratory symptoms. Species belonging to the Aspergillus genera such as A. fumigatus and several other several Aspergillus species are opportunistic fungal pathogens that cause allergic and invasive diseases (aspergillosis) especially among immunocompromised hosts [78]. The exposure to airborne A. fumigatus has been associated to respiratory disease among compost workers [79]. Species belonging to the Cladosporium genera, such as Cladosporium herbarum, are major source of inhaled allergens and often associated with allergic symptoms of the respiratory tract [80]. W. sebi, W. mellicola, and W. muriae are species belonging to the genus Wallemia that were reported in lungs diseases such as farmer’s lung disease, and also rare subcutaneous and cutaneous infections [81]. Weber [82] reviewed the health effects induced by the occupational exposure to Mucor species and especially asthma among workers handling contaminated Esparto fibres, hypersensitivity pneumonitis in a cork worker, and allergic alveolitis among teachers due to the inhalation of contaminated sugarcane dust. The exposure of Norwegian sawmills workers to high concentrations of airborne spores of Rhizopus microsporus has been associated to R. microsporus-specific antibody production against a widespread range of antigens [83]. In addition, many fungal species that are found in the air of WSPs carry allergens or/and are mycotoxin producers and are associated with allergenic and toxinic diseases [80,84,85].

4.6. The Benefits of Joint Measurement of Concentration, Biodiversity and Size Distribution

The lack of VELP makes it difficult to interpret the measured concentration levels of airborne microorganisms in terms of risk. In the absence of a sufficiently precise assessment of the risks represented by the levels of exposure to bioaerosols in the WSPs, it is difficult to put in place preventive measures fully adapted to these risks. Indeed, the present study indicates that the combined measurement of exposure levels, particle size distribution (and their further deposition in lungs) and species composition helps to understand the risks faced by exposed workers. Firstly, the concentration of airborne microorganisms provide the amount of microbial entities that can be inhaled by workers. They represent the levels, which will have to be lowered at specific workstations after the implementation of preventive measures. Secondly, the taxon composition makes it possible to specify the hazards represented by the taxons that make up the microbial communities that make up inhaled bioaerosols. Of course, it is necessary to use target genes and barcoding techniques allowing the identification of these taxa at species level (for example, ITS2 and ITS1). In the present study, the risk assessment is not complete because the target gene does not allow this. To facilitate the assessment, the introduction of qualitative indicators could be a valuable aid in summarising the contribution of each taxon to the overall risk. Such an approach has been proposed and applied to composting activities [86]. Thirdly, knowledge of the size distribution of bioaerosols makes it possible to specify the deposition of microbial entities in the respiratory tract. This refines risk assessment. It would also be interesting to carry out an analysis of the microbial diversity of each fraction sampled, in order to associate the deposition of aerosols in the lungs with the danger posed by the microbial taxa of which they are composed. On the other hand, the size distribution of bioaerosols governs the transport of particles in the air and, in particular, the nature of the ventilation measures to be implemented to eliminate them in order to reduce exposure. This information is therefore essential for the implementation of preventive measures.
Several published studies have also proposed the measurement of indicators of health effects such as total inflammatory potential and cytotoxicity in parallel to the measurement of exposure levels [19]. In fact, such indicators could be integrated into measurement strategies of epidemiological studies with exposure levels, as well as the size distribution and biodiversity of bioaerosols, in order to advance the assessment of risks associated with exposure to biological agents.

4.7. Prevention Means

Results from the present study indicate significant ambient concentration levels in cabins of motorised vehicles and associated personal exposures for drivers regarding airborne culturable fungi and inhalable dust. This corroborates the previously published results in the same occupational environment [10,36] and was also observed during waste collection [87] and waste composting [88]. In the absence of ventilated cabins, drivers are exposed to the ambient aerosol and their level of exposure depends on the work areas into which they escape. When they are in a ventilated cabin, WSP drivers can also be exposed if the ventilation or air conditioning is defective or poorly maintained [89] and if it is used improperly (opening of doors, etc.). These results indicate that it is necessary to equip motorised vehicles of WSPs with ventilated and air-conditioned cabs and to recall good practices for the use of these cabs and in particular for the maintenance of ventilation and air-conditioning systems [10,45].

4.8. Synthesis of Findings

The investigated WSP is characterised by relatively high ambient concentrations of fungi and dust and the study shows that workers in charge of sorting activities can be exposed to high levels of fungi and inhalable dust. The tasks most prone to fungi are waste sorting in the first cabin, driving vehicles, and maintenance operations. The workers exposure levels found in the investigated WSP were in the range of the previously published ones in WSP. The joint measurement of bioaerosol concentration, biodiversity, and size distribution have never been published before and, thus, the results from our study constitute a new contribution to knowledge. The new findings dealing with size distribution and biodiversity of bioaerosols suggest that employees are exposed to complex bioaerosols during their work and helps to make a finer diagnosis of the risks involved, which is often difficult in the absence of any OEL for bioaerosols in general.
The results from the present study provide the evidence that overall emission and dispersion of aerosols should be minimized during the sorting process of waste. When source control is not sufficient or possible for design reasons and exposure issues cannot be resolved by general ventilation, preventive measures must be deployed at least on certain worker populations or workstations.

5. Conclusions

The results of the study encourage supplementing the assessment of individual exposure levels to biological agents with data concerning the species composition of bioaerosols and the size of particles carrying microorganisms that are inhaled. Measurement and markers of health effects would further refine the diagnosis of biological risk for WSP workers. This would provide helpful data for defining accurate strategies for the assessment bioaerosol exposure and for a better understanding of biological risks at the workplaces.

Supplementary Materials

The following supporting information can be downloaded at: https://www.mdpi.com/article/10.3390/atmos15040461/s1; Figure S1: Schematic representation of the off-line measurement process used for assessing the concentration levels of airborne culturable bacteria and fungi, endotoxins, inhalable dust, as well as the biodiversity of microbial communities in bioaerosols and the size distribution of airborne microorganisms and dust in the WSP; Table S1: Details of the sampling plan designed for the stationary assessment of bioaerosols and airborne dust in the investigated WSP; Table S2: Details of the sampling plan designed for the assessment of personal exposure to bioaerosols and airborne dust in the investigated WSP; Table S3: Data of temperature and relative humidity of air at the sampling points in the investigated WSP.

Author Contributions

Conceptualization, P.D., X.S. and B.F.; samples collection and analysis as well as real-time measurements, P.D., X.S., C.C., V.K., J.D. and B.F.; data analysis and representation, P.D., X.S. and J.D.; writing—original draft preparation, P.D., X.S. and J.D.; writing—review and editing, P.D., X.S. and J.D. All authors have read and agreed to the published version of the manuscript.

Funding

This research received no external funding.

Institutional Review Board Statement

Not applicable.

Informed Consent Statement

Not applicable.

Data Availability Statement

The data presented in this study are available on request from the corresponding author. The data are not publicly available due to privacy.

Conflicts of Interest

The authors declare no conflicts of interest.

References

  1. EU, (European Union). Directive 2008/98/EC of the European Parliament and of the Council of 19 November 2008 on Waste and Repealing Certain Directives. 2008. Available online: http://data.europa.eu/eli/dir/2008/98/oj (accessed on 23 March 2024).
  2. ADEME (Agence De l’Environnement et de la Maîtrise de l’Energie). Déchets: Chiffres-Clés. In Faits et Chiffres; ADEME (Agence De l’Environnement et de la Maîtrise de l’Energie): Anger, France, 2020; pp. 1–28. [Google Scholar]
  3. Cabaret, M.; Folley, S. État Des Lieux Du Parc des Centres De Tri De Recyclables Secs Ménagers En France; TERRA, ADEME: Anger, France, 2013; p. 51. [Google Scholar]
  4. Poole, C.J.M.; Basu, S. Systematic Review: Occupational illness in the waste and recycling sector. Occup. Med. 2017, 67, 626–636. [Google Scholar] [CrossRef] [PubMed]
  5. Walser, S.M.; Gerstner, D.G.; Brenner, B.; Bünger, J.; Eikmann, T.; Janssen, B.; Kolb, S.; Kolk, A.; Nowak, D.; Raulf, M.; et al. Evaluation of exposure–response relationships for health effects of microbial bioaerosols—A systematic review. Int. J. Hyg. Environ. Health 2015, 218, 577–589. [Google Scholar] [CrossRef] [PubMed]
  6. Hebisch, R.; Linsel, G. Workers’ Exposure to Hazardous Substances and Biological Agents in Recycling Enterprises. Arbeitsplatzbelastung 2012, 72, 163–169. [Google Scholar]
  7. Schlosser, O.; Robert, S.; Noyon, N. Airborne Mycotoxins in Waste Recycling and Recovery Facilities: Occupational Exposure and Health Risk Assessment. Waste Manag. 2020, 105, 395–404. [Google Scholar] [CrossRef]
  8. Kozajda, A.; Jeżak, K.; Cyprowski, M.; Szadkowska-Stańczyk, I. Inhalable Dust, Endotoxins and (1-3)-Β-D-Glucans as Indicators of Exposure in Waste Sorting Plant Environment. Aerobiologia 2017, 33, 481–491. [Google Scholar] [CrossRef] [PubMed]
  9. Cyprowski, M.; Ławniczek-Wałczyk, A.; Górny, R.L. Occupational Exposure to Anaerobic Bacteria in a Waste Sorting Plant. J. Air Waste Manag. Assoc. 2021, 71, 1292–1302. [Google Scholar] [CrossRef]
  10. Duquenne, P.; Facon, B. Exposition Aux Bioaérosols Dans Les Centres De Tri Des Déchets Ménagers Recyclables. Hygiène Sécurité Trav. 2018, 252, 44–50. [Google Scholar]
  11. Lehtinen, J.; Tolvanen, O.; Nivukoski, U.; Veijanen, A.; Hänninen, K. Occupational Hygiene in Terms of Volatile Organic Compounds (Vocs) and Bioaerosols at Two Solid Waste Management Plants in Finland. Waste Manag. 2013, 33, 964–973. [Google Scholar] [CrossRef]
  12. Breum, N.O.; Würtz, H.; Midtgaard, U.; Ebbehøj, N. Dustiness and Bio-Aerosol Exposure in Sorting Recyclable Paper. Waste Manag. Res. 1999, 17, 100–108. [Google Scholar] [CrossRef]
  13. Madsen, A.M.; Frederiksen, M.W.; Mahmoud Kurdi, I.; Sommer, S.; Flensmark, E.; Tendal, K. Expanded cardboard waste sorting and occupational exposure to microbial species. Waste Manag. 2019, 87, 345–356. [Google Scholar] [CrossRef]
  14. Degois, J.; Clerc, F.; Simon, X.; Bontemps, C.; Leblond, P.; Duquenne, P. First metagenomic survey of the microbial diversity in bioaerosols emitted in waste sorting plants. Ann. Work. Expo. Health 2017, 61, 1076–1086. [Google Scholar] [CrossRef] [PubMed]
  15. Degois, J.; Simon, X.; Clerc, F.; Bontemps, C.; Leblond, P.; Duquenne, P. One-year follow-up of microbial diversity in bioaerosols emitted in a waste sorting plant in France. Waste Manag. 2021, 120, 257–268. [Google Scholar] [CrossRef] [PubMed]
  16. Bragoszewska, E. The dose of fungal aerosol inhaled by workers in a waste-sorting plant in Poland: A case study. Int. J. Environ. Res. Public Health 2020, 17, 10. [Google Scholar] [CrossRef] [PubMed]
  17. Bulski, K.; Frączek, K.; Chmiel, M. Microbiological air quality at municipal waste sorting plant. Environ. Prot. Nat. Resour. 2016, 27, 24–27. [Google Scholar] [CrossRef]
  18. Madsen, A.M.; Beswick, A.; Oppliger, A.; Kolk, A.; Crook, B.; Tendal, K.; Hinker, M.; Cyprowsky, M.; Raulf, M.; Duquenne, P.; et al. Occupational exposure to microorganisms as related to new waste sorting instructions—A PEROSH project. In Proceedings of the European OSH Symposium “Vision Zero in the Waste Industry”, Hamburg, Germany, 23–24 October 2019. [Google Scholar]
  19. Madsen, A.M.; Frederiksen, M.W.; Jacobsen, M.H.; Tendal, K. Towards a risk evaluation of workers’ exposure to handborne and airborne microbial species as exemplified with waste collection workers. Environ. Res. 2020, 183, 109177. [Google Scholar] [CrossRef] [PubMed]
  20. Cyprowski, M.; Stobnicka-Kupiec, A.; Górny, R.L.; Gołofit-Szymczak, M.; Ptak-Chmielewska, A.; Ławniczek-Wałczyk, A. Across-shift changes in upper airways after exposure to bacterial cell wall components. Ann. Agric. Environ. Med. 2019, 26, 236–241. [Google Scholar] [CrossRef] [PubMed]
  21. Viegas, S.; Osteresch, B.; Almeida, A.; Cramer, B.; Humpf, H.-U.; Viegas, C. Enniatin B and ochratoxin A in the blood serum of workers from the waste management setting. Mycotoxin Res. 2018, 34, 85–90. [Google Scholar] [CrossRef] [PubMed]
  22. Simon, X.; Duquenne, P. Assessment of workers’ exposure to bioaerosols in a french cheese factory. Ann. Occup. Hyg. 2014, 58, 677–692. [Google Scholar] [CrossRef]
  23. Görner, P.; Wrobel, R.; Simon, X. High efficiency CIP 10-I personal inhalable aerosol sampler. J. Phys. Conf. Ser. 2009, 151, 012061. [Google Scholar] [CrossRef]
  24. NF X 43-262; AFNOR. Air Quality—Workplace Air—Solid Aerosol Sampling with a Rotating Dish (Respirable, Thoracic and Inhalable Fractions). Normes Européennes: Occitanie, France, 2012.
  25. Simon, X.; Bau, S.; Boivin, A.; Duquenne, P.; Witschger, O.; Görner, P. Physical performances and kinetics of evaporation of the CIP 10-M Personal Sampler’s Rotating Cup Containing Aqueous or Viscous Collection Fluid. Aerosol Sci. Technol. 2016, 50, 507–520. [Google Scholar] [CrossRef]
  26. Burkart, J.; Steiner, G.; Reischl, G.; Moshammer, H.; Neuberger, M.; Hitzenberger, R. Characterizing the performance of two optical particle counters (Grimm OPC1.108 and OPC1.109) under urban aerosol conditions. J. Aerosol Sci. 2010, 41, 953–962. [Google Scholar] [CrossRef] [PubMed]
  27. Görner, P.; Simon, X.; Bémer, D.; Lidén, G. Workplace aerosol mass concentration measurement using optical particle counters. J. Environ. Monit. 2012, 14, 420–428. [Google Scholar] [CrossRef] [PubMed]
  28. Schloss, P.D.; Westcott, S.L.; Ryabin, T.; Hall, J.R.; Hartmann, M.; Hollister, E.B.; Lesniewski, R.A.; Oakley, B.B.; Parks, D.H.; Robinson, C.J.; et al. Introducing mothur: Open-source, platform-independent, community-supported software for describing and comparing microbial communities. Appl. Environ. Microbiol. 2009, 75, 7537–7541. [Google Scholar] [CrossRef] [PubMed]
  29. Duquenne, P.; Simon, X.; Koehler, V.; Goncalves-Machado, S.; Greff, G.; Nicot, T.; Poirot, P. Documentation of bioaerosol concentrations in an indoor composting facility in France. J. Environ. Monit. 2012, 14, 409–419. [Google Scholar] [CrossRef] [PubMed]
  30. Byeon, J.H.; Park, C.W.; Yoon, K.Y.; Park, J.H.; Hwang, J. Size distributions of total airborne particles and bioaerosols in a municipal composting facility. Bioresour. Technol. 2008, 99, 5150–5154. [Google Scholar] [CrossRef]
  31. Galès, A.; Bru-Adan, V.; Godon, J.-J.; Delabre, K.; Catala, P.; Ponthieux, A.; Chevallier, M.; Birot, E.; Steyer, J.-P.; Wéry, N. Predominance of single bacterial cells in composting bioaerosols. Atmos. Environ. 2015, 107, 225–232. [Google Scholar] [CrossRef]
  32. Wikuats, C.F.H.; Duarte, E.H.; Prates, K.V.M.C.; Janiaski, L.L.L.; de Oliveira Gabriel, B.; da Cunha Molina, A.; Martins, L.D. Assessment of airborne particles and bioaerosols concentrations in a waste recycling environment in Brazil. Sci. Rep. 2020, 10, 14812. [Google Scholar] [CrossRef]
  33. Tolvanen, O.K. Airborne bio-aerosols and noise in a dry waste treatment plant in Pietarsaari, Finland. Waste Manag. Res. 2001, 19, 108–114. [Google Scholar] [CrossRef] [PubMed]
  34. Hussein, T.; Hruška, A.; Dohányosová, P.; Džumbová, L.; Hemerka, J.; Kulmala, M.; Smolík, J. Deposition rates on smooth surfaces and coagulation of aerosol particles inside a test chamber. Atmos. Environ. 2009, 43, 905–914. [Google Scholar] [CrossRef]
  35. Tolvanen, O.K. Exposure to bioaerosols and noise at a Finnish dry waste treatment plant. Waste Manag. Res. 2004, 22, 346–357. [Google Scholar] [CrossRef]
  36. Karamkhani, M.; Asilian-Mahabadi, H.; Daraei, B.; Seidkhani-Nahal, A.; Noori-Zadeh, A. Liver and kidney serum profile abnormalities in workers exposed to aflatoxin B1 in urban solid waste management centers. Environ. Monit. Assess. 2020, 192, 472. [Google Scholar] [CrossRef]
  37. Marchand, G.; Lavoie, J.; Lazure, L. Evaluation of bioaerosols in a municipal solid waste recycling and composting plant. J. Air Waste Manag. Assoc. 1995, 45, 778–781. [Google Scholar] [CrossRef]
  38. Van Tongeren, M.; Van Amelsvoort, L.; Heederik, D. Exposure to organic dusts, endotoxins, and microorganisms in the municipal waste industry. Int. J. Occup. Environ. Health 1997, 3, 30–36. [Google Scholar] [CrossRef]
  39. Sigsgaard, T.; Malmros, P.; Nersting, L.; Petersen, C. Respiratory disorders and atopy in Danish refuse workers. Am. J. Respir. Crit. Care Med. 1994, 149, 1407–1412. [Google Scholar] [CrossRef] [PubMed]
  40. Lavoie, J.; Guertin, S. Evaluation of health and safety risks in municipal solid waste recycling plants. J. Air Waste Manag. Assoc. 2001, 51, 352–360. [Google Scholar] [CrossRef]
  41. Rahkonen, P.; Ettala, M.; Laukkanen, M.; Salkinoja-Salonen, M. Airborne microbes and endotoxins in the work Environment of two sanitary landfills in Finland. Aerosol Sci. Technol. 1990, 13, 505–513. [Google Scholar] [CrossRef]
  42. Nadal, M.; Inza, I.; Schuhmacher, M.; Figueras, M.J.; Domingo, J.L. Health risks of the occupational exposure to microbiological and chemical pollutants in a municipal waste organic fraction treatment plant. Int. J. Hyg. Environ. Health 2009, 212, 661–669. [Google Scholar] [CrossRef]
  43. Atalia, K.R.; Buha, D.M.; Joshi, J.J.; Shah, N.K. Microbial biodiversity of municipal solid waste of Ahmedabad. J. Mater. Environ. Sci. 2015, 6, 1914–1923. [Google Scholar]
  44. Gladding, T.L.; Gwyther, C.L. A study of the potential release of bioaerosols from containers as a result of reduced frequency residual waste collections. Sci. Total Environ. 2017, 576, 481–489. [Google Scholar] [CrossRef]
  45. Schlosser, O.; Déportes, I.Z.; Facon, B.; Fromont, E. Extension of the sorting instructions for household plastic packaging and changes in exposure to bioaerosols at materials recovery facilities. Waste Manag. 2015, 46, 47–55. [Google Scholar] [CrossRef]
  46. Viegas, C.; Gomes, A.Q.; Abegão, J.; Sabino, R.; Graça, T.; Viegas, S. Assessment of fungal contamination in waste sorting and incineration—Case study in portugal. J. Toxicol. Environ. Health Part A 2014, 77, 57–68. [Google Scholar] [CrossRef] [PubMed]
  47. Malta-Vacas, J.; Viegas, S.; Sabino, R.; Viegas, C. Fungal and microbial volatile organic compounds exposure assessment in a waste sorting plant. J. Toxicol. Environ. Health Part A 2012, 75, 1410–1417. [Google Scholar] [CrossRef]
  48. Černá, K.; Wittlingerová, Z.; Zimová, M.; Janovský, Z. Exposure to airborne fungi during sorting of recyclable plastics in waste treatment facilities. Med. Pr. 2017, 68, 1–9. [Google Scholar] [CrossRef] [PubMed]
  49. Duquenne, P. On the identification of culturable microorganisms for the assessment of biodiversity in bioaerosols. Ann. Work. Expo. Health 2018, 62, 139–146. [Google Scholar] [CrossRef]
  50. Mbareche, H.; Brisebois, E.; Veillette, M.; Duchaine, C. Bioaerosol sampling and detection methods based on molecular approaches: No pain no gain. Sci. Total Environ. 2017, 599, 2095–2104. [Google Scholar] [CrossRef] [PubMed]
  51. Viegas, C.; Caetano, L.A.; Cox, J.; Korkalainen, M.; Haines, S.R.; Dannemiller, K.C.; Viegas, S.; Reponen, T. The effects of waste sorting in environmental microbiome, THP-1 cell viability and inflammatory responses. Environ. Res. 2020, 185, 109450. [Google Scholar] [CrossRef] [PubMed]
  52. Madsen, A.M.; Raulf, M.; Duquenne, P.; Graff, P.; Cyprowski, M.; Beswick, A.; Laitinen, S.; Rasmussen, P.U.; Hinker, M.; Kolk, A.; et al. Review of biological risks associated with the collection of municipal wastes. Sci. Total Environ. 2021, 791, 148287. [Google Scholar] [CrossRef]
  53. Gunde-Cimerman, N.; Sonjak, S.; Zalar, P.; Frisvad, J.C.; Diderichsen, B.; Plemenitaš, A. Extremophilic fungi in arctic ice: A relationship between adaptation to low temperature and water activity. Phys. Chem. Earth Parts A/B/C 2003, 28, 1273–1278. [Google Scholar] [CrossRef]
  54. Das, M.K.L.; Prasad, J.S.; Ahmad, S.K. Endoglucanase production by paper-degrading mycoflora. Lett. Appl. Microbiol. 1997, 25, 313–315. [Google Scholar] [CrossRef]
  55. Zalar, P.; Sybren de Hoog, G.; Schroers, H.-J.; Frank, J.M.; Gunde-Cimerman, N. Taxonomy and phylogeny of the xerophilic genus Wallemia (Wallemiomycetes and Wallemiales, cl. et ord. nov.). Antonie Van Leeuwenhoek 2005, 87, 311–328. [Google Scholar] [CrossRef]
  56. Zajc, J.; Gunde-Cimerman, N. The genus Wallemia—From contamination of food to health threat. Microorganisms 2018, 6, 46. [Google Scholar] [CrossRef] [PubMed]
  57. Li, L.; Qiu, Y.; Gustafsson, Å.; Krais, A.M.; Weiss, J.M.; Lundh, T.; Bergman, Å. Characterization of residential household dust from Shanghai by particle size and analysis of organophosphorus flame retardants and metals. Environ. Sci. Eur. 2019, 31, 94. [Google Scholar] [CrossRef]
  58. Zeng, Q.; Westermark, S.; Rasmuson-Lestander, A.; Wang, X. Detection and quantification of Wallemia sebi in aerosols by real-time PCR, conventional PCR, and cultivation. Appl. Environ. Microbiol. 2004, 70, 7295–7302. [Google Scholar] [CrossRef] [PubMed]
  59. Fröhlich-Nowoisky, J.; Pickersgill, D.A.; Després, V.R.; Pöschl, U. High diversity of fungi in air particulate matter. Proc. Natl. Acad. Sci. USA 2009, 106, 12814–12819. [Google Scholar] [CrossRef] [PubMed]
  60. Bowers, R.M.; McCubbin, I.B.; Hallar, A.G.; Fierer, N. Seasonal variability in airborne bacterial communities at a high-elevation site. Atmos. Environ. 2012, 50, 41–49. [Google Scholar] [CrossRef]
  61. Kumari, P.; Woo, C.; Yamamoto, N.; Choi, H.-L. Variations in abundance, diversity and community composition of airborne fungi in swine houses across seasons. Sci. Rep. 2016, 6, 37929. [Google Scholar] [CrossRef] [PubMed]
  62. Nehme, B.; Gilbert, Y.; Letourneau, V.; Forster, R.J.; Veillette, M.; Villemur, R.; Duchaine, C. Culture-independent characterization of Archaeal biodiversity in swine confinement building bioaerosols. Appl. Environ. Microbiol. 2009, 75, 5445–5450. [Google Scholar] [CrossRef] [PubMed]
  63. Brągoszewska, E. Exposure to Bacterial and Fungal Aerosols: Microorganism Indices in A Waste-Sorting Plant in Poland. Int. J. Environ. Res. Public Health 2019, 16, 3308. [Google Scholar] [CrossRef]
  64. Clauß, M. Particle size distribution of airborne microorganisms in the environment—A review. Landbauforsch Appl. Agric. For. Res. 2015, 65, 77–100. [Google Scholar] [CrossRef]
  65. Sturm, R. Modeling the deposition of bioaerosols with variable size and shape in the human respiratory tract—A review. J. Adv. Res. 2012, 3, 295–304. [Google Scholar] [CrossRef]
  66. Hofmann, W. Modelling inhaled particle deposition in the human lung—A review. J. Aerosol Sci. 2011, 42, 693–724. [Google Scholar] [CrossRef]
  67. Krajewski, J.A.; Tarkowski, S.; Cyprowski, M.; Szarapińska-Kwaszewska, J.; Dudkiewicz, B. Occupational exposure to organic dust associated with municipal waste collection and management. Int. J. Occup. Med. Env. Health 2002, 15, 289–301. [Google Scholar]
  68. Gladding, T.; Thorn, J.; Stott, D. Organic dust exposure and work-related effects among recycling workers. Am. J. Ind. Med. 2003, 43, 584–591. [Google Scholar] [CrossRef] [PubMed]
  69. Park, D.-U.; Ryu, S.-H.; Kim, S.-B.; Yoon, C.-S. An assessment of dust, endotoxin, and microorganism exposure during waste collection and sorting. J. Air Waste Manag. Assoc. 2011, 61, 461–468. [Google Scholar] [CrossRef] [PubMed]
  70. Guillou, P.; Brunet, D.; Rousselle, C.; Binet, S. Recommandation de l’Anses en vue de la révision des valeurs limites d’exposition professionnelle (VLEP) pour les poussières dites sans effet spécifique (PSES). Arch. Mal. Prof. L’environnement 2020, 81, 676–677. [Google Scholar] [CrossRef]
  71. Mandal, J.; Brandl, H. Bioaerosols in indoor environment—A review with special reference to residential and occupational locations. Open Environ. Biol. Monit. J. 2011, 4, 83–96. [Google Scholar] [CrossRef]
  72. SUVA (Schweizerische Unfallversicherungsanstalt). Valeurs Limites D’exposition Aux Postes de Travail 2015, edition 2015; Référence 1903.f; SUVA: Luzern, Switzerland, 2024; Available online: http://www.suva.ch (accessed on 2 February 2024).
  73. Arbeit und Soziales im Gemeinsamen Ministerialblatt. Trba (Technische Regel für Biologische Arbeitsstoffe) 214—Abfallbehandlungsanlagen. In Technische Regeln für Biologische Arbeitsstoffe; Federal Institute for Occupational Safety and Health (BAuA): Dortmund, Germany, 2013; pp. S978–S989. [Google Scholar]
  74. David, C.; Emili, A.; Alonso, L.; Loison, P.; Mater, G.; Duquenne, P.; Cheron, J.; Durand-Billaud, E.; Facon, B.; Renevot, V.; et al. Valeurs guides bactéries et moisissures: Interprétation des résultats de métrologie des bioaérosols. Hygiène Sécurité Trav. 2023, 271, 55–63. [Google Scholar]
  75. Eduard, W. A health-based criteria document on fungal spore exposure in the working population. Is it relevant for the general population? Indoor Air 2008, 18, 257–258. [Google Scholar] [CrossRef] [PubMed]
  76. Rouzaud, P.; Soulat, J.M.; Trela, C.; Fraysse, P.; Recco, P.; Carles, P.; Lauque, D. Symptoms and serum precipitins in workers exposed to dry sausage mould: Consequences of exposure to sausage mould. Int. Arch. Occup. Environ. Health 2001, 74, 371–374. [Google Scholar]
  77. Winck, J.C.; Delgado, L.; Murta, R.; Lopez, M.; Marques, J.A. Antigen characterization of major cork moulds in Suberosis (cork worker’s pneumonitis) by immunoblotting. Allergy 2004, 59, 739–745. [Google Scholar] [CrossRef]
  78. Latge, J.-P. Aspergillus fumigatus and Aspergillosis. Clin. Microbiol. Rev. 1999, 12, 310–350. [Google Scholar] [CrossRef] [PubMed]
  79. Russell, K.; Broadbridge, C.; Murray, S.; Waghorn, D.; Mahoney, A. Gardening can seriously damage your health. Lancet 2008, 371, 2056. [Google Scholar] [CrossRef] [PubMed]
  80. Knutsen, A.P.; Bush, R.K.; Demain, J.G.; Denning, D.W.; Dixit, A.; Fairs, A.; Greenberger, P.A.; Kariuki, B.; Kita, H.; Kurup, V.P.; et al. Fungi and allergic lower respiratory tract diseases. J. Allergy Clin. Immunol. 2012, 129, 280–291. [Google Scholar] [CrossRef]
  81. Jančič, S.; Zalar, P.; Kocev, D.; Schroers, H.-J.; Džeroski, S.; Gunde-Cimerman, N. Halophily reloaded: New insights into the extremophilic life-style of Wallemia with the description of Wallemia hederae sp. nov. Fungal Divers. 2016, 76, 97–118. [Google Scholar] [CrossRef]
  82. Weber, R.W. Allergen of the Month—Mucor. Ann. Allergy Asthma Immunol. 2015, 115, A15. [Google Scholar] [CrossRef] [PubMed]
  83. Rydjord, B.; Eduard, W.; Stensby, B.; Sandven, P.; Michaelsen, T.E.; Wiker, H.G. Antibody response to long-term and high-dose mould-exposed sawmill workers. Scand. J. Immunol. 2007, 66, 711–718. [Google Scholar] [CrossRef] [PubMed]
  84. Quirce, S.; Vandenplas, O.; Campo, P.; Cruz, M.J.; de Blay, F.; Koschel, D.; Moscato, G.; Pala, G.; Raulf, M.; Sastre, J.; et al. Occupational hypersensitivity pneumonitis: An EAACI position paper. Allergy 2016, 71, 765–779. [Google Scholar] [CrossRef] [PubMed]
  85. Egbuta, M.A.; Mwanza, M.; Babalola, O.O. Health Risks Associated with Exposure to Filamentous Fungi. Int. J. Environ. Res. Public Health 2017, 14, 719. [Google Scholar] [CrossRef] [PubMed]
  86. Burzoni, S.; Duquenne, P.; Mater, G.; Ferrari, L. Workplace biological risk assessment: Review of existing and description of a comprehensive approach. Atmosphere 2020, 11, 741. [Google Scholar] [CrossRef]
  87. Madsen, A.M.; Alwan, T.; Ørberg, A.; Uhrbrand, K.; Jørgensen, M.B. Waste workers’ exposure to airborne fungal and bacterial species in the truck cab and during waste collection. Ann. Occup. Hyg. 2016, 60, 651–668. [Google Scholar] [CrossRef]
  88. Schlosser, O.; Huyard, A.; Rybacki, D.; Do Quang, Z. Protection of the vehicle cab environment against bacteria, fungi and endotoxins in composting facilities. Waste Manag. 2012, 32, 1106–1115. [Google Scholar] [CrossRef] [PubMed]
  89. Viegas, C.; Faria, T.; de Oliveira, A.C.; Caetano, L.A.; Carolino, E.; Quintal-Gomes, A.; Twaruzek, M.; Kosicki, R.; Soszczynska, E.; Viegas, S. A new approach to assess occupational exposure to airborne fungal contamination and mycotoxins of forklift drivers in waste sorting facilities. Mycotoxin Res. 2017, 33, 285–295. [Google Scholar] [CrossRef] [PubMed]
Figure 1. Organization of the different working areas in the investigated HWSP. A network of conveyor belts that do not appear on the plan connects the different production areas of the company. The numbers circled in black, from 1 to 11, indicate the location of sampling points dedicated to the ambient measurements. DRHW: dry recyclable household waste; DRCIW: dry recyclable commercial and industrial waste; hollow waste: cardboard boxes for packaging, steel, and aluminum metal packaging (metals beverage can and tins), plastic bottles and flasks, as well as food bricks; flat waste: paper, magazines, newspapers, and other flat waste (flattened paper and small cardboard packaging).
Atmosphere 15 00461 g001
Figure 2. Schematic representation of the workflow for waste sorting in the WSP. Hollow waste: cardboard boxes for packaging, steel and aluminum metal packaging (metal beverage cans and tins), plastic bottles and flasks, as well as food bricks; Flat waste: paper, magazines, newspapers, and other flat waste (flattened paper and small cardboard packaging). Additional information is provided in the Supplemental Material “Comment C1”.
Atmosphere 15 00461 g002
Figure 3. Evolution of the number concentration of airborne particles (Grimm 1.109; optical diameters < 1 µm and ≥1 µm) over time in sorting cabin A and close to the manual sorting activity. Stationary measurements were carried out on days D3 and D4. The end of the work shift is D3 at around 7:30 p.m., and the start of work is D4 at around 5 a.m.
Atmosphere 15 00461 g003
Figure 4. Results from stationary measurements of airborne culturable fungi in the different working areas of the WSP.
Atmosphere 15 00461 g004
Figure 5. Results from the measurements of the personal exposure of workers to airborne culturable fungi during different tasks.
Atmosphere 15 00461 g005
Figure 6. Results from measurements of airborne inhalable dust in the WSP with the CIP 10-I inhalable sampler. (A) Stationary measurements in the different working areas; (B) personal exposure of workers during different tasks.
Atmosphere 15 00461 g006
Figure 7. Fungal biodiversity (relative abundance color scale, in %) at the genus rank in bioaerosol and settled dust samples collected in the WSP.
Atmosphere 15 00461 g007
Figure 8. Example of the size distribution of airborne culturable fungi in the WSP. Samples were collected using a Marple Cascade impactor in sorting cabin A (cardboard) on day D3 and in sorting cabin B (hollow waste) on day D4.
Atmosphere 15 00461 g008
Table 1. Eucaryota biodiversity data for the bioaerosol and dust samples collected in the WSP.
Sampling PointNumber of SamplesReads Number *OTUs Number **Shannon Index **Simpson Index **
Unloading area DHRW37566 (2.8)376 (46–422)4.02 (1.54–4.17)0.05 (0.05–0.4)
Sorting cabin A415,227 (1.6)42 (38–436)1.30 (1.30–3.89)0.4 (0.06–0.5)
Sorting cabin B311,242 (1.5)271 (31–316)3.75 (1.48–3.98)0.07 (0.05–0.4)
Sorting cabin C35115 (1.5)248 (51–324)4.36 (2.80–4.39)0.04 (0.03–0.09)
Hollow waste area45573 (4.3)157 (39–330)1.73 (1.35–4.09)0.4 (0.3–0.4)
Unloading area DRCIW36276 (1.8)43 (40–46)2.340.2 (0.05–0.2)
Indoor reference12211673.030.09
Outdoor reference26282 (1.1)15–2861.83–4.120.05–0.2
Settled dust110,015651.790.3
* Geometric mean (geometric standard deviation factor); ** median (min–max values).
Disclaimer/Publisher’s Note: The statements, opinions and data contained in all publications are solely those of the individual author(s) and contributor(s) and not of MDPI and/or the editor(s). MDPI and/or the editor(s) disclaim responsibility for any injury to people or property resulting from any ideas, methods, instructions or products referred to in the content.

