1. Introduction
Snow plays a crucial role in surface radiation, energy cycling, and water cycling [
1]. In northern regions, it has a direct impact on ecology, production, and social activities [
2,
3,
4,
5]. In pastoral areas of northern China, winter snow depth and snow cover area are generally large, and the snow layer persists for a long time [
6]. Although excessive snow can have disastrous effects on livestock production [
7], meltwater from snow can improve ecological conditions of the grazing environment [
8]. Therefore, the study of snowmelt processes and their influencing factors is not only a focal point of scientific research but also an area of concern for ecological and socio-economic development. This field provides key insights and support for understanding the characteristics and patterns of snowmelt processes in different regions and achieving quantitative predictions and forecasting of snowmelt.
Seasonal snowmelt is a complex process, and its impacts vary by spatial and temporal scale and a number of influencing factors [
9,
10,
11]. Studies on snow depth trends in North America indicate a continuous acceleration of snow depth reduction from late January to April, attributed to changes in surface temperature [
12,
13]. This highlights the importance of ground temperature in this process. Li et al. [
14] used daily average temperature and precipitation data from eight meteorological stations in the mountainous areas of Northwest China to study their relationship with snowmelt, finding that temperature factors have a strong influence on the snowmelt process. On the Shiyi Glacier, atmospheric dust accelerates the speed of snowmelt [
15]. He [
16] and colleagues found that the influence of temperature on snow melting becomes more pronounced with increasing altitude at Baishui Glacier No. 1. In the Svalbard region, rain-on-snow events significantly affect the structure and melting rate of the snow cover [
17].
Furthermore, the interaction of energy on the snow surface is critical for snowmelt [
18], with the sublimation of snow caused by solar radiation and the accumulation of dry snow by strong winds being areas of research worth attention [
19]. Solar radiation influences the snow melting process by altering the heat flux of the snow layer [
20]. Additionally, the complex interplay of solar radiation also significantly affects snow melting due to its impact on liquid water content and porosity [
21].
The influence of meteorological factors on evaporation, sublimation, and melting of snow varies across different snow regions in China [
22]. In studies of snowmelt processes in the Tian Shan mountain region of Chian, a linear correlation has been found between temperature and snow depth [
23]. The 5 cm ground temperature is the threshold influencing snow depth change [
24] and density. Winter snow water equivalents are mainly influenced by factors such as November snow water equivalents, winter snowfall, and snow loss. The weight of influencing factors on winter snow water equivalents differ slightly among regions [
22]. This indicates that there are clear differences in the characteristics of winter and spring snowmelt processes and regional dynamics. In the study of dynamic snowmelt processes in grasslands, Sang Jing et al. [
24] analyzed snowmelt processes that occurred in E’erguna, China using snow depth observation data and concurrent meteorological records. They found that the magnitude of local snow depth changes depends primarily on the temperature conditions in the previous hour. Although there has been in-depth analysis of snow and meteorological factors in the E’erguna region, a comprehensive analysis of the correlation between snow and temperature, as well as a lack of regional representation due to single-station data, results in a deficiency in the overall relationship analysis.
Most existing research is based on daily snow depth data from manual observations at meteorological stations. Due to the lack of continuous and high-frequency snow depth data, our ability to analyze and understand continuous snowmelt processes and key influencing factors have been constrained. Indeed, it is difficult to explore the detailed relationship between snowmelt processes and meteorological conditions at an hourly time scale.
In 2020, a new batch of automatic snow depth observation instruments were installed by Inner Mongolia’s meteorological department, providing up-to-date hourly snow depth observation data. This has provided a valuable opportunity to analyze the dynamic snowmelt changes in a variable field setting [
25].
We gathered hourly meteorological and snowmelt data from an automatic snow depth observation station in the Hulunbuir grassland area of Inner Mongolia. Building on the analysis of dynamic daily variation in snow depth and corresponding relationships with meteorological factors, we explored what influences high-frequency dynamic snowmelt processes. Our study aims to provide a direct basis for a more accurate understanding of the dynamic patterns of snowmelt and dynamic predictions in northern grassland regions.
2. Methods
2.1. Study Area
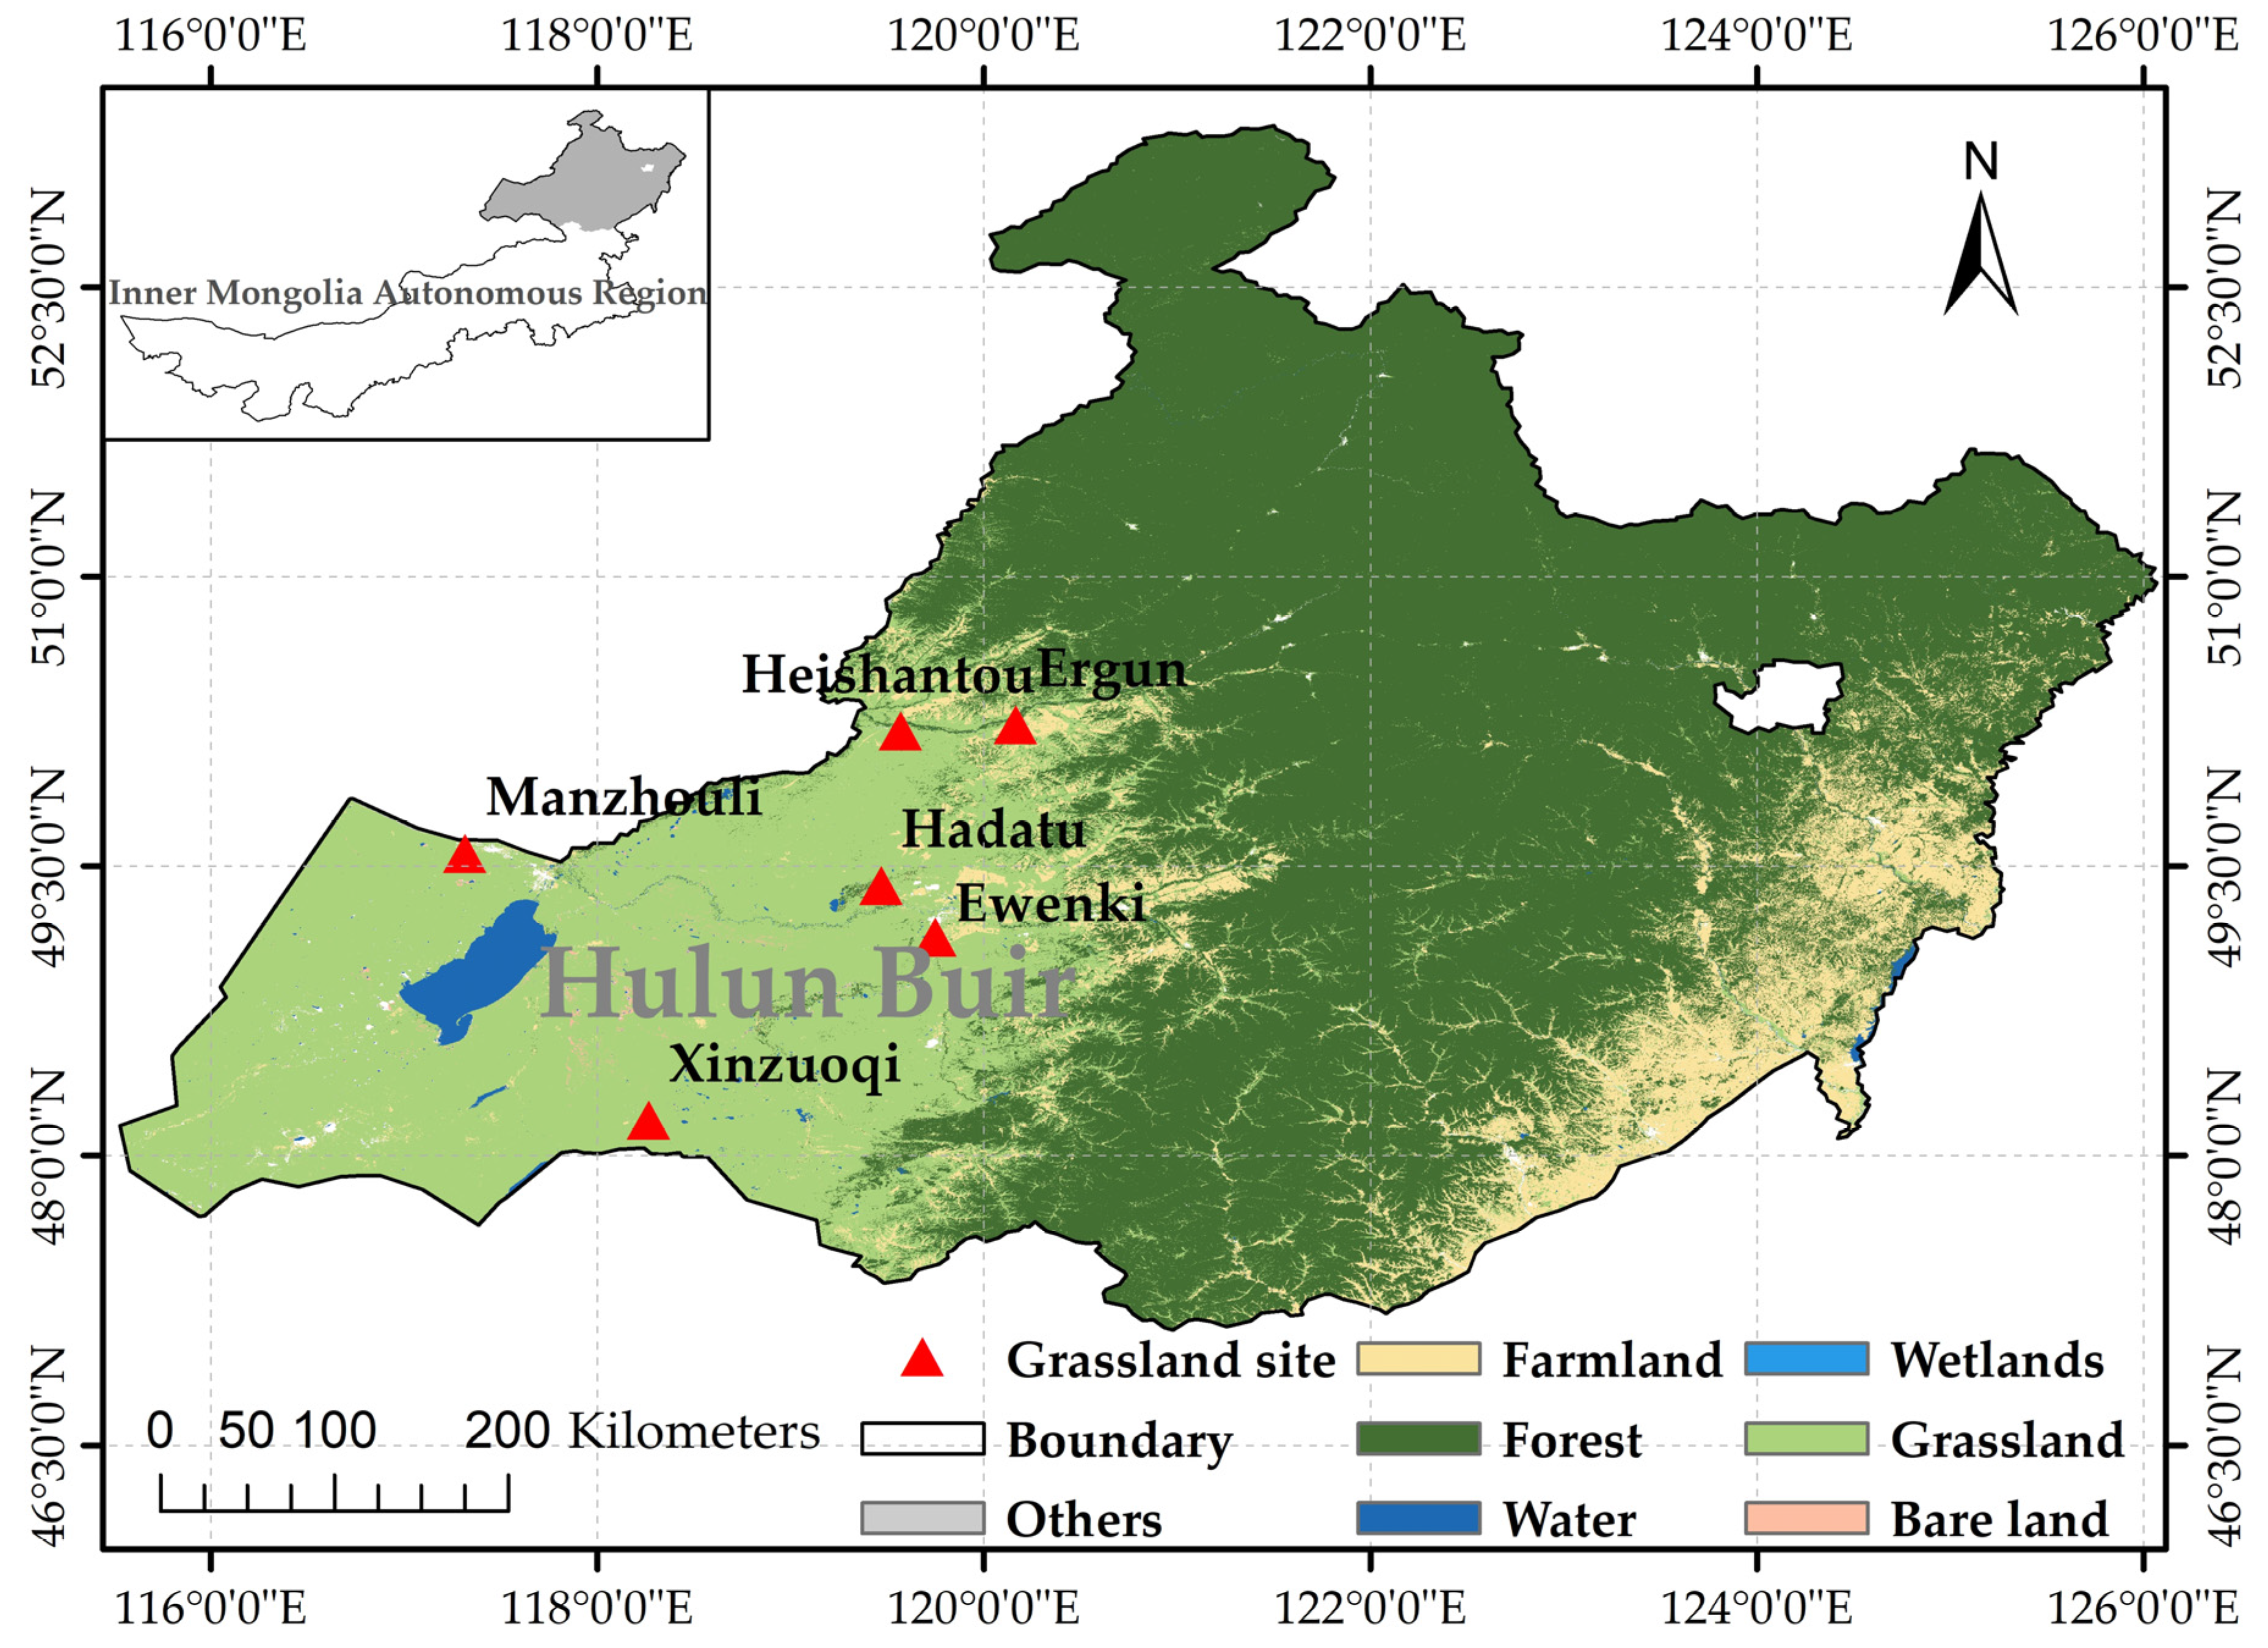
Hulun Buir City is located in the northeastern part of China, between 115°31′–126°04′ E longitude and 47°05′–53°20′ N latitude, in the mid-to-high latitude region of Northeast China (
Figure 1). The terrain generally slopes from west to east, and the climate and vegetation types are influenced by the Greater Khingan mountain range. To the west of the range lies the largest grassland area in China, covering an area of 112,825.56 square kilometers. It has a climate typical of continental regions, with an annual precipitation ranging from 300 to 500 mm, cold winters, and significant temperature variations between day and night, particularly in the winter months.
Because of this climate, the Hulun Buir region typically experiences heavy snowfall, thick snow cover, large snow-covered areas, and long-lasting snow layers. The duration of snow cover in different parts of the region ranges from 90 to 164 days, with snow depths ranging from 10 to 35 cm [
26]. These characteristics make it an ideal area for studying snow dynamics.
2.2. Hourly Snow Depth Measures
Hourly snow depth observation data in the field were collected from automatic snow depth measurement instruments installed in the grassland area meteorological stations. The snow depth data were measured by an SR50A ultrasonic snow depth sensor (Campbell Scientific, Logan, UT, USA), and a DSJ1 automatic ultrasonic snow depth observation instrument (HUAYUN SOUNDING, Beijing, China). Since the DSJ1 instrument’s snow depth ultrasonic probe is equipped with the same sensor as the SR50A, the parameters and data accuracy of the two instruments are consistent, and they can be considered as data from the same source.
Both instruments have a measurement range of 0–2000 mm, a maximum observation frequency of 10 min, an observation accuracy of ±1 cm or 0.4%, an observation resolution of 0.25 mm, and a working temperature range of −45 °C to 50 °C. These instruments have been widely applied and validated both domestically and internationally. They are suitable for field deployment and demonstrate high stability and data reliability, especially in cold regions [
27].
We collected from six field snow depth observation stations located in the Hulunbuir grassland area (
Figure 1) from 1 January 2020, to 31 May 2022. Snow depth was uniformly measured by the SR50A or DSJ1 instruments at hourly intervals, resulting in one snow depth observation value per hour. In total, 24 snow depth observations were gathered each day from each station, forming a continuous hourly snow depth data series throughout the snow cover period.
2.3. Meteorological Data
Synchronized meteorological data were collected along with the snow depth observation data series. Hourly meteorological data for six cities and banners (districts) were collected from 1 January 2020, to 31 May 2022. Observation stations were located at Ergun (120.17° E, 50.23° N), Manzhouli (117.32° E, 49.57° N), Ewenki Autonomous Banner (119.75° E, 49.13° N), Heishantou (119.57° E, 50.20° N), Hadatu (119.47° E, 49.40° N), and Xinbarag Left Banner (118.27° E, 48.18° N). The meteorological data collected included hourly air temperature (Ta), 0 cm soil temperature (T0 cm), 5 cm soil temperature (T5 cm), 10 cm soil temperature (T10 cm), snow surface temperature (Ts), relative humidity (RH), sunshine duration (h), and wind speed (W). These were analyzed to determine their effect on snow depth variation.
2.4. Data Quality Control
Due to external environmental factors and instrument voltage fluctuations, the field observations of snow depth may exhibit some instability and data fluctuations [
28,
29]. To ensure the accuracy and reliability of the observation data, a quality check was performed on the original snow depth data. Outliers that showed obvious abnormalities in the time series were removed, and a five-point smoothing technique was applied to all the original data series to reduce noise. This process resulted in a snow depth data series free of noise and with strict quality control.
2.5. Correlation Analysis
We determined the influence and response relationship between snowmelt and meteorological factors using a Pearson linear correlation analysis [
30]:
where
X is the observed value,
is the average value of the meteorological factors,
Y is the observed snow depth and
is the average value of snow depth, and
M is the number of days in the focal snowmelt period.
To account for the potential time lag effect of thermal conditions and snowmelt process, a 12 h lead correlation coefficient was factored into the correlation between meteorological factors and snow depth. The correlation coefficient was calculated between the current snow depth and the hourly meteorological factors within the preceding 12 h. The impact relationship at different time lags was compared by examining the magnitude of the correlation coefficients.
2.6. Hourly Temperature Difference and Cumulative Temperature Difference
The snow melting process reflects both the influence of instantaneous and cumulative heat effects. Therefore, we included the hourly temperature change and cumulative temperature to determine the relationship between snow depth change and synchronous and cumulative heat conditions. The formula for calculating the hourly temperature change (Δ
T) is
where
i is the hourly time step within a day (
i = 0, 1, 2, …, 23),
is the temperature change between the
i-th hour and the previous hour, and
is the temperature at the
i-th hour.
is the temperature value at 0:00 of the focal day, obtained by subtracting the temperature at 23:00 of the previous day from the temperature value at 0:00.
Cumulative heat accumulation among time intervals within a day is represented by the term “
”, calculated as
where
i is a specific moment for temperature difference calculation (i = 0, 1, 2, …, 23),
j is the hourly time interval from 0:00 to 23:00 within a day,
is the cumulative sum of temperature differences within the first
i hours, and
is the temperature change at the
jth hour, with
equal to
at 0:00.
2.7. Dominant Factor Selection
Due to potentially high autocorrelations among temperature factors among time intervals resulting in multicollinearity among independent variables, it is challenging to determine the dominant factors influencing snow depth change. To address this, we used stepwise regression, introducing significantly correlated factors as independent variables into the regression steps. With the significance of the partial correlation between independent variables and snow depth, as well as using factor inclusion and elimination during the stepwise regression, our aim was to eliminate multicollinearity among variables while identifying the dominant driving factors of snow depth change.
3. Results
3.1. Snow Accumulation and Melting
During the study period, there were 18 significant snow accumulation events lasting more than 10 days. We selected 10 snowfall events where the snow cover lasted for more than 5 days for analysis. Due to limitations in space and missing data, we present the results based on six representative snow accumulation events from the Ewenki, Manzhouli, and Xinzuoqi stations that occurred for >5 days in both years.
3.2. Temporal Variation of Snow Accumulation
Within our temporal (2021, 2022) and spatial (six stations) collection criteria, we extracted and smoothed hourly snow depth data from 0:00 to 23:00 during the rapid snowmelt phase. We found relatively long-lasting snow accumulation events for analysis.
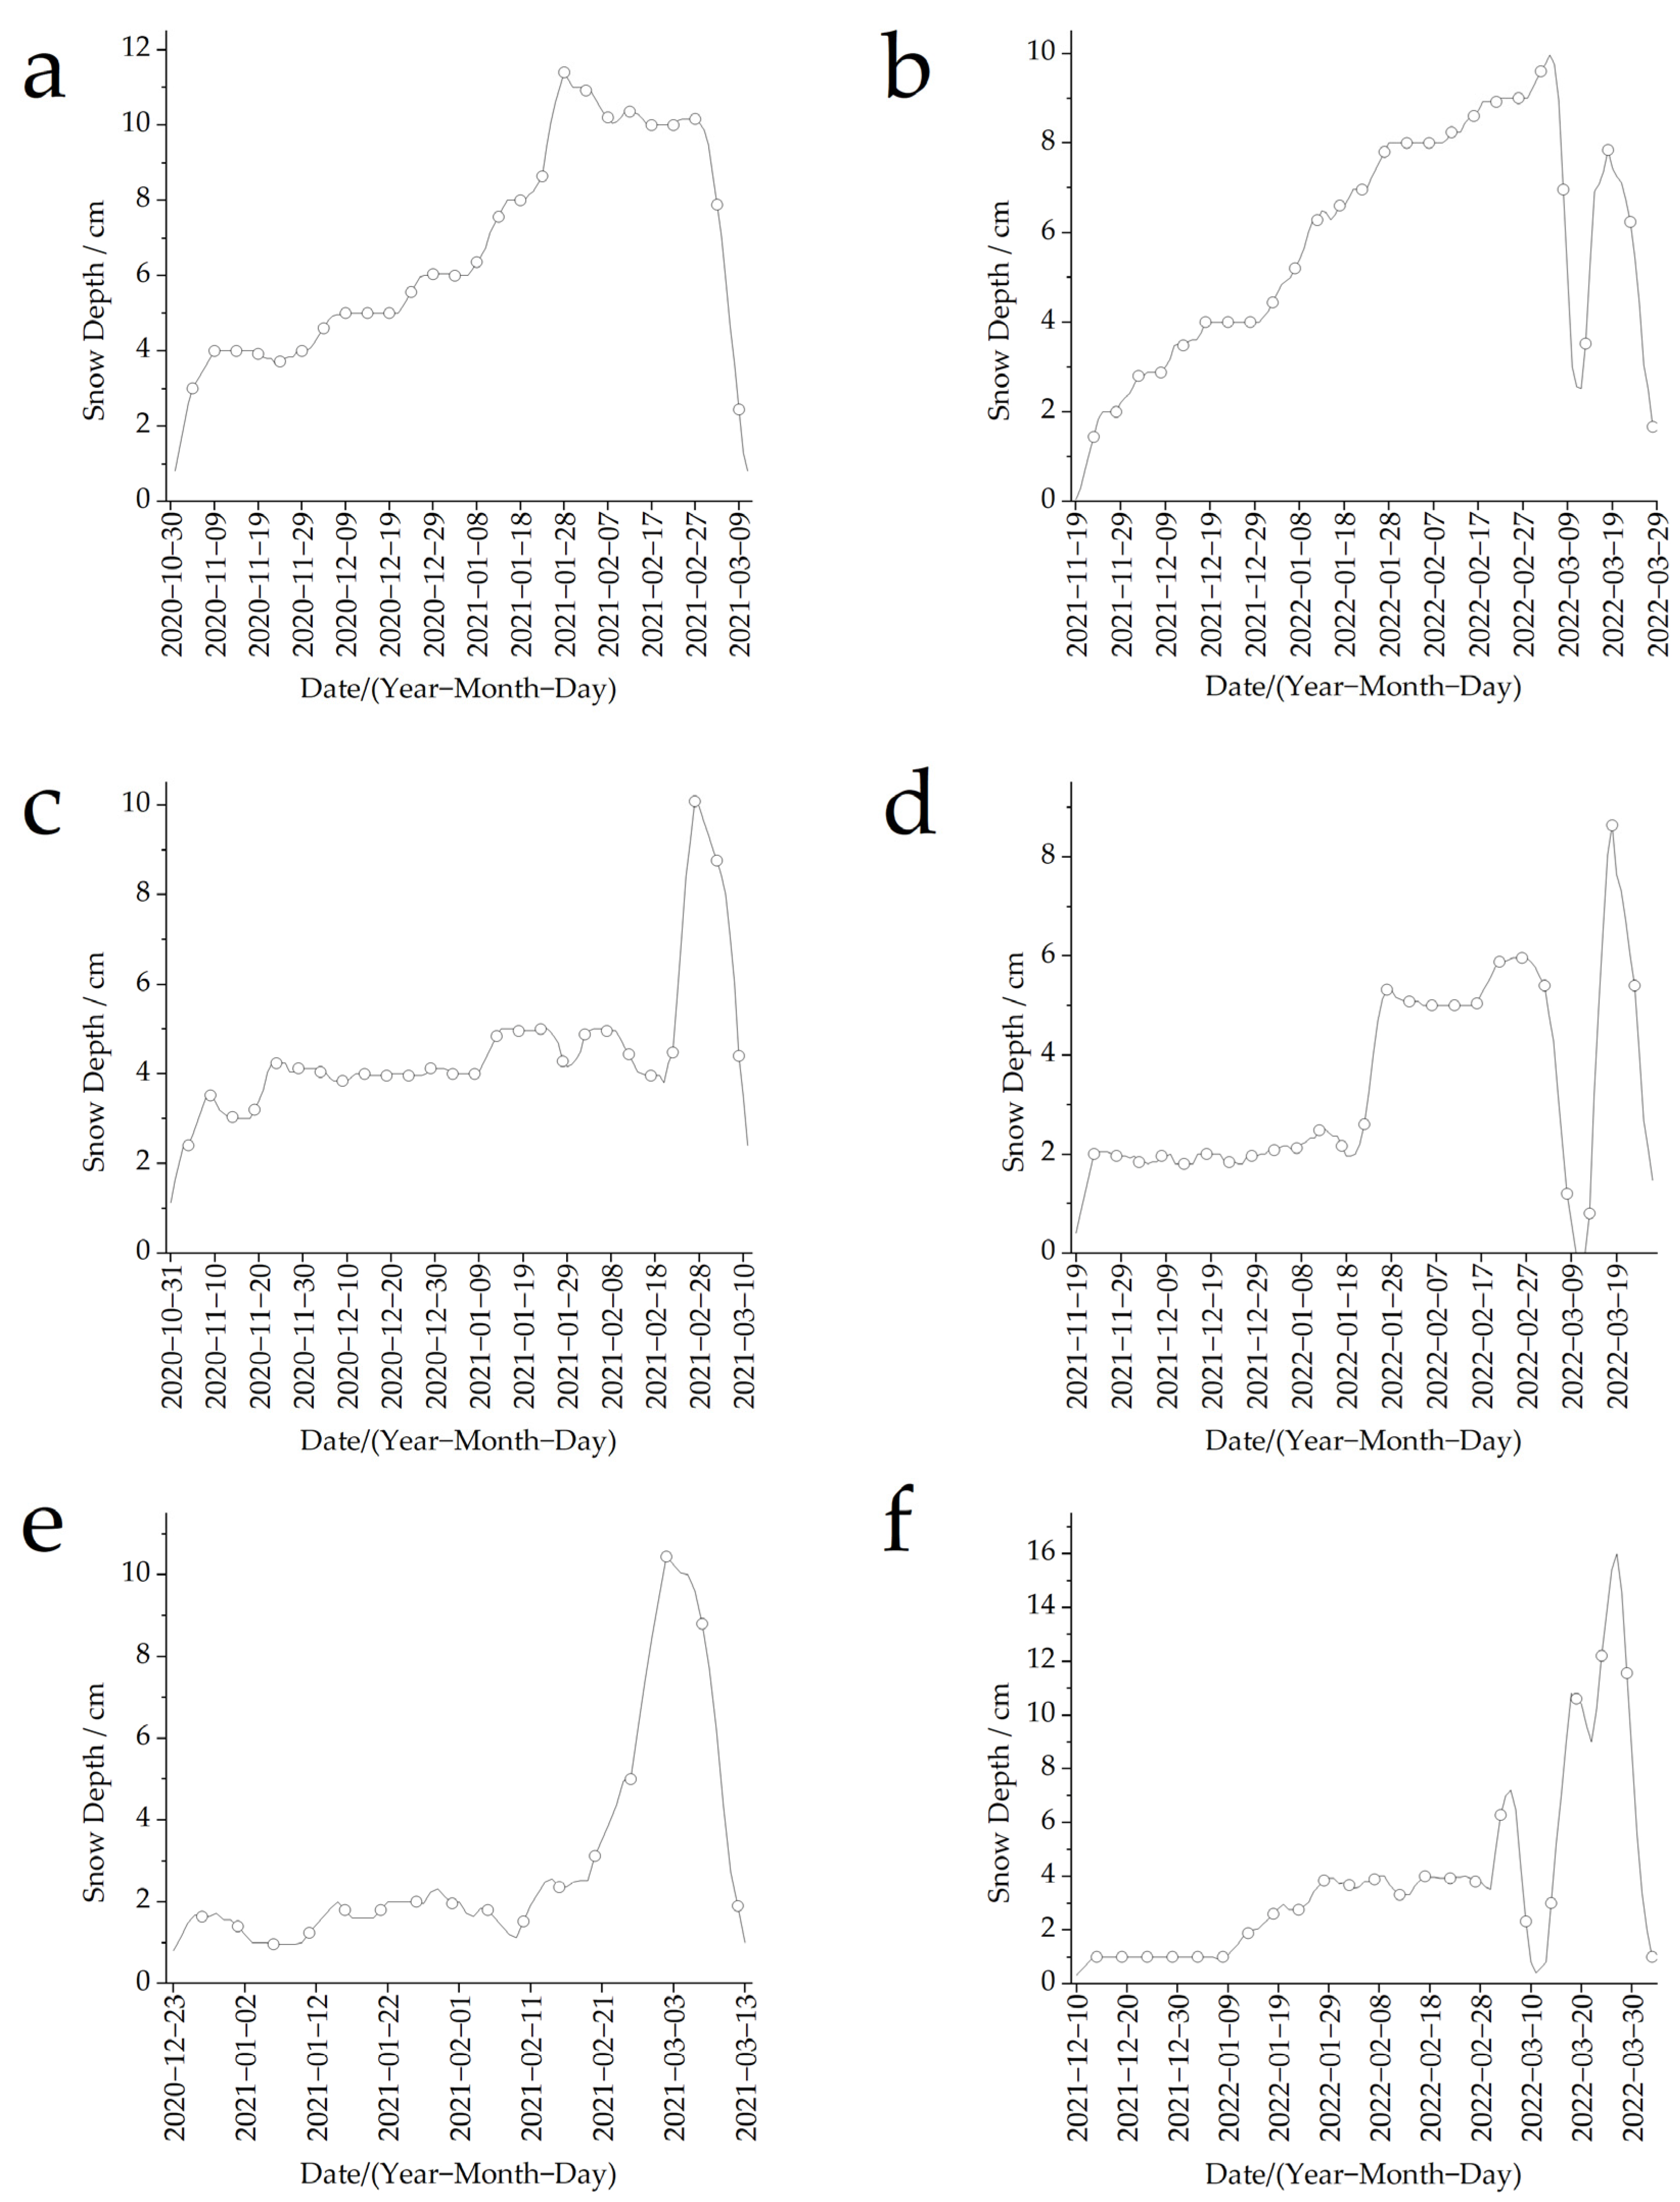
The snowmelt data sequences at each station indicate that the cumulative snowfall and snow cover usually start as early as late October, with most stations achieving stable snow cover after November. Generally, the snowmelt period begins in mid-to-late March, but there can be significant fluctuations in snow cover and depth. However, even after the spring snowmelt, there can be occurrences of significant snowfall and snow accumulation. For example, at the Xinzuoqi station, after complete snowmelt in spring 2022, three significant snowfall events were recorded (12, 15, 24 March) resulting in complete snowmelt occurring on 1 April (
Figure 2f).
Although the snow accumulation period is longer during autumn and winter, the snow depth is relatively small. From October of the previous year to mid-February of the current year, snow depth generally remained below 10 cm. However, from mid-February onward, the region experienced increased precipitation, occasionally leading to blizzard conditions [
31]. During this time, temperatures often remain below 0 °C, and the snow depth can exceed 10 cm, persisting for several days in most areas. Overall, while there are typically about four months of snow accumulation during the winter, the snow depth during autumn and winter is generally small. Snow tends to be thicker during late winter and early spring.
We observed that during the winter, snow cover in northern grasslands at middle and high latitudes can be stable for approximately 80–134 days. The snow accumulation process can be divided into three stages: development, maintenance, and melting. From the two years of continuous observation data, we found that the snow maintenance stage lasts approximately 75–125 days, during which the depth remains above 2 cm, with most areas maintaining a depth of at least 4 cm for most of that time. Each year, the maximum snow depth in each area exceeded 10 cm and persisted for at least 10 days, with snow cover at some stations lasting around 60 days (
Figure 2a).
The smoothed daily snow depth curves at 0:00 during the two-year long snow cover period (
Figure 2) reveal slight differences in snow accumulation between years. In 2021, the snow cover persisted for longer, with only one extended snow cover event lasting up to 130 days (
Figure 2a). In 2022, there was a significant, rapid snow melting event on March 5 leading to complete snowmelt at some stations (
Figure 2d,f). Subsequently, another prolonged snow cover event lasting 20 days occurred before the snow completely melted in April.
Rapid snow melting periods generally occurred in early to mid-March during spring. During this period, snow depth can rapidly decrease from over 10 cm to 0 cm within a few days. In most regions, these rapid melting periods typically lasted for 5–12 days, with daily snowmelt averaging at least 2 cm. In some areas, the daily snowmelt reached 4–6 cm, resulting in complete snowmelt within 5 days. The speed and characteristics of the snow melting process were directly related to the climate and thermal conditions during the snowmelt period. These factors are crucial for predicting and forecasting snowmelt processes.
3.3. Daily Snowmelt Patterns
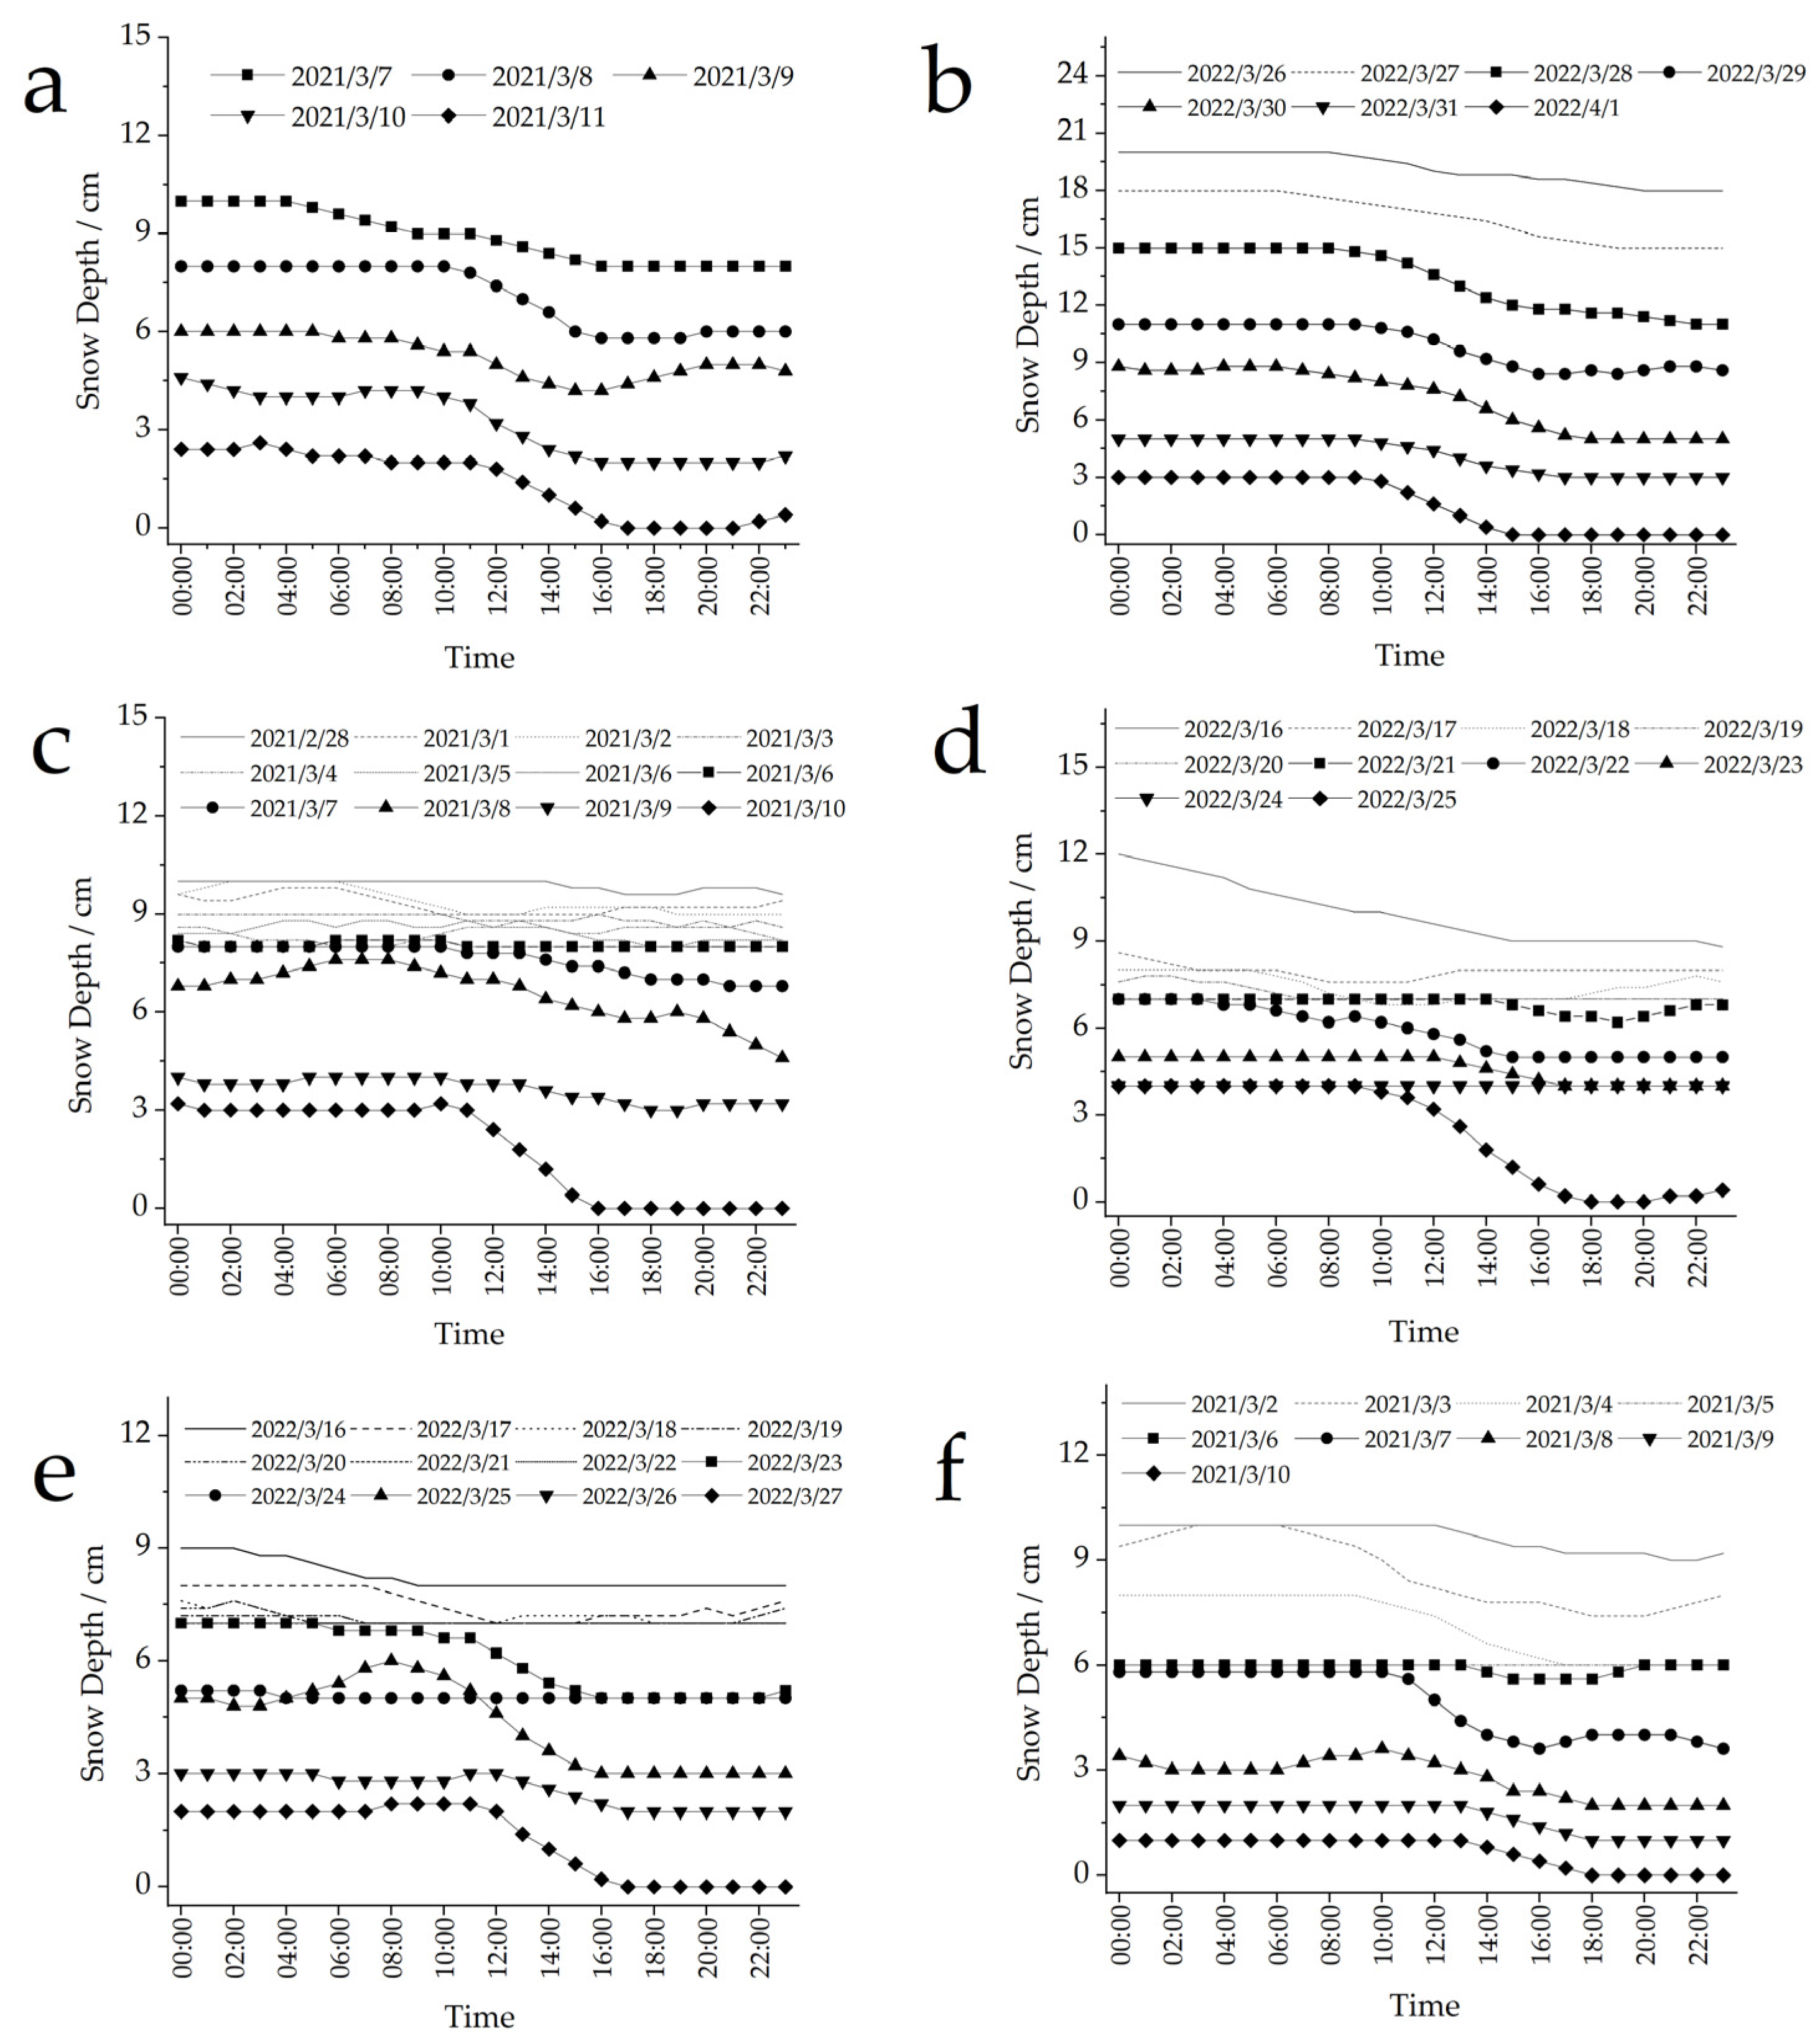
To analyze dynamic changes in snow depth during the rapid melting phase of the snowmelt period more clearly, hourly snow depth data from 0:00 to 23:00 each day were extracted when snow depth commenced the rapid melting stage at each station. In this study, six snowmelt processes from 2021 and 2022 at three stations (Xinzuoqi, Manzhouli, and Ewenki) were selected as examples (
Figure 3).
We found that the daily snowmelt process generally exhibits a complex pattern of gradual decrease followed by rapid then slower decline (
Figure 3). This pattern corresponds to the diurnal distribution of heat conditions, with snow depth decreasing during the day and stabilizing during the night. Before 9:00 and after 18:00, the snow depth at each station remained relatively stable. From 9:00 to 11:00, some stations start to experience a slight decrease in snow depth, and a significant decrease in snow depth typically occurs between 11:00 and 18:00. Due to weather variability, snowmelt duration varied between stations and dates. Significant snowmelt processes occur near 16:00, 17:00, or 18:00, but the noticeable decrease in snow depth generally begins around 11:00. Regardless of the magnitude of snow depth change during the day, a rapid decrease in snow depth typically occurs between 11:00 and 16:00. This is the significant snowmelt phase, characterized by the largest and most rapid decline in snow depth, and creates the phased melt pattern of rapid, followed by slower, declines.
3.4. Snowmelt Index
Variation in snow depth during the later stage of snowmelt (
Figure 3) indicates that, in general, during the last 1–2 days when the snow depth reaches 0 cm, the ground snow depth is generally less than 3.0 cm. We infer that when the ground snow depth is less than 3 cm, the snow during the fast snowmelt period in spring may completely melt within 1–2 days. However, the duration of snowmelt differs among stations in such cases, undoubtedly related to ambient temperature. To investigate the key indicators that may exist for the end of snowmelt, we matched the relationship between temperature and snow depth during different periods of rapid snowmelt at each station.
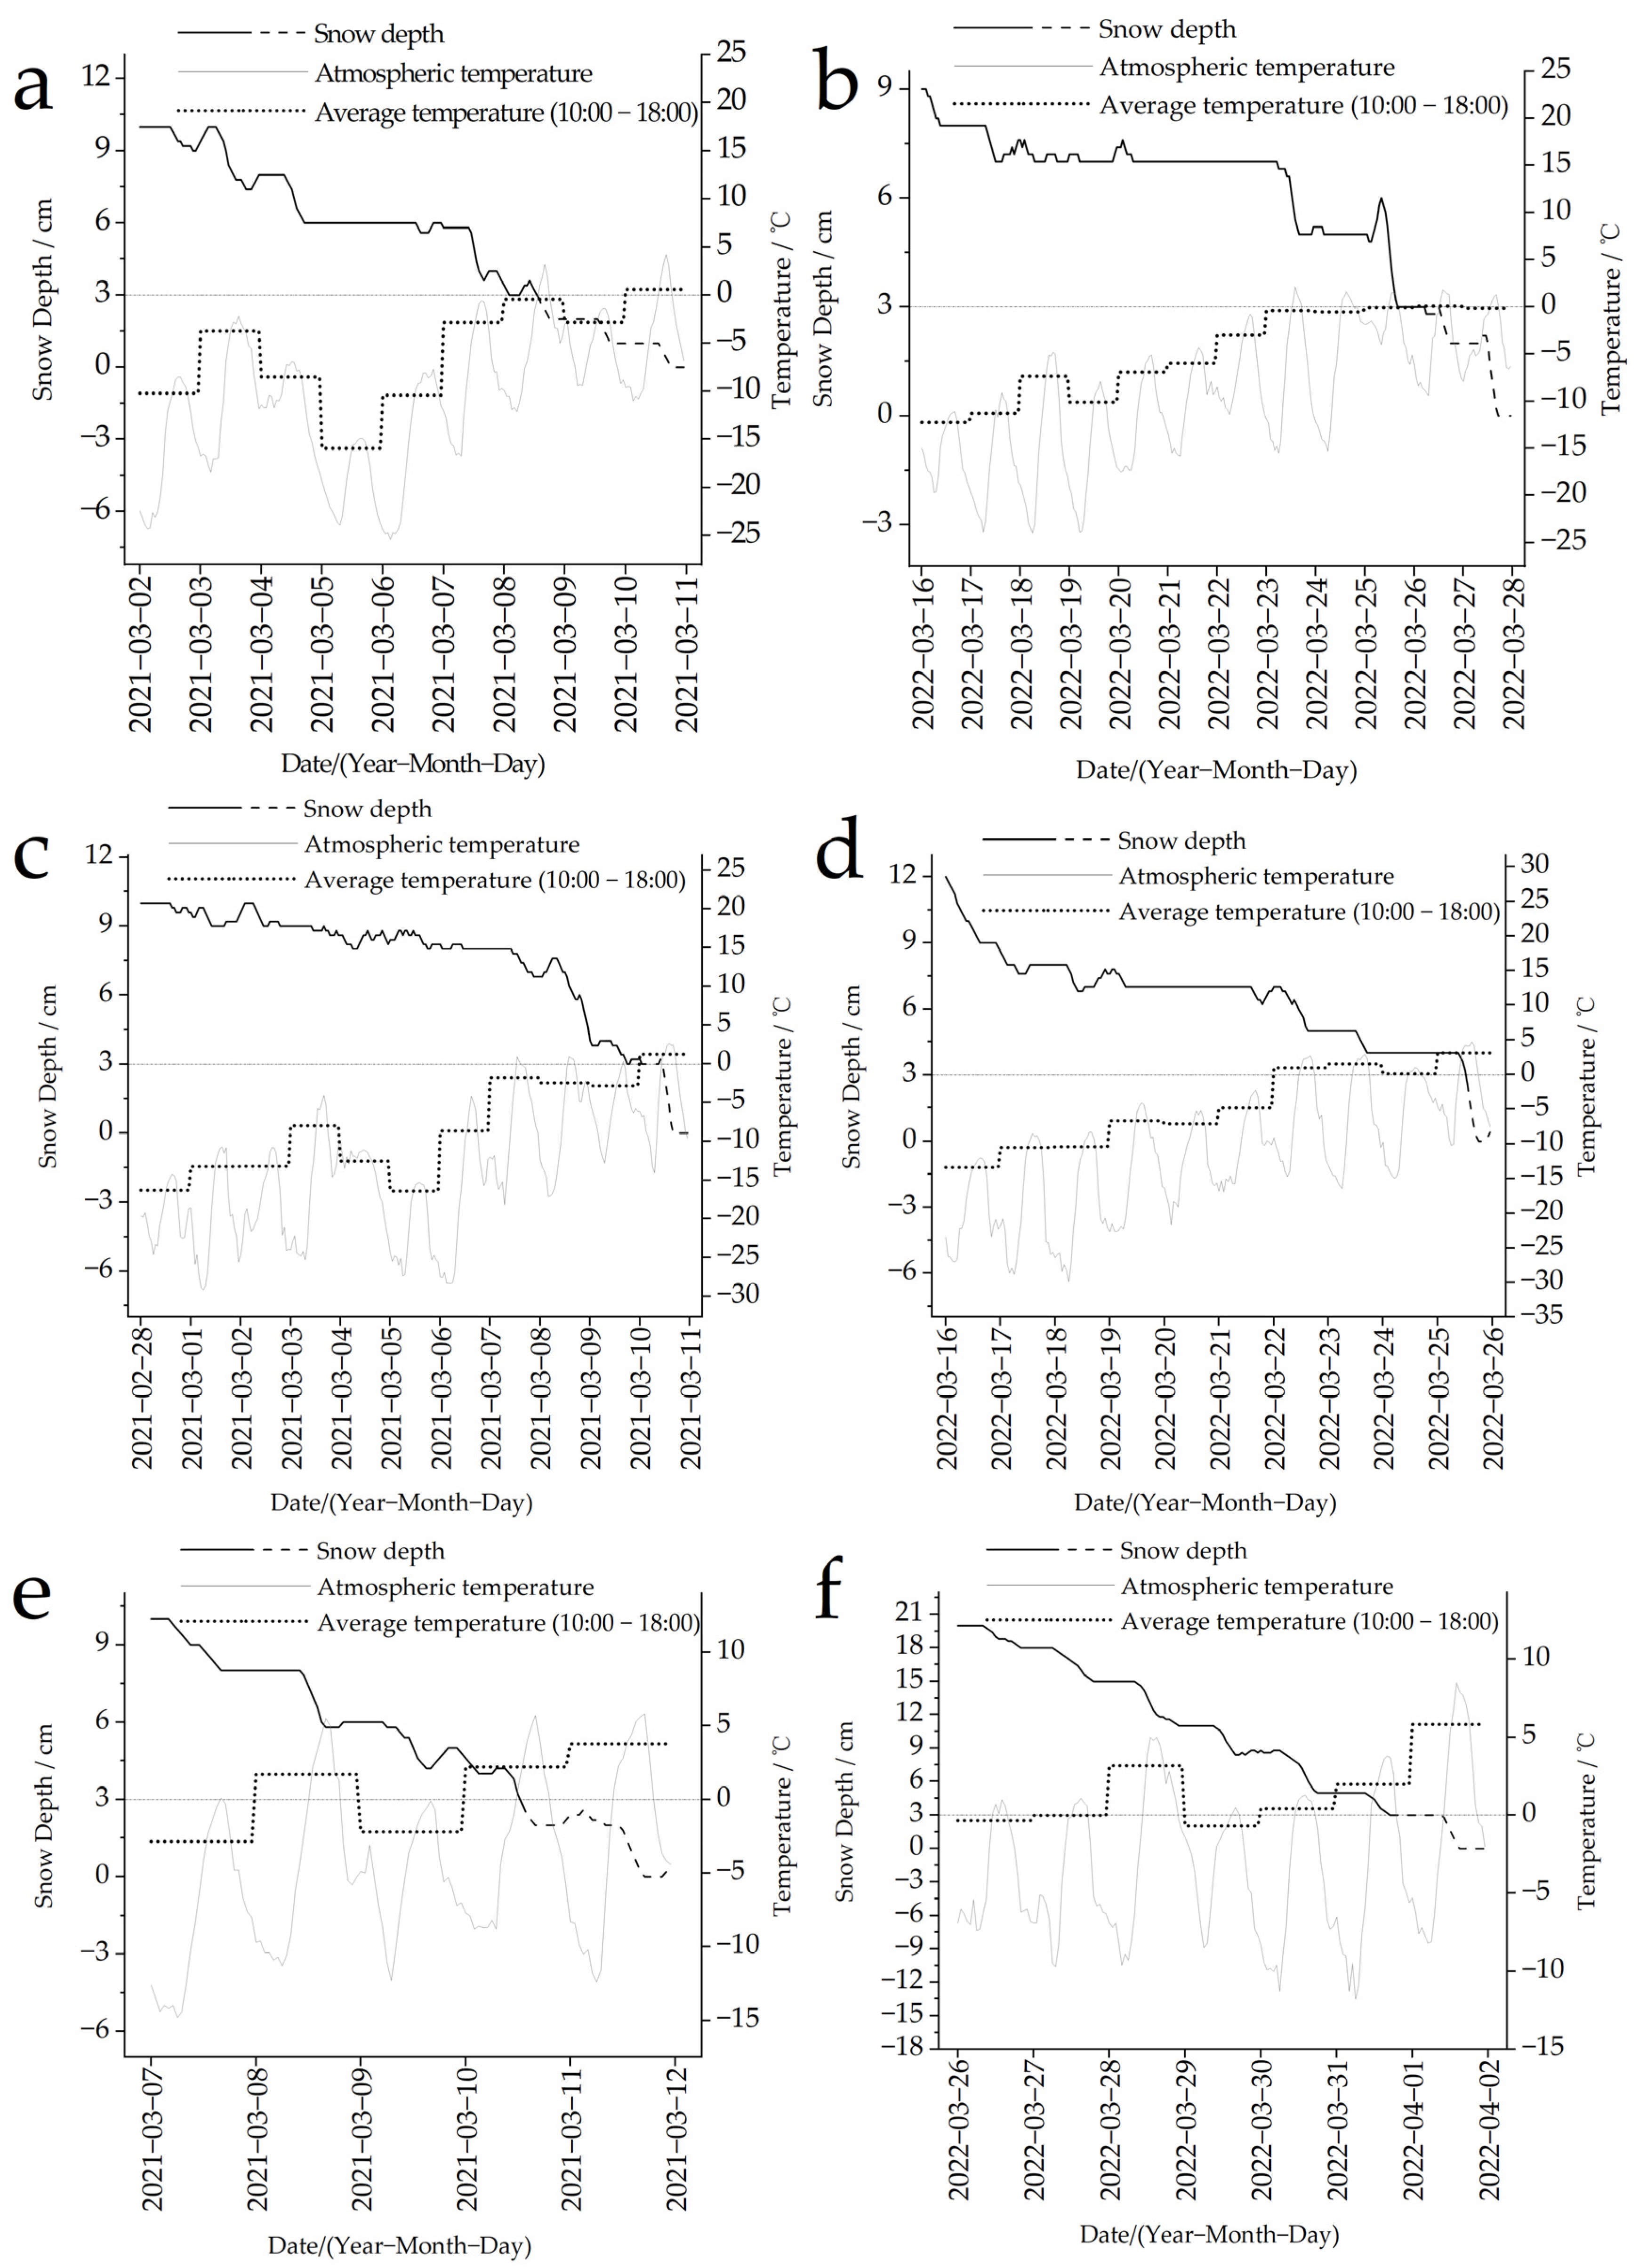
We found that during the snowmelt period, including the end, the daily average temperature at all stations is below 0.0 °C (
Figure 4). However, variation in hourly temperatures in the last few days of snowmelt shows that most stations exceed 0.0 °C for several hours each day. Some stations even maintain temperatures above 0.0 °C for 11 consecutive hours when the snow is about to melt completely. At the end of snowmelt in Manzhouli, the maximum temperature reached 4 °C and the snow depth decreased rapidly from 3.6 cm at 9:00 to 0.0 cm in just 6 h (
Figure 3c,d). In the final 1–2 days before complete disappearance, the maximum daily temperatures at the other stations also surpassed 0.0 °C. At Xinzuoqi, this pattern is pronounced, with the snow depth quickly melting from 3 to 0 cm within 5 h on the last day in both years. However, in the Ewenki region, the snow melts completely within 1–2 days after reaching the critical 3 cm depth due to the weaker influence of temperature on snow.
However, at the Xinzuoqi station, the temperature exceeded 0.0 °C from 13:00 to 19:00 for four days during the snowmelt phase, without melting completely (
Figure 4e). By comparing this time period with the fast snowmelt phase, we find that when the snow depth is <3.0 cm and the daily temperature exceeds 0.0 °C, there is the potential for rapid snow disappearance. Further analysis revealed that, despite average daytime temperatures below 0.0 °C, the average temperature from 10:00 to 18:00 in this period is generally above 0.0 °C. We also found that, out of the six typical fast snowmelt phases at the three stations, there were five instances where the snow completely melted when the average temperature from 10:00 to 18:00 was >0.0 °C (
Figure 4). This indicates that when the ground snow depth is <3.0 cm in early spring and the average temperature from 10:00 to 18:00 exceeds 0 °C, the ground snow cover enters the collapsing phase, and grassland snow can completely melt within 1–2 days. This criterion can be used as a key indicator for predicting the end date of weak snow cover melting in this area.
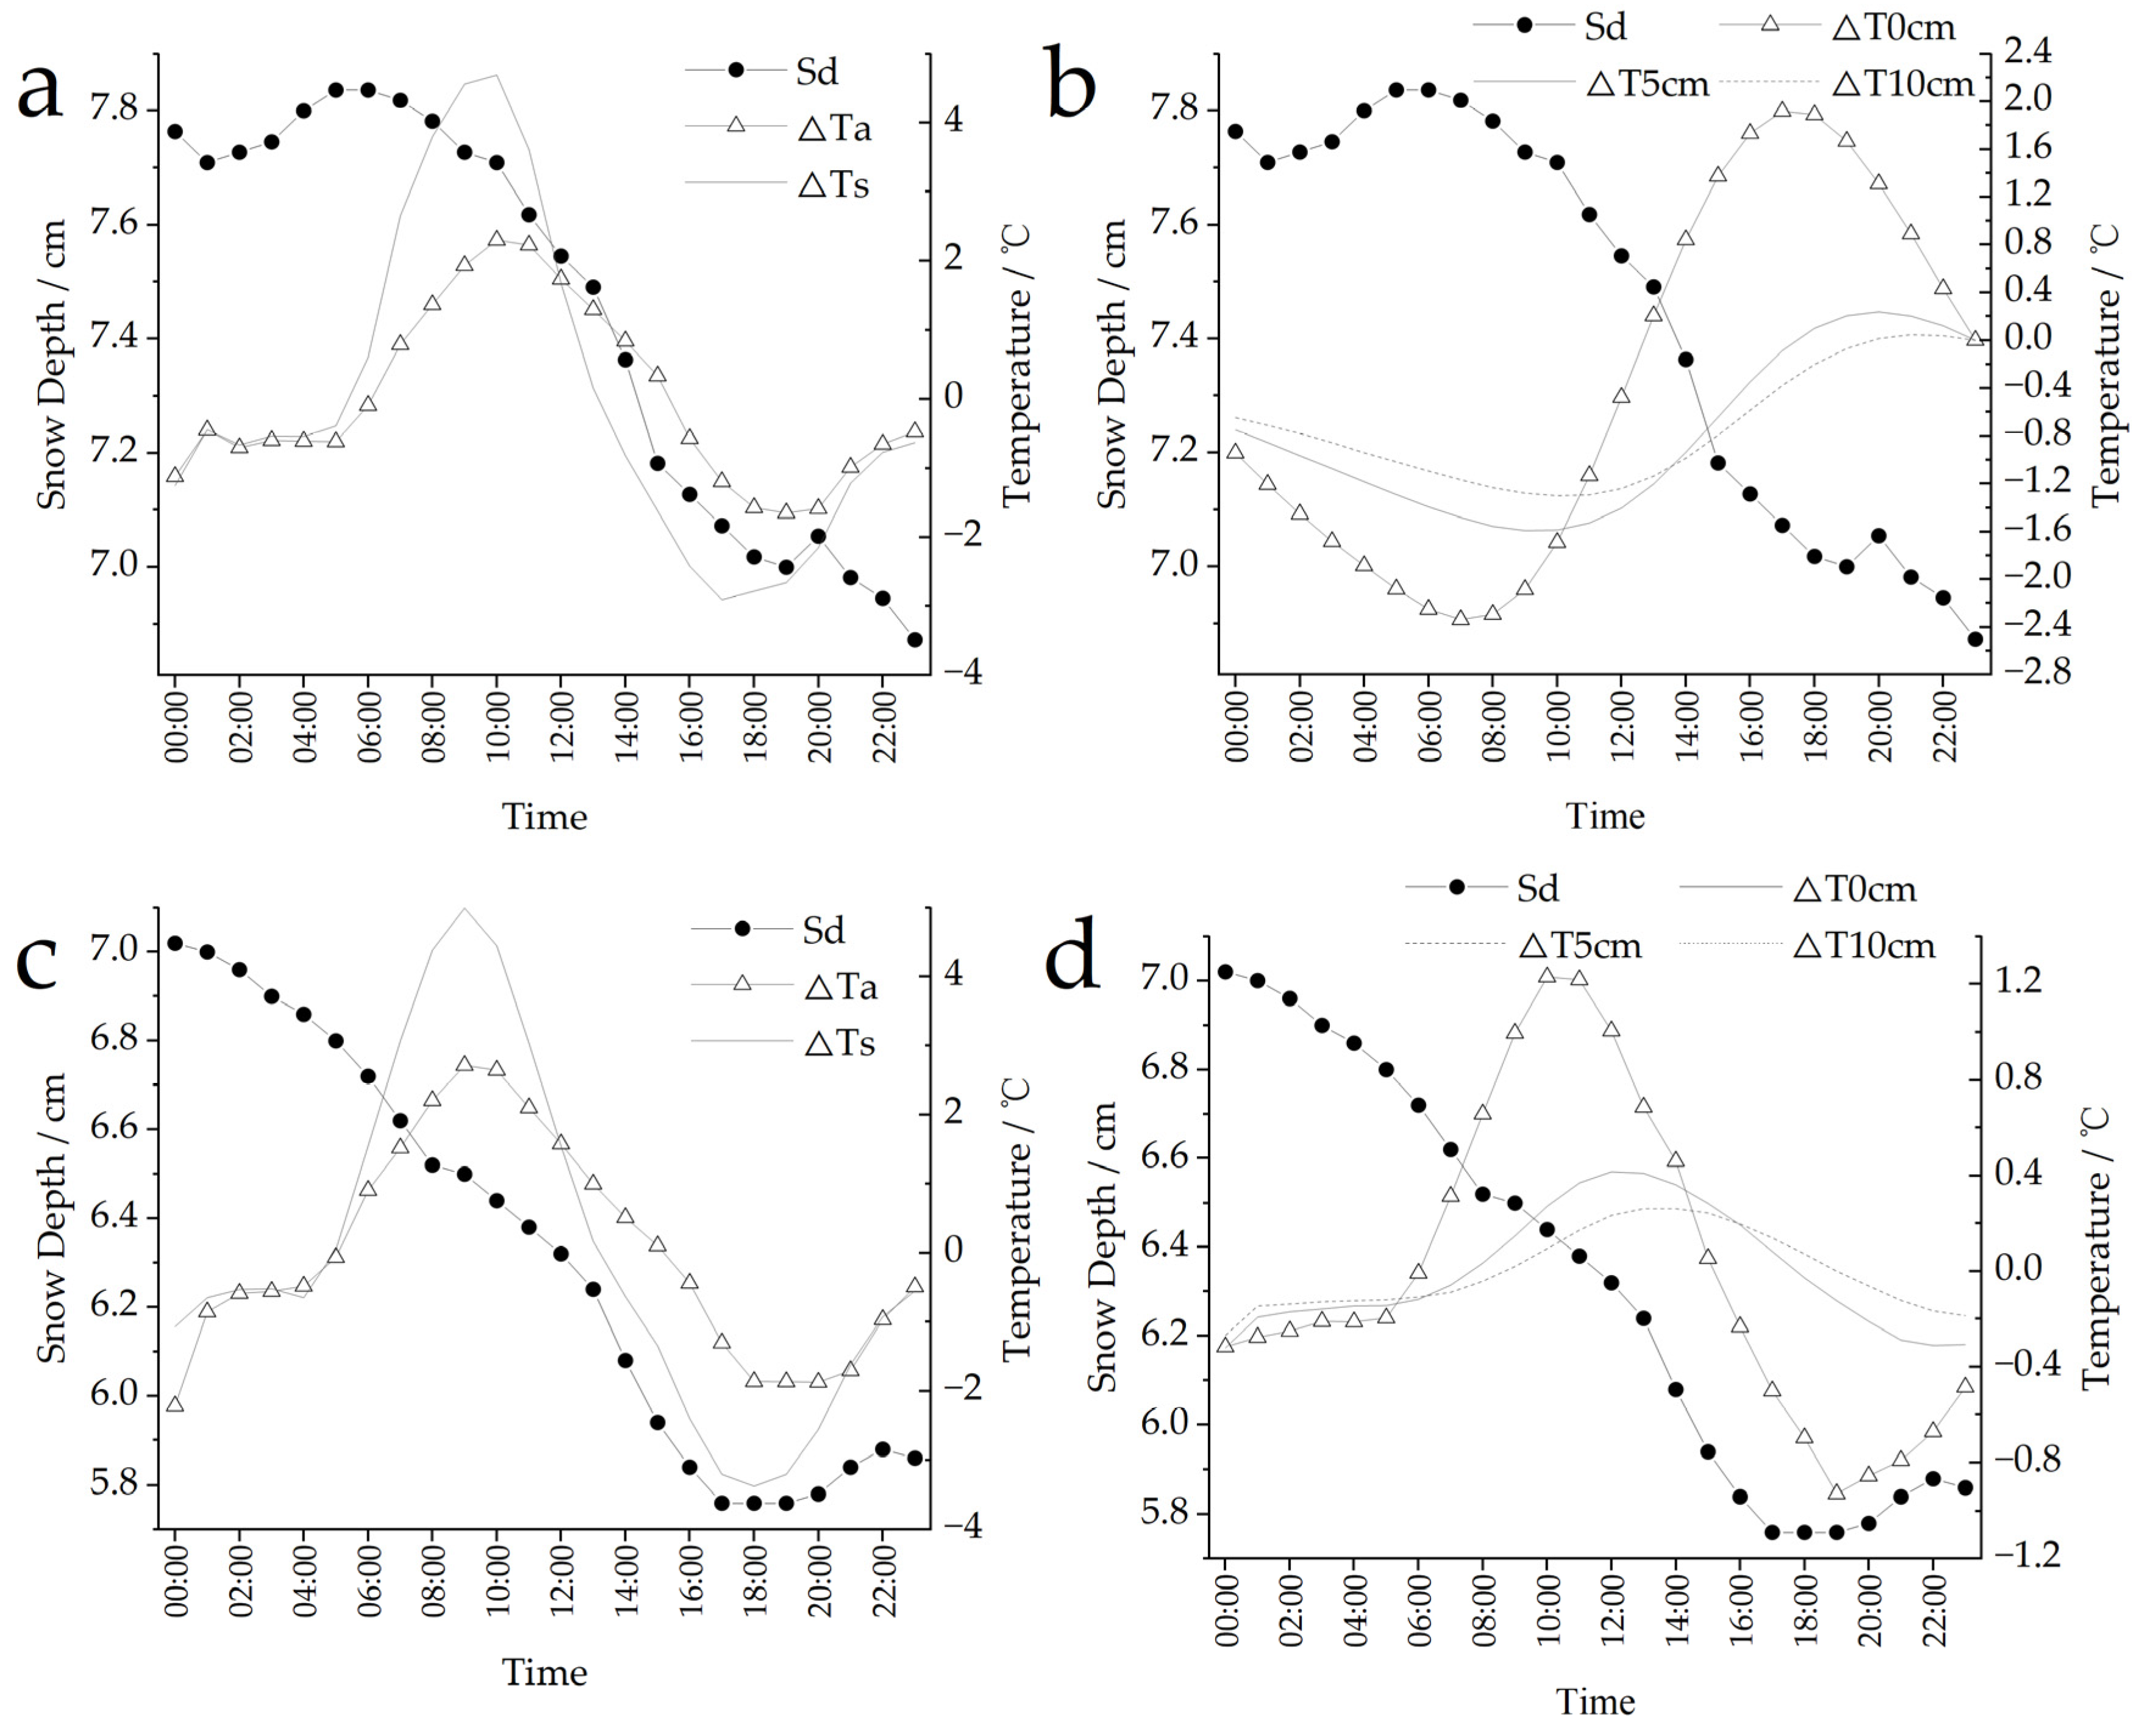
3.5. Synergistic Variation of Snowmelt and Heat Flux
We further calculated the relationship between snow depth change and temperature variation during the rapid snowmelt period using hourly average snow depth, temperature, snow surface temperature, and average ground temperatures at 0, 5, and 10 cm for multiple days at each station. Hourly temperature variation at one-hour intervals was measured to analyze the relationship between snow depth change and heat variation. Due to ample snowmelt data at the six stations, we illustrate the relationship between snow depth changes and temperature variation during rapid snowmelt using data for Manzhouli in 2021 and 2022 (
Figure 5).
Multi-day average snow depth variation (ΔSd) during the rapid snowmelt period suggests that depth generally decreases throughout the day (Manzhouli data from 2021 and 2022). Excluding an abnormal increase that may be related to nighttime measurement errors, it is evident that the most significant decrease in snow depth occurs between 7:00 and 17:00, with the most pronounced decline occurring between 13:00 and 15:00. Hourly variation in air (ΔTa) and snow surface temperature (ΔTs) during the two snowmelt periods (
Figure 5a,c) shows that between 6:00 and 15:00, both temperature and snow surface temperature increase. Heat accumulates during this period, leading to a noticeable snow depth decrease, the timing of which coincides with the onset of significant temperature and snow surface temperature changes. The rapid snow depth decline occurs in the later stage of pronounced positive temperature variation, suggesting a close relationship between snowmelt and heat conditions in this region.
We found a direct correlation between snow depth and temperature variation at different soil depths (0, 5, and 10 cm) using temporal distribution characteristics of snow depth variation (ΔSd) and variation in soil temperatures during the two processes (
Figure 5b,d). However, unlike temperature and snow surface temperature, variation in soil temperature has a noticeable time lag. The greatest temperature variation, at 0 cm soil depth, occurs at 11:00 and 18:00, while the 5 and 10 cm soil temperatures have a clear sequential lag. This indicates that there is a direct relationship between soil temperature and snow depth variation, characterized by a pronounced time lag, which becomes more apparent with increasing soil depth.
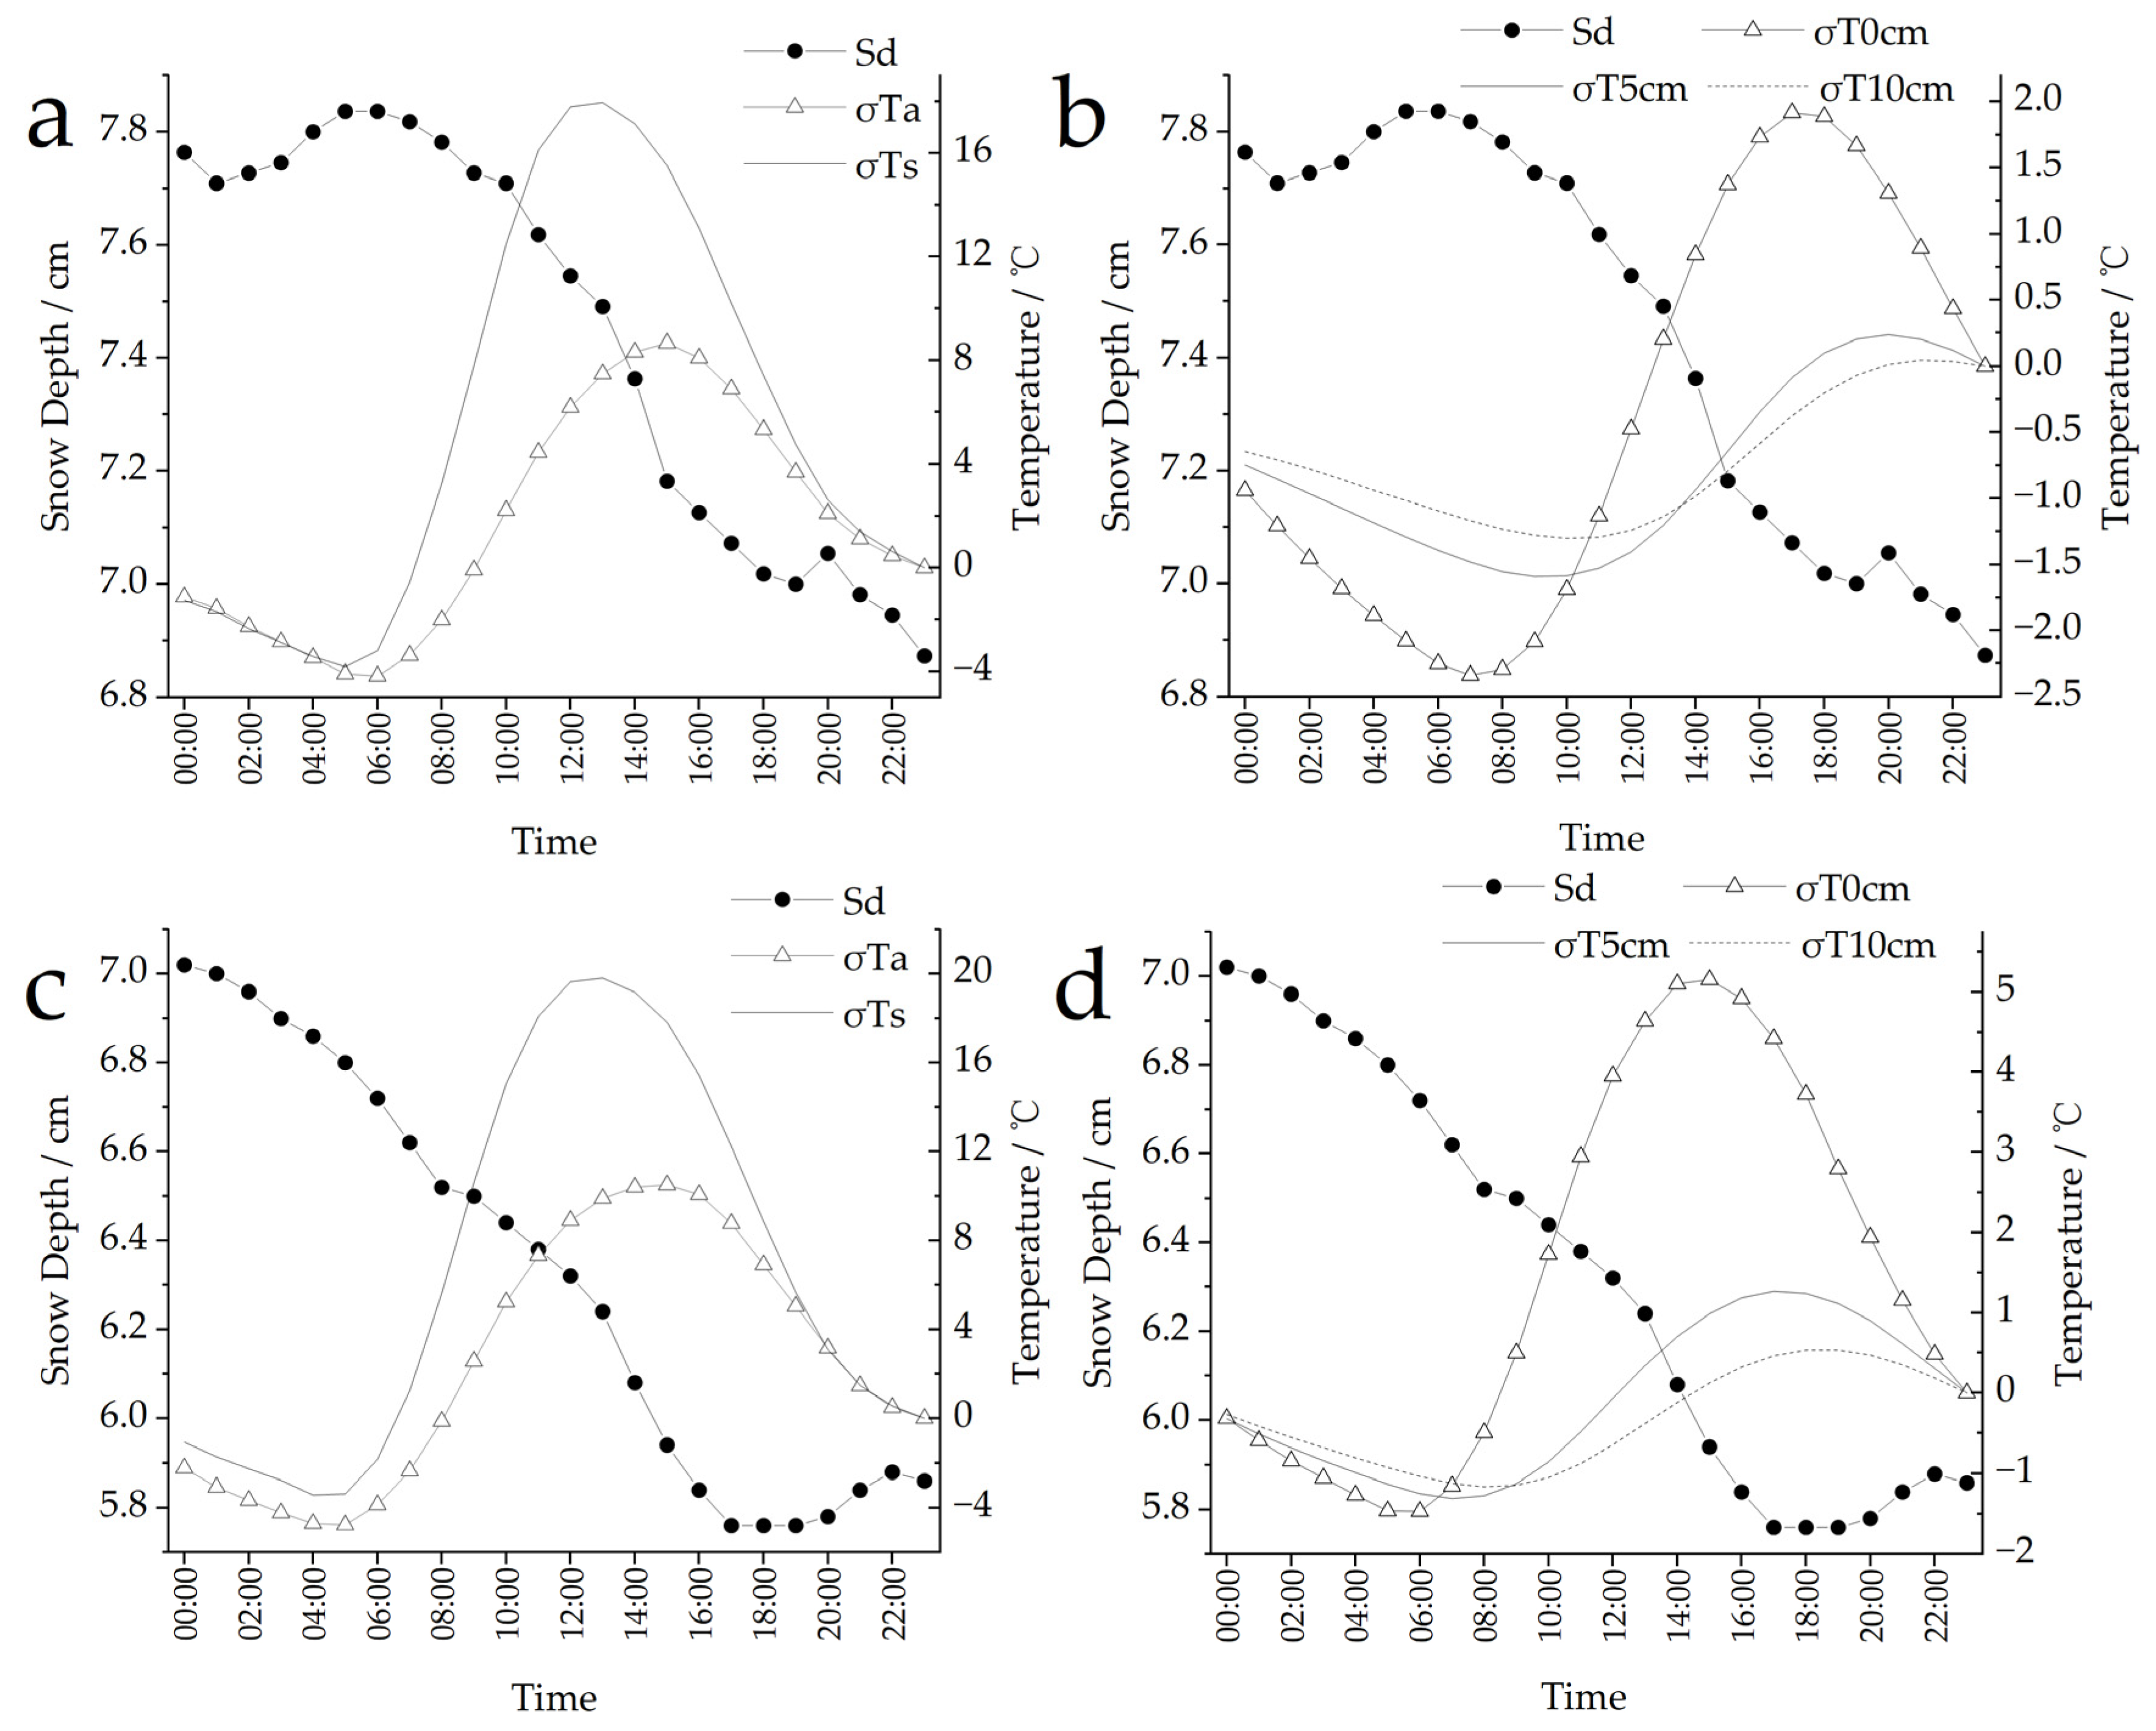
The analysis of the relationship between temperature variation and snow depth (
Figure 5) indicates a direct connection with heat accumulation. We calculated cumulative temperature variation at different points of the fast-melting period (
Figure 6). We found that cumulative temperature variation has similar patterns to temperature variation (
Figure 5), but with an additional time lag for peak values. The peak value for air temperature occurs near 12:00, for snow surface temperature near 15:00, for 0 cm soil temperature around 15:00 and 17:00, and at 5 cm and 10 cm soil temperatures, an even greater lag. Cumulative air temperature and snow surface temperature reach positive values after about 8:00, signaling the onset of positive heat accumulation after this time. This process can continue until 23:00. This not only partially explains the phenomenon of continuous snow depth decrease despite dropping nighttime temperatures but also clarifies the association between heat conditions and snow depth changes. When cumulative temperature variation is small or tending toward zero, snow depth changes are relatively gentle. However, when the cumulative temperature variation is large, snow depth changes become more significant, indicating that they are not only dependent on current temperature variation but also directly linked to the prior temperature variation and heat accumulation.
3.6. Factors Influencing Snow Depth
The previous analysis suggests a lag effect between temperature and snow melt. To comprehensively understand the relationship between temperature and snow depth, we selected all snowmelt processes lasting more than 10 days to calculate the correlation between fast-melting period snow depth and synchronous as well as leading 12 h temperatures (
Table 1).
From 6:00 to 22:00, we found a significant correlation between temperature and snow depth (
Table 1). Snow depth is significantly correlated with synchronous and leading 12 h temperatures (
p = 0.05). Different snowmelt processes at other stations are similarly correlated (
Table 1). This indicates that the snow melting process in the grasslands of northern China’s mid-high latitude region is closely related to temperature and related thermal conditions.
By analyzing the magnitude and significance of the correlation at different times, we found that, during the 2021 snowmelt period, the most significant relationship between snow depth and temperature occurs between 9:00 and 14:00 (r > 0.82, p = 0.001). We also found a significant correlation between temperature and the subsequent 12 h snow depth decrease until 22:00. This indicates that the thermal conditions during this period directly affect the amount of snowmelt at that time and throughout the day.
In 2022, the correlation between snow depth and temperature was even stronger. Between 9:00 and 21:00, we found a significant correlation between temperature and synchronous as well as lagged snow depth at different time intervals. At other stations, the correlation of the snowmelt processes are generally as strong as in 2022. Although some individual snowmelt processes may be as correlated, as observed in Manzhouli in 2022, they still show similar time response characteristics, as in Manzhouli in 2021. For example, the correlation data for Ewenki in 2022 and Xinzuqi in 2021 both show highly significant correlations between snow depth and temperature (p = 0.001). This further illustrates the high dependency of snowmelt in this region on temperature and related thermal conditions, as well as the high responsiveness of thermal conditions between 9:00 and 14:00.
After 20:00, snow depth generally does not change significantly in most areas (
Figure 3). This suggests that the daily snowmelt process is typically completed before this time, and that snow depth at this time, as well as the difference between the current and previous snow depths, can indicate the amount of snowmelt that occurred during the day. Indeed, 20:00 happens to be an important time for global meteorological observations; it not only provides manually observed daily snow depth data but also is the time when temperature forecast values for the upcoming week are made. Since there is a significant correlation between snow depth at different times of the day and future temperature, it becomes challenging to identify the critical moments when temperature influences snow depth changes. We designated 20:00 as the key time point for analyzing the relationship between snow depth and temperature.
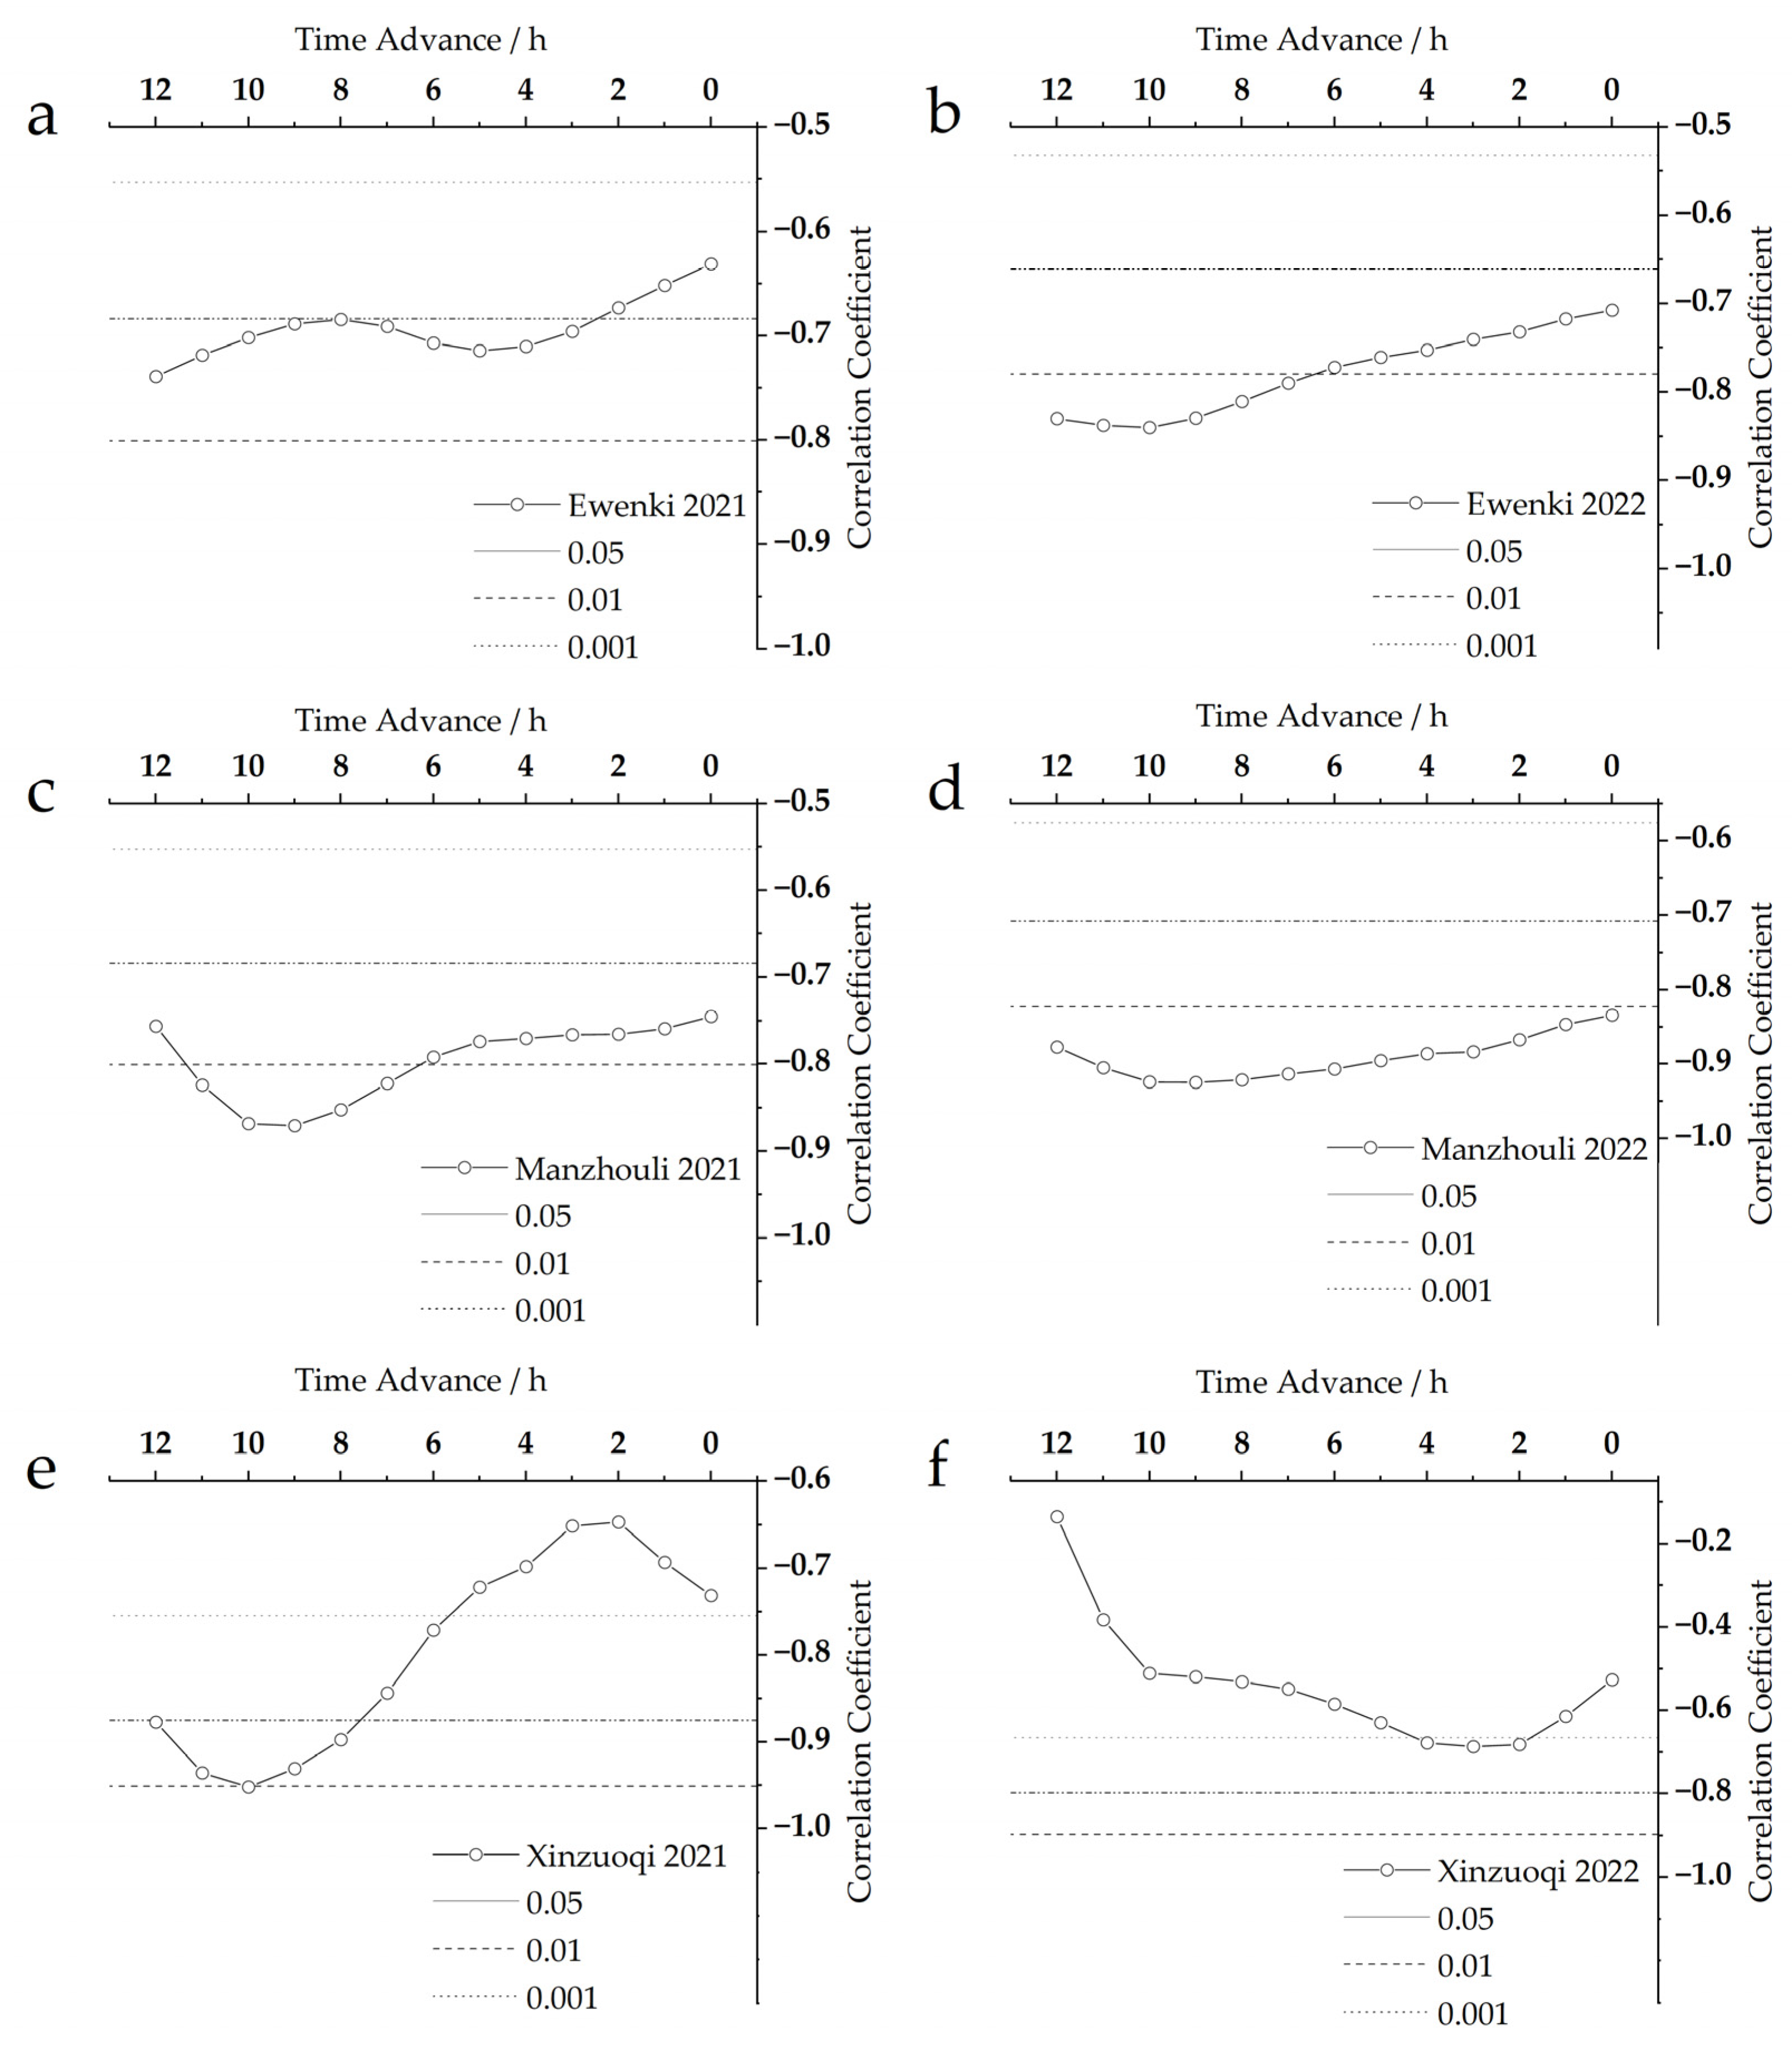
We found that, in most snowmelt processes, there is a significant correlation between the snow depth at 20:00 and the temperatures at the synchronous and leading hours (
Figure 7). However, we also found considerable variability in the strength of the correlation between temperatures at different time points and snow depth.
These patterns indicate that the response of snowmelt during the day does not have the same relationship with the thermal conditions at all time intervals. Instead, there may be sensitive periods in response to temperature. All three stations show a significant correlation (
p < 0.001) between temperatures 7 to 10 h prior to measurement and snow depth at 20:00, with the strongest correlation occurring between temperatures at 10:00 and snow depth at 20:00, 10 h in advance (
Figure 7b).
Although we found strong correlations with a 5 to 3 h time lag (
Figure 7a,f), they do not demonstrate the same characteristics as the other four cases. Correlation analysis (
Figure 7) indicates that temperatures between 10:00 and 13:00 have a significant impact on the snowmelt at 20:00 during daily snowmelt processes. The other three stations (not listed) also exhibit similar relationships and patterns in their six snowmelt processes.
3.7. Sensitive Influencing Factors
In addition to air and ground temperature, we also collected meteorological information on hourly wind speed and relative humidity, which have the potential to affect the snowmelt process. This allows a further discussion of the relationships between snow depth variation and climate at different times of the day and to identify sensitivity. We used the fast snowmelt periods in Manzhouli for 2021 and 2022 as examples of meteorological element effects (
Table 2).
Snowmelt in grasslands is directly related to the thermal conditions during the preceding 8 h. This pattern is evident from the air temperature, snow surface temperature, and soil temperature at different depths. There is a significant correlation between the ground temperature at different depths and snow depth variations. In 2021, the correlation coefficients between surface temperature in the preceding 12 h and the snow depth at 20:00 were significant (p = 0.001). Although significance weakened to some extent in 2022, the ground temperature in the 6 h leading up to snowmelt was still significantly correlated with the snow depth at 20:00 (p < 0.01).
In the two snowmelt processes from these two years (
Table 2), we observed that soil temperature at different depths is closely related to snow depth variation after 10:00. In 2022, the magnitude of correlation coefficients and significance of soil temperature at different depths demonstrates that after 12:00 ground temperature and snow depth are most strongly related. Particularly after 14:00, significant correlations (
p < 0.05) are observed in snowmelt processes and soil temperature at different depths. But we found no significant difference in this relationship in 2021. However, the 2022 process shows that the correlation between snow depth and surface temperature is significant, but that the correlation weakens in deeper soils. Generally, the surface temperature between 14:00 and 20:00, except for the temperature at some soil depths, can be considered a sensitive factor to predict snow depth variation.
The snow surface temperature in the preceding 12 h is clearly correlated with snow depth at 20:00. In both snowmelt processes, correlations are significant (p = 0.01) most of the time. Indeed, the period between 14:00 and 18:00 is a sensitive response time to predict snow depth variation.
Snow depth is not correlated with wind speed at different times, indicating that there is no direct relationship between snow depth variation and wind speed in this northern grassland region. This suggests that the impact of blowing snow on snow depth changes is either not evident here or could be difficult to observe at the meteorological stations due to factors such as site selection.
We found distinct differences in relative humidity between the two snowmelt processes in 2021 and 2022. In 2021, there is little correlation between snow depth and relative humidity, and in 2022, there is no relationship either at the measurement time nor during the preceding 4 h. However, snow depth change at 20:00 is significantly correlated (
p < 0.01) to relative humidity 6–11 h prior to measurement, which may be related to recent snowfall events during this snowmelt process (see
Figure 2d).
3.8. Dominant Influencing Factors
Our analysis shows that snow depth variation is closely related to several thermal factors at different times. However, as these factors represent thermal properties and are inherently inter-correlated, it is difficult to determine the dominant factor driving snow depth change based solely on the magnitude of individual correlation coefficients. We used stepwise regression to identify the dominant factors influencing snow depth change. This involved introducing previously identified sensitive factors into the model, considering the sequence in which the factors were introduced, partial correlation coefficients and their t-test significance, and the final selection of factors. The goal was to eliminate interdependence and multicollinearity among the factors and ultimately identify the dominant factors affecting snow depth change.
The stepwise regression analysis compared 20:00 snow depth as the dependent variable to significant meteorological factors (p = 0.001) at different times of day as the independent variables. Since the introduced factors corresponded to different times, the variables’ notation includes a superscript indicating the time (e.g., is the 0 cm soil temperature at 14:00, is the snow surface temperature at 14:00).
The results of the stepwise regression analysis for 20:00 snow depth in both 2021 and 2022 in Manzhouli, considering all the sensitive factors, are given in
Table 3. Among numerous thermal factors,
was found to be the most sensitive to snow depth change in both cases. The stepwise regression analysis of the 2022 data shows that after introducing the
in the first step, all other factors fell out of the model; the optimal solution was achieved with just one step of factor inclusion (F-test,
p = 0.001, SE = 0.125). The F-test significance and very low standard error suggest that, for the examined snowmelt process,
is not only the most sensitive factor to snow depth change but also a key dominant factor influencing these changes.
In the 2021 snowmelt data (
Table 3), the stepwise regression analysis introduced
in the first step, indicating that this factor is also the most sensitive to snow depth change. However, in the second and third steps,
and
were retained in the model, suggesting that soil temperatures at different times contributed to the snow depth melting process. However, when the equation contained three factors, the variance inflation factor (VIF) was high at 129, indicating high multicollinearity in the equation and a significant correlation among factors. In the fourth step, after eliminating this multicollinearity, surprisingly,
was eliminated, and in the fifth step, three dominant factors influencing snow depth change were retained. This suggests that in 2021, snow depth changes were most sensitive to
, but
,
, and
were the dominant factors influencing snow depth change.
Based on these results, soil temperature plays a dominant role in snow depth changes during snowmelt in high-latitude areas in the northern hemisphere. We found a close relationship between snowmelt and , and both soil temperature and snow surface temperature are crucial at 14:00. However, the role of soil temperature at different times of day may vary in its contribution to snowmelt as snow surface temperature may also play a role. This could be directly related to the prevailing weather conditions at that time and requires specific analysis for each individual process.
4. Discussion
We found that snowmelt and its response to meteorological factors mainly occur during the afternoon when the thermal conditions are favorable. This finding avoids the concentration of observation errors in the morning and at night. Due to instrument interference we encountered (current fluctuation, strong wind, foreign objects on the observation platform), there may be some measurement errors and anomalies. For example, in the absence of snowfall, an abnormal increase in snow depth was measured in the morning (
Figure 3a,c,e) as well as an increase in nighttime snow depth (
Figure 3d,f and
Figure 5a,b) suggesting instrument errors. Additionally, observable decreases in snow depth may also occur at night due to snow compaction. These measurement errors, as well as non-snowmelt-related changes in snow depth, can affect the accuracy, continuity, and veracity of the data series, affecting analysis and interpretation. Although the data series may contain some observational errors, they do not substantially affect our research findings.
We observed that some stations had an anomalous increase in snow depth values between 8:00 and 11:00 (
Figure 3 and
Figure 5a,b). Similar phenomena have also been reported in the observation data of Zhou Yang and colleagues in several reports [
23,
28,
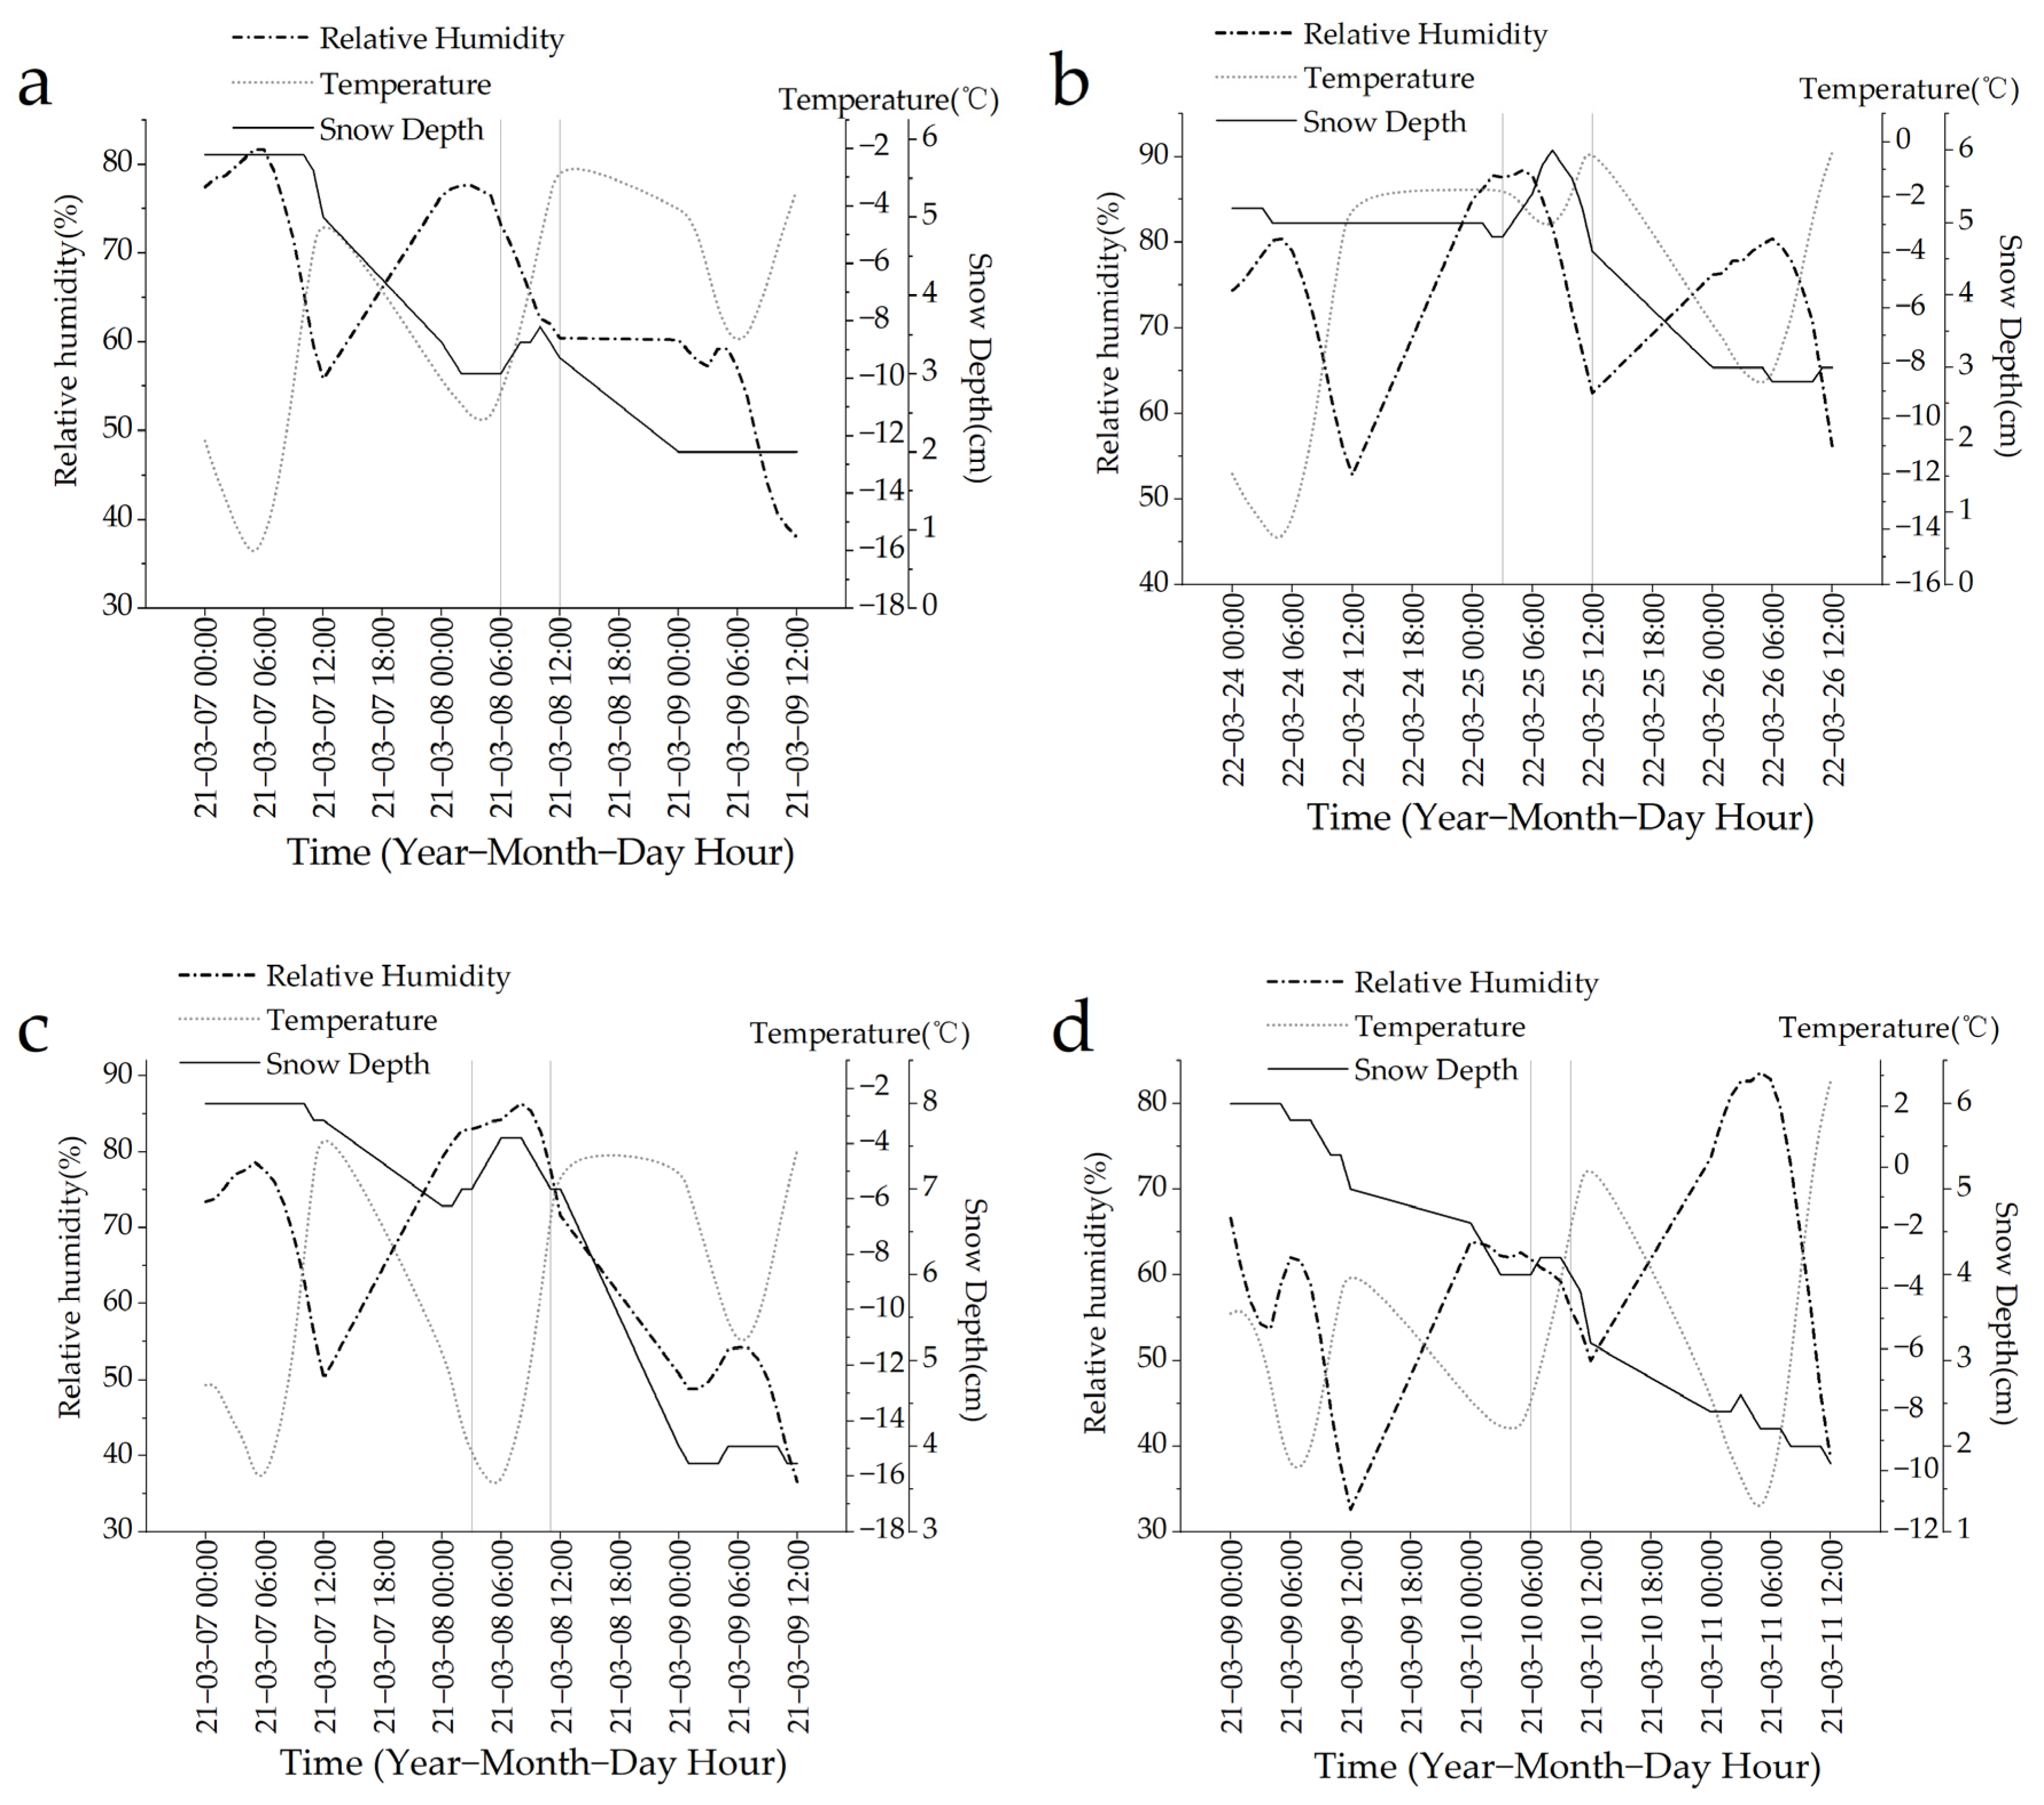
29]. However, when comparing the precipitation data among stations, we found that there was no precipitation during that time period, suggesting instrument measurement error. We were able to rule out voltage-related issues and abnormal dark currents (Campbell Scientific technical support). Since this observation anomaly occurred repeatedly at specific time periods (morning hours), we selected all the time periods for two years of observed abnormal values during the snowmelt at three stations: Ewenke, Manzhouli, and Xinzuqi. We extracted the snow depth, temperature, and relative humidity data from 0:00 to 12:00 on the day of the anomaly and the days before and after (
Figure 8).
When there is an abnormal increase in snow depth, the relative humidity during the same period, or 1–2 h beforehand, is generally high, while the temperature is relatively low (
Figure 8). Additionally, on the day following the abnormal increase in snow depth (
Figure 8a), when the relative humidity is relatively low (
Figure 8b–d), abnormal readings do not occur. On the day prior to the abnormal increase in snow depth (
Figure 8a), when the relative humidity is relatively high, the snow depth observations remain stable when the temperature is relatively high during the same period. From the coordinated fluctuation of relative humidity and temperature (
Figure 8), when the relative humidity exceeds 70% and the temperature is relatively low, the phenomenon of abnormal increase in snow depth observations is more likely to occur.
During periods of high relative humidity and low temperatures, the air is prone to reaching saturation and condensing into dew or frost. The snow depth observation probe used at the meteorological station is equipped with a glass protective cover. The temperature difference between the inside and outside of the probe, combined with favorable conditions of high relative humidity, can lead to the formation of water vapor similar to the condensation observed on car windows during clear nights in cold seasons. Therefore, it is possible that the abnormal fluctuations in snow depth observations during 8:00–11:00 may be directly related to the saturation and condensation of water vapor in midmorning low temperature and humid conditions. The presence of water film or droplets on the outer surface of the observation probe’s glass cover interferes with the emission of pulse signals from the instrument, leading to observation bias. Although this conclusion has not been supported by direct evidence, such as by on-site photographs, the temporal correlation between high relative humidity and low temperature fluctuations shown in
Figure 8 provides reasonable support for the above inference. Our analysis suggests that in the application of similar observation data, attention should be paid to the anomalies in the observed data during this time period and appropriate corrections should be made.
According to studies by Zhou Yang and Li Yuting [
32], solar radiation is a significant factor contributing to the decrease in snow depth in the Qinghai-Tibet Plateau region. To examine the potential influence of solar radiation sublimation on snowmelt in the northern mid-to-high latitude areas, we introduced sunshine duration as a variable in the fifth step of the progressive regression process described above for the year 2021. We found that including sunshine duration improved the goodness of fit of the model. However, this suggests that sunshine duration does not make a substantial contribution to the decrease in snow depth. The linear correlation coefficient between sunshine duration and snow depth is −0.055 and nonsignificant. This implies that, unlike the Qinghai-Tibet Plateau region in the middle and low latitudes, the sublimation of snow caused by direct sunlight or solar radiation is relatively weak in northern mid-to-high latitude areas, and the impact of solar radiation on the decrease or melting of snow depth can be discounted.

 ,
, 


