Abstract
The Source Region of the Yellow River (SRYR), renowned as the “Water Tower of the Yellow River”, serves as an important water conservation domain in the upper reaches of the Yellow River, significantly influencing water resources within the basin. Based on the Weather Research and Forecasting (WRF) Model Hydrological modeling system (WRF-Hydro), the key variables of the atmosphere–land–hydrology coupling processes over the SRYR during the 2013 rainy season are analyzed. The investigation involves a comparative analysis between the coupled WRF-Hydro and the standalone WRF simulations, focusing on the hydrological response to the atmosphere. The results reveal the WRF-Hydro model’s proficiency in depicting streamflow variations over the SRYR, yielding Nash Efficiency Coefficient (NSE) values of 0.44 and 0.61 during the calibration and validation periods, respectively. Compared to the standalone WRF simulations, the coupled WRF-Hydro model demonstrates enhanced performance in soil heat flux simulations, reducing the Root Mean Square Error (RMSE) of surface soil temperature by 0.96 K and of soil moisture by 0.01 m3/m3. Furthermore, the coupled model adeptly captures the streamflow variation characteristics with an NSE of 0.33. This underscores the significant potential of the coupled WRF-Hydro model for describing atmosphere–land–hydrology coupling processes in regions characterized by cold climates and intricate topography.
1. Introduction
Water, energy, and heat fluxes, along with the interactions between the atmosphere, land surface, and hydrology, constitute a complex nexus [1,2]. Within the water cycle of the whole Earth Climate System, the land surface hydrological processes serve as a crucial link, connecting atmospheric water components (e.g., precipitation, evapotranspiration, water vapor transport), terrestrial surface water (e.g., rivers, lakes, glacial meltwater, snow meltwater, surface runoff), groundwater (e.g., baseflow, subsurface runoff, soil water), and ecological water (vegetation water). This interconnected system provides feedback to weather and climate by regulating land–atmosphere energy and water cycle processes. Therefore, a nuanced comprehension of hydrological cycle processes at the interface of the atmosphere and the land surface in mesoscale river basins holds vital importance for ecological preservation and the overarching regulation of water resources [3].
The Source Region of the Yellow River (SRYR), located in the Tibetan Plateau (TP) hinterland, falls within the continental semi-arid climate zone with complex climatic conditions exhibiting a temperature rise rate of 0.48 °C/(10a)−1 and precipitation increase of 7.6 mm/(10a)−1 [4]. This region is highly susceptible to climate change and ecological shifts, characterized by numerous alpine lakes and wetlands, regarding it as a vital area for East Asia and global climate change [5]. Known as the “Yellow River Water Tower”, it encompasses approximately 16.2% of the Yellow River Basin’s total area. The streamflow, dominated by precipitation and evaporation, plays a crucial role as the primary flow-producing area and water conservation area for the middle and upper reaches of the Yellow River [6]. The historical continuity of the Yellow River civilization can be attributed, in part, to the SRYR’s stable ecological environment and water supply [7]. However, contemporary challenges emerge due to global climate change, human activities, and the uneven distribution of regional water resources, leading to transformative shifts in water conservation elements such as glaciers, permafrost, and grasslands. This has resulted in a heightened frequency of extreme meteorological and hydrological events, including rainstorms, blizzards, droughts, and floods escalating the spatiotemporal distribution uncertainties of precipitation and hydrology in watersheds. Consequently, the sustainable development of the ecological environment and social economy over the SRYR encounters formidable challenges [8,9].
With the rapid development of high-resolution Earth System Models, the significance of land surface variability in simulations garners increasing attention [10,11]. Currently, studies on the coupled atmosphere–hydrology processes predominantly use regional climate models (RCMs) or combine land surface models (LSMs) with hydrological models to investigate the intricate interaction between climate change and hydrological cycle processes [12]. Key methodological tools encompass satellite remote sensing, data assimilation, error correction, and various downscaling approaches (statistical downscaling and dynamic downscaling). Prominent models such as the Weather Research and Forecasting model (WRF), Community Land Model (CLM), Community Noah Land Surface Model with Multi-Parameterization Options (Noah-MP), and Soil and Water Assessment Tool (SWAT) are deployed, emphasizing the impact of climate change and human activities on hydrological cycle processes [13,14]. Nevertheless, there are still large uncertainties regarding the RCMs in climate change simulations and projections, especially for precipitation simulations in regions characterized by complex terrain. It is found that these uncertainties are mainly associated with the physical parameterization schemes and the lateral forcing of the RCMs [15,16]. In addition, previous studies concentrate on the influence of climate change on the hydrological process, adopting a single-directional linkage of “atmospheric circulation change–regional precipitation change–land hydrological change”. This approach falls short in accurately depicting the feedback between land surface and hydrological processes on regional climate, thereby affecting the simulation accuracy of hydrological processes in watersheds [17].
The Weather Research and Forecasting Model Hydrological modeling system (WRF-Hydro) stands as a high-resolution distributed land–atmosphere coupled model, developed by the National Center for Atmospheric Research (NCAR), with the primary aim of improving surface, subsurface, and river water redistribution and facilitating the coupling of atmospheric and hydrological models [18]. This model can operate as a standalone land surface hydrological model or can be coupled with an atmospheric model (such as WRF) to achieve a two-way feedback process between the atmosphere and land surface. Distinguishing from traditional land surface hydrological models, the WRF-Hydro model is explicitly designed to provide continuous spatially gridded information on soil temperature and moisture, evapotranspiration, water and heat exchange fluxes, and runoff [19,20]. Notably, the WRF-Hydro model has demonstrated success in numerous coupled atmosphere–hydrology studies [2,21]. Senatore et al. [22] found superior simulation performances for precipitation, surface runoff, and surface fluxes with the coupled WRF-Hydro model compared to the WRF model in the Crati River Basin. Gu et al. [20] thought that radar data assimilation can effectively improve flood simulations at small- and medium-sized basins based on the coupled WRF-Hydro model. Li et al. [23] concluded that the coupled WRF-Hydro model improved soil moisture and precipitation simulations and has potential in simulating and projecting streamflow over the Source Region of the Three Rivers. However, the great overestimation of precipitation by the coupled model leads to the fact that reproducing daily streamflow with the coupled model remains a challenge in complex terrain areas.
The main aim of this study is to investigate the feedback of land surface hydrological processes on precipitation in a large-sized basin with complex subsurface and climatic conditions based on a high-resolution coupling model. Meanwhile, based on the experimental data from Ngoring Lake and Maqu stations, the surface and hydrological parameters and parameterization schemes were modified. The scientific question addressed in this study is whether the atmosphere–land–hydrology coupling simulation after optimizing the parameterization schemes can effectively characterize the land–atmosphere interaction processes over the SRYR. To address this question, this research is structured as follows. The study area and data are arranged in Section 2. Section 3 introduces the methodology and experimental designs. A comparison between the standalone WRF and the coupled WRF-Hydro simulations follows. And then, the characteristics of coupled simulated streamflow are analyzed. Finally, the Discussion and Conclusion are presented to provide a summary and perspective of this study in Section 5 and Section 6, respectively.
2. Study Area and Data
2.1. Study Area
The SRYR, situated between 32.12° and 35.48° N and 95.50° and 103.28° E, lies in the northeastern part of the TP. The region encompasses a total catchment area of 1.22 × 10⁵ km2 and boasts a mean elevation of 4000.0 m, as displayed in Figure 1, which also serves as the configuration for the nested domains in the WRF and coupled WRF-Hydro. Positioned in the periphery influenced by the East Asian monsoon, the SRYR falls within the plateau cold climate zone, characterized by an annual mean temperature approaching 0.0 °C and annual mean precipitation ranging between 300.0 and 500.0 mm [24]. Recognized as the primary flow-producing area and water-conserving area in the middle and upper reaches of the Yellow River, the SRYR is referred to as the “Yellow River Water Tower”, taking the Tangnaihai hydrological site as the basin outlet [25]. The region predominantly comprises high mountains, plains, and hills, featuring expansive lakes, notably the largest plateau freshwater lakes in China, Zhaling Lake and Ngoring Lake [17]. The terrain is undulating, characterized by alpine meadow grassland and alpine wetland as the primary land use types. The hydrological environment influences soil composition, primarily loam and sandy loam with a coarse texture, and a widespread distribution of seasonal frozen soil.
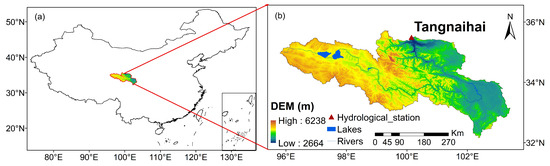
Figure 1.
The geographic location of the Source Region of the Yellow River (a) and the distribution of the hydrological site (b).
2.2. Data
This study utilizes the daily streamflow data from the Tangnaihai hydrological site, generously provided by the Yellow River Water Conservancy Bureau, spanning the period of 2012–2013. Additionally, turbulent heat fluxes, top-layer soil temperature, and soil moisture data sourced from the Ngoring Lake site [26,27] and Maqu site [28,29] from the National Cryosphere Desert Data Center are incorporated. Quality inspection is carried out for the observational data, and the data with obvious errors are processed to ensure that there are not significantly incorrect data in the deployed data.
The WRF-Hydro model necessitates a substantial volume of input data, including meteorological driving data, underlying surface data, and river network data. The meteorological driving data are mainly composed of seven variables: downward longwave and shortwave radiation, surface pressure, specific humidity, air temperature, near-surface wind speed, and precipitation rate. Given the scarcity and non-uniform distribution of meteorological observation sites over the SRYR, significant challenges arise in model driving. To address this, the Global Land Data Assimilation System (GLDAS) data, jointly developed by the National Aeronautics and Space Administration (NASA) and the National Center of Environmental Prediction (NCEP), prove invaluable. With a temporal resolution of three hours and a spatial resolution of 0.25° × 0.25°, GLDAS integrates the ground and satellite observation data, demonstrating great applicability over the SRYR [30].
In addition, the quality of precipitation data is critical to streamflow simulation, emerging as the most sensitive factor affecting streamflow variations. Therefore, a high-quality precipitation product is of considerable significance to serve as the forcing data for the WRF-Hydro model. The China Meteorological Forcing Dataset (CMFD) is a high-spatial-temporal-resolution (0.10° × 0.10°) gridded meteorological driving dataset which was developed for studying land surface processes in China [31]. The dataset integrates a variety of reanalysis, satellite remote sensing, and site observation data and is widely used in climate change and numerical simulations. The CMFD precipitation data and GLDAS non-precipitation data form the ultimate driving dataset for the model through the bilinear interpolation method [32].
The initial and boundary conditions for the WRF and coupled WRF-Hydro models are from the Final Operational Global Analysis (FNL), whose spatial and temporal resolutions are 6 h and 1.00° × 1.00°, respectively (https://doi.org/10.5065/D6M043C6, accessed on 23 November 2022). The model requisites, such as vegetation type, land use type, soil type, and other land surface information are sourced from the WRF Pre-processing System (WPS). The default soil type is substituted with the soil type dataset from Beijing Normal University (BNU), renowned for its heightened accuracy within China [33]. High-resolution river network data are from the United States Geological Survey (USGS) Hydrological data and maps based on SHuttle Elevation Derivatives at multiple Scales (HydroSHEDS), with a resolution of 90.0 m chosen to extract accurate river network information. The details of the aforementioned data are shown in Table 1.

Table 1.
An overview of the research data.
3. Methodology
3.1. The Numerical Model
3.1.1. WRF Model
The WRF is a sophisticated non-hydrostatic mesoscale numerical weather prediction model, renowned for its capability to accommodate various mesoscale and small-scale atmospheric and hydrological processes in numerical simulation research [34]. There are numerous physical parameterization schemes for the WRF model, and the applicability of schemes is different due to the variations in the weather, climate, and underlying surface conditions. The microphysical process scheme and cumulus scheme have a particularly significant impact on precipitation simulations. In addition, the quality of different reanalysis data also directly affects the effectiveness of precipitation simulation [21,22]. By testing different microphysical process and cumulus parameterization schemes using four different types of reanalysis data, it was found that the FNL data and the Thompson and Grell–Devenyi (G-D) schemes have the best applicability over the Source Region of the Yellow River (not shown in the manuscript). The Advanced Research WRF (ARW) model (version 4.1.2) for both the standalone WRF and the coupled WRF-Hydro model was employed in this research.
3.1.2. Noah-MP Model
The Noah-MP model, derived from the Noah Land Surface Model (LSM) with substantial enhancements, is a notable advancement [35,36]. It provides multiple parameterization options for the key biogeophysical processes, featuring a distinct vegetation canopy, a two-stream radiation transfer approach, and a short-term dynamic vegetation scheme. Additionally, updates to the frozen soil scheme within the groundwater model and the snow model significantly influence streamflow simulation [37]. In this study, the Noah-MP model was selected as the land surface process module of the WRF and the WRF-Hydro model.
3.1.3. WRF-Hydro Model
The WRF-Hydro model, developed as a hydrological extension package for WRF, is a new generation of a distributed hydrometeorological forecasting system with a physical basis and multi-scale and multi-parameter schemes. Serving as a linkage between the large-scale regional climate model and the refined hydrological model, it employs the LSM (Noah/Noah-MP) as a bridge. The model enhances the land surface hydrological process, focusing on the spatial redistribution of land surface water, groundwater, and river water. It demonstrates proficiency in quantitatively studying the water–heat exchange process between the atmosphere and land surface [18]. Comprising five modules, namely, surface overland flow, saturated subsurface flow, channel, reservoir routing, and the conceptual baseflow module, the WRF-Hydro model computes quasi-3D subsurface flow, accounting for both vertical and horizontal water exchange. This research utilized WRF-Hydro system version 5.1.1, and a comprehensive model description is available in [18].
3.2. Experimental Designs
3.2.1. The Parameterization Schemes in the WRF and Coupled WRF-Hydro Model
The Lambert Projection, featuring a central longitude and latitude of 99.50° E and 33.75° N, is applied in the model, incorporating two-way nested domains with horizontal resolutions of 25 km and 5 km, respectively. The vertical structure encompasses 40 levels, reaching a 50 hPa pressure top, utilizing a time step of 100 s in the outer domain. Continuous runs are initialized with lateral atmospheric boundary conditions provided by the Final Operational Global Analysis (FNL) data from the National Centers for Environmental Prediction (NCEP), as outlined in Table 1. The physics parameterization schemes for the selected WRF domains are listed in Table 2, with the cumulus parameterization exclusively employed in the outer domain [22]. Notably, routing processes at a resolution of 500.0 m are executed solely on the innermost domain within the coupled WRF-Hydro model. The simulation spans from 1 March 2013 to 1 September 2013 UTC, with the initial two months allocated as spin-up time and the remainder for analysis.
Table 2.
Physical options of WRF and coupled WRF-Hydro model.
3.2.2. The Calibration of Sensitivity Parameters in the Offline WRF-Hydro Model
Before analyzing the effects of the land–hydrological processes on the atmosphere simulation, the WRF-Hydro model is run in an offline/uncoupled way to calibrate relevant sensitivity parameters and evaluate its efficacy in simulating streamflow. Hydrological model parameters serve as the reflections of the underlying surface characteristics, and variations in default parameters’ applicability across different basins are noteworthy. In terms of the WRF-Hydro model, prior studies have categorized the sensitivity parameters governing streamflow processes into those controlling streamflow distribution and water volume and those regulating flood peaks and flood hydrographs [20]. A stepwise manual approach is adopted in calibrating the sensitivity parameters, following previous WRF-Hydro studies [42]. Given the steep slope of the SRYR, distinct from that of the Daihe River Basin, the surface retention depth (RETDEPRTFAC) is set as 0.0, and only four parameters, including the saturated soil moisture (SMCMAX), runoff infiltration parameter (REFKDT), channel Manning roughness (MannN), and overland flow roughness parameter (OVROUGHRTFAC), were calibrated within reasonable ranges to select the optimal parameter value. The calibration process considered the daily streamflow variations at the Tangnaihai hydrological station during the rainy season from 1 June to 30 September in 2012 [43].
Additionally, the water–heat exchange process is of vital importance to the understanding of the atmosphere–land–hydrology interaction process, influencing the land–surface water cycle process by modulating the evapotranspiration process. Relevant studies indicate that the default parameterization schemes of the Noah-MP model exhibit an underestimation of latent heat (LE) and an overestimation of sensible heat (H) in the alpine grassland area [44]. To rectify the issue of H overestimation, the Chen97 scheme for a sensible heat transfer coefficient is employed, while the Jarvis canopy stomatal resistance scheme enhances vegetation transpiration, improving simulated LE and achieving a more balanced distribution of heat flux between LE and H. Other parameterization scheme options applied in this study remain consistent with the default settings in the uncoupled WRF-Hydro model.
3.2.3. The Interpolation Method
In this study, a bilinear interpolation method was used to harmonize the data resolution to 0.1° × 0.1° to analyze the model’s performances for depicting the distributions of the meteorological and hydrological elements over the Source Region of the Yellow River. The bilinear interpolation is a method used to estimate the value of a function at a point, given its values at the surrounding points. The detailed calculation formula can be found in [33].
3.2.4. Evaluation Index
To evaluate the model’s simulation performance, various metrics including the Nash Efficiency Coefficient (NSE), Root Mean Square Error (RMSE), Correlation Coefficient (R), and Relative Deviation (BIAS) are employed in this research. The NSE is used to evaluate the performance of streamflow, which can penalize large errors in the simulations and give a better measure of how well the model simulations match the observational data. The NSE ranges from −1 to 1, where a value close to 1 indicates that the experiment has a better performance. The RMSE is a commonly used metric to evaluate the accuracy of the model by quantifying the differences between the observed and simulated values. A lower RMSE indicates a better performance, and it is a widely accepted metric for regression calculation. As for R, it is a measure of the linear correlation between two data sets. It ranges from −1 to 1, where 1 indicates a perfect positive linear relationship, −1 indicates a perfect negative linear relationship, and 0 indicates no linear relationship. The BIAS can be useful for understanding the relative performance of different experiments, where the magnitude of the simulation errors can vary greatly depending on the scale of the observational data. The calculation formula and optimal value of each evaluation index are shown in our previous study [45].
3.2.5. The Applicability of the WRF-Hydro Model
After a 2-month spin-up period, the uncoupled WRF-Hydro was calibrated from 1 June to 30 September in 2012, based on daily streamflow from the Tangnaihai hydrological site. As depicted in Figure 2, the simulated streamflow closely aligns with the observation, exhibiting consistency between flood and precipitation hydrographs. During the calibration period, the simulated and measured streamflow achieves an R of 0.84, NSE of 0.44, RMSE of 465.61 m3·s−1, and BIAS of −11.44%. In the validation period, R is 0.81, the NSE is 0.61, RMSE is 351.36 m3·s−1, and BIAS is −10.21%. However, the model tends to underestimate peak flows during flood season and presents some unrealistic peak flows, indicating potential issues with the base flow model and precipitation [22]. Nevertheless, the WRF-Hydro model demonstrates the ability to produce a relatively realistic hydrological regime over the SRYR; hence, the calibrated parameters are used for comparing WRF and coupled WRF-Hydro simulations.
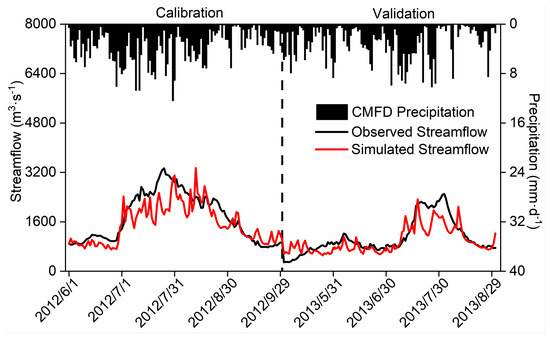
Figure 2.
The variation in simulated and observed daily streamflow (units: m3·s−1) over the Source Region of the Yellow River during the calibration and validation periods. The black dotted line in correspondence with 30 September 2012 splits the calibration and validation periods.
4. Results
The land surface hydrological cycle constitutes a crucial Earth System process. Climate change exerts influence on the global water cycle, eliciting diverse responses at the regional scale. Simultaneously, variations in the land surface process contribute to the regional and catchment-scale modification of water resource distribution and runoff [4]. Based on the coupled WRF-Hydro model, the impact of climate change on land surface hydrological processes and the feedback of the surface water cycle to precipitation are comprehensively considered, and the characteristics of the coupled atmosphere–land–hydrology process and streamflow variations over the SRYR during the rainy season of 2013 are also explored.
4.1. The Temporal Variation in Hydrometeorological Elements
Given the sparse and uneven distribution of monitoring sites over the SRYR, reanalysis products are employed in this study to examine the variation in the hydrometeorological elements. Previous studies [44,45] have demonstrated the suitability of CMFD precipitation data over the SRYR, while GLDAS data, encompassing temperature and runoff, are recognized for effectively characterizing climate change and water cycle processes over the SRYR. Therefore, CMFD and GLDAS are utilized as reference datasets (denoted as Reference) for analyzing the regional mean simulation results in the following study.
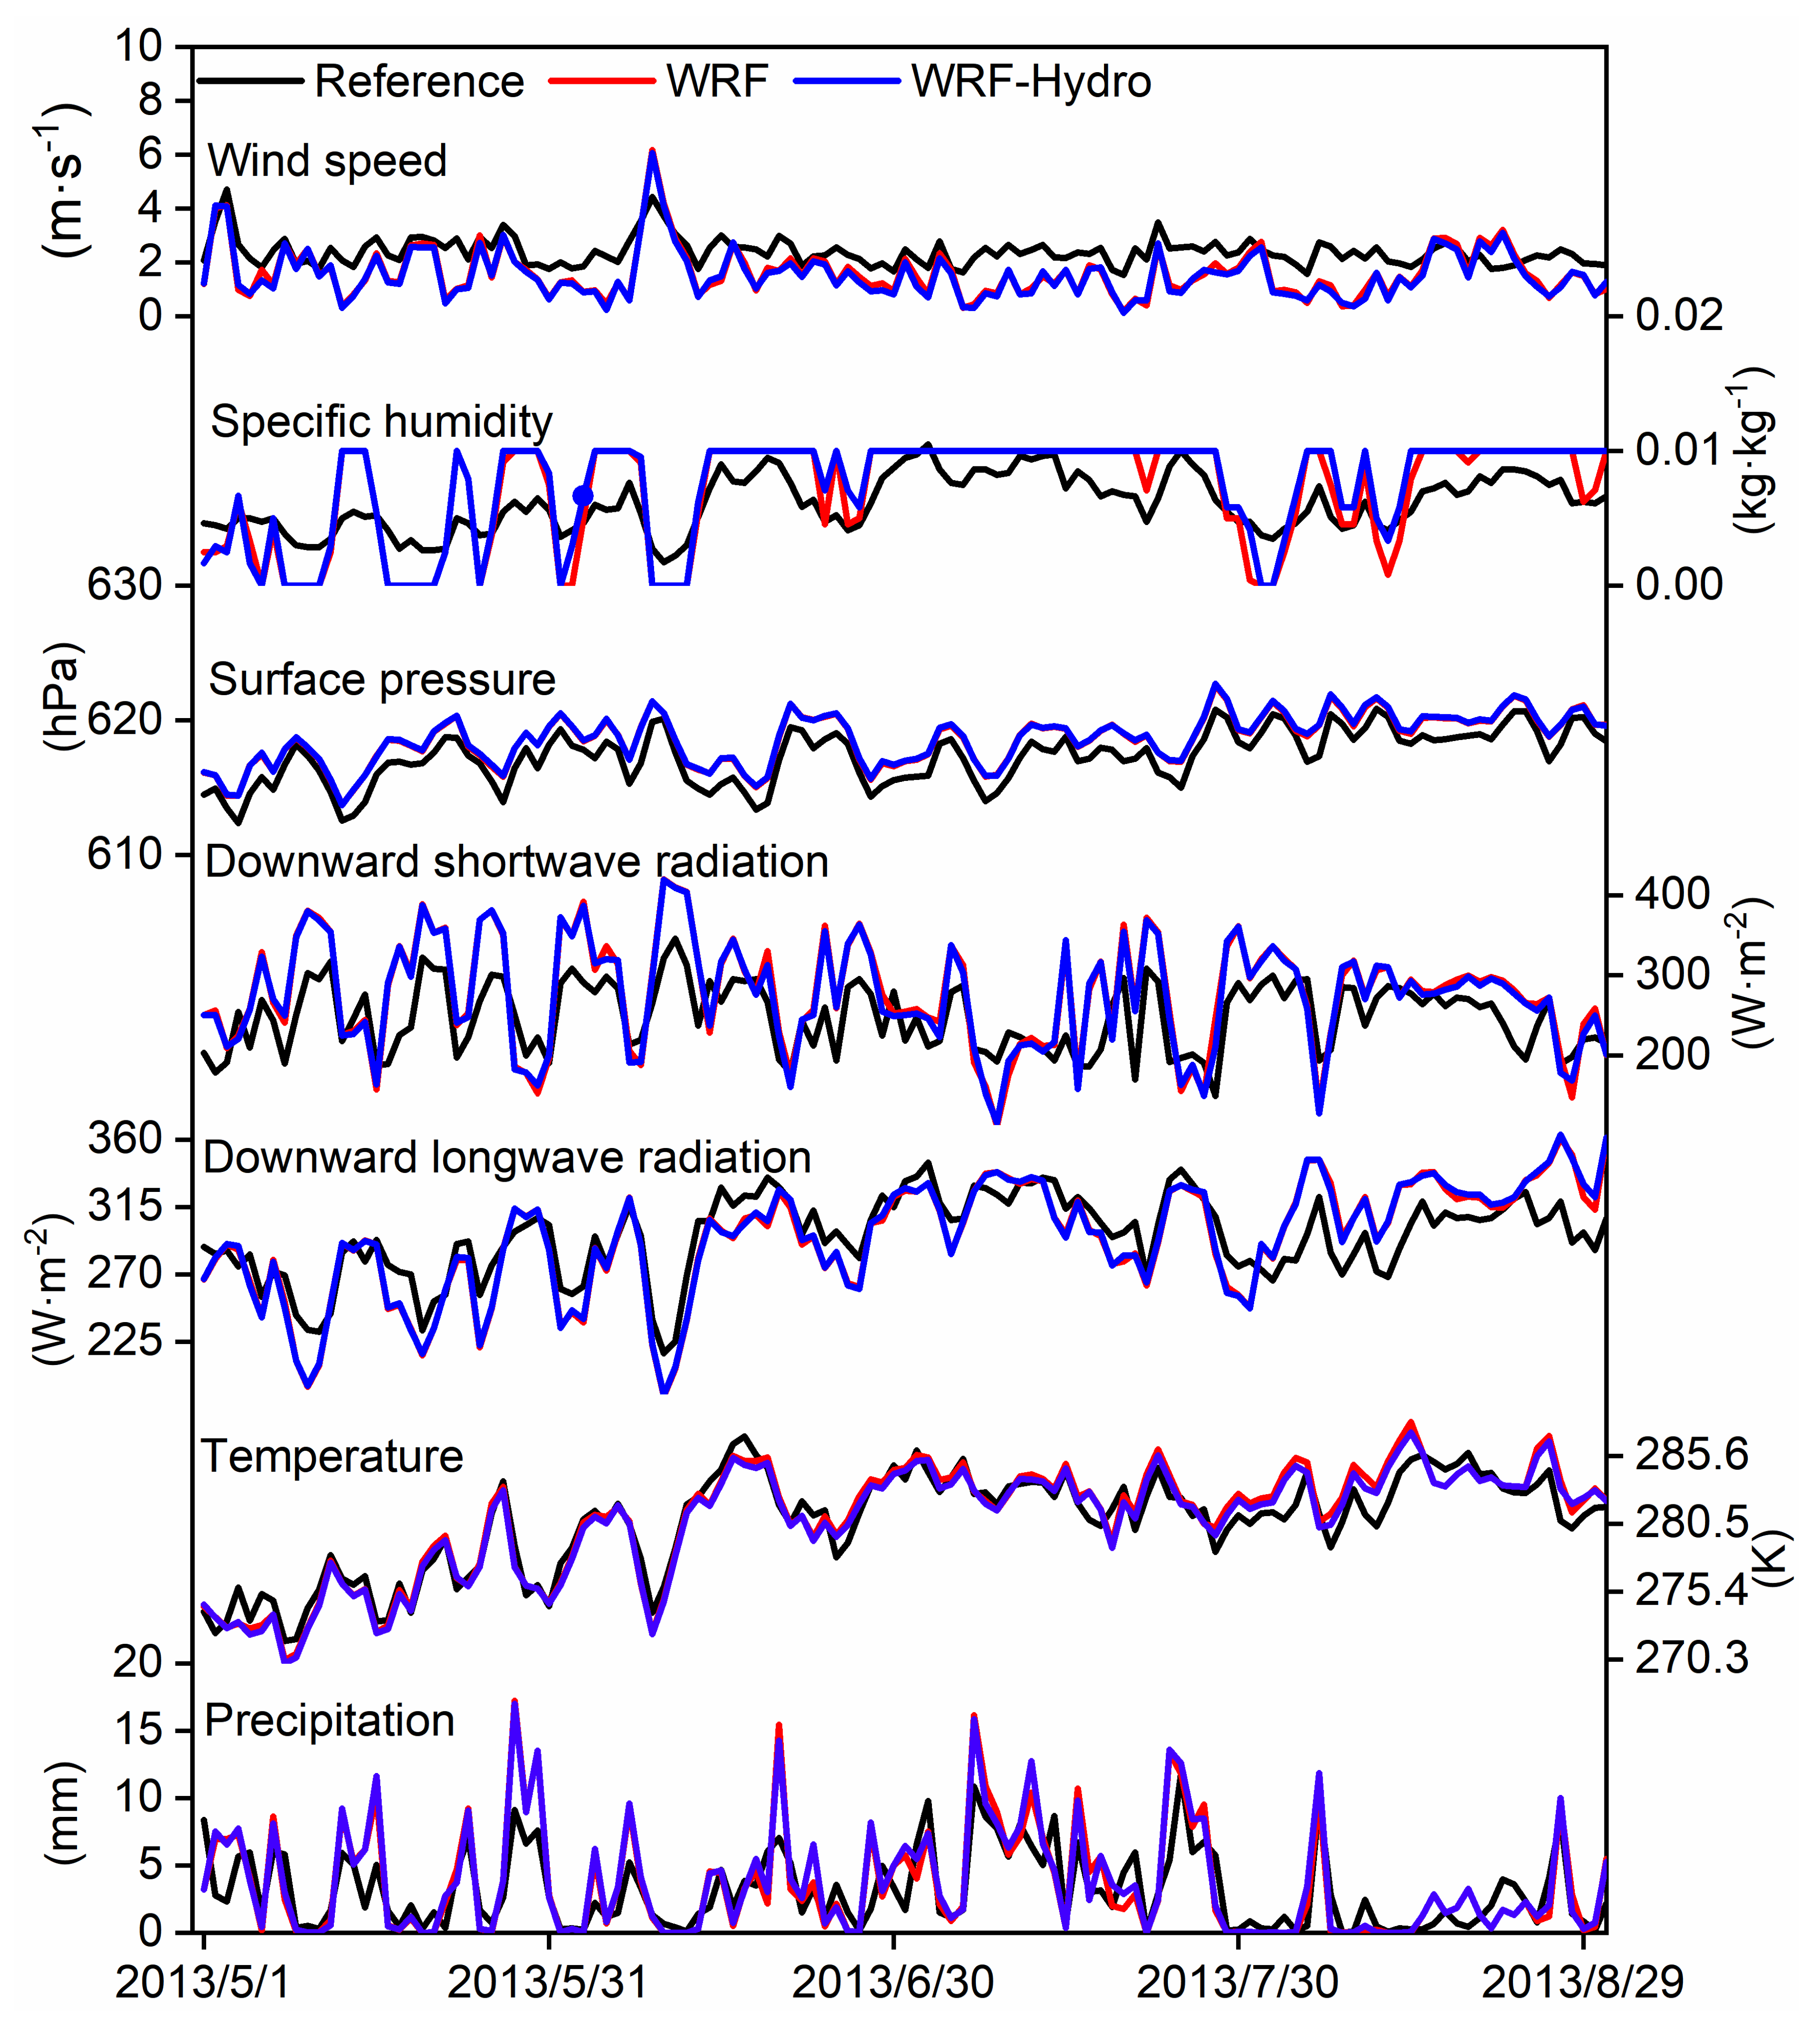
Figure 3 shows the time series of regional mean meteorological and hydrological elements. It exhibits that both the WRF and coupled WRF-Hydro models can effectively capture the evolution characteristics of these elements over the SRYR. Compared with the standalone WRF model, the coupling process results in a slight increase in the wet deviation of precipitation, with an average RMSE of 2.51 mm. However, it enhances the simulation of temperature and downward longwave and shortwave radiation to a certain extent. The simulations of surface pressure, specific humidity of 2 m, and wind speed near the ground exhibit minimal differences between the two experiments. Notably, the coupling process elevates soil moisture levels by accounting for the terrestrial vertical and lateral flow of soil water in three-dimensional space, consequently leading to larger simulated values for evapotranspiration and precipitation. Table 3 depicts the evaluation indices of diverse meteorological and hydrological variables simulated by WRF and WRF-Hydro models over the SRYR. Both models, especially WRF-Hydro, demonstrate good overall performance in simulating various hydrometeorological elements, with high correlation coefficients and generally low RMSE values.

Figure 3.
The time series of the mean meteorological and hydrological elements simulated by the WRF and coupled WRF-Hydro models from 1 May 2013 to 31 August 2013.
Table 3.
The evaluation indices for hydrometeorological elements’ simulations.
The land–atmosphere water and heat exchange processes exert influence on surface soil moisture through alterations in evapotranspiration, consequently impacting the surface energy and hydrological cycle [46]. To ensure data comparability, the typical sunny/cloudy days at Ngoring Lake (lakeside underlying surface) and Maqu (grass underlying surface) sites are selected based on characteristic downward total radiation patterns throughout the entire simulation period. The screening methods for typical sunny/cloudy days are consistent with the work of Zhang et al. [47].
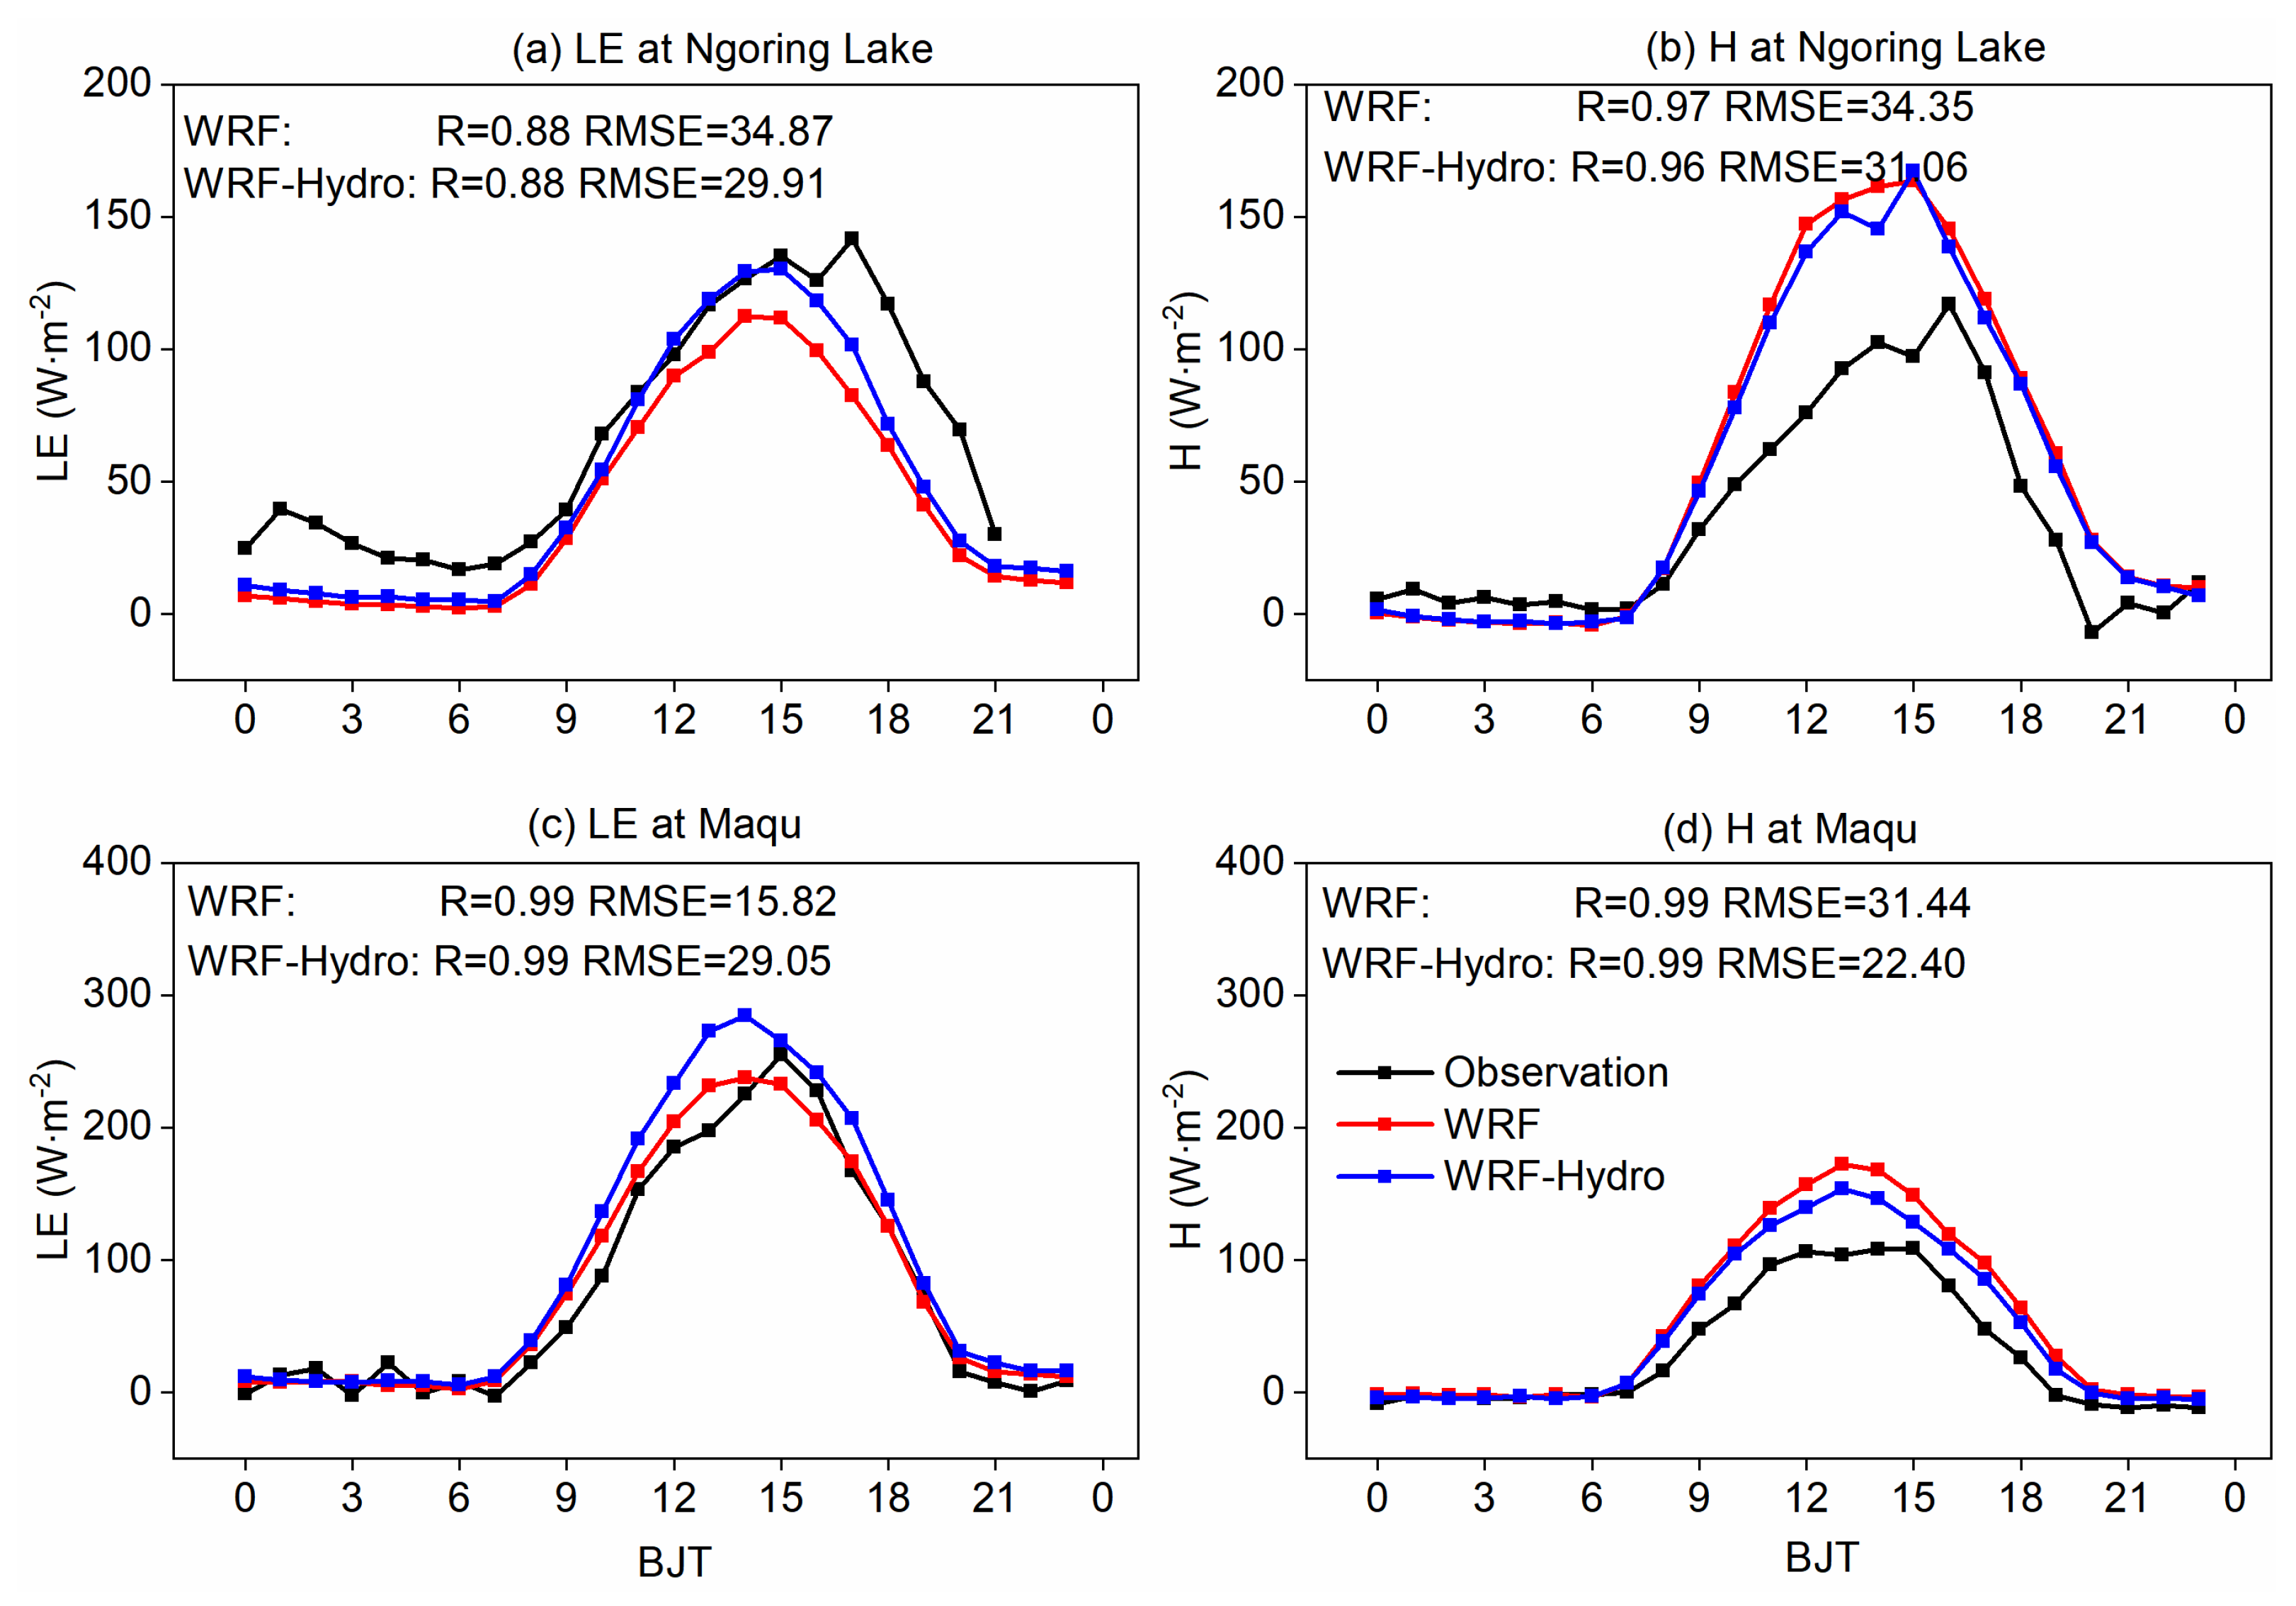
Figure 4 illustrates the diurnal variation characteristics of the LE and H simulated by both the WRF and coupled WRF-Hydro models on typical sunny days, where the land–atmosphere water and heat exchange processes are notably active. The results at the Ngoring Lake site show that the coupled WRF-Hydro model produces LE and H values more consistent with measurements, resulting in reduced RMSE values of 29.91 W·m−2 and 31.06 W·m−2 compared to WRF simulations. Conversely, at the Maqu site, the coupled process amplifies the deviation in LE simulations, attributed to the overestimation of evapotranspiration, while effectively mitigating the issue of overestimated H.
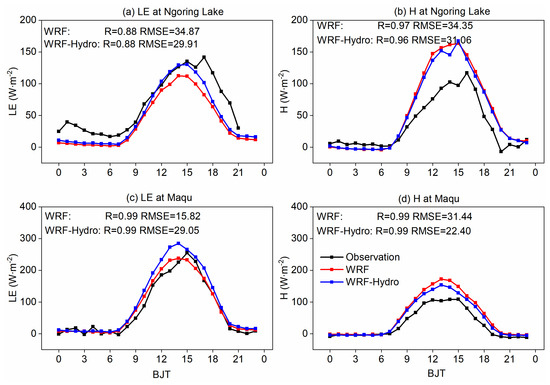
Figure 4.
Comparison of turbulent fluxes (units: W·m−2) between WRF-Hydro/WRF and observations on typical sunny days at Ngoring Lake (a,b) and Maqu (c,d) sites.
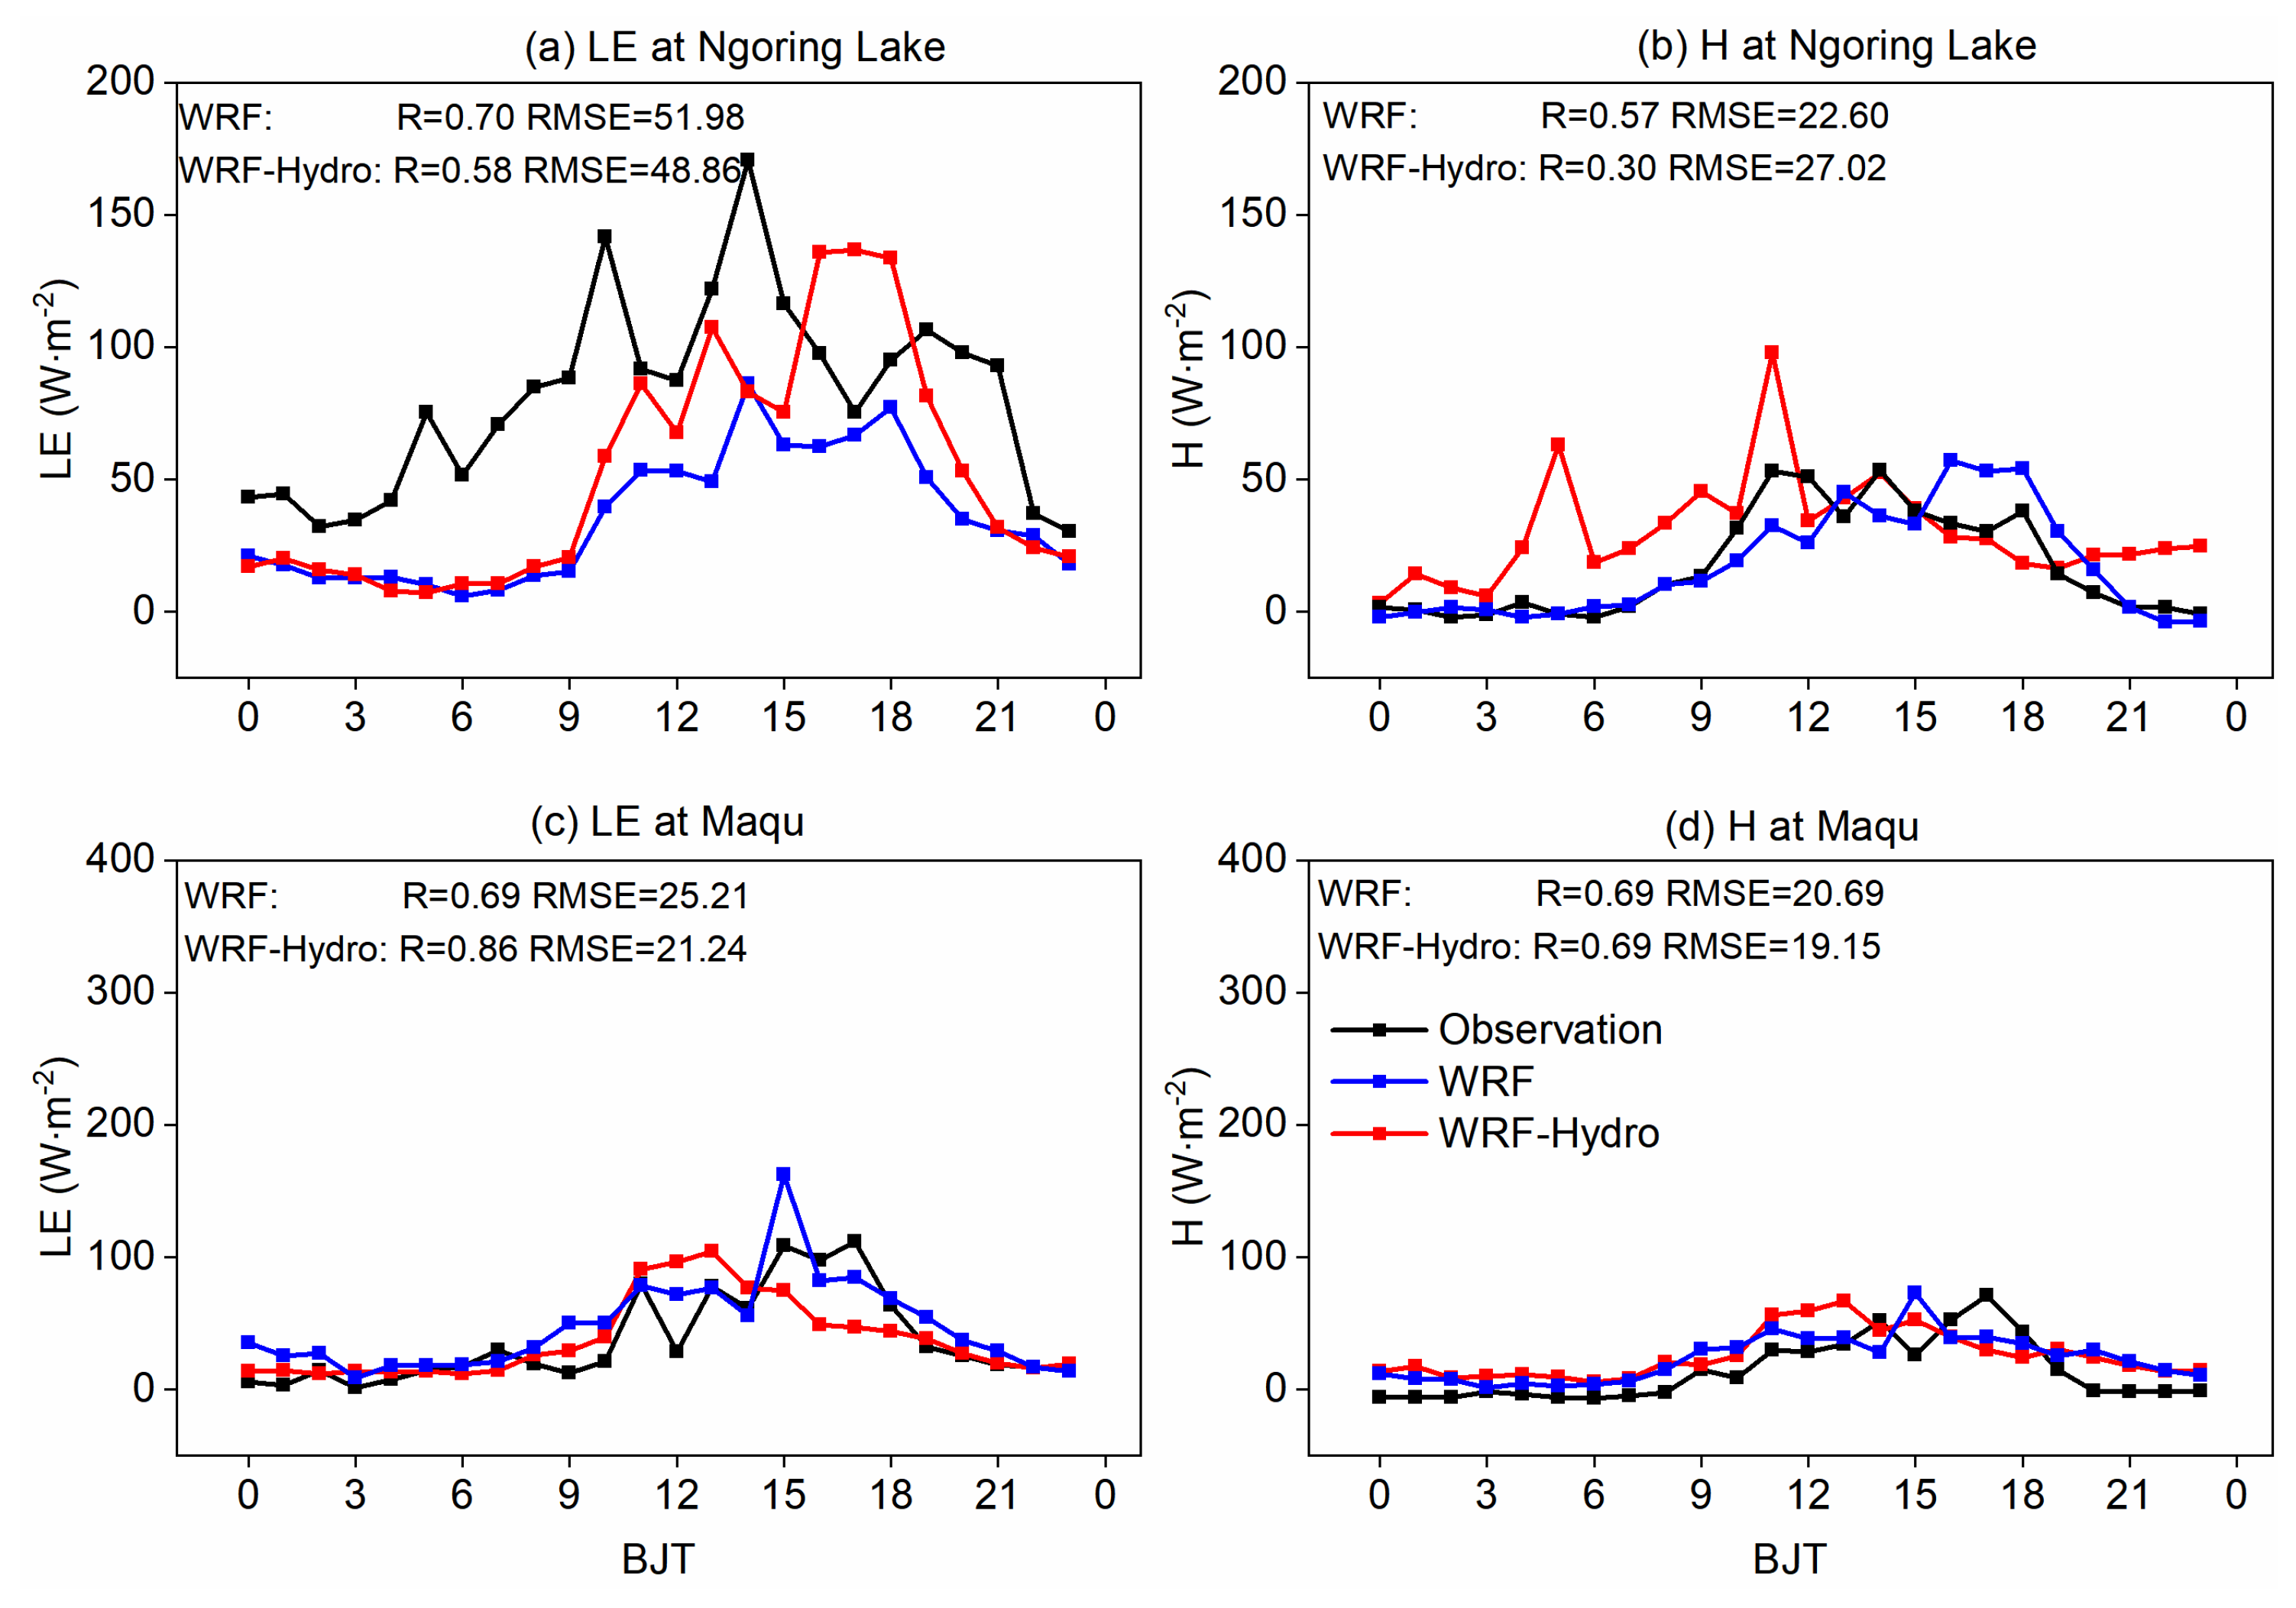
Figure 5 demonstrates the diurnal variation characteristics of the LE and H on typical cloudy days, characterized by more complicated weather conditions and physics processes. During these days, the agreement between turbulent flux simulation results and observations is less favorable compared to typical sunny days. The simulations at both sites indicate that the coupled process can reduce the RMSE in LE and H, with a mean RMSE of 29.48 W·m−2 and 26.55 W·m−2, respectively. Overall, the coupled WRF-Hydro simulations exhibit enhancements in simulating surface heat flux variables, attributed to the incorporation of lateral terrestrial water flow in the hydrological process.
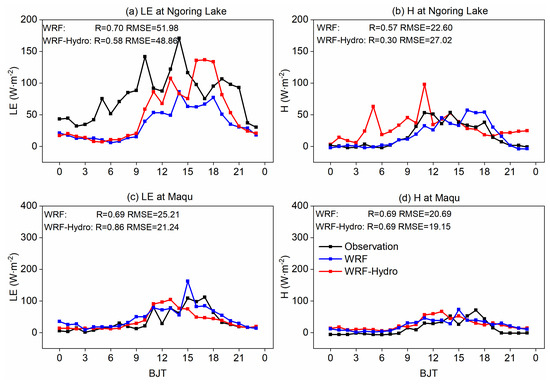
Figure 5.
As in Figure 4, but for the typical cloudy days.
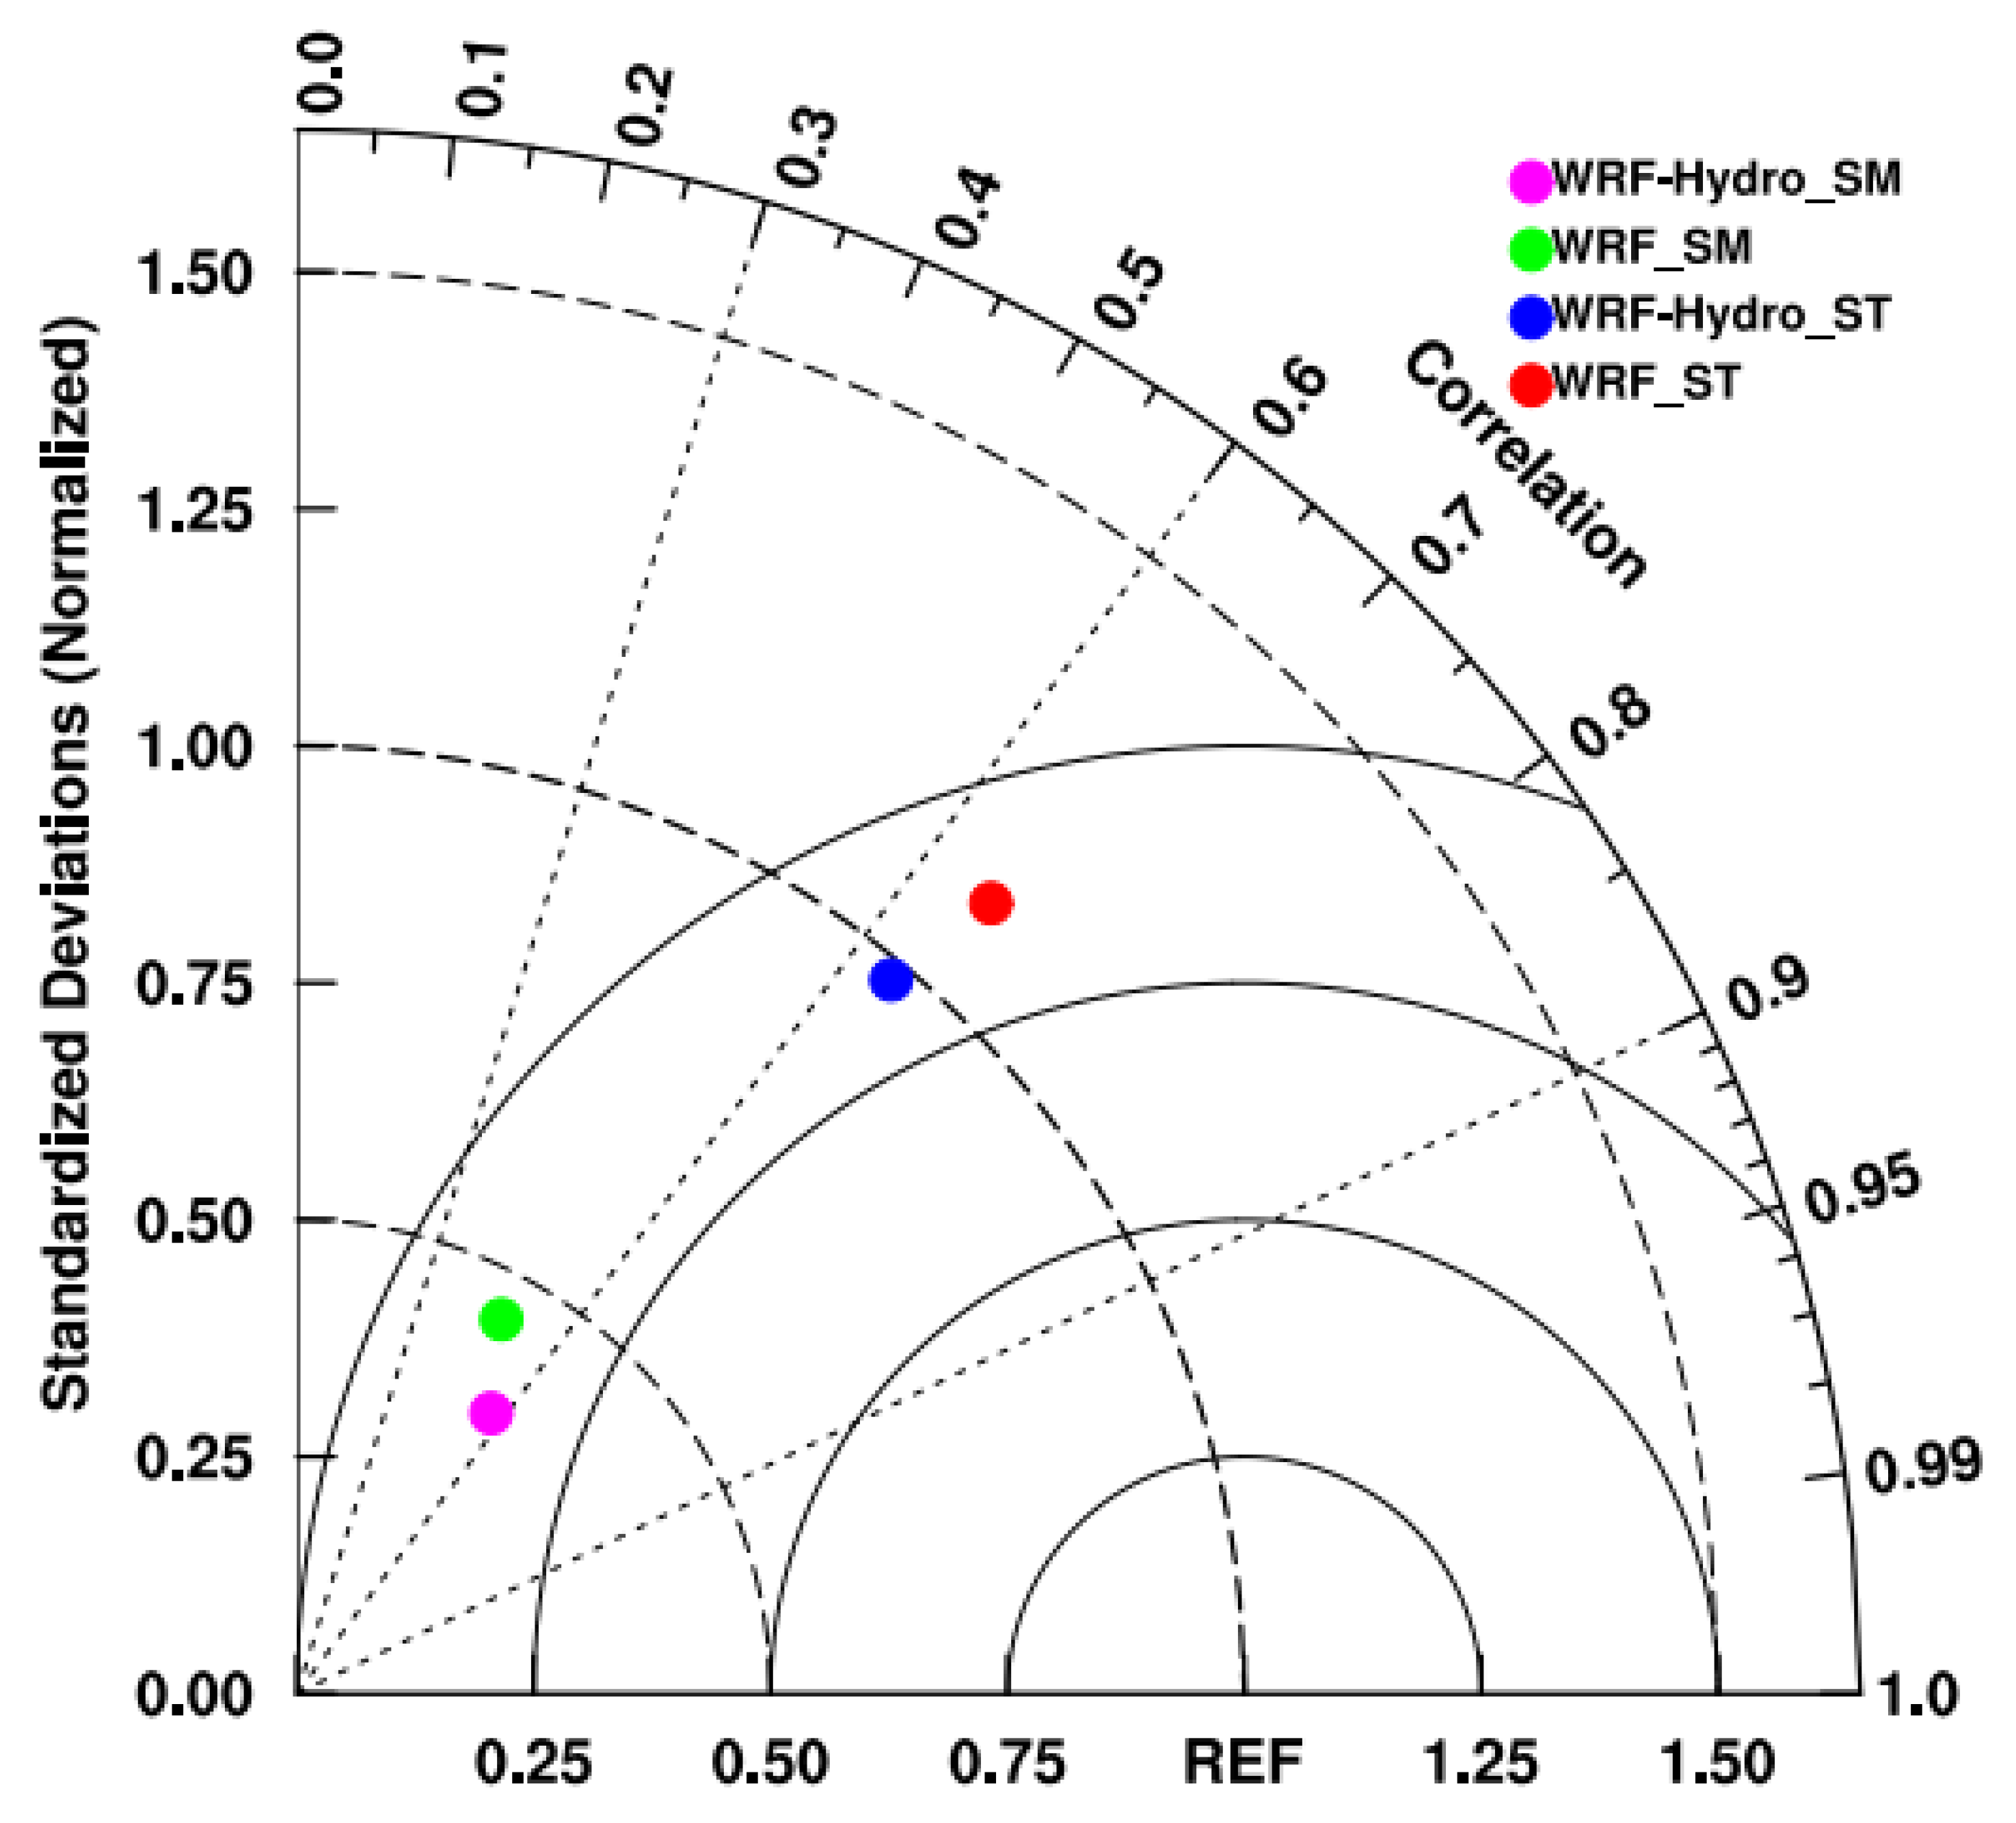
Furthermore, soil temperature and moisture play an important role in influencing land surface evaporation and groundwater processes, directly or indirectly affecting the land–hydrology process. The Taylor diagram [48] provides a visual assessment of model performance by comparing the bias and correlation of model simulations to observations. It highlights which models perform well in simulating the climate variable and which ones may require improvement or further calibration. Therefore, the analysis of top-layer soil temperature and moisture at the Maqu site is conducted by Taylor diagrams in Figure 6, leveraging available observed data. The results display a commendable agreement between the simulated and observed soil temperature, albeit with a notable discrepancy in August, attributed to deviations in downward shortwave radiation and temperature. The coupling process reduces the RMSE of soil temperature simulation (from 5.18 to 4.22 K), indicating improved accuracy through the comprehensive consideration of soil water content variation. In addition, the WRF-Hydro model exhibits a prolonged soil moisture memory compared to standalone WRF, resulting in significantly higher simulated soil moisture values in WRF-Hydro, attributable to the inclusion of subsurface lateral flow in the WRF-Hydro model. Nevertheless, the simulated top-layer soil moisture in both experiments does not align with observations and struggles to capture the response of soil moisture to precipitation. Furthermore, the uncertainty introduced by the site-specific results necessitates verification through spatial distribution analysis.
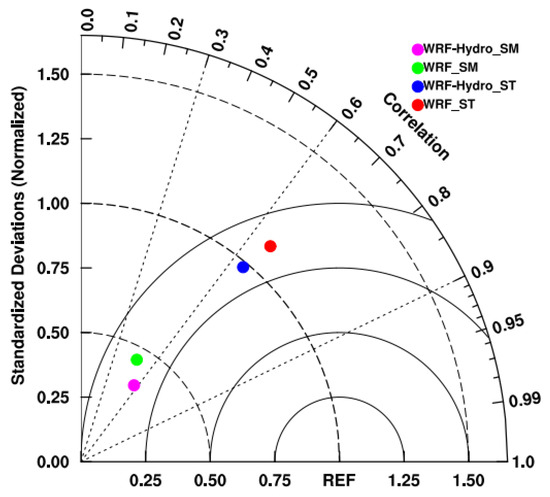
Figure 6.
Taylor diagrams of correlation coefficients and standard deviations for daily soil temperature and soil moisture at Maqu site among simulations with observations from 1 May 2013 to 1 September 2013.
4.2. The Spatial Distribution of Hydrometeorological Elements
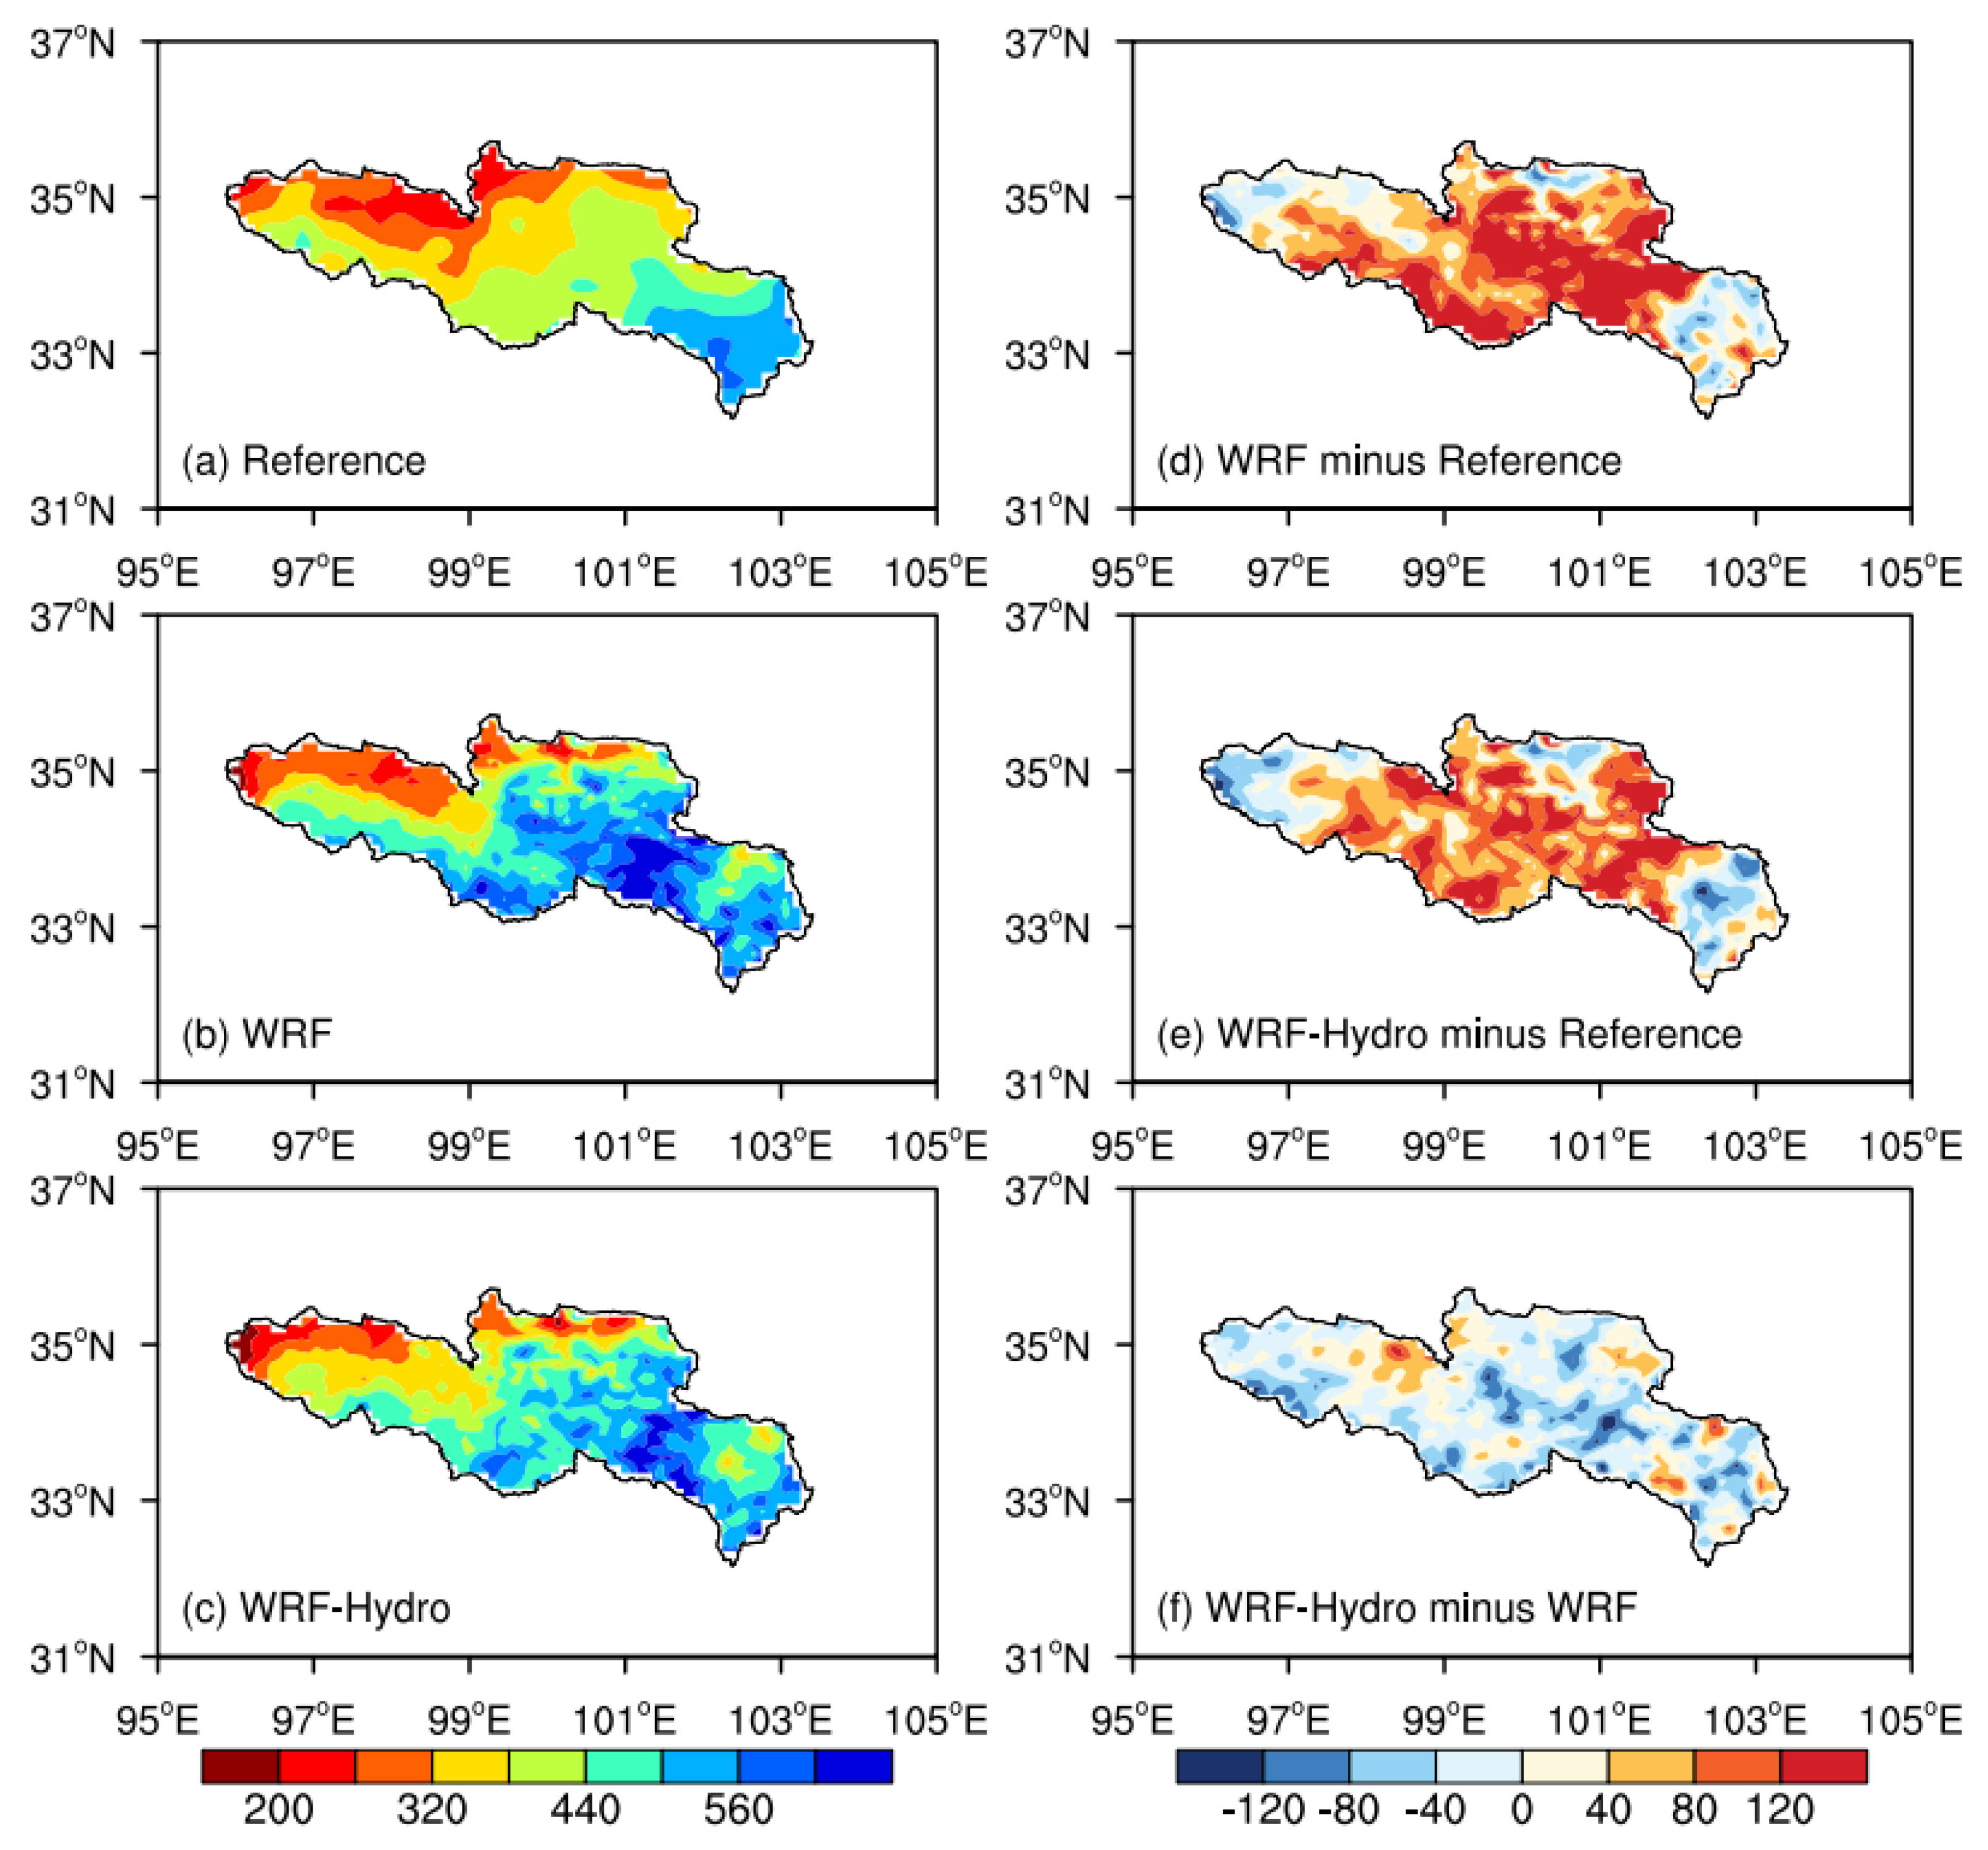
Moreover, the spatial distribution of the accumulated precipitation for the CMFD reference data (denoted as Reference), WRF, and coupled WRF-Hydro, along with their discrepancies, is displayed in Figure 7. The precipitation patterns underscore a pronounced reliance on topography, showing a decreasing trend from southeast to northwest over the SRYR. Both WRF and coupled WRF-Hydro demonstrate enhanced capabilities in capturing precipitation distribution characteristics. However, both simulations exhibit a considerable wet bias, particularly in the Jiuzhi and Maqu areas, coupled with a dry bias in the southeastern SRYR. The coupled WRF-Hydro, in contrast to the standalone WRF, incorporates subsurface lateral flow considerations, resulting in increased soil moisture and a more rational spatial distribution of soil water. This, in turn, engenders a feedback effect on precipitation, contributing to a mean wet bias of 16.63 mm compared to WRF simulations.
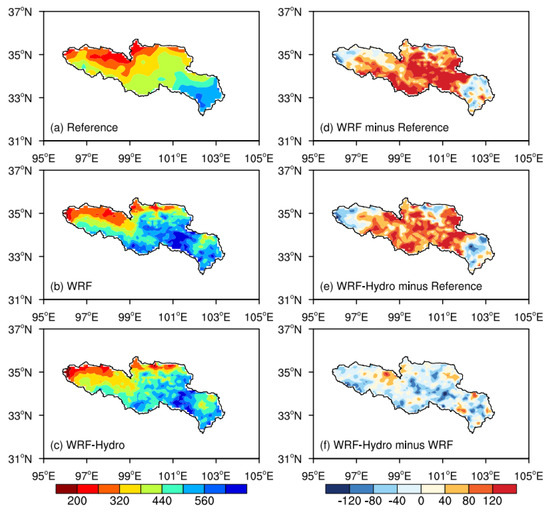
Figure 7.
The spatial distribution of the accumulated precipitation (units: mm) in the time interval 1 May 2013 to 31 August 2013 with (a) observation, (b) the standalone WRF simulation, (c) the coupled WRF-Hydro simulation, and difference maps for (d) WRF minus observation, (e) WRF-Hydro minus observation, and (f) WRF-Hydro minus WRF.
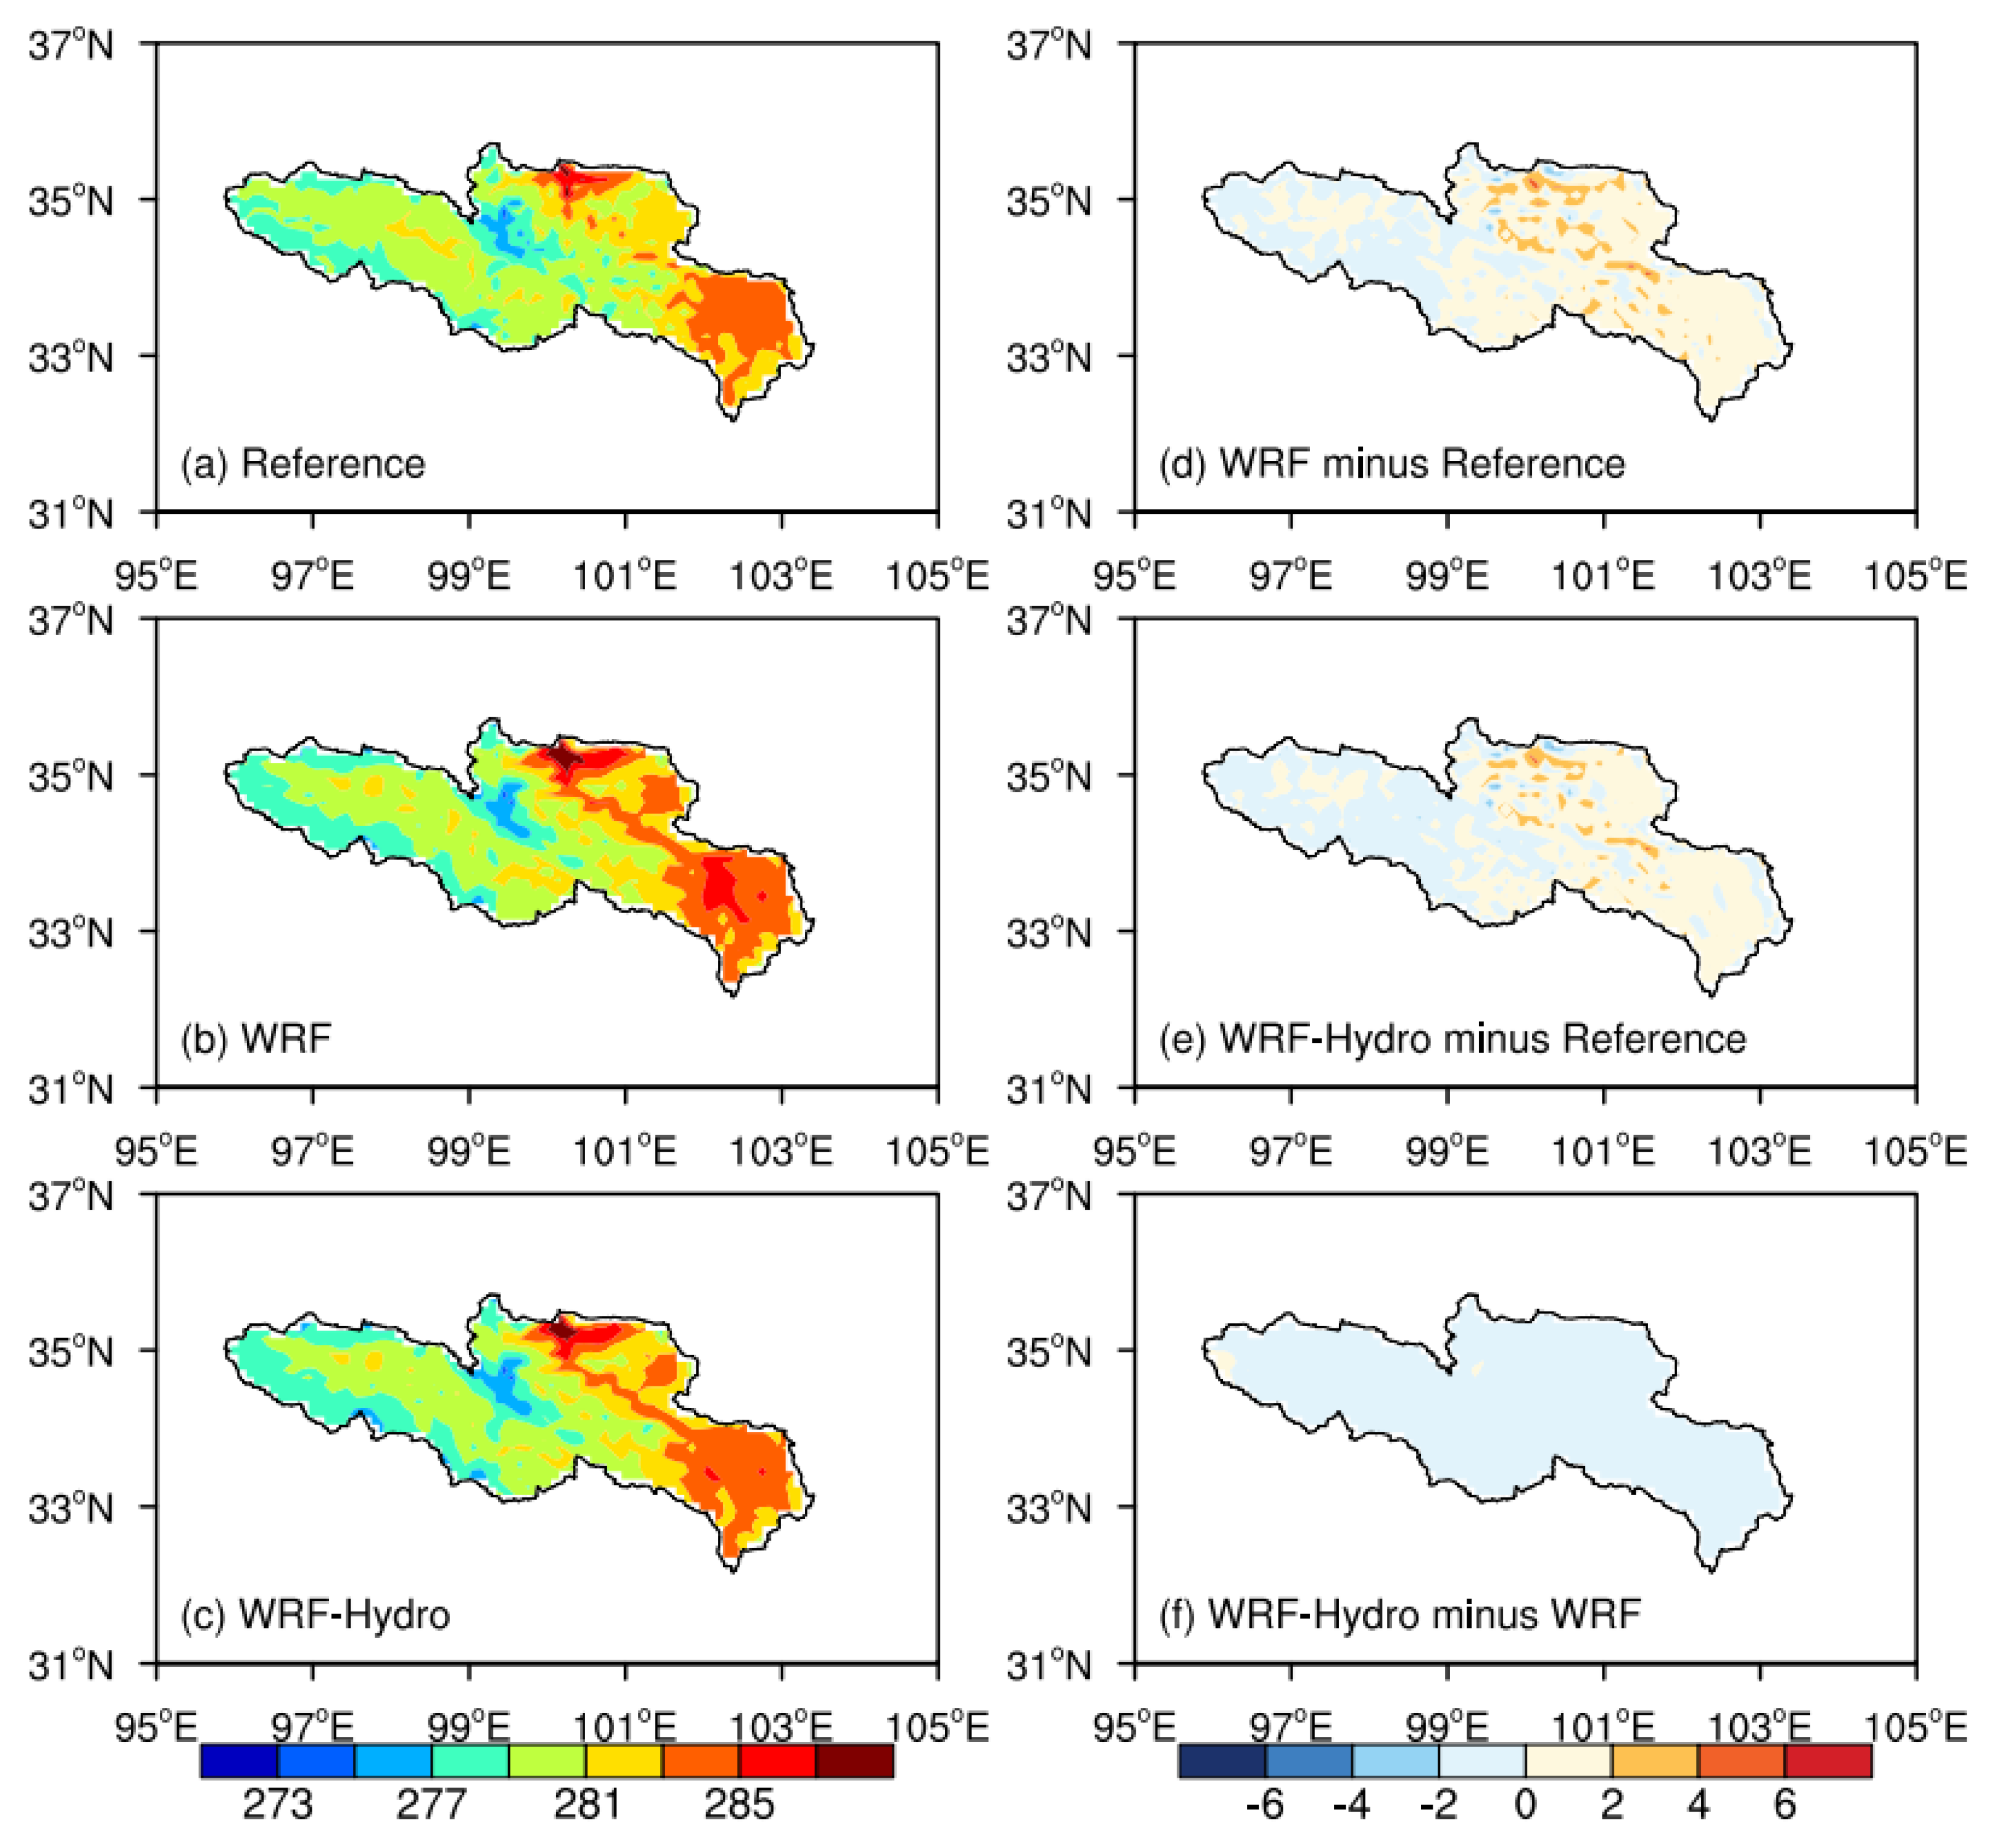
Concerning temperature, the spatial patterns of the mean 2 m air temperature during the simulated period are shown in Figure 8. The temperature spatial distribution presents gradient characteristics, with elevated temperatures observed in flat regions and lower temperatures in alpine areas. Both experiments adeptly capture the temperature distribution characteristics. On the whole, the simulated temperature tends to be relatively higher, particularly in the northeast area of the SRYR. The regional mean bias is 0.44 K for the standalone WRF and 0.15 K for the coupled WRF-Hydro, indicating a slight reduction in the mean temperature deviation in the coupled simulation.
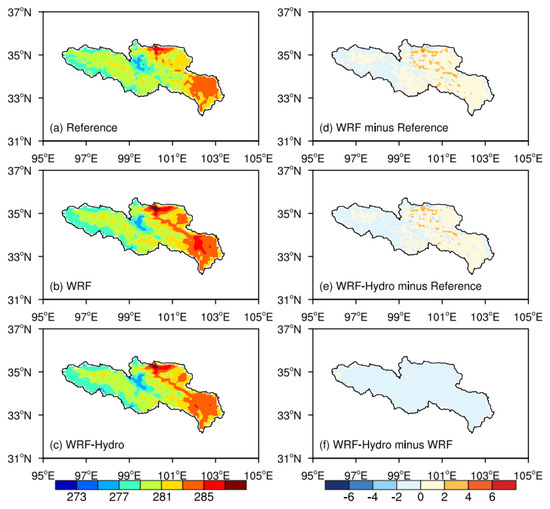
Figure 8.
As in Figure 7, but for the mean temperature (units: K).
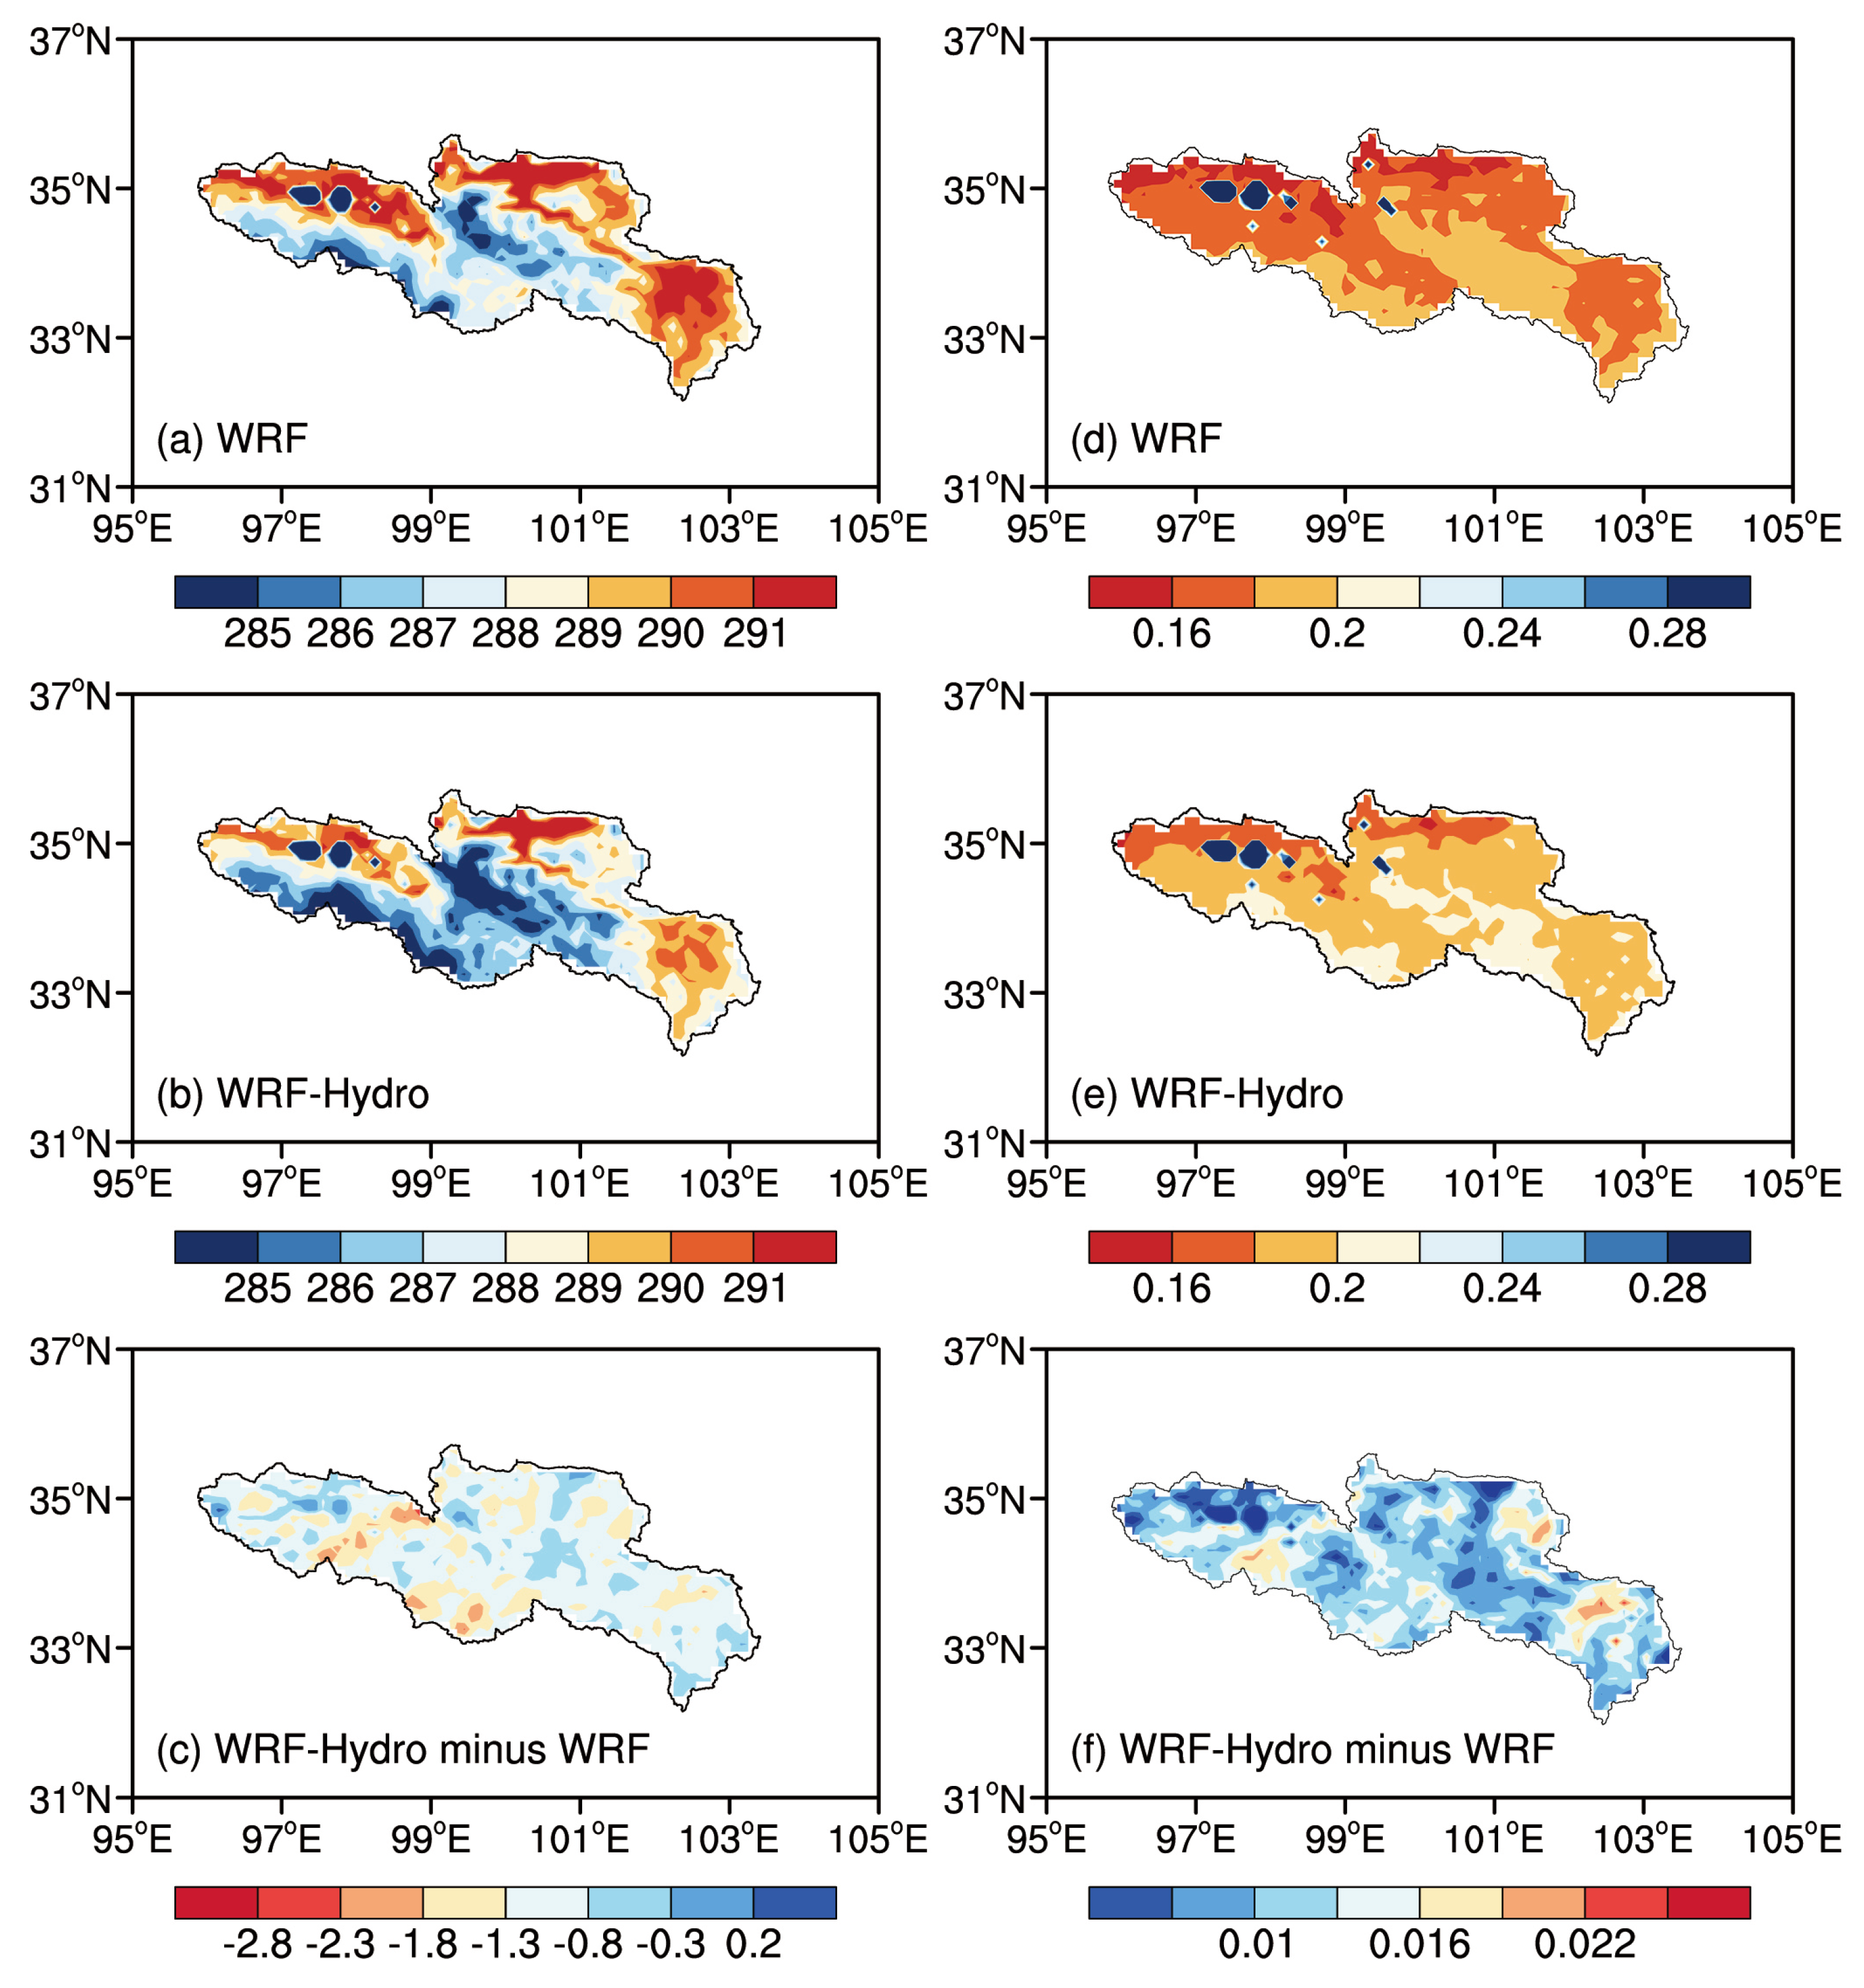
Soil temperature serves as an important parameter in the land surface process, providing a direct reflection of the thermal state of the land. The fluctuations in soil temperature have a consequential impact on the movement and phase transitions of surface soil water, consequently influencing the surface hydrological cycle [49]. Simultaneously, soil moisture plays a vital role in land–atmosphere interactions. Functioning as a reservoir for heat and moisture, soil moisture exhibits remarkable memory, retaining information from weeks to months, and subsequently influencing atmospheric conditions through the remembrance of preceding atmospheric perturbations.
The spatial distribution characteristics of top-layer soil temperature (Figure 9a–c) and moisture (Figure 9d–f) during the 2013 rainy season over the SRYR are analyzed in Figure 9. Given the high altitude and substantial diurnal temperature fluctuations over the TP, the mean temperature is lower than that of the inland areas, with lower soil temperature closer to the plateau’s interior. Both simulations adeptly illustrate the characteristic of lower temperatures in the lake area compared to the surroundings. The coupled WRF-Hydro reduces the simulated surface soil temperature, exhibiting a cold deviation of 1.07 K, with potential implications for atmospheric water vapor convergence via land–atmosphere interactions. Regarding soil moisture, both experiments show wet centers in the Zhaling Lake and Ngoring Lake areas. The coupled WRF-Hydro model, influenced by terrestrial lateral water and soil moisture redistribution processes, demonstrated a more reasonable spatial distribution of soil water content over the study region. The simulations of soil moisture from WRF-Hydro significantly exceed those of WRF, presenting a wet deviation of 0.02 m3/m3. On the whole, the areas surrounding the two lakes in the SRYR function as cold and wet centers during the simulation period, and the coupled simulations aptly capture the variation characteristics of soil temperature and moisture.
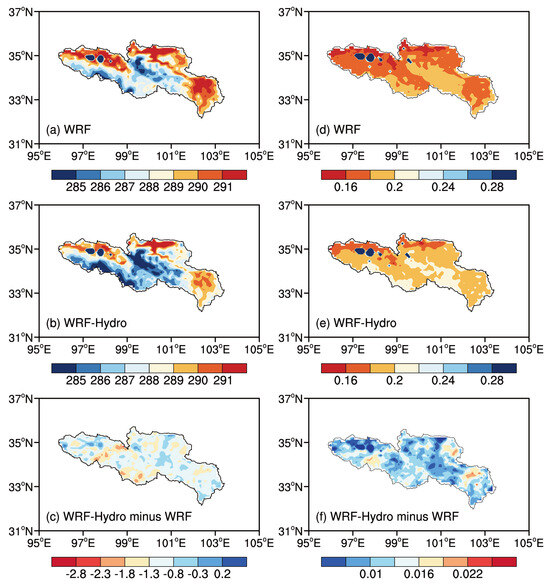
Figure 9.
The spatial distribution of the mean top-layer (0–10 cm) soil temperature (units: K) in the time interval 1 May 2013 to 31 August 2013 with (a) the standalone WRF simulation, (b) the coupled WRF-Hydro simulation, and the difference map for (c) WRF-Hydro minus WRF; (d–f) are the same as (a–c), but for top-layer soil moisture (units: m3/m3).
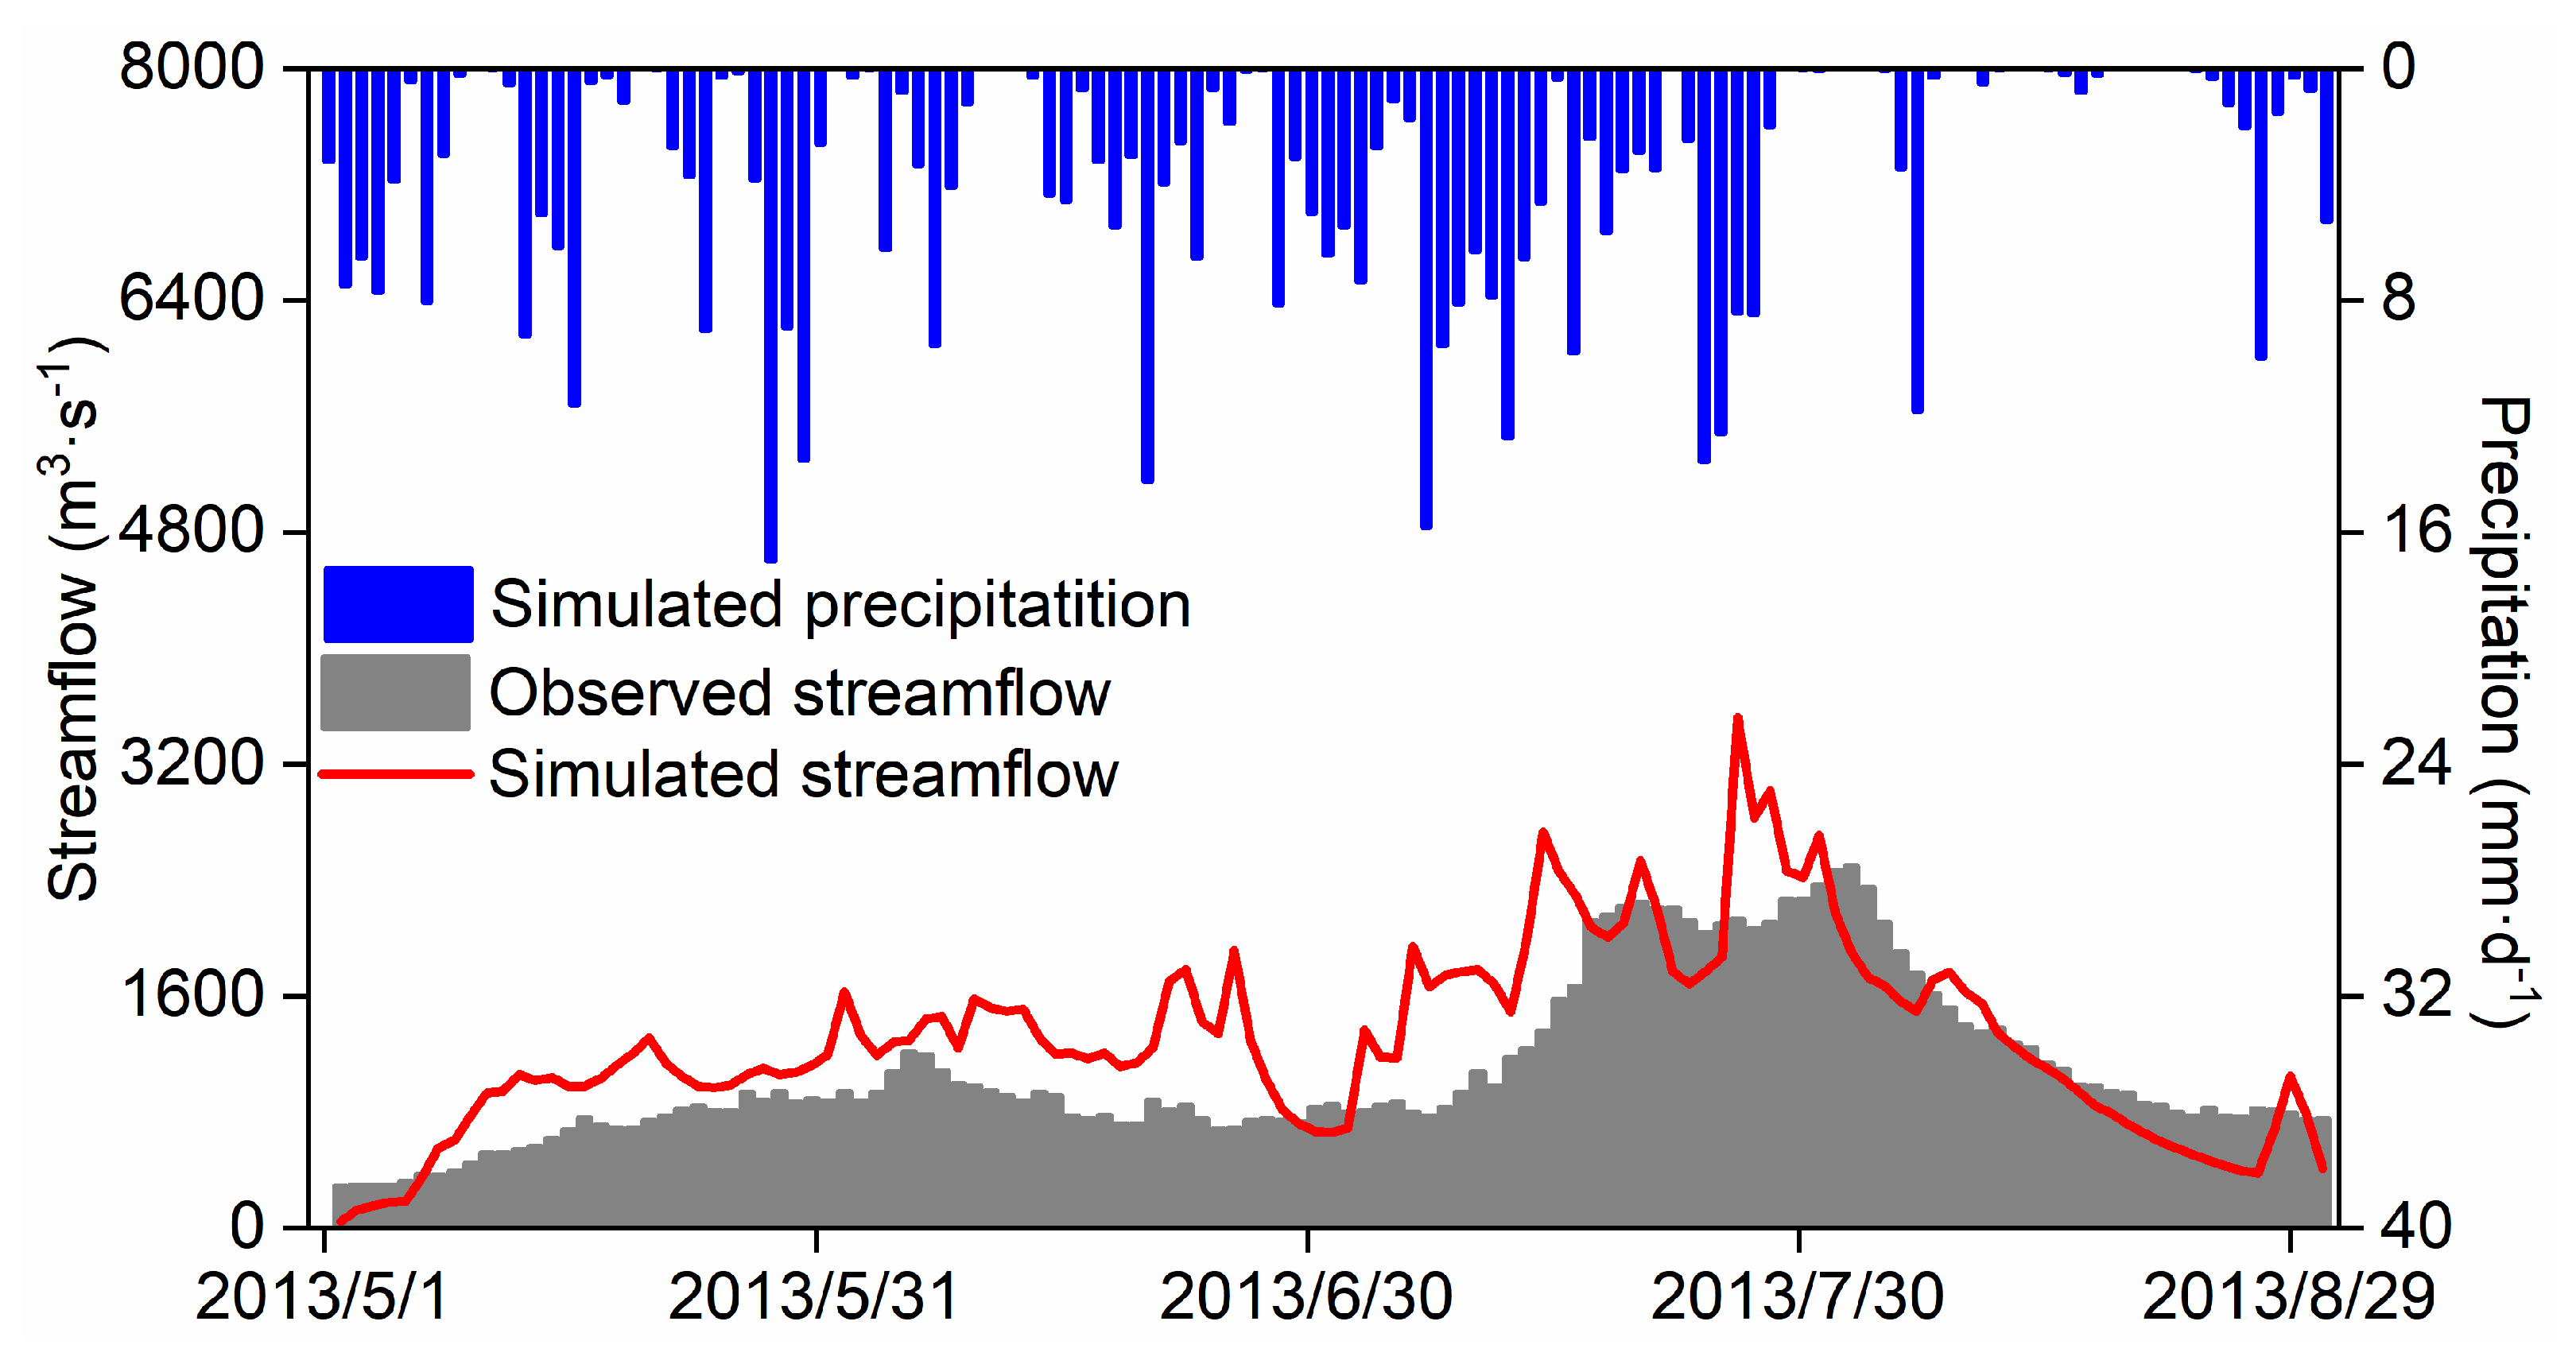
4.3. The Time Series of the Streamflow Simulated by the Coupled Model
The time series depicting the coupled simulated streamflow for the 2013 rainy season, where direct meteorological site observations are not required, is presented in Figure 10. The coupled model adeptly captures the temporal variation in observed hydrographs, exhibiting an R of 0.77. However, reproducing daily streamflow with the coupled model poses a challenge, yielding an NES of 0.33 and RMSE of 458.85 m3·s−1. The substantial overestimation of coupled simulated streamflow, particularly in peak flow reproduction, is a notable limitation. This performance degradation primarily stems from the WRF-Hydro model’s extreme sensitivity to precipitation data quality, where the RMSE of precipitation is merely 2.51 mm, contrasting with the considerably higher RMSE of streamflow. Furthermore, this discrepancy may arise from distinct frequencies of Noah-MP invocation in uncoupled calibration and coupled runs. In uncoupled simulations, Noah-MP is typically invoked at the physical time step of the hydrological model, while in coupled simulations, it is invoked at the physical time step of the WRF model. This leads to more water traversing down-slope or entering the channel before infiltration occurs again, contributing to elevated streamflow [22].
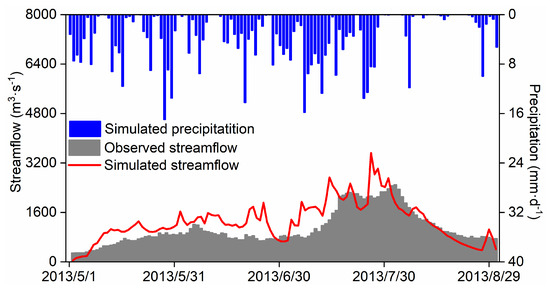
Figure 10.
The observed and coupled WRF-Hydro simulated streamflow (units: m3·s−1) for the period 1 May 2013 to 31 August 2013.
5. Discussion
Based on the standalone WRF and coupled WRF-Hydro models, a high-resolution atmosphere–land–hydrology coupling model was constructed with various data over the SRYR. In this study, the key variables associated with atmosphere–land–hydrology coupling processes were compared and analyzed to evaluate the streamflow simulation capability of the coupled model. The results reveal that the WRF-Hydro model successfully reproduces the daily streamflow, yet refinement is warranted for a more nuanced depiction of the hydrograph, particularly regarding underestimation and steep changes during flood peaks. This limitation underscores the need for an in-depth exploration of groundwater and soil water content dynamics to explain their influences on streamflow. Future research endeavors should encompass a comprehensive analysis of land surface water cycle processes to enhance our understanding.
In addition, a significant overestimation of streamflow is observed in the coupled model. To explore the factors influencing this performance degradation, a sensitivity analysis is conducted by using different combinations of atmospheric forcing data and the uncoupled WRF-Hydro model (not shown in the manuscript). The results show that the coupled simulated precipitation data introduces slight deviations cumulatively leading to a substantial error in streamflow simulation (RMSE of 2.51 mm for precipitation and 458.85 m3·s−1 for streamflow). While using the coupled simulated non-precipitation data and CMFD precipitation, the simulated streamflow is close to the observations, which suggests that accurate precipitation is recommended as the forcing data for streamflow simulations over the SRYR. Presently, reproducing daily streamflow over the Tibetan Plateau with the coupled model remains a challenge [25,50]. Studies have indicated that advanced data assimilation methods have the potential to enhance precipitation forecasting accuracy, thus fostering advancements in atmosphere–land–hydrology simulations [20]. Incorporating satellite and radar data into the WRF model in future studies offers a potential avenue for improving precipitation and streamflow simulation and projection.
The inaccurate estimation of initial soil moisture is also a limitation for streamflow simulation. Studies found that streamflow is sensitive to early rainfall, which may influence the reconstruction of later flood peaks [20]. The observational sites over the SRYR were usually established on flat terrain with moist soils and rivers passing through, where the lateral flow of soil water flows in, not out. As a result, improvements in initial soil water content accuracy help capture streamflow over this region.
In future studies, the consideration of improving the accuracy of initial soil moisture and precipitation data will not only help the WRF-Hydro coupled model to simulate streamflow but also serve as an effective tool in interdisciplinary flood simulation studies.
6. Conclusions
This study conducts a comparative analysis of key variables associated with the coupled atmosphere–land–hydrology processes over the SRYR during the 2013 rainy season. The primary focus is on investigating the impacts of climate change on land surface and water cycle processes, as well as the feedback of the land surface hydrological cycle to precipitation. The following main conclusions have been drawn:
- (1)
- The uncoupled WRF-Hydro model effectively characterizes the variability of streamflow over the SRYR basin, demonstrating an R of 0.84 and an NSE of 0.44 during the calibration period and an R of 0.81 and an NSE of 0.61 during the validation period.
- (2)
- Both the standalone WRF and coupled WRF-Hydro models indicate reasonable performance in reproducing variables associated with atmosphere–land–hydrology processes over the SRYR. The consideration of soil water lateral flow in the coupling process significantly reduces biases in water–heat exchange fluxes, soil temperature, and soil moisture simulations, with mean RMSE values of 32.27 W·m−2, 24.91 W·m−2, 4.22 K, and 0.06 m3/m3, respectively.
- (3)
- The coupled model success captures the streamflow variation. Nevertheless, reproducing daily streamflow with the coupled model remains a challenge, yielding an NSE of 0.33 and an RMSE of 458.85 m3·s−1.
The main findings in this work indicate that the WRF-Hydro model has the potential to reproduce the interaction processes between the land surface and atmosphere in the complex terrain areas. For a future perspective, accurate initial soil moisture and precipitation estimation by incorporating advanced data assimilation methods is supposed to improve streamflow simulations and interdisciplinary flood simulation studies.
Author Contributions
Conceptualization, Y.C. and J.W.; methodology, Y.C., J.W. and Q.Z.; software, J.W.; validation, Y.C. and X.M.; formal analysis, Y.C.; data curation, X.M.; writing—original draft preparation, Y.C.; visualization, Y.C., Q.Z., X.L., G.Z. and R.C.; supervision, J.W.; funding acquisition, J.W. All authors have read and agreed to the published version of the manuscript.
Funding
This research has been jointly supported by the National Natural Science Foundation of China (Grant 42375032) and the Scientific Research Project of Chengdu University of Information Technology (Grant KYTZ201821).
Institutional Review Board Statement
Not applicable.
Informed Consent Statement
Not applicable.
Data Availability Statement
The daily streamflow data of Tangnaihai hydrological station can be downloaded at http://www.yrcc.gov.cn, and the turbulent heat fluxes and soil temperature and moisture data of the Ngoring Lake station from the National Cryosphere Desert Data Center (http://www.ncdc.ac.cn). The CMFD data are provided by the National Tibetan Plateau Data Center (https://doi.org/10.11888/AtmosphericPhysics.tpe.249369.fle). The GLDAS data are from https://ldas.gsfc.nasa.gov/gldas/.
Acknowledgments
The authors would like to thank the National Cryosphere Desert Data Center and National Meteorological Information Center for providing the precious observational data. Moreover, we acknowledge the developers of the open-source models used for this research.
Conflicts of Interest
The authors declare no conflicts of interest.
References
- Arnault, J.; Wagner, S.; Rummler, T.; Fersch, B.; Bliefernicht, J.; Andresen, S.; Kunstmann, H. Role of Runoff-Infiltration Partitioning and Resolved Overland Flow on Land-Atmosphere Feedbacks: A Case Study with the WRF-Hydro Coupled Modeling System for West Africa. J. Hydrometeorol. 2016, 17, 1489–1516. [Google Scholar] [CrossRef]
- Fersch, B.; Senatore, A.; Adler, B.; Arnault, J.; Mauder, M.; Schneider, K.; Völksch, I.; Kunstmann, H. High-resolution fully-coupled atmospheric-hydrological modeling: A cross-compartment regional water and energy cycle evaluation. Hydrol. Earth Syst. Sci. 2020, 24, 2457–2481. [Google Scholar] [CrossRef]
- Milly, P.C.D.; Dunne, K.A.; Vecchia, A.V. Global pattern of trends in streamflow and water availability in a changing climate. Nature 2005, 438, 347–350. [Google Scholar] [CrossRef] [PubMed]
- Meng, X.H.; Chen, H.; Li, Z.G.; Zhao, L.; Zhou, B.R.; Lvy, S.H.; Deng, M.S.; Liu, Y.M.; Li, G.W. Review of Climate Change and Its Environmental Influence on the Three-River Regions. Plateau Meteor. 2020, 39, 1113–1143. [Google Scholar]
- Wu, G.X.; Mao, J.Y.; Duan, A.M.; Zhang, Q. Recent progressing in the study on the impacts of Tibetan Plateau on Asian summer climate. Acta Meteorol. Sin. 2004, 62, 528–549. [Google Scholar]
- Tian, D.X.; Tian, S.M.; Jiang, S.Q.; Dong, X.N.; Li, Z.W.; Zhang, L. Research process of the evolition of runoff in the Source Area of the Yellow River. Yellow River 2020, 42, 90–95. [Google Scholar]
- Zhang, A.; Li, T.J.; Fu, W.; Wang, Y.T. Model simulation of flood season runoff in the headwaters of the Yellow River Basin using satellite-ground merged precipitation data. J. Abbr. 2017, 25, 1–16. [Google Scholar]
- Milly, P.C.D.; Wetherald, R.T.; Dunne, K.A.; Delworth, T.L. Increasing risk of great floods in a changing climate. Nature 2002, 415, 514–517. [Google Scholar] [CrossRef] [PubMed]
- Ji, P.; Yuan, X. High-resolution land surface modeling of hydrological changes over the Sanjiangyuan Region in the eastern Tibetan Plateau: 2. Impact of climate and land cover change. J. Adv. Model. Earth Syst. 2018, 10, 2829–2843. [Google Scholar] [CrossRef]
- Clark, M.P.; Fan, Y.; Lawrence, D.M.; Adam, J.C.; Bolster, D.; Gochis, D.J.; Hooper, R.P.; Kumar, M.; Leung, L.R.; Mackay, D.S.; et al. Improving the representation of hydrologic processes in Earth System Models. Water Resour. Res. 2015, 51, 5929–5956. [Google Scholar] [CrossRef]
- Tang, Q.H.; Liu, X.C.; Li, Z.; Yun, X.B.; Zhang, X.J.; Yu, Q.; Li, J.; Zhang, Y.Y.; Cui, H.J.; Sun, S.A.; et al. Integrated water systems model for terrestrial water cycle simulation. Adv. Earth Sci. 2019, 34, 115–123. [Google Scholar]
- Kruk, N.S.; Vendrame, I.F.; Chou, S.C. Coupling a Mesoscale Atmospheric Model with a Distributed Hydrological Model Applied to a Watershed in Southeast Brazil. J. Hydrol. Eng. 2012, 18, 58–65. [Google Scholar] [CrossRef]
- Cuo, L.; Zhang, Y.X.; Gao, Y.H.; Hao, Z.C.; Cairang, L.S. The impacts of climate change and land cover/use transition on the hydrology in the upper Yellow River Basin, China. J. Hydrol. 2013, 502, 37–52. [Google Scholar] [CrossRef]
- Sheng, M.Y.; Lei, H.M.; Jiao, Y.; Yang, D.W. Evaluation of the runoff and river routing schemes in the Community Land Model of the Yellow River Basin. J. Adv. Model. Earth Syst. 2017, 9, 2993–3018. [Google Scholar] [CrossRef]
- Bergant, K.; Belda, M.; Halenka, T. Systematic errors in the simulation of european climate (1961–2000) with RegCM3 driven by NCEP/NCAR reanalysis. Int. J. Climatol. 2007, 27, 455–472. [Google Scholar] [CrossRef]
- Flocas, H.A.; Hatzaki, M.; Yolika, K.; Anagnostopoulou, C.; Kostopoulou, E.; Giannakopoulos, C.; Kolokytha, C.; Tegoulias, K. Ability of RCM/GCM couples to represent the relationship of large scale circulation to climate extremes over the Mediterranean region. J. Clim. Res. 2011, 46, 197–209. [Google Scholar] [CrossRef]
- Wen, J.; Lan, Y.C.; Su, Z.B.; Tian, H.; Shi, X.K.; Zhang, Y.; Wang, X.; Liu, R.; Zhang, T.T.; Kang, Y.; et al. Advances in observation and modeling of land surface process over the Source Region of the Yellow River. Adv. Earth Sci. 2011, 26, 575–585. [Google Scholar]
- Gochis, D.J.; Chen, F. Hydrological Enhancements to the Community Noah Land Surface Model (No. NCAR/TN-454+STR); University Corporation for Atmospheric Research: Boulder, CO, USA, 2020. [Google Scholar]
- Gharamti, M.E.; McCreight, J.L.; Noh, S.J.; Hoar, T.J.; RafieeiNasab, A.; Johnson, B.K. Ensemble streamflow data assimilation using WRF-Hydro and DART: Novel localization and inflation techniques applied to Hurricane Florence flooding. Hydrol. Earth Syst. Sci. 2021, 25, 5315–5336. [Google Scholar] [CrossRef]
- Gu, T.W.; Chen, Y.D.; Gao, Y.F.; Qin, L.Y.; Wu, Y.Q.; Wu, Y.Z. Improved streamflow forecast in a small-medium sized river basin with coupled WRF and WRF-Hydro: Effects of radar data assimilation. Remote Sens. 2021, 13, 3251. [Google Scholar] [CrossRef]
- Zhang, Z.; Arnault, J.; Wagner, S.; Laux, P.; Kunstmann, H. Impact of lateral terrestrial water flow on land-atmosphere interactions in the Heihe River Basin in China: Fully coupled modeling and precipitation recycling analysis. J. Geophys. Res. Atmos. 2019, 124, 8401–8423. [Google Scholar] [CrossRef]
- Senatore, A.; Mendicino, G.; Dochis, D.J.; Yu, W.; Yates, D.N.; Kunstmann, H. Fully coupled atmosphere-hydrology simulations for the central Mediterranean: Impact of enhanced hydrological parameterization for short and long time scales. J. Adv. Model. Earth Syst. 2015, 7, 1693–1715. [Google Scholar] [CrossRef]
- Li, G.W.; Meng, X.H.; Blyth, E.; Chen, H.; Shu, L.L.; Li, Z.G.; Zhao, L.; Ma, Y.S. Impact of Fully Coupled Hydrology-Atmosphere Processes on Atmosphere Conditions: Investigating the Performance of the WRF-Hydro Model in the Three River Source Region on the Tibetan Plateau, China. Water 2021, 13, 3409. [Google Scholar] [CrossRef]
- Ji, P.; Yuan, X.; Ma, F.; Pan, M. Accelerated hydrological cycle over the Sanjiangyuan region induces more streamflow extremes at different global warming levels. Hydrol. Earth Syst. Sci. 2020, 24, 5439–5451. [Google Scholar] [CrossRef]
- Zheng, H.X.; Zhang, L.; Liu, C.M.; Shao, Q.X.; Fukushima, Y. Changes in stream flow regime in headwater catchments of the Yellow River basin since the 1950s. Hydrol. Process. 2006, 21, 886–893. [Google Scholar] [CrossRef]
- Meng, X.H.; Lyu, S.H. Observation Data of Turbulent Flow at Lakeside Observation Points in Erling Lake Basin. 2013. Available online: http://www.ncdc.ac.cn (accessed on 17 December 2022).
- Meng, X.H.; Lyu, S.H.; Li, Z.G.; Ao, Y.H.; Wen, L.J.; Shang, L.Y.; Wang, S.Y.; Deng, M.S.; Zhang, S.B.; Zhao, L.; et al. Dataset of comparative observations for land surface processes over the semi-arid alpine grassland against alpine lakes in the Source Region of the Yellow River. Adv. Atmos. Sci. 2023, 40, 1142–1157. [Google Scholar] [CrossRef]
- An, Y.Y.; Meng, X.H.; Zhao, L.; Li, Z.G.; Lyu, S.H.; Ma, Y.T. Evaluation the applicability of albedo products of GLASS, MODIS and GlobAlbedo under the alpine meadow over the Qinghai-Tibetan Plateau. Plateau Meteor. 2019, 38, 88–100. [Google Scholar]
- An, Y.Y.; Meng, X.H.; Zhao, L.; Li, Z.G.; Wang, S.Y.; Shang, L.Y.; Chen, H.; Lyu, S.H.; Li, G.W.; Ma, Y.S. Performance of GLASS and MODIS Satellite Albedo products in diagnosing Albedo variations during different time scales and special weather conditions in the Tibetan Plateau. Remote Sens. 2008, 12, 2456. [Google Scholar] [CrossRef]
- Li, X.; Gao, Y.H.; Wang, W.Z.; Lan, Y.C.; Xu, J.W.; Li, K. Climate changes and applicability of GLDAS in the headwater of the Yellow River Basin. Adv. Earth Sci. 2014, 29, 531–540. [Google Scholar]
- He, J.; Yang, K.; Tang, W.J.; Lyu, H.; Qin, J.; Chen, Y.Y.; Li, X. The first high-resolution meteorological forcing dataset for land process studies over China. Sci. Data 2020, 7, 25. [Google Scholar] [CrossRef]
- Dmitriev, V.; Ovchinnikov, V. Interpolation in real method spaces. Geoderma 1979, 246, 794–797. [Google Scholar]
- Shangguan, W.; Dai, Y.J.; Liu, B.Y.; Ye, A.Z.; Yuan, H. A soil particle-size distribution dataset for regional land and climate modelling in China. Geoderma 2012, 171–172, 85–91. [Google Scholar] [CrossRef]
- Skamarock, W.C.; Klemp, J.B. A time-split nonhydrostatic atmospheric model for weather research and forecasting applications. J. Comput. Phys. 2008, 227, 3465–3485. [Google Scholar] [CrossRef]
- Niu, G.-Y.; Yang, Z.-L.; Mitchell, K.E.; Chen, F.; Ek, M.B.; Barlage, M.; Kumar, A.; Manning, K.; Niyogi, D.; Rosero, E.; et al. The community Noah land surface model with multiparameterization options (Noah-MP): 1. Model description and evaluation with local-scale measurements. J. Geophys. Res. Atmos. 2011, 116, D12109. [Google Scholar] [CrossRef]
- Yang, Y.Z.; Yuan, H.L.; Yu, W. Uncertainties of 3D soil hydraulic parameters in streamflow simulations using a distributed hydrological model system. J. Hydrol. 2011, 567, 12–24. [Google Scholar] [CrossRef]
- Niu, G.Y.; Yang, Z.L. Effects of frozen soil on snowmelt runoff and soil water storage at a continental scale. J. Hydrometeorol. 2006, 7, 937–952. [Google Scholar] [CrossRef]
- Thompson, G.; Field, P.R.; Rasmussen, R.M.; Hall, W.D. Explicit forecasts of winter precipitation using an improved bulk microphysics scheme. Part II: Implementation of a new snow parameterization. Mon. Weather Rev. 2008, 136, 5095–5115. [Google Scholar] [CrossRef]
- Grell, G.A.; Devenyi, D. A generalized approach to parameterizing convection combining ensemble and data assimilation techniques. Geophys. Res. Lett. 2002, 29, 38-1–38-4. [Google Scholar] [CrossRef]
- Nakanishi, M.; Niino, H. An improved mellor-yamada level-3 model: Its numerical stability and application to a regional prediction of advection fog. Bound. Layer Meteorol. 2006, 119, 397–407. [Google Scholar] [CrossRef]
- Iacono, M.J.; Delamere, J.S.; Mlawer, E.J.; Shephard, M.W.; Clough, S.A.; Collins, W.D. Radiative forcing by long-lived greenhouse gases: Calculations with the AER radiative transfer models. J. Geophys. Res. Atmos. 2008, 113, D13. [Google Scholar] [CrossRef]
- Yucel, I.; Onen, A.; Yilmaz, K.K.; Gochis, D.J. Calibration and evaluation of a flood forecasting system: Utility of numerical weather prediction model, data assimilation and satellite-based rainfall. J. Hydrol. 2015, 523, 49–66. [Google Scholar] [CrossRef]
- Wang, J.; Liu, D.W.; Tian, S.N.; Hu, Y.H.; Ma, J.L.; Wang, L.X. Coupling analysis of short-term weather and runoff in an arid lake basin of China. Reg. Sustain. 2021, 2, 264–279. [Google Scholar] [CrossRef]
- Ye, D.; Zhang, S.W.; Wang, F.Y.; Mao, F.P.; Yang, X.X. The applicability of different parameterization schemes in semi-arid region based on Noah-MP land surface model. Chin. J. Atmos. Sci. 2017, 41, 189–201. [Google Scholar]
- Chen, Y.L.; Wen, J.; Yang, C.G.; Long, Y.P.; Li, G.W.; Jia, H.J.; Liu, Z. Analysis on the applicability of different precipitation products and WRF-Hydro model over the Source Region of the Yellow River. Chin. J. Atmos. Sci. Available online: http://www.dqkxqk.ac.cn/dqkx/dqkx/article/abstract/2022057B (accessed on 17 December 2022). [CrossRef]
- Jia, D.Y.; Wen, J.; Zhang, T.T.; Xi, J.J. Response of soil water content and soil thermal conductivity on precipitation in Loess Plateau. Plateau Meteor. 2014, 33, 712–720. [Google Scholar]
- Zhang, Q.; Wen, J.; Zhang, T.T.; Yang, Y.T.; Wu, Y.Y.; Zhang, G.; Liu, W.H.; Chen, Y.L.; Yan, Z.T. The impacts of roughness length on the simulation of land-atmosphere water and heat exchanges over the Yarlung Zangbo Grand canyon region. Front. Earth Sci. 2023, 10, 2296–6463. [Google Scholar] [CrossRef]
- Taylor, K.E. Summarizing multiple aspects of model performance in a single diagram. J. Geophys. Res. Atmos. 2001, 106, 7183–7192. [Google Scholar] [CrossRef]
- Zhang, H.X.; Yuan, N.M.; Ma, Z.G.; Huang, Y. Understanding the soil temperature variability at different depths: Effects of surface air temperature, snow cover, and the soil memory. Adv. Atmos. Sci. 2021, 38, 493–503. [Google Scholar] [CrossRef]
- Jia, S.F.; Liang, Y.; Zhang, S.F. Discussion on evaluation of natural runoff in the Yellow River Basin. Water Resour. Prot. 2022, 38, 33–38+55. [Google Scholar]


Disclaimer/Publisher’s Note: The statements, opinions and data contained in all publications are solely those of the individual author(s) and contributor(s) and not of MDPI and/or the editor(s). MDPI and/or the editor(s) disclaim responsibility for any injury to people or property resulting from any ideas, methods, instructions or products referred to in the content. |
© 2024 by the authors. Licensee MDPI, Basel, Switzerland. This article is an open access article distributed under the terms and conditions of the Creative Commons Attribution (CC BY) license (https://creativecommons.org/licenses/by/4.0/).