
Characteristics of Atmospheric Pollutants in Paddy and Dry Field Regions: Analyzing the Oxidative Potential of Biomass Burning
 , , ,
, , , 
Abstract
:
1. Introduction
2. Materials and Methods
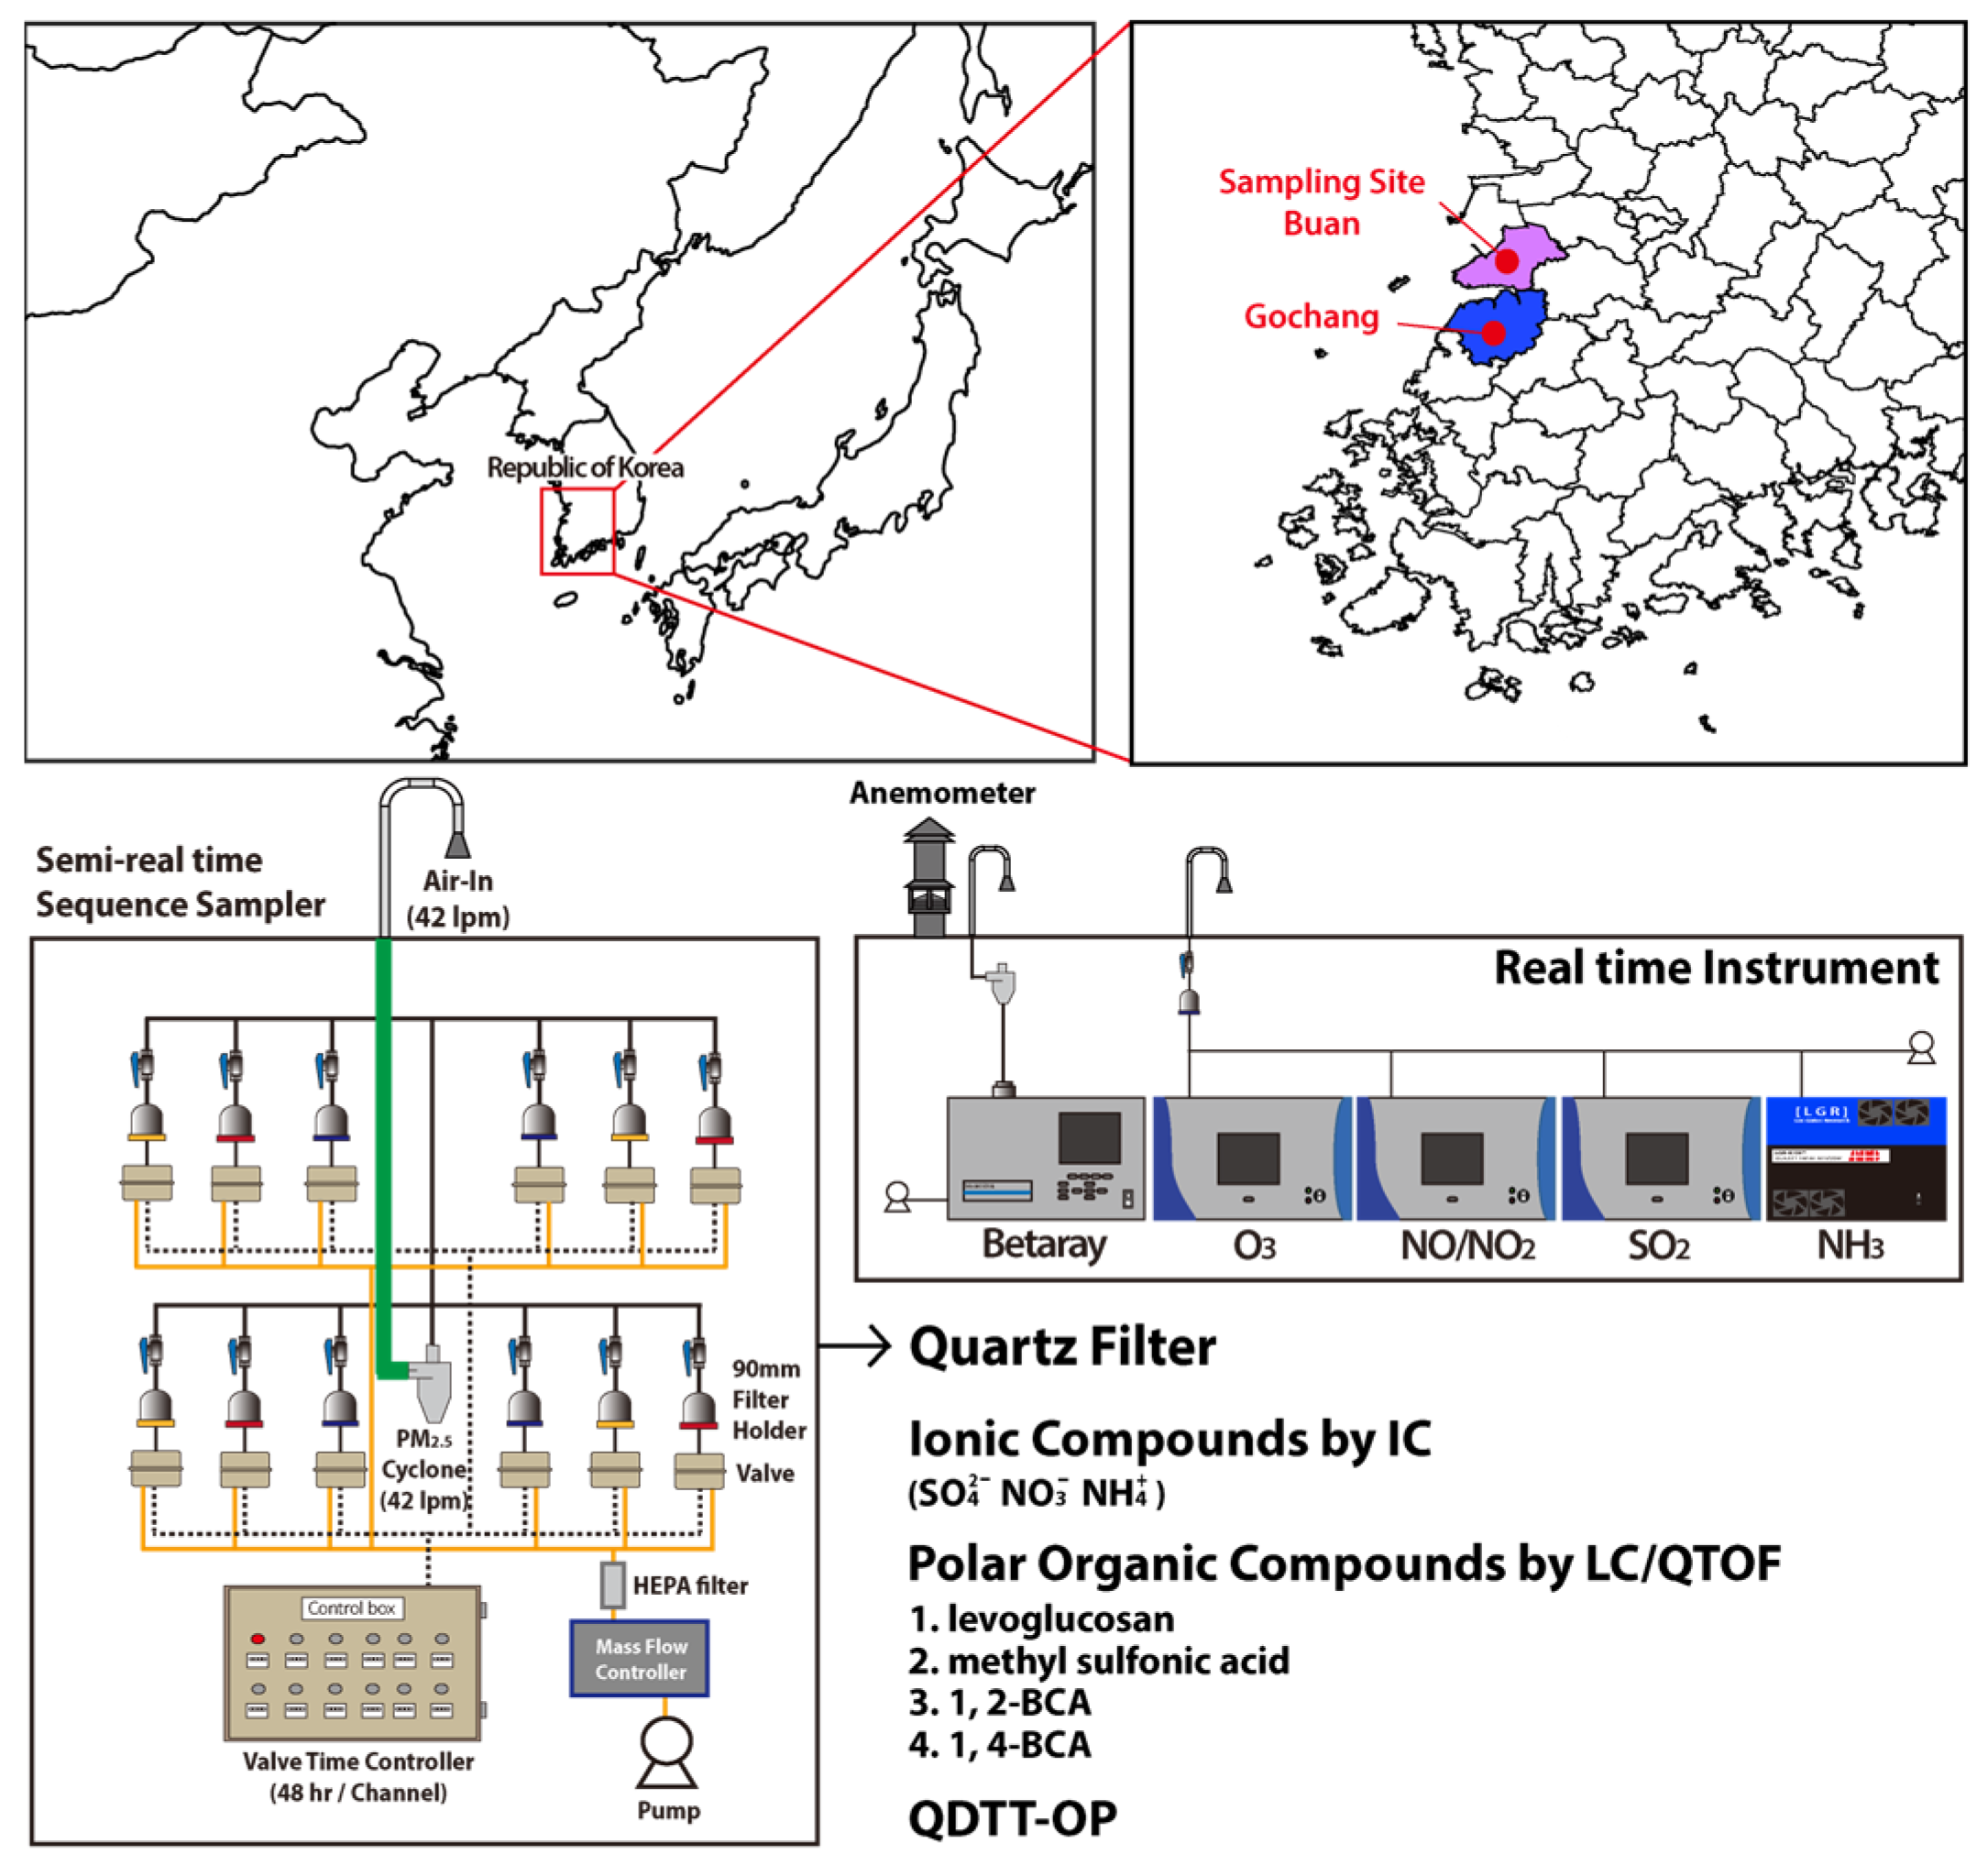
2.1. Measurement Locations and Sampling Period
2.2. Real-Time Measurements
2.3. Chemical Speciation
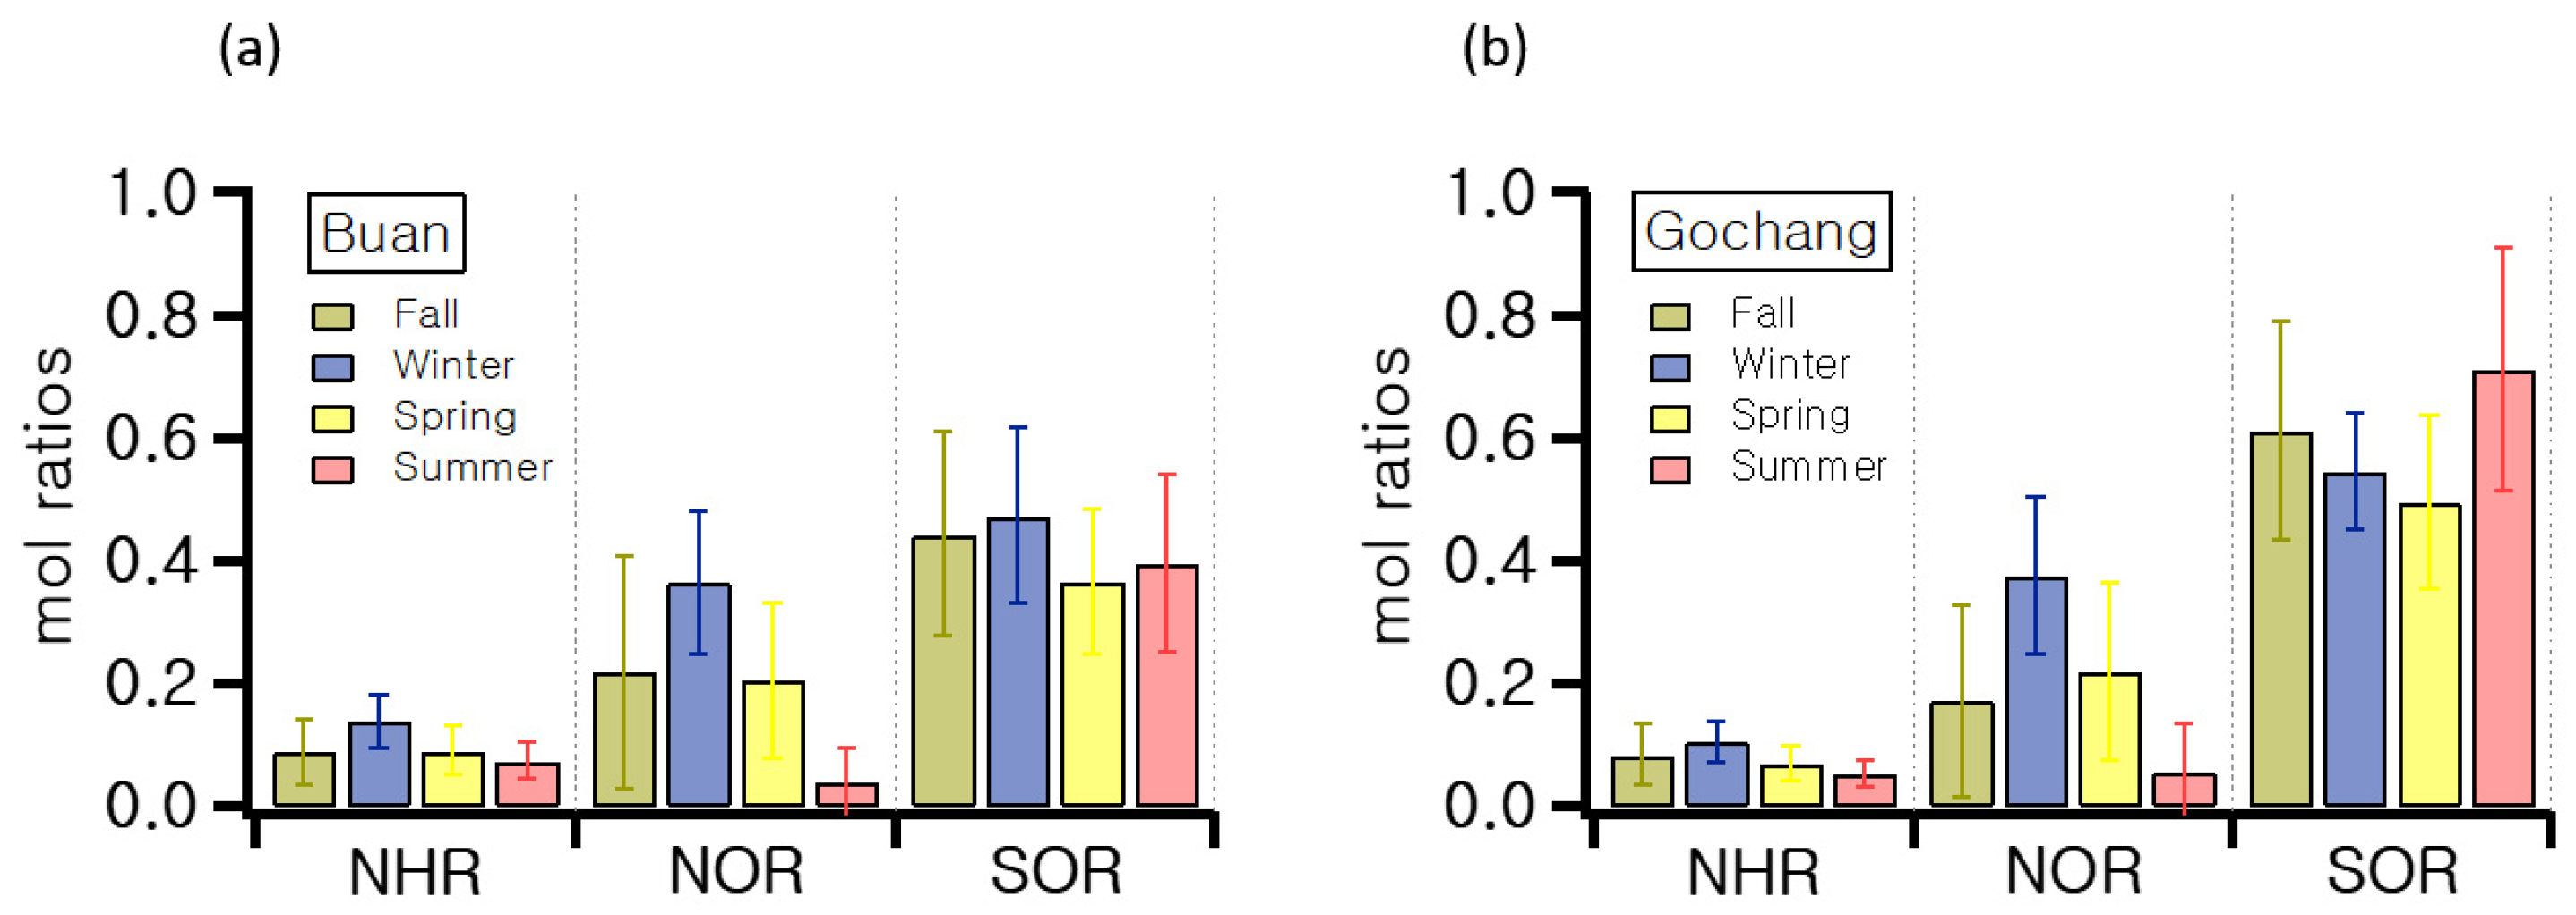
2.4. SOR, NOR, and NHR
3. Results and Discussions
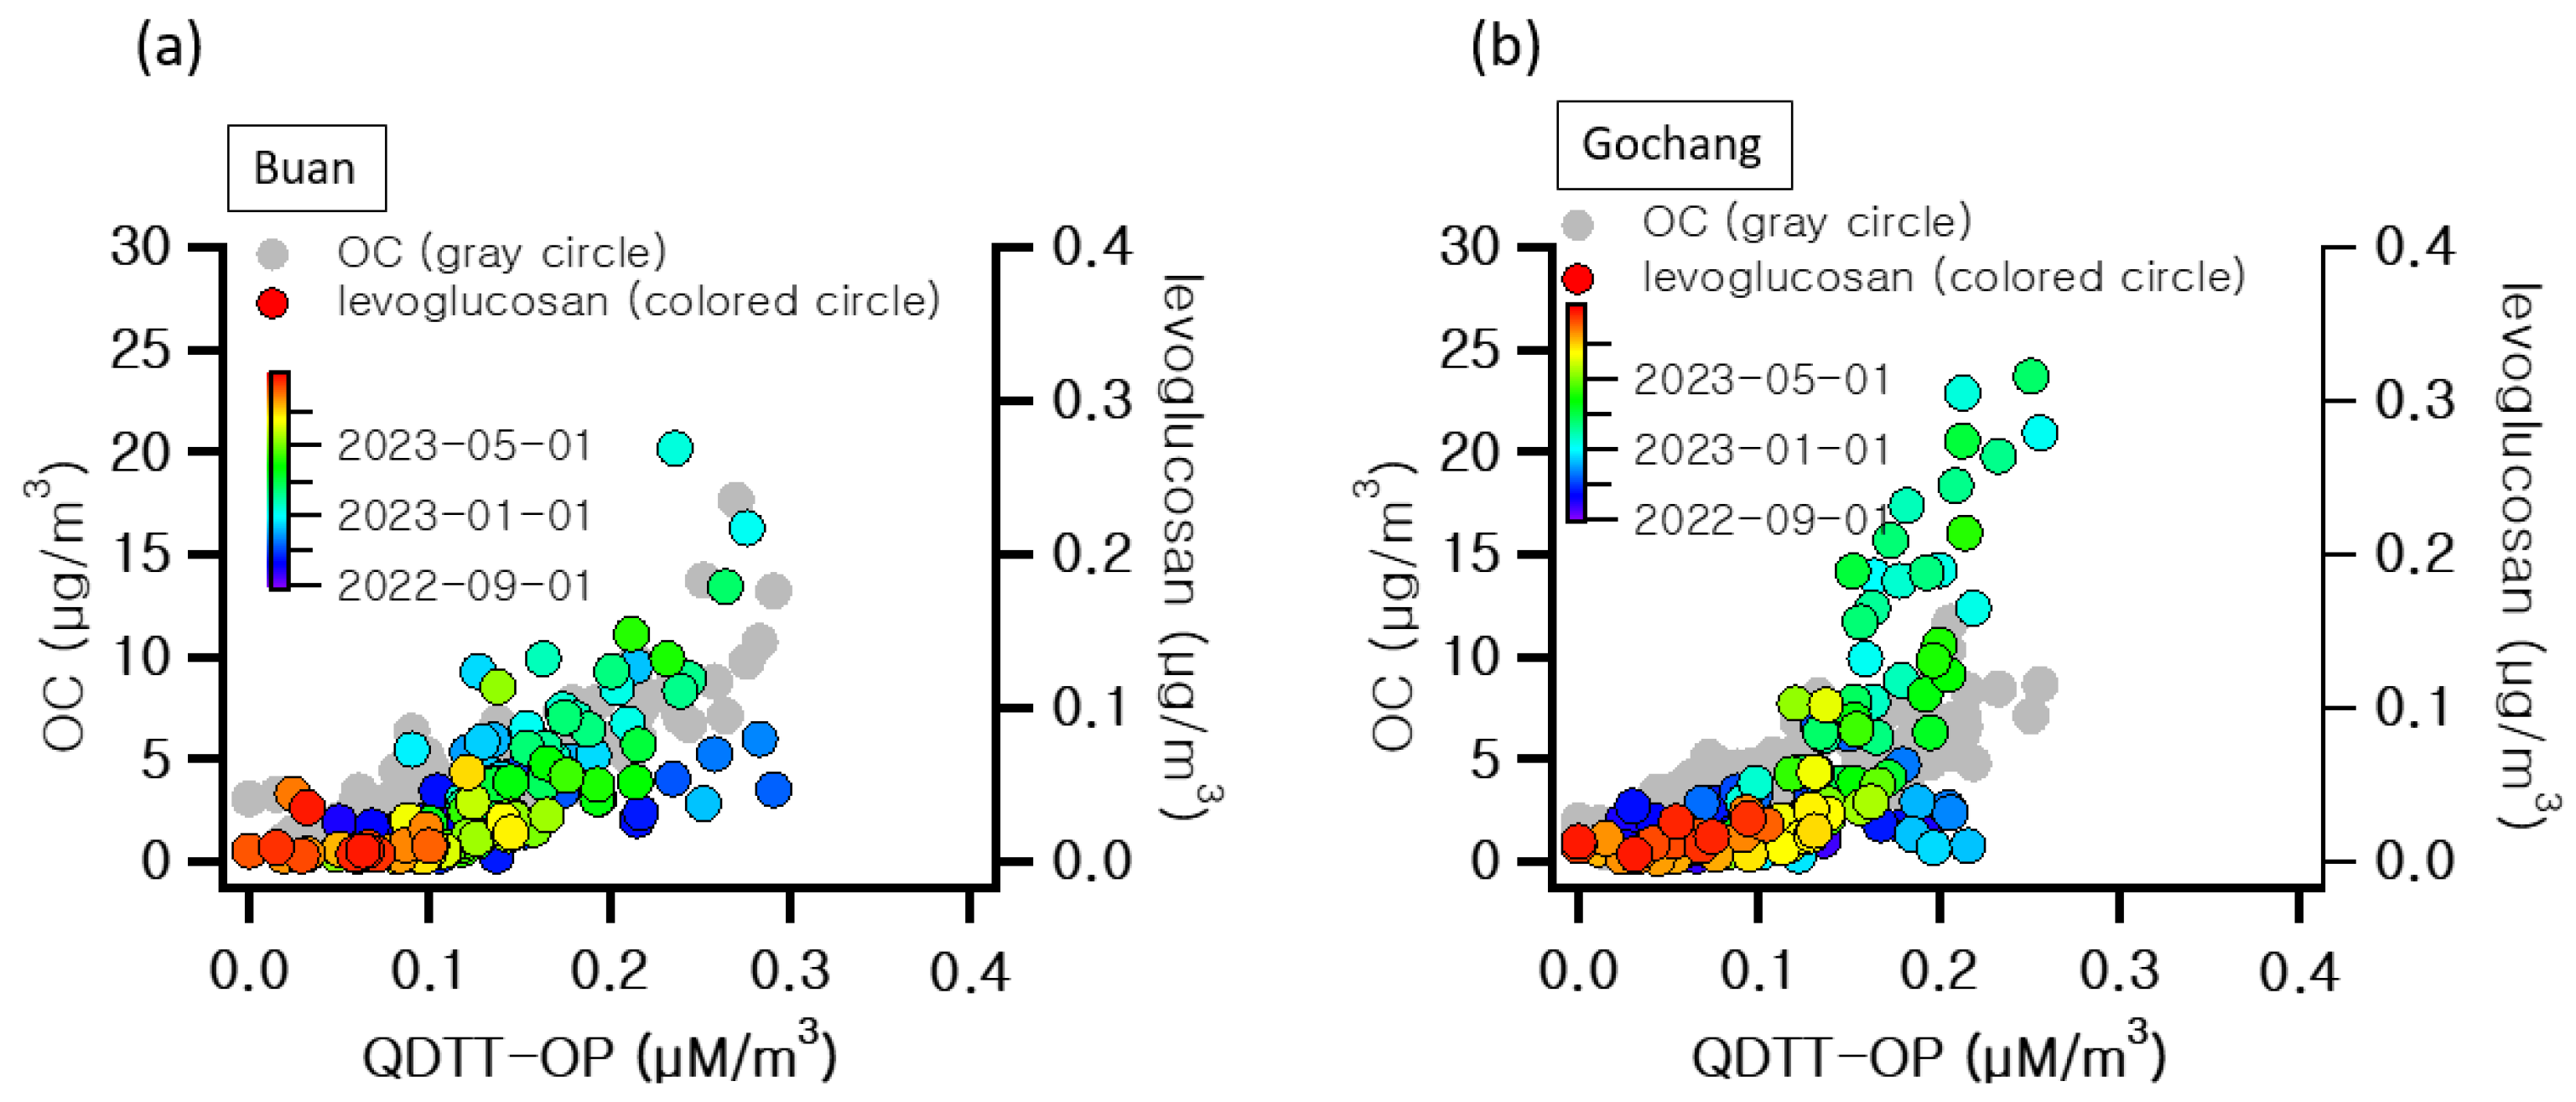
3.1. Characteristics of Atmospheric Pollutants in Agricultural Areas
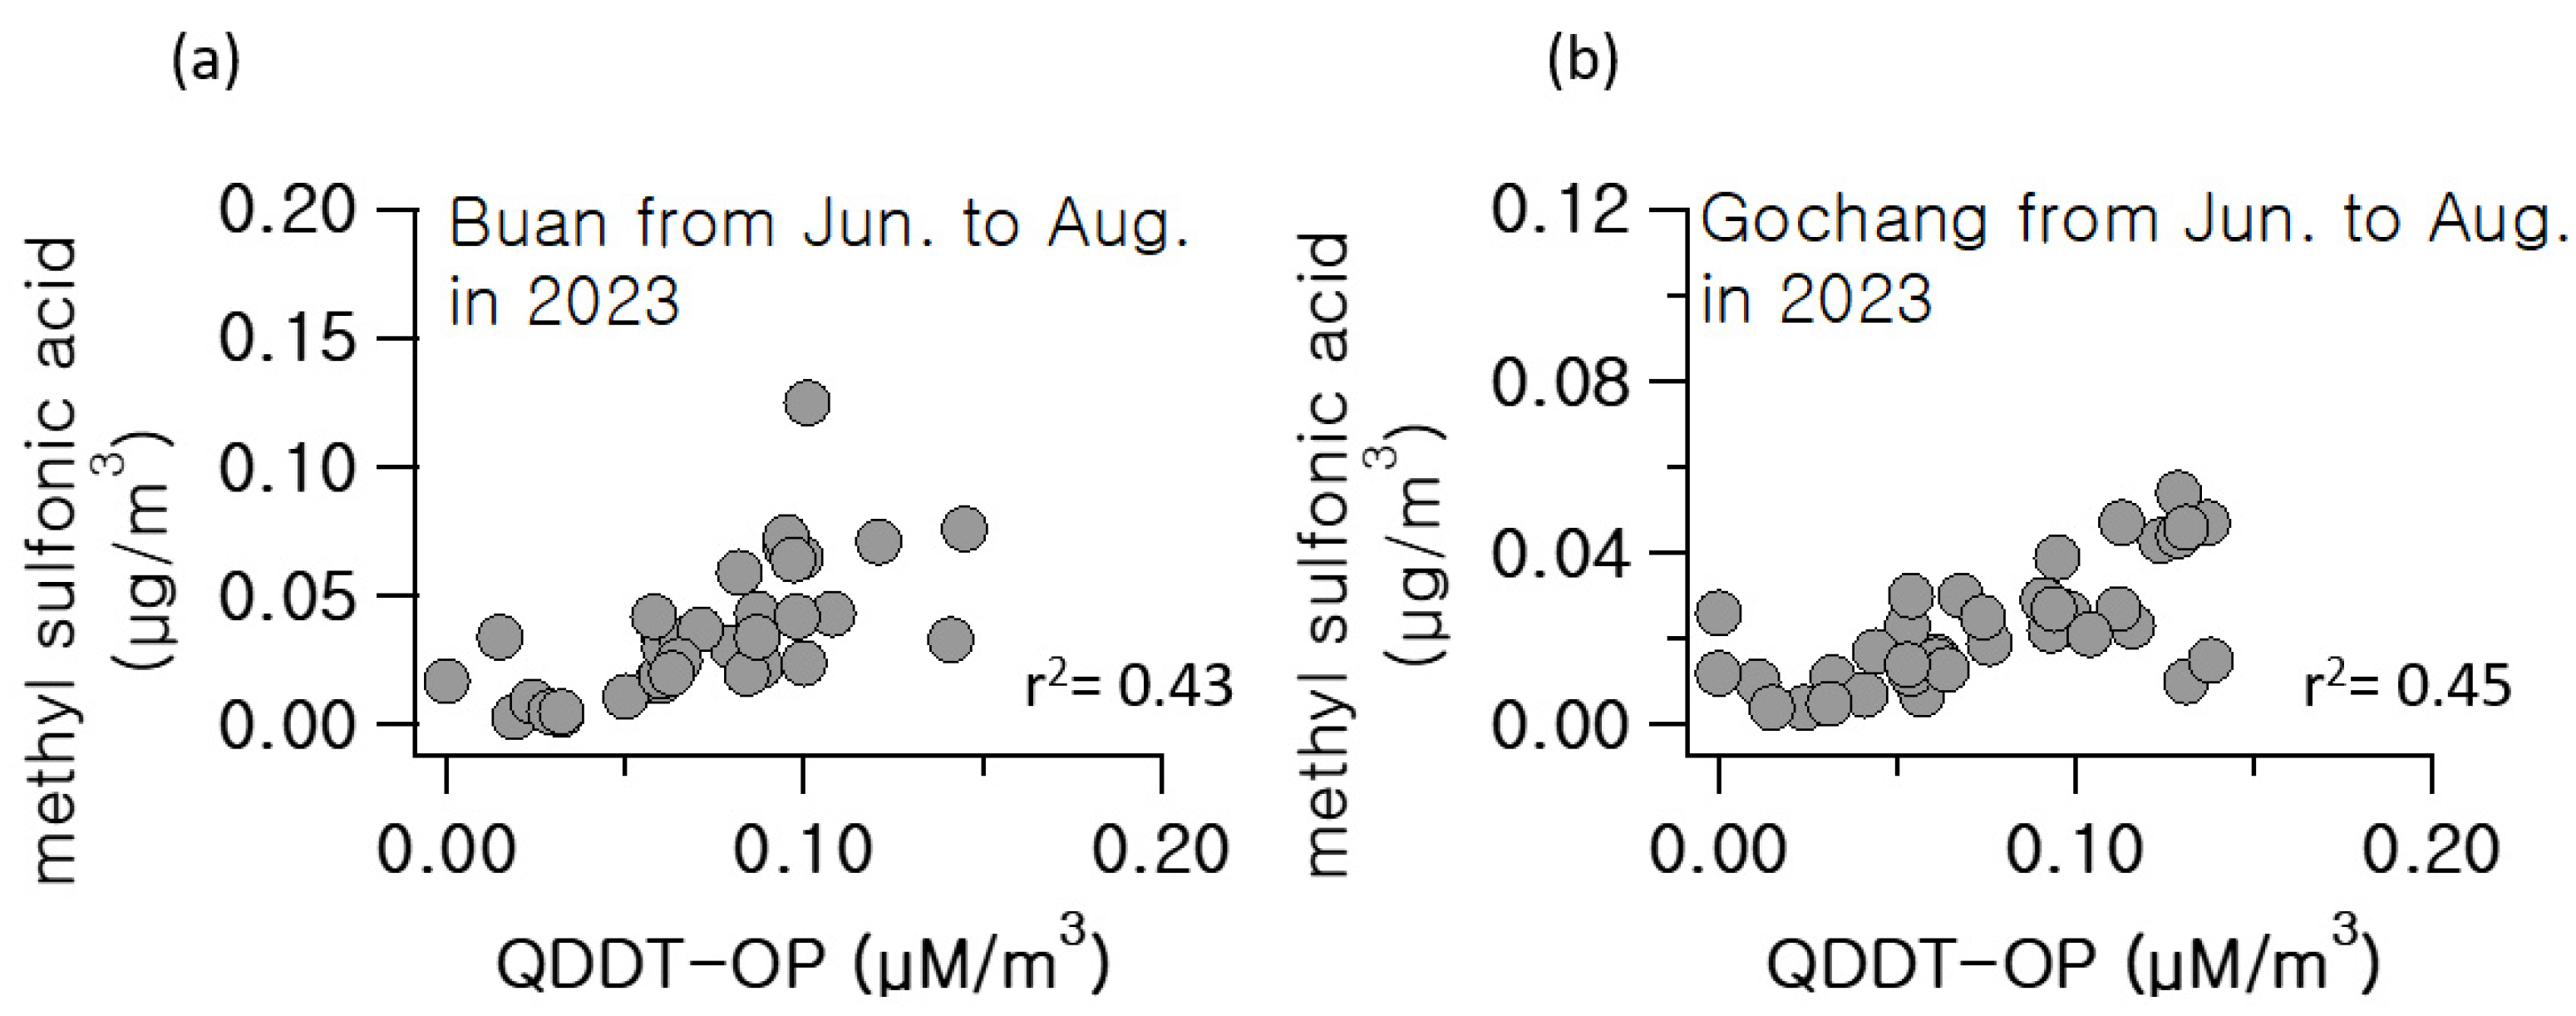
3.2. Assessment of Health Hazard Factors in PM2.5 from Agricultural Areas
4. Conclusions
Author Contributions
Funding
Institutional Review Board Statement
Informed Consent Statement
Data Availability Statement
Conflicts of Interest
References
- Kampa, M.; Castanas, E. Human health effects of air pollution. Environ. Pollut. 2008, 151, 362–367. [Google Scholar] [CrossRef] [PubMed]
- Dominici, F.; Peng, R.D.; Bell, M.L.; Pham, L.; McDermott, A.; Zeger, S.L.; Samet, J.M. Fine particulate air pollution and hospital admission for cardiovascular and respiratory diseases. JAMA 2006, 295, 1127–1134. [Google Scholar] [CrossRef] [PubMed]
- Yang, S.J.; Liu, X.; Bi, Y.; Ning, S.; Qiao, Q.; Yu, Q.; Zhang, J. Risks related to heavy metal pollution in urban construction dust fall of fast-developing Chinese cities. Ecotoxicol. Environ. Saf. 2020, 197, 110628. [Google Scholar] [CrossRef] [PubMed]
- Sekar, M.; Kumar, T.R.P.; Kumar, M.S.G.; Vaníčková, R.; Maroušek, J. Techno-economic review on short-term anthropogenic emissions of air pollutants and particulate matter. Fuel 2021, 305, 121544. [Google Scholar] [CrossRef]
- Cox, L.A. Re-assessing human mortality risks attributed to PM2.5-mediated effects of agricultural ammonia. Environ. Res. 2023, 223, 115311. [Google Scholar] [CrossRef] [PubMed]
- Pozzer, A.; Tsimpidi, A.P.; Karydis, V.A.; de Meij, A.; Lelieveld, J. Impact of agricultural emission reductions on fine-particulate matter and public health. Atmos. Chem. Phys. 2017, 17, 12813–12826. [Google Scholar] [CrossRef]
- Li, R.; Chen, W.; Xiu, A.; Zhao, H.; Zhang, X.; Zhang, S.; Tong, D.Q. A comprehensive inventory of agricultural atmospheric particulate matters (PM10 and PM2.5) and gaseous pollutants (VOCs, SO2, NH3, CO, NOx and HC) emissions in China. Ecol. Indic. 2019, 107, 105609. [Google Scholar] [CrossRef]
- Li, M.; Zhang, Q.; Kurokawa, J.-I.; Woo, J.-H.; He, K.; Lu, Z.; Carmichael, G.R. MIX: A mosaic Asian anthropogenic emission inventory under the international collaboration framework of the MICS-Asia and HTAP. Atmos. Chem. Phys. 2017, 17, 935–963. [Google Scholar] [CrossRef]
- Mozaffar, A.; Zhang, Y.-L. Atmospheric Volatile Organic Compounds (VOCs) in China: A Review. Curr. Pollut. Rep. 2020, 6, 250–263. [Google Scholar] [CrossRef]
- Bauer, S.E.; Tsigaridis, K.; Miller, R. Significant atmospheric aerosol pollution caused by world food cultivation. Geophys. Res. Lett. 2016, 43, 5394–5400. [Google Scholar] [CrossRef]
- Pinault, L.; Tjepkema, M.; Crouse, D.L.; Weichenthal, S.; van Donkelaar, A.; Martin, R.V.; Burnett, R.T. Risk estimates of mortality attributed to low concentrations of ambient fine particulate matter in the Canadian community health survey cohort. Environ. Health 2016, 15, 18. [Google Scholar] [CrossRef] [PubMed]
- Shi, L.; Zanobetti, A.; Kloog, I.; Coull, B.A.; Koutrakis, P.; Melly, S.J.; Schwartz, J.D. Low-concentration PM2.5 and mortality: Estimating acute and chronic effects in a population-based study. Environ. Health Perspect. 2016, 124, 46–52. [Google Scholar] [CrossRef] [PubMed]
- Lee, C.J.; Martin, R.V.; Henze, D.K.; Brauer, M.; Cohen, A.; van Donkelaar, A. Response of global particulate-matter-related mortality to changes in local precursor emissions. Environ. Sci. Technol. 2015, 49, 4335–4344. [Google Scholar] [CrossRef] [PubMed]
- Chen, W.; Tong, D.Q.; Zhang, S.; Zhang, X.; Zhao, H. Local PM10 and PM2.5 emission inventories from agricultural tillage and harvest in northeastern China. J. Environ. Sci. 2017, 57, 15–23. [Google Scholar] [CrossRef] [PubMed]
- Nelson, A.J.; Koloutsou-Vakakis, S.; Rood, M.J.; Myles, L.; Lehmann, C.; Bernacchi, C.; Lin, J. Season-long ammonia flux measurements above fertilized corn in central Illinois, USA, using relaxed eddy accumulation. Agric. For. Meteorol. 2017, 239, 202–212. [Google Scholar] [CrossRef]
- Wang, H.; Yilihamu, Q.; Yuan, M.; Bai, H.; Xu, H.; Wu, J. Prediction models of soil heavy metal(loid)s concentration for agricultural land in Dongli: A comparison of regression and random forest. Ecol. Indic. 2020, 119, 106801. [Google Scholar] [CrossRef]
- Recio, J.; Montoya, M.; Ginés, C.; Sanz-Cobena, A.; Vallejo, A.; Alvarez, J.M. Joint mitigation of NH3 and N2O emissions by using two synthetic inhibitors in an irrigated cropping soil. Geoderma 2020, 373, 114423. [Google Scholar] [CrossRef]
- Sanz-Cobena, A.; Lassaletta, L.; Estellés, F.; Del Prado, A.; Guardia, G.; Abalos, D.; Billen, G. Yield-scaled mitigation of ammonia emission from N fertilization: The Spanish case. Environ. Res. Lett. 2014, 9, 125005. [Google Scholar] [CrossRef]
- Gao, D.; Mulholland, J.A.; Russell, A.G.; Weber, R.J. Characterization of water-insoluble oxidative potential of PM2.5 using the dithiothreitol assay. Atmos. Environ. 2020, 224, 117327. [Google Scholar] [CrossRef]
- Li, Q.; Wyatt, A.; Kamens, R.M. Oxidant generation and toxicity enhancement of aged-diesel exhaust. Atmos. Environ. 2009, 43, 1037–1042. [Google Scholar] [CrossRef]
- Lin, M.; Yu, J.Z. Dithiothreitol (DTT) concentration effect and its implications on the applicability of DTT assay to evaluate the oxidative potential of atmospheric aerosol samples. Environ. Pollut. 2019, 251, 938–944. [Google Scholar] [CrossRef] [PubMed]
- Song, M.-K.; Choi, J.; Oh, S.-H.; Choe, S.; Yu, G.-H.; Cho, S.-S.; Park, J.; Bae, M.-S. Diurnal dithiothreitol assays for biomass burning source in PM1.0 and PM2.5 during summer and winter. Atmos. Environ. 2023, 313, 120033. [Google Scholar] [CrossRef]
- Hu, G.; Zhang, Y.; Sun, J.; Zhang, L.; Shen, X.; Lin, W.; Yang, Y. Variability, formation and acidity of water-soluble ions in PM2.5 in Beijing based on the semi-continuous observations. Atmos. Res. 2014, 145, 1–11. [Google Scholar] [CrossRef]
- Meng, Z.; Xu, X.; Lin, W.; Ge, B.; Xie, Y.; Song, B.; Jia, S.; Zhang, R.; Peng, W.; Wang, Y.; et al. Role of ambient ammonia in particulate ammonium formation at a rural site in the North China Plain. Atmos. Chem. Phys. 2018, 18, 167–184. [Google Scholar] [CrossRef]
- Wang, H.; Wu, L.; Wang, X.; Zhang, S.; Cheng, M.; Feng, H.; Fan, J.; Zhang, F.; Xiang, Y. Optimization of water and fertilizer management improves yield, water, nitrogen, phosphorus and potassium uptake and use efficiency of cotton under drip fertigation. Agric. Water Manag. 2021, 245, 106662. [Google Scholar] [CrossRef]
- Bouwman, A.; Boumans, L.; Batjes, N. Estimation of global NH3 volatilization loss from synthetic fertilizers and animal manure applied to arable lands and grasslands. Glob. Biogeochem. Cycles 2002, 16, 8-1–8-14. [Google Scholar] [CrossRef]
- Bray, C.D.; Battye, W.H.; Aneja, V.P.; Schlesinger, W.H. Global emissions of NH3, NOx, and N2O from biomass burning and the impact of climate change. J. Air Waste Manag. Assoc. 2021, 71, 102–114. [Google Scholar] [CrossRef]
- Achad, M.; Caumo, S.; de Castro Vasconcellos, P.; Bajano, H.; Gómez, D.; Smichowsk, P. Chemical markers of biomass burning: Determination of levoglucosan, and potassium in size-classified atmospheric aerosols collected in Buenos Aires, Argentina by different analytical techniques. Microchem. J. 2018, 139, 181–187. [Google Scholar] [CrossRef]
- Pattey, E.; Qiu, G. Trends in primary particulate matter emissions from Canadian agriculture. J. Air Waste Manag. Assoc. 2012, 62, 737–747. [Google Scholar] [CrossRef]
- Song, M.; Kim, M.; Oh, S.-H.; Park, C.; Kim, M.; Kim, M.; Lee, H.; Choe, S.; Bae, M.-S. Influences of Organic Volatile Compounds on the Secondary Organic Carbon of Fine Particulate Matter in the Fruit Tree Area. Appl. Sci. 2021, 11, 8193. [Google Scholar] [CrossRef]
- Clausnitzer, H.; Singer, M.J. Environmental influences on respirable dust production from agricultural operations in California. Atmos. Environ. 2000, 34, 1739–1745. [Google Scholar] [CrossRef]
- Han, Q.; Wang, M.; Cao, J.; Gui, C.; Liu, Y.; He, X.; He, Y.; Liu, Y. Health risk assessment and bioaccessibilities of heavy metals for children in soil and dust from urban parks and schools of Jiaozuo, China. Ecotoxicol. Environ. Saf. 2020, 191, 110157. [Google Scholar] [CrossRef] [PubMed]
- Qin, M.; Jin, Y.; Peng, T.; Zhao, B.; Hou, D. Heavy metal pollution in Mongolian-Manchurian grassland soil and effect of long-range dust transport by wind. Environ. Int. 2023, 177, 108019. [Google Scholar] [CrossRef] [PubMed]
- Arneth, A.; Monson, R.K.; Schurgers, G.; Niinemets, Ü.; Palmer, P.I. Why are estimates of global terrestrial isoprene emissions so similar (and why is this not so for monoterpenes)? Atmos. Chem. Phys. 2008, 8, 4605–4620. [Google Scholar] [CrossRef]
- Atkinson, R.; Arey, J. Gas-phase tropospheric chemistry of biogenic volatile organic compounds: A review. Atmos. Environ. 2003, 37, 197–219. [Google Scholar] [CrossRef]
- Tani, A.; Sakami, T.; Yoshida, M.; Yonemura, S.; Ono, K. Emission of Terpenoid Compounds from Rice Plants. Environments 2023, 10, 49. [Google Scholar] [CrossRef]
- Lin, Y.C.; Zhang, Y.L.; Fan, M.Y.; Bao, M. Heterogeneous formation of particulate nitrate under ammonium-rich regimes during the high-PM2.5 events in Nanjing, China. Atmos. Chem. Phys. 2020, 20, 3999–4011. [Google Scholar] [CrossRef]
- Xu, W.; Liu, X.; Liu, L.; Dore, A.J.; Tang, A.; Lu, L.; Zhang, F. Impact of emission controls on air quality in Beijing during APEC 2014: Implications from water-soluble ions and carbonaceous aerosol in PM2.5 and their precursors. Atmos. Environ. 2019, 210, 241–252. [Google Scholar] [CrossRef]
- Zhang, Y.; Lang, J.; Cheng, S.; Li, S.; Zhou, Y.; Chen, D.; Wang, H. Chemical composition and sources of PM1 and PM2.5 in Beijing in autumn. Sci. Total Environ. 2018, 630, 72–82. [Google Scholar] [CrossRef]
- Shim, C.; Han, J.; Henze, D.K.; Shephard, M.W.; Zhu, L.; Moon, N.; Kharol, S.K.; Dammers, E.; Cady-Pereira, K. Impact of NH3 Emissions on Particulate Matter Pollution in South Korea: A Case Study of the Seoul Metropolitan Area. Atmosphere 2022, 13, 1227. [Google Scholar] [CrossRef]
- Sun, Y.; Zhuang, G.; Tang, A.; Wang, Y.; An, Z. Chemical characteristics of PM2.5 and PM10 in haze-fog episodes in Beijing. Environ. Sci. Technol. 2006, 40, 3148–3155. [Google Scholar] [CrossRef] [PubMed]
- Wang, H.; Wang, S.; Zhang, J.; Li, H. Characteristics of PM2.5 Pollution with Comparative Analysis of O3 in Autumn-Winter Seasons of Xingtai, China. Atmosphere 2021, 12, 569. [Google Scholar] [CrossRef]
- Liang, Y.; Jiang, H.; Liu, X. Characteristics of atmospheric ammonia and its impacts on SNA formation in PM2.5 of Nanchang, China. Atmos. Pollut. Res. 2024, 15, 102059. [Google Scholar] [CrossRef]
- Chow, J.C.; Watson, J.G.; Lowenthal, D.H.; Magliano, K.L. Loss of PM2.5 Nitrate from Filter Samples in Central California. J. Air Waste Manag. Assoc. 2005, 55, 1158–1168. [Google Scholar] [CrossRef] [PubMed]
- Griffith, S.M.; Huang, X.H.H.; Louie, P.K.K.; Yu, J.Z. Characterizing the thermodynamic and chemical composition factors controlling PM2.5 nitrate: Insights gained from two years of online measurements in Hong Kong. Atmos. Environ. 2015, 122, 864–875. [Google Scholar] [CrossRef]
- Arndt, R.L.; Carmichael, G.R.; Streets, D.G.; Bhatti, N. Sulfur dioxide emissions and sectorial contributions to sulfur deposition in Asia. Atmos. Environ. 1997, 31, 1553–1572. [Google Scholar] [CrossRef]
- Ren, Y.A.; Shen, G.; Shen, H.; Zhong, Q.; Xu, H.; Meng, W.; Zhang, W.; Yu, X.; Yun, X.; Luo, Y.; et al. Contributions of biomass burning to global and regional SO2 emissions. Atmos. Res. 2021, 260, 105709. [Google Scholar] [CrossRef]
- Bae, M.-S.; Schauer, J.J.; Turner, J.R. Estimation of the monthly average ratios of organic mass to organic carbon for fine particulate matter at an urban site. Aerosol Sci. Technol. 2006, 40, 1123–1139. [Google Scholar] [CrossRef]
- Yu, Q.; Chen, J.; Qin, W.; Cheng, S.; Zhang, Y.; Ahmad, M.; Ouyang, W. Characteristics and secondary formation of water-soluble organic acids in PM1, PM2.5 and PM10 in Beijing during haze episodes. Sci. Total Environ. 2019, 669, 175–184. [Google Scholar] [CrossRef]


| Compound | Unit | Buan | Gochang |
|---|---|---|---|
| Temperature | Celsius | 14.04 ± 10.00 | 14.14 ± 10.00 |
| Humidity | % | 78.70 ± 8.81 | 77.43 ± 9.57 |
| NH3 | ppb | 23.18 ± 11.08 | 30.18 ± 11.57 |
| NO | ppb | 1.48 ± 0.71 | 1.62 ± 0.50 |
| NO2 | ppb | 4.46 ± 2.58 | 4.12 ± 1.99 |
| SO2 | ppb | 2.80 ± 0.97 | 1.34 ± 0.59 |
| O3 | ppb | 34.65 ± 10.94 | 32.98 ± 9.03 |
| PM10 | μg/m3 | 39.41 ± 23.21 | 34.57 ± 23.48 |
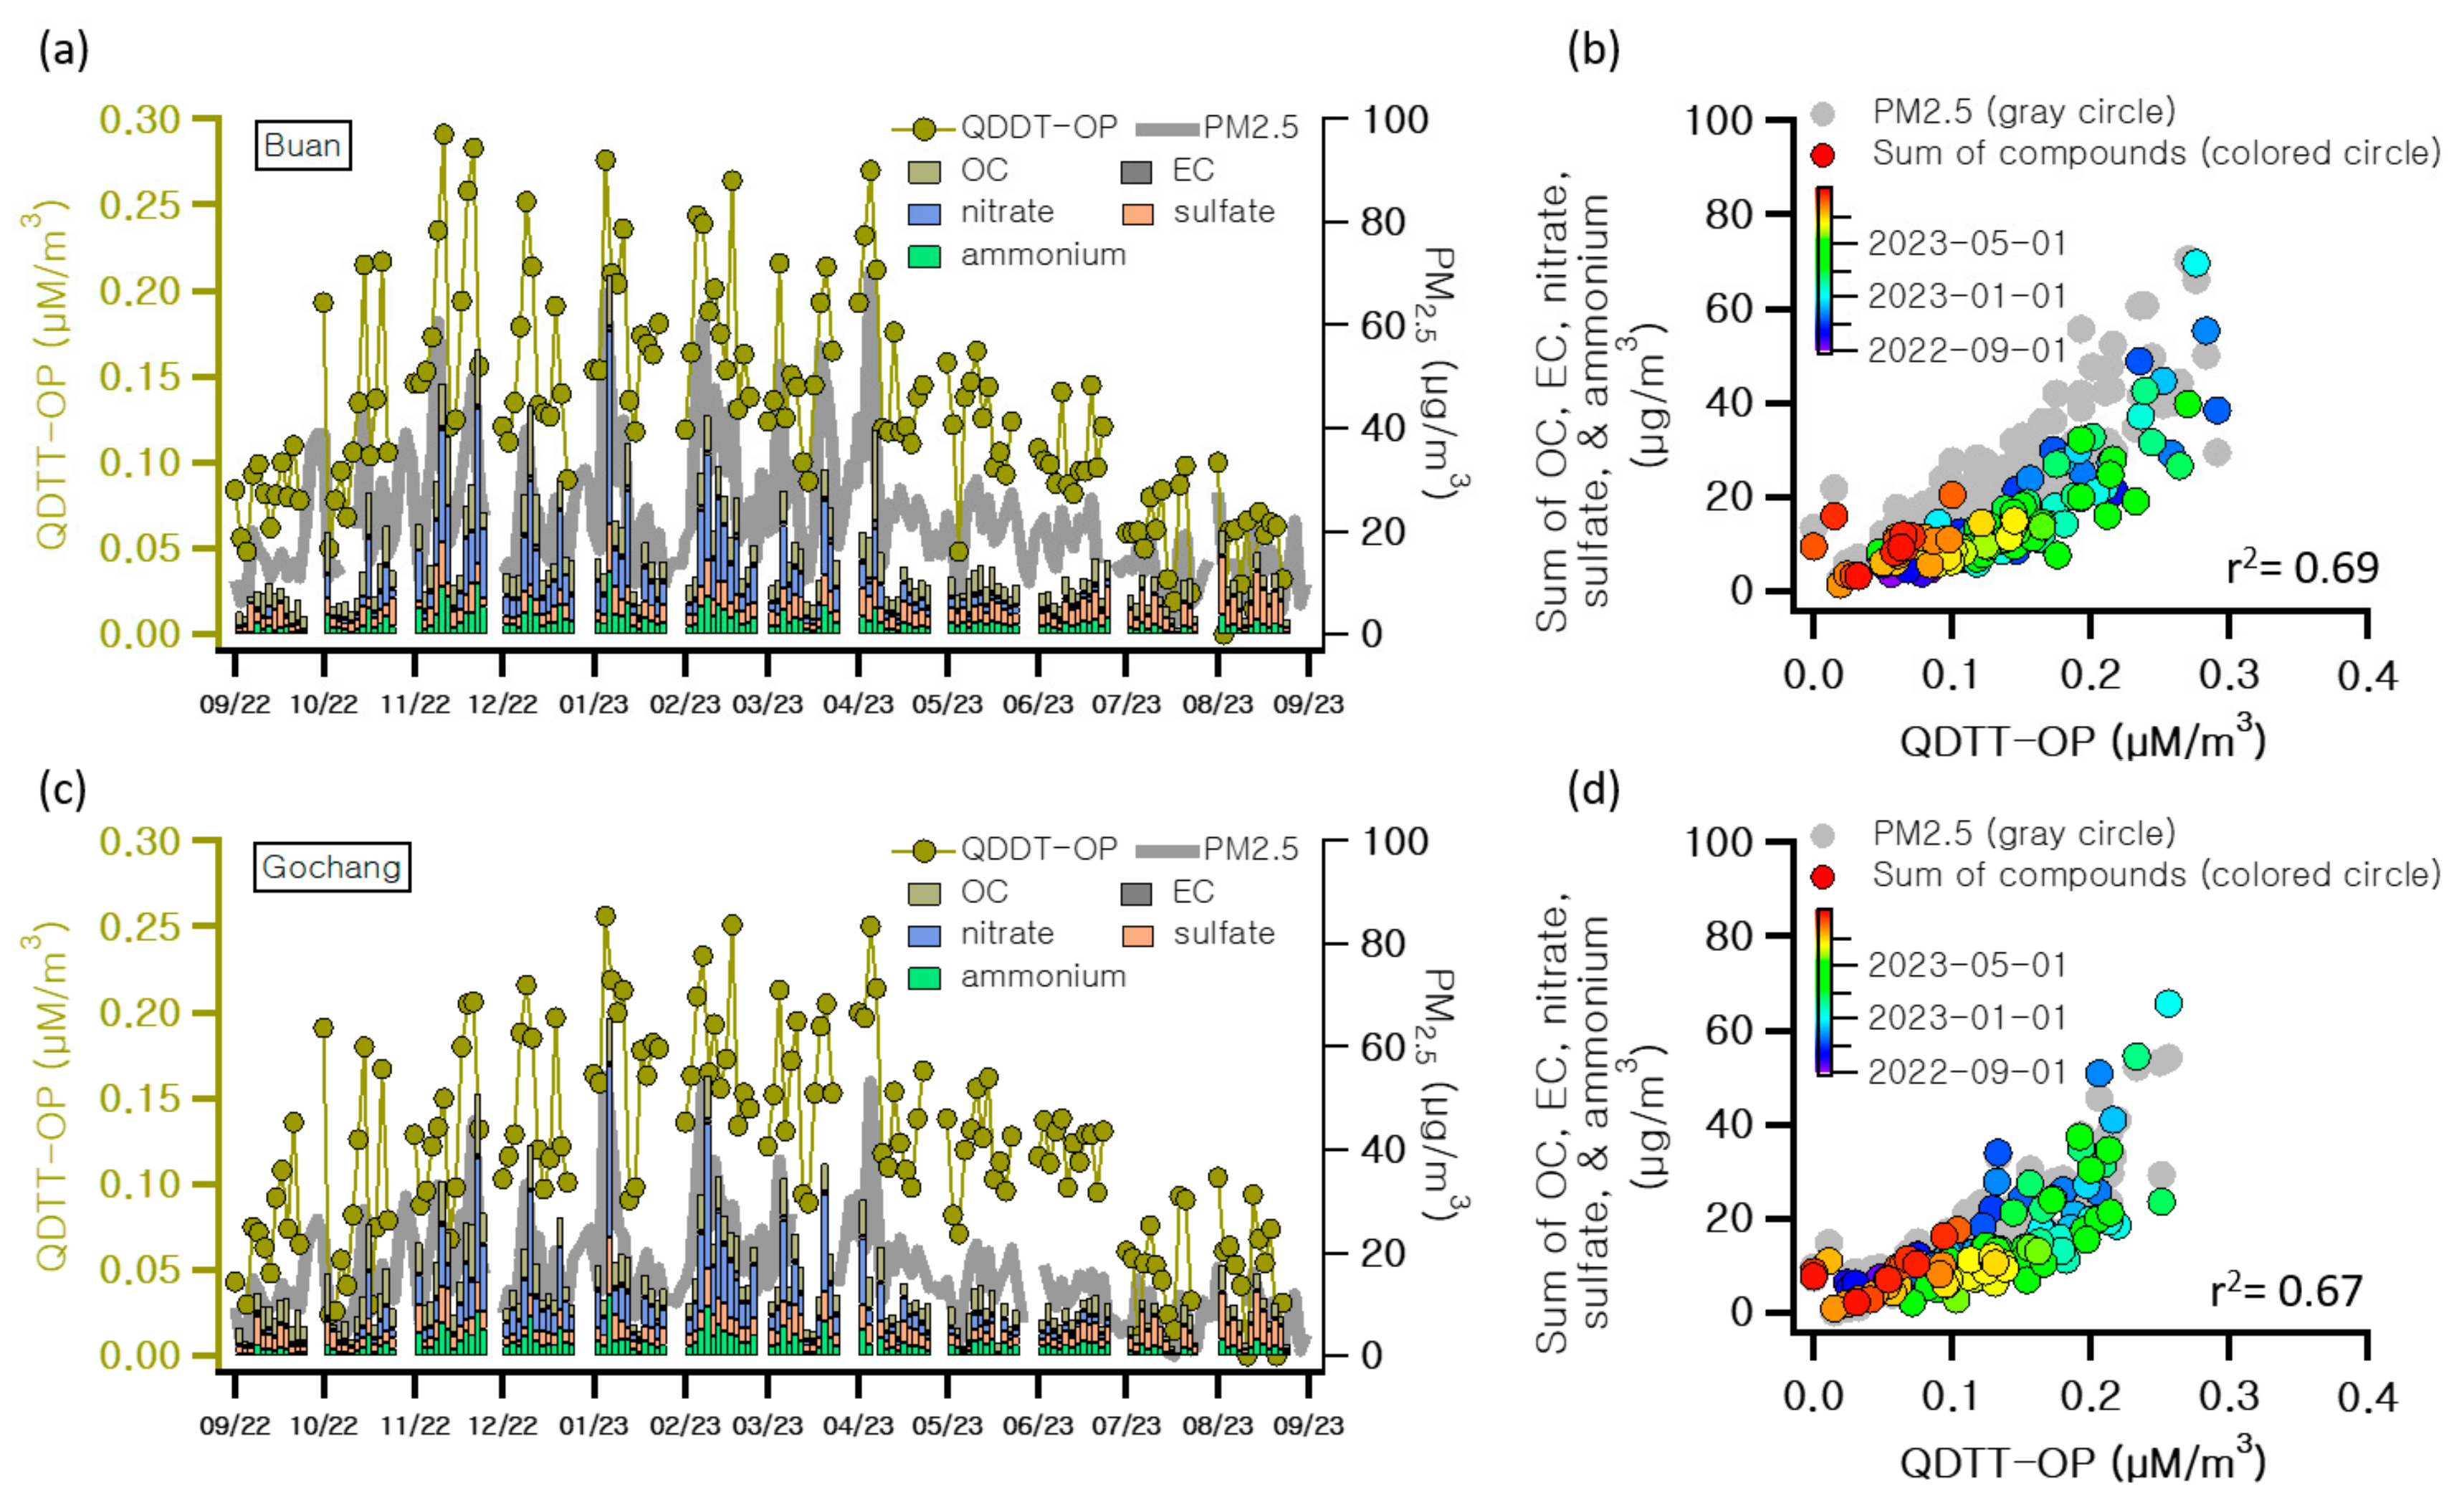
| PM2.5 | μg/m3 | 22.47 ± 12.24 | 15.97 ± 9.78 |
| OC | μg/m3 | 4.23 ± 2.46 | 3.80 ± 2.12 |
| EC | μg/m3 | 0.41 ± 0.22 | 0.42 ± 0.21 |
| Cl− | μg/m3 | 0.23 ± 0.27 | 0.28 ± 0.26 |
| NO3− | μg/m3 | 4.05 ± 5.97 | 3.81 ± 5.51 |
| SO42− | μg/m3 | 3.27 ± 1.89 | 3.05 ± 1.82 |
| Na+ | μg/m3 | 0.07 ± 0.06 | 0.01 ± 0.10 |
| NH4+ | μg/m3 | 2.57 ± 1.93 | 2.53 ± 1.84 |
| K+ | μg/m3 | 0.13 ± 0.13 | 0.12 ± 0.11 |
| Levoglucosan | μg/m3 | 0.042 ± 0.044 | 0.057 ± 0.070 |
| 1,2-BCA 1) | μg/m3 | 0.004 ± 0.003 | 0.005 ± 0.003 |
| 1,4-BCA 2) | μg/m3 | 0.015 ± 0.013 | 0.016 ± 0.011 |
| MSA 3) | μg/m3 | 0.029 ± 0.020 | 0.023 ± 0.016 |
| QDTT-OP | μM/m3 | 0.130 ± 0.061 | 0.121 ± 0.057 |
| NHR | - | 0.098 ± 0.048 | 0.077 ± 0.039 |
| NOR | - | 0.207 ± 0.174 | 0.205 ± 0.173 |
| SOR | - | 0.419 ± 0.148 | 0.594 ± 0.181 |
| [NH4+]/[SO42−] | - | 4.53 ± 3.20 | 4.67 ± 2.23 |
| [NO3−]/[SO42−] | - | 1.98 ± 2.69 | 1.83 ± 1.91 |
| Compound | QDTT | OC | EC | LEVOG | 1,2-BCA | 1,4-BCA | MSA | |
|---|---|---|---|---|---|---|---|---|
| Unit | μM/m3 | μg/m3 | μg/m3 | μg/m3 | μg/m3 | μg/m3 | μg/m3 | |
| Fall | Buan | 0.132 ±0.066 | 4.645 ±2.726 | 0.288 ±0.141 | 0.029 ±0.022 | 0.005 ±0.002 | 0.018 ±0.015 | 0.025 ±0.01 |
| Gochang | 0.100 ±0.053 | 4.871 ±2.544 | 0.35 ±0.162 | 0.029 ±0.02 | 0.005 ±0.002 | 0.015 ±0.011 | 0.022 ±0.009 | |
| Winter | Buan | 0.172 ±0.047 | 5.14 ±2.402 | 0.542 ±0.232 | 0.091 ±0.05 | 0.005 ±0.002 | 0.023 ±0.015 | 0.02 ±0.01 |
| Gochang | 0.164 ±0.045 | 4.36 ±1.997 | 0.514 ±0.263 | 0.115 ±0.096 | 0.006 ±0.003 | 0.020 ±0.012 | 0.014 ±0.008 | |
| Spring | Buan | 0.145 ±0.045 | 4.392 ±2.708 | 0.517 ±0.222 | 0.037 ±0.035 | 0.004 ±0.003 | 0.012 ±0.007 | 0.037 ±0.025 |
| Gochang | 0.144 ±0.043 | 3.65 ±1.702 | 0.519 ±0.193 | 0.066 ±0.062 | 0.005 ±0.003 | 0.018 ±0.01 | 0.032 ±0.023 | |
| Summer | Buan | 0.072 ±0.034 | 2.75 ±0.984 | 0.305 ±0.102 | 0.012 ±0.012 | 0.001 ±0.001 | 0.006 ±0.004 | 0.035 ±0.026 |
| Gochang | 0.075 ±0.041 | 2.272 ±1.013 | 0.308 ±0.118 | 0.018 ±0.018 | 0.002 ±0.002 | 0.011 ±0.008 | 0.023 ±0.014 | |
Disclaimer/Publisher’s Note: The statements, opinions and data contained in all publications are solely those of the individual author(s) and contributor(s) and not of MDPI and/or the editor(s). MDPI and/or the editor(s) disclaim responsibility for any injury to people or property resulting from any ideas, methods, instructions or products referred to in the content. |
© 2024 by the authors. Licensee MDPI, Basel, Switzerland. This article is an open access article distributed under the terms and conditions of the Creative Commons Attribution (CC BY) license (https://creativecommons.org/licenses/by/4.0/).
Share and Cite
Song, M.; Kim, M.; Oh, S.-H.; Yu, G.-H.; Choe, S.; Jeon, H.; Ko, D.-H.; Park, C.; Bae, M.-S. Characteristics of Atmospheric Pollutants in Paddy and Dry Field Regions: Analyzing the Oxidative Potential of Biomass Burning. Atmosphere 2024, 15, 493. https://doi.org/10.3390/atmos15040493
Song M, Kim M, Oh S-H, Yu G-H, Choe S, Jeon H, Ko D-H, Park C, Bae M-S. Characteristics of Atmospheric Pollutants in Paddy and Dry Field Regions: Analyzing the Oxidative Potential of Biomass Burning. Atmosphere. 2024; 15(4):493. https://doi.org/10.3390/atmos15040493
Chicago/Turabian StyleSong, Myoungki, Minwook Kim, Sea-Ho Oh, Geun-Hye Yu, Seoyeong Choe, Hajeong Jeon, Dong-Hoon Ko, Chaehyeong Park, and Min-Suk Bae. 2024. "Characteristics of Atmospheric Pollutants in Paddy and Dry Field Regions: Analyzing the Oxidative Potential of Biomass Burning" Atmosphere 15, no. 4: 493. https://doi.org/10.3390/atmos15040493