Highlights
- What are the main findings? What is the implication of main findings?
- Hygroscopicity was primarily governed by inorganic fractions in particles;
- The abundance of individual constituent ionic species was highly responsible for aerosol water uptake.
Abstract
To determine the link between hygroscopicity and the constituent chemical composition of real biomass-burning atmospheric particles, we collected and analyzed aerosols during wheat-straw (April–May), rice-straw (October–November), and no-burning periods (August–September) in 2008 and 2009 in Patiala, Punjab. A hygroscopicity tandem differential mobility analyzer (HTDMA) system was used to measure hygroscopicity at ~5 to ~95% relative humidity (RH) of aerosolized 100 nm particles generated from the water extracts of PM0.4 burning and no-burning aerosol samples. The chemical analyses of the extracts show that organic carbon and water-soluble inorganic-ion concentrations are 2 to 3 times higher in crop-residue burning aerosol samples compared to no-burning aerosols, suggesting the substantial contribution of biomass burning to the carbonaceous aerosols at the sampling site. We observed that aerosolized 100 nm particles collected during the crop-residue burning period show higher and more variable hygroscopic growth factor (g(RH)) ranging from 1.21 to 1.68 at 85% RH, compared to no-burning samples (1.27 to 1.33). Interestingly, crop-residue burning particles also show considerable shrinkage in their size (i.e., g(RH) < 1) at lower RH (<50%) in the dehumidification mode. The increased level of major inorganic ions in biomass-burning period aerosols is a possible reason for higher g(RH) as well as the observed particle shrinkage. Overall, the measured g(RH), together with the correlation observed between aerosol water content and ionic-species volume fraction, and the study of the abundance of individual constituent ionic species suggests that inorganic salts and their proportion in aerosol particles primarily governed the aerosol hygroscopicity.
1. Introduction
Biomass burning contributes significantly to carbonaceous particulate matter in the atmosphere that has detrimental impacts on a local, continental, and global scale with direct climate implications, and which poses serious health risk to human [1,2,3]. Several studies have evaluated the contribution of organic and black-carbon aerosols from biomass burning to radiative forcing; these effectively reduce the amount of sunlight reaching the Earth’s surface, consequently warming the lower and middle troposphere [4,5,6]. The combined radiative impact of any aerosol particle is dependent not only on the scattering and absorption of sunlight, but also on its lifetime. Most of the particles generated during biomass burning generally have aerodynamic diameters < 1 µm, and thus they are not efficiently removed through dry deposition. Rather, the removal rate of these particles (enriched with hygroscopic constituents) is strongly determined by the efficiency with which they act as cloud condensation nuclei [7,8]. Thus, the hygroscopic properties of aerosol particles are known to strongly influence their size distribution, atmospheric chemical reactions, and lifetime. Additionally, the cloud nucleating properties of biomass-burning particles modify the light scattering, influencing cloud albedo [9,10,11] and cloud lifetime [12,13].
In South and Southeast Asia, three types of burning activities dominate: (i) forest fires, (ii) agricultural crop-residue burning, and (iii) grassland fires, with India exhibiting the second highest crop-residue burning [14,15]. Farmers in Asian nations frequently engage in agricultural burning as a method to enhance soil nutrition and boost agricultural productivity. In the northwest region of India, primarily in the states of Punjab, Haryana, and western Uttar Pradesh, significant open burning of crop-residue occurs biannually, during the post-harvest periods, between October and November (mainly rice) and April and May (mainly wheat) [14,16], producing huge amounts of carbonaceous aerosols and trace gases [17]. Despite ongoing efforts to better understand the activation properties of carbonaceous aerosols [18,19,20], here is still considerable uncertainty in determining the hygroscopic properties of aerosols. While there is still a lack of precise quantitative comprehension regarding the activation efficiency of biomass-burning particles, observational evidence suggests that these aerosols have the capacity to modify cloud characteristics. So far, the hygroscopic properties of standard- or organic–inorganic-mixture compounds have been evaluated in many laboratory-based studies [21,22,23,24,25] to correlate particle hygroscopicity and chemical composition. However, the model particles may not completely represent the real biomass-burning aerosol particles, which are more complex in composition.
Therefore, to address gaps in the current understanding of biomass burning-derived aerosol particles on their interaction with water vapor, we have collected fresh wheat- and rice-crop-residue burning aerosols from Patiala and measured hygroscopic properties of 100 nm particles generated from water extracts of PM0.4 using a hygroscopicity tandem differential mobility analyzer (HTDMA) system [26]. Smoke characteristics undoubtedly undergo changes following emission as ambient smoke travels from its source regions, ages, and interacts with other atmospheric constituents. Nonetheless, fresh biomass-burning emissions remain significant in source regions and serve as the initial stage for predicting the atmospheric transformation. In this study, we assessed the role of constituent organic and inorganic species in governing the hygroscopic characteristics of aerosols. We found that the abundance of the water-soluble inorganic fraction is innately related to the enhanced hygroscopic growth factor of crop-residue burning particles.
2. Materials and Methods
2.1. Aerosol Sampling
Patiala district is situated in the southeastern region of Punjab state in northern India. It is positioned between latitudes 29.49° N and 30.47° N and longitudes 75.58° E and 76.54° E. This district is primarily an agricultural area, with 59.7 percent of its population residing in rural areas, according to the 2011 census. Wheat and rice are the two primary crops in the district, occupying over 86% of the total cropping area. In Punjab, the area under rice increased with an annual compound growth of 4.82 from 1960–1961 to 2013–2014, and the area under wheat increased by 1.71% during the same period [27]. Three sampling sites were selected in and around Patiala district as per the land use pattern covering rural (agricultural), commercial, and semi-urban sites. Site 1, Sidhuwal Village, is situated approximately 6.0 km northwest of Patiala city. This location exemplifies a rural area surrounded by numerous agricultural fields. Site 2, Sanauri Adda, is situated in the Sanauri Adda market area in the southeast of Patiala city. It is a commercial site characterized by a dense population and several cottonseed oil mills. Site 3, the Military Area, located southwest of Patiala city, was chosen as a semi-urban site. It is 5.0 km from the city and is surrounded by a large agricultural area.
Aerosol samples were collected on pre-combusted quartz filters using an Andersen impactor sampler (9 size bins: Dp < 0.4, 0.4–0.7, 0.7–1.1, 1.1–2.1, 2.1–3.3, 3.3–4.7, 4.7–5.8, 5.8–9.0, and >9.0 μm) with a flow rate of 28 L min−1 for ~72 h, in and around Patiala district. The samples were collected during wheat-straw burning (n = 4, April–May), rice-straw burning (n = 4, October–November), and in the no-burning period (n = 2, August–September) in 2008 and 2009. The filter samples were conditioned in a desiccator and stored in a glass jar at −20 °C. Shortly after sample collection, hygroscopic measurement and other chemical analyses were performed. The sampling details are given in Table 1. Analysis of Indian Remote Sensing Satellite (IRS-P6) Advanced Wide Field Sensor (AWiFS) data for Punjab state, India, during wheat- and rice-crop harvesting seasons in 2005 revealed that approximately 5504 sq. km area was burnt during wheat crop-residue burning, while 12,685 sq. km were impacted by rice crop-residue burning [28]. In the present study, the fire count data for the aerosol sampling days were obtained from the Fire Information for Resource Management System (FIRMS).

Table 1.
Sampling details of aerosols collected during wheat- and rice-residue burning events with Sample Identification (I.D.).
2.2. Hygroscopicity Measurement
The hygroscopicity of 100 nm (mobility diameter) aerosol particles at RH ranging from ~5% to ~95% was studied using the hygroscopicity tandem differential mobility analyzer (HTDMA) [21] in both humidification (increasing-RH condition) and dehumidification (decreasing-RH condition) modes at 293–298 K, obtaining the aerosol hysteresis behavior.
The aqueous extracts of filter samples (PM0.4) were prepared with Milli-Q water (12–15 mL) under ultrasonication (10 min, 3 times), followed by filtration with quartz wool and a membrane (0.22 µm, Millipore). From the filtered aqueous solution, aerosol particles were produced using an atomizer. The aerosols were dehydrated (~5%) when passed through 2 diffusion dryers in series and introduced to the HTDMA system (flow rate 0.3 L min−1). In-depth details regarding the HTDMA system are given in [21]. Briefly, the dried and neutralized particles (100 nm) were classified by the first differential mobility analyzer (DMA1, TSI model 3081), then introduced into the aerosol humidity conditioner (humidification mode) or to the prehumidifier controlled by the Nafion tube (~95% RH) in advance (dehumidification). The resulting size and number of particles were measured with the second DMA (DMA2, TSI model 3081) and a condensation particle counter (CPC, TSI model 3010), respectively. Water vapor was introduced into the DMA2 sheath air via the Nafion system, maintaining the relative humidity (RH) at a level nearly identical to that of the aerosol sample. RH levels within DMA2 were monitored at the sample and sheath air outlet, ensuring uniform RH throughout the DMA2. More details about the standards and quality control can be found elsewhere [26].
The hygroscopic growth factor, g(RH), was calculated from the ratio of particle mobility diameter, dm(RH), at high RH relative to that at ~5%, as follows:
The aerosol water content (AWC) for all samples was calculated using HTDMA, which is given as the ratio of water volume in a single aerosol particle (VW) relative to that of the dry aerosol particle (Vdry), as
It is assumed that wet particles are spherical and that the water associated with dry particles at ~5% RH is insignificant. The dynamic shape factor (χdry) value was determined to be 1.02, as explained in the previous work [26] and references therein.
2.3. Chemical Composition
Water-soluble inorganic ions such as K+, NH4+, Ca2+, Mg2+, Na+, Cl−, NO3−, SO42−, F− and methanesulfonic acid (MSA) in aerosol water extracts were quantified. An aliquot of each filter was extracted in Milli-Q water (20 mL) followed by ultrasonication (20 min) and filtration. Major inorganic ions were quantified using a Metrohm-761 ion chromatograph (IC) coupled with an autosampler [29].
For the analysis of organic carbon (OC) and elemental carbon (EC), a filter punch was placed in the chamber of semi-continuous Sunset Lab OC/EC Analyzer following the Interagency Monitoring of Protected Visual Environments (IMPROVE) protocol. More details on the methodology can be found elsewhere [29]. The reported concentrations for PM mass concentration, carbonaceous constituents, and inorganic ions were corrected for field blanks.
3. Results and Discussion
3.1. Mass–Size Distribution and Chemical Composition of Aerosols
Crop-residue burning emits abundant fine-mode fractions of aerosol particles, as confirmed in various studies conducted over Northern India [30,31,32]. The mass–size distribution of crop-residue burning and no-burning aerosols is shown in Figure 1. The crop-residue burning particles were collected at burning source, so they were very fresh and therefore the obtained unimodal distribution (Figure 1) can be considered as the representative mass–size distribution of aerosols from agriculture-residue burning. We found a significant high average mass concentration (13 ± 4.6 µg m−3) of crop-residue burning aerosols on ultra-fine mode (diameter < 0.4 µm) particles compared to that of no-burning aerosols (6.8 ± 2.5 µg m−3). The average mass concentration of PM2.1 (summing up the mass concentrations from backup stage to 2.1 µm stages) is observed to be 82 ± 13.4 µg m−3 in crop-residue burning aerosols, whereas in no-burning PM2.1 mass concentration it is 43 ± 0.2 µg m−3 (Table 2). So, we observed that crop-residue burning PM0.4 and PM2.1 mass concentration values are about 2 times higher than that of no-burning aerosols. Additionally, in crop-residue burning aerosols, a prominent peak is evident in the size range 0.7–2.1 µm, followed by an abrupt decline in greater size range (>2.1 µm). A similar significant peak is not seen in the case of no-burning samples, where mass concentration remained high from 0.4 up to 4.7 µm. Previous studies conducted in Patiala during 2008–2009 showed that vehicular emissions significantly contribute to the PM-mass loading during the no-burning period [33,34]. Further, considering the upper-end value of PM0.4, it markedly contributed to PM-mass loading (more than 50%) in peak size ranges, which is also one of the reasons that highlights the importance and relevance of studying hygroscopic and chemical properties in ultra-fine-mode aerosols.
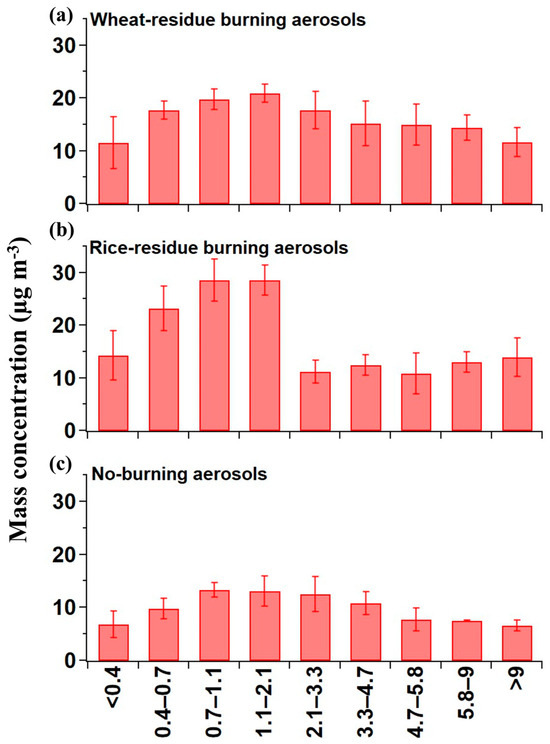
Figure 1.
Mass–size distribution of the (a) wheat-residue burning, (b) rice-residue burning, and (c) no-burning aerosols.
Table 2.
Statistical summary of atmospheric concentrations of PM mass elements (µg m−3), carbonaceous elements (µg m−3) and water-soluble inorganic (WSI) ions (µg m−3) in Patiala during crop-residue (wheat and rice) burning and a no-burning event. WSI ions, OC, and EC are evaluated for PM0.4 size fraction of collected aerosols. SD represents the standard deviation.
In Table 2, we also showed the concentration of PM9 (summing up the mass concentrations from backup stage to 9.0 µm stages) just for a comparison with PM2.1 (~PM2.5) and PM9 (~PM10) concentrations under burning and no-burning conditions. Both PM2.5 and PM10 are the important parameters of the National Ambient Air Quality Standards (NAAQS) and crossed the regulatory limits set for 24 h in India (i.e., 60 µg m−3 and 100 µg m−3, respectively) during the crop-residue burning period.
Furthermore, Figure 2 shows enhanced OC, as well as total inorganic-ion concentrations, in samples collected during the burning period ranging from 4.3 to 15.6 µg m−3 (average = 10 ± 4.2 µg m−3) and 4.6 to 13 µg m−3, (average = 7.3 ± 3 µg m−3), respectively, which are about 2.3 to 2.7 times higher in value compared to no-burning samples (Table 2). However, in some samples (S4 and S5), OC and WSI mass concentrations are relatively less, compared to other crop-residue burning samples. One of the possible reasons for this can be attributed to the higher average boundary-layer height (i.e., 2100 to 2500 m agl) observed during 15–17 May 2008 (S4 sample) and 29 April 2008 (S5 sample), as plotted in Figure 2. The hourly boundary-layer height values during the aerosol sampling duration are accessed from the Modern Era Retrospective analysis for Research and Applications (MERRA-2) dataset. In addition to boundary layer dynamics, the severity and duration of fires, along with other meteorological factors like mixing and dilution (wind velocity and direction) processes might be some other reasons for this anomaly. Nevertheless, it is asserted that crop-residue burning activities positively add to the mass loading/concentration of aerosols in the atmosphere.
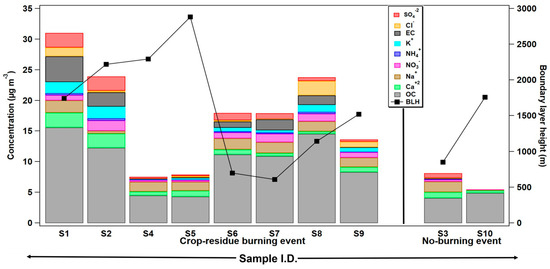
Figure 2.
Mass concentration of elemental carbon (EC), organic carbon (OC), and some major water-soluble inorganic ions (WSIs) (µg m−3) determined in ambient aerosol particles during crop-residue burning and no-burning events in Patiala, Punjab. Boundary layer height (m agl) during the aerosol sampling days is also depicted (see Table 1 for sampling details).
Figure 3a,b show the number of fire hotspots during crop-residue burning and the no-burning period respectively, at Patiala, for all samples. For the aerosol sampling days, the fire count data are obtained from Fire Information for Resource Management System (FIRMS). With the view of evaluating the influence of crop-residue burning activities on the chemical composition of aerosols, we have evaluated the correlation between the number of fire spots at the sampling site and the mass concentration of OC (r = 0.59, n = 10) and K+ (r = 0.45, n = 10), the important chemical tracers of biomass burning, in PM0.4 samples (Figure 3c). The calculated correlation value between the number of fires and OC becomes more significant/positive (in magnitude) if we exclude the deviation observed in the datasets in sample S1 (i.e., r = 0.79, n = 9). One of the potential reasons for the relatively high OC concentration (16 µg m−3) with respect to the lower number of fire counts (around 62) in the S1 sample, is the lower boundary height (1500 m agl) during 17–20 April 2009. To summarize, a moderate positive correlation between the number of fires and OC and K+, as well as enhanced OC and total WSI during the burning events, confirm that in Patiala, crop-residue burning contributes substantially to the carbonaceous aerosols.
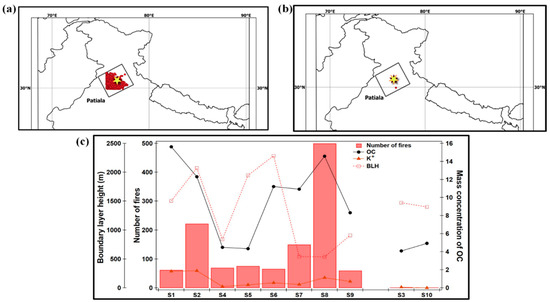
Figure 3.
Number of fire spots represented by red dots during (a) crop-residue (wheat and rice) burning and (b) no-burning period, and (c) relationship between number of fires and OC-mass concentrations for all samples. The sampling details and sample I.D.s are as indicated in Table 1.
3.2. Hygroscopic Growth Factors of Crop-Residue Burning and No-Burning Samples
In Figure 4a,b, the measured average hygroscopic growth factors g(RH) of crop-residue burning and no-burning ambient aerosols are plotted for 100 nm dry particles as a function of RH in the humidification and dehumidification modes. A particle’s reaction to varying relative humidity levels (assuming it reacts at all) typically displays some degree of non-linearity. As observed in the figure, the growth factors increase as the RH increases; however, a stepwise increase in growth factor which can be typically seen for pure inorganic species in the deliquescence phase is not observed for ambient aerosol particles. First looking at the crop-residue burning particles (Figure 4a), it can be seen that at high RH (>60%), g (RH) in both the modes is very similar. Furthermore, in the humidification mode, g(RH) at 85% ranged from 1.26 to 1.49 (average = 1.35) for crop-residue burning particles, which is higher in value and showed large variability compared to that of no-burning particles (range = 1.27 to 1.33; average = 1.31) (Table 3). As discussed in the previous section, inorganic ions, especially SO42−, NO3−, Cl−, Na+, K+ and Ca2+ peak in burning-period samples as compared to non-burning period samples. These increased levels of major ions in the burning-period aerosol were possibly a reason for higher g(RH). Nevertheless, the large variability in hygroscopicity of burning-period particles can be explained by their several-fold increased level of organic carbon (OC) (up to 3-fold) compared to those of non-burning-period aerosols (average OC~4 μg m−3).
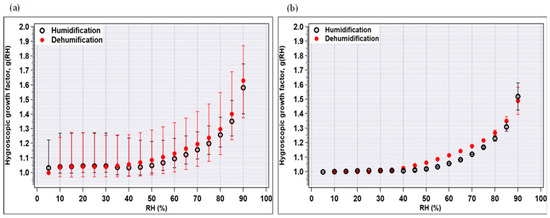
Figure 4.
Hygroscopic growth factors of (a) crop-residue burning, and (b) no-burning samples as a function of RH for the humidification and dehumidification modes. The minimum and maximum values are indicated by bars and the average values by circles.
Table 3.
The average and range values of hygroscopic growth factors of crop-residue burning and no-burning aerosols at RH levels 85% and 50%.
In general, g(RH) in the dehumidification mode is observed to be slightly higher than that in the humidification mode, due to hysteresis observed for the majority of the individual samples. Hysteresis, in the present context, can be defined as the difference in average g(RH) during the processes of increasing RH (humidification) and decreasing RH (dehumidification). This effect is more pronounced for pure inorganic salts, due to their highly hygroscopic nature, meaning they readily absorb and release moisture from the surrounding atmosphere. However, it is noteworthy that even in a low-RH condition (50%) in the humidification mode, average g(RH) is equal to or higher than unity in all aerosol particles, i.e., 1.00–1.21, for the no-burning period. On the other hand, for the crop-residue burning aerosol, shrinkage in size is observed at RH < 50%, possibly attributed to the abundance of inorganic ions. Many studies have shown that inorganic salts tend to restructure, i.e., become more compact or show a reduction in mobility diameter at low-RH conditions (<50%) (below salt’s deliquescence point) [35,36,37]. The role of inorganics is further explained in the following section.
3.3. Hygroscopic Growth Factors of Wheat- and Rice-Residue Burning Samples
The measured growth factors of wheat- and rice-residue burning samples are plotted in Figure 5 as a function of RH.
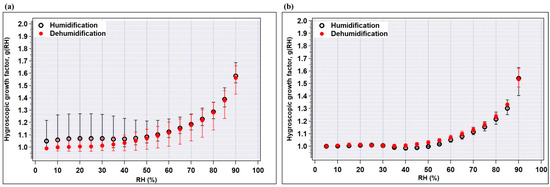
Figure 5.
Hygroscopic growth factors of (a) wheat-residue, and (b) rice-residue burning samples as a function of RH for the humidification and dehumidification modes. The minimum and maximum values are indicated by bars and the average values by circles.
At high RH (> 60%), no significant difference was observed in the humidification and dehumidification mode for both types of samples, i.e., the growth factor changes do not depend on the history of RH (beyond 60% RH).
In the humidification mode, the obtained g(RH) values in wheat-burning samples are 1.08, 1.12, 1.22, 1.38 at 50, 60, 75, and 85% RH, which are higher than the values of the rice-burning samples (i.e., 1.04, 1.05, 1.15 and 1.30 at 50, 60, 75, and 85% RH, respectively) (Figure 5 and Table 4). Furthermore, the difference between minimum and maximum growth factors (or wider variance) observed in particles produced in the combustion of wheat residue is more prominent than in rice-residue burning samples. One possible reason for this is the variable chemical composition of wheat- and rice-burning aerosols, as can be seen in Figure 6. Several studies suggest that the hygroscopic properties, which govern the water uptake by particles, depend strongly on the aerosol chemical composition [38,39,40]. It is noteworthy that in Figure 4a and Figure 5a, the maximum value of g(RH) at low RH levels (i.e., <10% to 40%) (indicated by bars) is significantly higher than unity. This anomaly is due to the sample no. S2, which contains 2–3 times higher nitrate abundance compared to other samples and shows maximum aerosol water content (AWC). This feature is explained in detail in the following sections. A previous study reported that at low RH levels (<10%) heterogeneous nucleation is promoted through the chemisorption of NO3− onto the aerosol particle surface [41].
Table 4.
The average and range values of hygroscopic growth factors of wheat- and rice-residue burning aerosols at RH levels 85% and 50%.
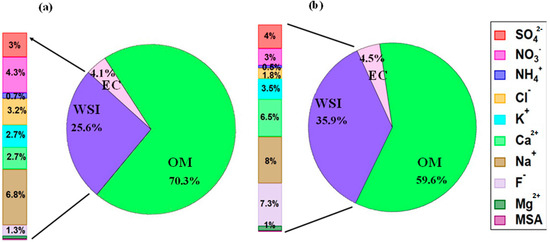
Figure 6.
Chemical compositions of ultrafine PM0.4 from (a) rice-residue burning, and (b) wheat-residue burning aerosols (OM, organic matter = OC × 1.6).
The biomass-burning particles in the accumulation mode (most important for cloud interactions) are internally mixed particles with a core of black carbon coated with organic species [42]. They are typically made up of tar balls, organic–inorganic mixed particles and sooty chains, which are heterogeneously distributed over the particle-size distribution [43]. Field studies suggest that sooty agglomerates/organic-rich particles are generally hydrophobic in nature, while the mixed organic–inorganic particles take up water (or show hygroscopic growth), and are majorly dependent on the water-soluble organics [44,45,46,47].
In our study, we found that the total number of water-soluble inorganic ions in wheat-burning aerosols is 1.5 fold higher than that of rice-burning aerosols (Figure 6). This may be one important reason for higher growth factors in wheat-residue burning samples. However, due to the heterogeneity of combustion-derived aerosols, the hygroscopic response of aerosol particles to varying environmental RH is complex and needs further investigation. Also, the ratio of constituent organic–inorganic species depends on burning conditions, i.e., smoldering, or flaming. It is also evident from Figure 6 that the bulk composition of both wheat- and rice-residue burning aerosols is carbonaceous, with higher organic matter content in rice-residue burning aerosols as compared to wheat-residue burning aerosol particles. Rice-residue burning aerosols, on the other hand, show significantly higher levels of Cl− and NO3− compared to wheat-residue burning particles. In contrast, wheat-residue burning aerosols contain more Ca2+ and F−. These varying concentrations suggest different levels of micronutrient uptake by rice and wheat [48,49]. Further, the variability could probably be explained by the fact that the ionic composition of crop-residue burning-derived aerosols was related to the physical (such as density and moisture content) and/or chemical properties of the respective crop type [50]. Nevertheless, it is suggested that beyond chemistry and size, the hygroscopicity (micro-physical property) of ultrafine particles produced from agricultural crop-residue burning plays a significant role in the aerosol behavior. Thus, it should be taken into account when assessing their impact on respiratory health and in regional climate models, to minimize uncertainties in the results.
To further explore the role of organics and/or inorganics in water uptake by aerosol particles, we plotted aerosol water content (AWC) (Vw/Vdry) measured by HTDMA at 85% RH as a function of the volume fraction of organic matter and inorganic ions for rice- and wheat-residue burning samples, as shown in Figure 7a,b, respectively. A clear increasing trend and positive correlation (r2 = 0.38) between the datasets (Figure 7b) indicate a substantial contribution of inorganic ions to AWC. By contrast, no correlation (r2 = 0.09) was seen in the case of OM volume fraction (Figure 7a) suggests that the AWC is not highly sensitive to the abundance of OM in the studied particles. It is also important to consider the type and relative abundance of individual inorganic species in the particles to better understand the water-uptake tendency of the particles. As it can be seen in Figure 7a, the wheat-residue burning sample represented by an open square symbol (sample S2) has an almost comparable OM volume fraction with that of other wheat-residue burning aerosols; however, its AWC value is maximum. This can be explained by an almost 2-to-3-times higher relative abundance of nitrate ions in total WSI in sample S2 (i.e., 15%; 1.65 µg m−3) compared to samples S1, S4, and S5 (5 to 6%; 0.87 µg m−3, 0.25 µg m−3, 0.27 µg m−3, respectively) (Figure 2). In a study [51], it is suggested that nitrate particles internally mixed with organic species (oxalic and succinic acids) show continuous water uptake with increasing RH; therefore, the nitrate salts potentially have a significant impact on the hygroscopic nature and consequently the AWC of particles, particularly in urban regions, where nitrate concentrations are elevated. Nitrate salts like ammonium nitrate, particularly in submicron particles, have a tendency to absorb water steadily at low RH levels without obvious phase transitions [36]. Mixed aerosols containing nitrate salts and organic constituents demonstrate different phase characteristics and hygroscopic expansion depending on the specific components present in the particles. Results suggest that hygroscopicity is not broadly dependent on organic–inorganic composition, but that also the abundance of individual constituent species is important to consider. Therefore, the hygroscopic growth factors for the aerosol water extracts, together with the agreement/correlation observed between AWC and the ionic-species fraction, and individual ionic composition/abundance suggest that the water-soluble inorganic fraction of the crop-residue combustion particles potentially plays a significant role in governing the hygroscopic properties of the combustion-derived aerosols. Based on our results, the relative abundances among co-existing inorganic and organic species in the crop-residue combustion aerosol is the key driver of hygroscopicity. To establish a more general relationship between crop-residue burning samples and micro-physical hygroscopic properties, a more extensive study incorporating various agriculture waste-combustion-derived aerosols and integrating their chemical analyses may be important in the future.
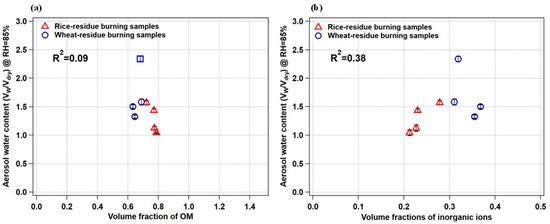
Figure 7.
Relationship between measured aerosol water content (VW/Vdry) and (a) organic matter (OM) volume fraction and (b) inorganic ion volume fraction. Error bars indicate standard deviation in aerosol water-content calculations.
4. Conclusions
We report measurements of hygroscopic properties of fresh-wheat- and rice-crop-residue-burning water-extracted re-aerosolized 100 nm particles using a tandem differential mobility analyzer (HTDMA) and related chemical composition of aerosols for the first time over Northern India, Patiala.
Biomass burning significantly enhanced the mass concentration of PM2.1 and ultrafine PM0.4 particles with a 2-to-3-fold higher abundance of carbonaceous matter and inorganic ions. The increased number of fire counts coincides reasonably well with the OC concentration in the collected aerosols, indicating the dominance of smoke aerosols from agricultural crop-residue burning in Patiala.
Hygroscopic characteristics pertain to how a group of aerosol particles reacts to fluctuations in relative humidity. The way a particle reacts to shifts in humidity, such as from <10% to >90%, depends on its size and chemical composition. Both wheat- and rice-crop-residue aerosols (100 nm) were found to be substantially hygroscopic within all the RH range (~5 to ~95% RH). In this study, we found that the wheat-residue burning aerosols having a higher (lower) fraction of inorganic ions (carbonaceous species) were more sensitive to water uptake than the rice-residue combustion aerosols. Thus, we observed that hygroscopic growth factors and aerosol water content of ultrafine crop-residue-burning aerosol particles scale with the inorganic volume fraction, and that the hygroscopic growth depends on the type and abundance of constituents present in the particles. We reiterate that our findings specifically pertain to real freshly released ambient aerosols from biomass burning, which represent one significant subgroup within the broader spectrum of ambient aerosols. However, our findings are in agreement with the field studies in the literature reported in this study; that is, in most of the cases, the water uptake by aerosols is potentially governed by the abundance of water-soluble inorganics.
Our results support the growing body of literature suggesting that accounting for the influence of ultrafine aerosols derived from biomass burning on water uptake and release can be crucial for accurately modeling the hygroscopic behavior of ambient aerosols. Understanding the optical properties and impacted regions of biomass-burning aerosols is crucial for climatic research, especially considering the rising trend in agricultural burning over the past decade.
Author Contributions
Conceptualization, S.G.A. and K.K.; methodology, A.K.A., K.S., S.G.A. and K.K.; validation, A.K.A., K.S. and S.G.A.; formal analysis, S.G.A. and A.K.A.; investigation, S.G.A.; resources, S.G.A. and R.A.; data curation, A.K.A. and S.G.A.; writing—original draft preparation, A.K.A.; writing—review and editing, S.G.A.; supervision, S.G.A. and P.J.; project administration, P.J., S.G.A. and K.K. All authors have read and agreed to the published version of the manuscript.
Funding
This research received no external funding.
Institutional Review Board Statement
Not Applicable.
Informed Consent Statement
Not Applicable.
Data Availability Statement
The raw data supporting the conclusions of this article will be made available by the authors on request due to privacy.
Acknowledgments
The authors are thankful to Director, NPL, New Delhi, for all the support and encouragement. A.K.A. is thankful to University Grant Commission (UGC) for providing the fellowship under Project No. 90802 (UGC-SRF fellowship). Funding from OLP 210332 is acknowledged.
Conflicts of Interest
The authors declare no conflicts of interest.
References
- Dunea, D.; Iordache, S.; Pohoata, A. Fine particulate matter in urban environments: A trigger of respiratory symptoms in sensitive children. Int. J. Environ. Res. Public Health 2016, 13, 1246. [Google Scholar] [CrossRef]
- Titos, G.; del Águila, A.; Cazorla, A.; Lyamani, H.; Casquero-Vera, J.; Colombi, C.; Cuccia, E.; Gianelle, V.; Močnik, G.; Alastuey, A.; et al. Spatial and temporal variability of carbonaceous aerosols: Assessing the impact of biomass burning in the urban environment. Sci. Total Environ. 2017, 578, 613–625. [Google Scholar] [CrossRef] [PubMed]
- Adam, M.G.; Tran, P.T.; Bolan, N.; Balasubramanian, R. Biomass burning-derived airborne particulate matter in Southeast Asia: A critical review. J. Hazard. Mater. 2021, 407, 124760. [Google Scholar] [CrossRef]
- Forster, P.; Ramaswamy, V.; Artaxo, P.; Berntsen, T.; Betts, R.; Fahey, D.W.; Haywood, J.; Lean, J.; Lowe, D.C.; Myhre, G.; et al. Changes in atmospheric constituents and in radiative forcing. In Changes in Atmospheric Constituents and in Radiative Forcing; U.S. Department of Energy Office of Scientific and Technical Information: Boulder, CO, USA, 2007; Chapter 2. [Google Scholar]
- Ramaswamy, V.; Collins, W.; Haywood, J.; Lean, J.; Mahowald, N.; Myhre, G.; Naik, V.; Shine, K.P.; Soden, B.; Stenchikov, G.; et al. Radiative forcing of climate: The historical evolution of the radiative forcing concept, the forcing agents and their quantification, and applications. Meteorol. Monogr. 2019, 59, 14.1–14.101. [Google Scholar]
- Alang, A.K.; Aggarwal, S.G.; Singh, K.; Soni, D.; Hegde, P. Light-absorbing properties of polar-and non-polar brown carbon fractions of aerosols in Delhi. Atmos. Res. 2023, 296, 107073. [Google Scholar] [CrossRef]
- Novakov, T.; Corrigan, C. Cloud condensation nucleus activity of the organic component of biomass smoke particles. Geophys. Res. Lett. 1996, 23, 2141–2144. [Google Scholar] [CrossRef]
- Engelhart, G.J.; Hennigan, C.J.; Miracolo, M.A.; Robinson, A.L.; Pandis, S.N. Cloud condensation nuclei activity of fresh primary and aged biomass burning aerosol. Atmos. Chem. Phys. 2012, 12, 7285–7293. [Google Scholar] [CrossRef]
- Nenes, A.; Ghan, S.; Abdul-Razzak, H.; Chuang, P.Y.; Seinfeld, J.H. Kinetic limitations on cloud droplet formation and impact on cloud albedo. Tellus B Chem. Phys. Meteorol. 2001, 53, 133–149. [Google Scholar] [CrossRef]
- Peng, Y.; Lohmann, U. Sensitivity study of the spectral dispersion of the cloud droplet size distribution on the indirect aerosol effect. Geophys. Res. Lett. 2003, 30. [Google Scholar] [CrossRef]
- Qiu, Y.; Zhao, C.; Guo, J.; Li, J. 8-Year ground-based observational analysis about the seasonal variation of the aerosol-cloud droplet effective radius relationship at SGP site. Atmos. Environ. 2017, 164, 139–146. [Google Scholar] [CrossRef]
- Haywood, J.; Boucher, O. Estimates of the direct and indirect radiative forcing due to tropospheric aerosols: A review. Rev. Geophys. 2000, 38, 513–543. [Google Scholar] [CrossRef]
- Ghan, S.J. Estimating aerosol effects on cloud radiative forcing. Atmos. Chem. Phys. 2013, 13, 9971–9974. [Google Scholar] [CrossRef]
- Streets, D.G.; Yarber, K.F.; Woo, J.; Carmichael, G.R. Biomass burning in Asia: Annual and seasonal estimates and atmospheric emissions. Glob. Biogeochem. Cycles 2003, 17. [Google Scholar] [CrossRef]
- Sahu, L.K.; Sheel, V. Spatio-temporal variation of biomass burning sources over South and Southeast Asia. J. Atmos. Chem. 2014, 71, 1–19. [Google Scholar] [CrossRef]
- Venkataraman, C.; Habib, G.; Kadamba, D.; Shrivastava, M.; Leon, J.; Crouzille, B.; Boucher, O.; Streets, D.G. Emissions from open biomass burning in India: Integrating the inventory approach with high-resolution Moderate Resolution Imaging Spectroradiometer (MODIS) active-fire and land cover data. Glob. Biogeochem. Cycles 2006, 20. [Google Scholar] [CrossRef]
- Shaik, D.S.; Kant, Y.; Mitra, D.; Singh, A.; Chandola, H.; Sateesh, M.; Babu, S.S.; Chauhan, P. Impact of biomass burning on regional aerosol optical properties: A case study over northern India. J. Environ. Manag. 2019, 244, 328–343. [Google Scholar] [CrossRef] [PubMed]
- Prenni, A.J.; Petters, M.D.; Kreidenweis, S.M.; DeMott, P.J.; Ziemann, P.J. Cloud droplet activation of secondary organic aerosol. J. Geophys. Res. Atmos. 2007, 112. [Google Scholar] [CrossRef]
- Zhao, D.F.; Buchholz, A.; Kortner, B.; Schlag, P.; Rubach, F.; Kiendler-Scharr, A.; Tillmann, R.; Wahner, A.; Flores, J.M.; Rudich, Y.; et al. Size-dependent hygroscopicity parameter (κ) and chemical composition of secondary organic cloud condensation nuclei. Geophys. Res. Lett. 2015, 42, 10920–10928. [Google Scholar] [CrossRef]
- Slade, J.H.; Shiraiwa, M.; Arangio, A.; Su, H.; Pöschl, U.; Wang, J.; Knopf, D.A. Cloud droplet activation through oxidation of organic aerosol influenced by temperature and particle phase state. Geophys. Res. Lett. 2017, 44, 1583–1591. [Google Scholar] [CrossRef]
- Mochida, M.; Kawamura, K. Hygroscopic properties of levoglucosan and related organic compounds characteristic to biomass burning aerosol particles. J. Geophys. Res. Atmos. 2004, 109. [Google Scholar] [CrossRef]
- Svenningsson, B.; Rissler, J.; Swietlicki, E.; Mircea, M.; Bilde, M.; Facchini, M.C.; Decesari, S.; Fuzzi, S.; Zhou, J.; Mønster, J.; et al. Hygroscopic growth and critical supersaturations for mixed aerosol particles of inorganic and organic compounds of atmospheric relevance. Atmos. Chem. Phys. 2006, 6, 1937–1952. [Google Scholar] [CrossRef]
- Wu, Z.J.; Nowak, A.; Poulain, L.; Herrmann, H.; Wiedensohler, A. Hygroscopic behavior of atmospherically relevant water-soluble carboxylic salts and their influence on the water uptake of ammonium sulfate. Atmos. Chem. Phys. 2011, 11, 12617–12626. [Google Scholar] [CrossRef]
- Hansen, A.M.K.; Hong, J.; Raatikainen, T.; Kristensen, K.; Ylisirniö, A.; Virtanen, A.; Petäjä, T.; Glasius, M.; Prisle, N.L. Hygroscopic properties and cloud condensation nuclei activation of limonene-derived organosulfates and their mixtures with ammonium sulfate. Atmos. Chem. Phys. 2015, 15, 14071–14089. [Google Scholar] [CrossRef]
- Estillore, A.D.; Hettiyadura, A.P.S.; Qin, Z.; Leckrone, E.; Wombacher, B.; Humphry, T.; Stone, E.A.; Grassian, V.H. Water uptake and hygroscopic growth of organosulfate aerosol. Environ. Sci. Technol. 2016, 50, 4259–4268. [Google Scholar] [CrossRef]
- Aggarwal, S.G.; Mochida, M.; Kitamori, Y.; Kawamura, K. Chemical closure study on hygroscopic properties of urban aerosol particles in Sapporo, Japan. Environ. Sci. Technol. 2007, 41, 6920–6925. [Google Scholar] [CrossRef]
- Kumar, N. Agriculture situation in Punjab: An analysis of transformations from labour intensive farming to capital intensive farming. Econ. Aff. 2019, 64, 431–439. [Google Scholar] [CrossRef]
- Ravindra, K.; Singh, T.; Mor, S.; Singh, V.; Mandal, T.K.; Bhatti, M.S.; Gahlawat, S.K.; Dhankhar, R.; Mor, s.; Beig, G. Real-time monitoring of air pollutants in seven cities of North India during crop residue burning and their relationship with meteorology and transboundary movement of air. Sci. Total Environ. 2019, 690, 717–729. [Google Scholar] [CrossRef]
- Aggarwal, S.G.; Kawamura, K.; Umarji, G.S.; Tachibana, E.; Patil, R.S.; Gupta, P.K. Organic and inorganic markers and stable C-, N-isotopic compositions of tropical coastal aerosols from megacity Mumbai: Sources of organic aerosols and atmospheric processing. Atmos. Chem. Phys. 2013, 13, 4667–4680. [Google Scholar] [CrossRef]
- Sharma, A.R.; Badarinath, K.V.S.; Kharol, S.K.; Singh, D. Impact of agriculture crop residue burning on atmospheric aerosol loading—A study over Punjab State, India. Ann. Geophys. 2010, 28, 367–379. [Google Scholar] [CrossRef]
- Vadrevu, K.P.; Ellicott, E.; Badarinath, K.; Vermote, E. MODIS derived fire characteristics and aerosol optical depth variations during the agricultural residue burning season, north India. Environ. Pollut. 2011, 159, 1560–1569. [Google Scholar] [CrossRef]
- Kaskaoutis, D.G.; Kumar, S.; Sharma, D.; Singh, R.P.; Kharol, S.K.; Sharma, M.; Singh, D. Effects of crop residue burning on aerosol properties, plume characteristics, and long-range transport over northern India. J. Geophys. Res. Atmos. 2014, 119, 5424–5444. [Google Scholar] [CrossRef]
- Mittal, S.K.; Singh, N.; Agarwal, R.; Awasthi, A.; Gupta, P.K. Ambient air quality during wheat and rice crop stubble burning episodes in Patiala. Atmos. Environ. 2009, 43, 238–244. [Google Scholar] [CrossRef]
- Singh, N.; Mittal, S.K.; Agarwal, R.; Awasthi, A.; Gupta, P.K. Impact of rice crop residue burning on levels of SPM, SO2 and NO2 in the ambient air of Patiala (India). Int. J. Environ. Anal. Chem. 2010, 90, 829–843. [Google Scholar] [CrossRef]
- Gysel, M.; Weingartner, E.; Baltensperger, U. Hygroscopicity of aerosol particles at low temperatures. 2. Theoretical and experimental hygroscopic properties of laboratory generated aerosols. Environ. Sci. Technol. 2002, 36, 63–68. [Google Scholar] [CrossRef] [PubMed]
- Mikhailov, E.; Vlasenko, S.; Martin, S.T.; Koop, T.; Pöschl, U. Amorphous and crystalline aerosol particles interacting with water vapor: Conceptual framework and experimental evidence for restructuring, phase transitions and kinetic limitations. Atmos. Chem. Phys. 2009, 9, 9491–9522. [Google Scholar] [CrossRef]
- Hu, D.; Qiao, L.; Chen, J.; Ye, X.; Yang, X.; Cheng, T.; Fang, W. Hygroscopicity of inorganic aerosols: Size and relative humidity effects on the growth factor. Aerosol Air Qual. Res. 2010, 10, 255–264. [Google Scholar] [CrossRef]
- Wu, Z.J.; Zheng, J.; Shang, D.J.; Du, Z.F.; Wu, Y.S.; Zeng, L.M.; Wiedensohler, A.; Hu, M. Particle hygroscopicity and its link to chemical composition in the urban atmosphere of Beijing, China, during summertime. Atmos. Chem. Phys. 2016, 16, 1123–1138. [Google Scholar] [CrossRef]
- Kim, N.; Yum, S.S.; Park, M.; Park, J.S.; Shin, H.J.; Ahn, J.Y. Hygroscopicity of urban aerosols and its link to size-resolved chemical composition during spring and summer in Seoul, Korea. Atmos. Chem. Phys. 2020, 20, 11245–11262. [Google Scholar] [CrossRef]
- Nair, V.S.; Ajith, T.; Jayachandran, V.; Kompalli, S.K.; Gogoi, M.M.; Babu, S.S. Effects of South Asian outflow on aerosol hygroscopicity and cloud droplet activation over the northern Indian Ocean. Atmos. Environ. 2024, 327, 120500. [Google Scholar] [CrossRef]
- Han, J.H.; Hung, H.M.; Martin, S.T. Size effect of hematite and corundum inclusions on the efflorescence relative humidities of aqueous ammonium nitrate particles. J. Geophys. Res. Atmos. 2002, 107, AAC 3-1–AAC 3-9. [Google Scholar] [CrossRef]
- Reid, J.S.; Koppmann, R.; Eck, T.F.; Eleuterio, D.P. A review of biomass burning emissions part II: Intensive physical properties of biomass burning particles. Atmos. Chem. Phys. 2005, 5, 799–825. [Google Scholar] [CrossRef]
- Chakrabarty, R.K.; Moosmüller, H.; Garro, M.A.; Arnott, W.P.; Walker, J.; Susott, R.A.; Babbitt, R.E.; Wold, C.E.; Lincoln, E.N.; Hao, W.M. Emissions from the laboratory combustion of wildland fuels: Particle morphology and size. J. Geophys. Res. Atmos. 2006, 111. [Google Scholar] [CrossRef]
- Kaku, K.C.; Hegg, D.A.; Covert, D.S.; Santarpia, J.L.; Jonsson, H.; Buzorius, G.; Collins, D.R. Organics in the Northeastern Pacific and their impacts on aerosol hygroscopicity in the subsaturated and supersaturated regimes. Atmos. Chem. Phys. 2006, 6, 4101–4115. [Google Scholar] [CrossRef]
- Semeniuk, T.A.; Wise, M.E.; Martin, S.T.; Russell, L.M.; Buseck, P.R. Hygroscopic behavior of aerosol particles from biomass fires using environmental transmission electron microscopy. J. Atmos. Chem. 2007, 56, 259–273. [Google Scholar] [CrossRef]
- Carrico, C.M.; Petters, M.D.; Kreidenweis, S.M.; Sullivan, A.P.; McMeeking, G.R.; Levin, E.J.T.; Engling, G.; Malm, W.C.; Collett, J.L. Water uptake and chemical composition of fresh aerosols generated in open burning of biomass. Atmos. Chem. Phys. 2010, 10, 5165–5178. [Google Scholar] [CrossRef]
- Lei, T.; Zuend, A.; Cheng, Y.; Su, H.; Wang, W.; Ge, M. Hygroscopicity of organic surrogate compounds from biomass burning and their effect on the efflorescence of ammonium sulfate in mixed aerosol particles. Atmos. Chem. Phys. 2018, 18, 1045–1064. [Google Scholar] [CrossRef]
- Akhtar, M.S.; Memon, M. Biomass and nutrient uptake by rice and wheat: A three-way interaction of potassium, ammonium and soil type. Pak. J. Bot. 2009, 41, 2965–2974. [Google Scholar]
- Dhaliwal, M.K.; Dhaliwal, S.S.; Thind, H.S.; Gupta, R.K. Long term effect of manure and fertilizers on concentration and uptake of Zn, Cu, Fe and Mn in rice and wheat grains under rice-wheat system. Int. J. Sci. Environ. Technol. 2014, 3, 1592–1601. [Google Scholar]
- Zhang, H.; Ye, X.; Cheng, T.; Chen, J.; Yang, X.; Wang, L.; Zhang, R. A laboratory study of agricultural crop residue combustion in China: Emission factors and emission inventory. Atmos. Environ. 2008, 42, 8432–8441. [Google Scholar] [CrossRef]
- Jing, B.; Wang, Z.; Tan, F.; Guo, Y.; Tong, S.; Wang, W.; Zhang, Y.; Ge, M. Hygroscopic behavior of atmospheric aerosols containing nitrate salts and water-soluble organic acids. Atmos. Chem. Phys. 2018, 18, 5115–5127. [Google Scholar] [CrossRef]


Disclaimer/Publisher’s Note: The statements, opinions and data contained in all publications are solely those of the individual author(s) and contributor(s) and not of MDPI and/or the editor(s). MDPI and/or the editor(s) disclaim responsibility for any injury to people or property resulting from any ideas, methods, instructions or products referred to in the content. |
© 2024 by the authors. Licensee MDPI, Basel, Switzerland. This article is an open access article distributed under the terms and conditions of the Creative Commons Attribution (CC BY) license (https://creativecommons.org/licenses/by/4.0/).