Abstract
To measure the long-range transport of PCDD/Fs, a background sampling site at Mt. Lulin station (Taiwan) was selected based on meteorological information and its location relative to burning events in Southeast Asia. During regular sampling periods, a higher concentration of PCDD/Fs was recorded in 2008 at Mt. Lulin station during La Niña events, with levels reaching 390 fg I-TEQ/m3. In contrast, a higher concentration of 483 fg I-TEQ/m3 was observed in 2013 during biomass burning events. This indicates that La Niña affects the ambient PCDD/F concentrations. The ratio of ΣPCDD/ΣPCDF was 0.59, suggesting significant long-range transport contributions from 2007 to 2023. From 2007 to 2015, the predominant species was 2,3,4,7,8-PCDF, accounting for 25.3 to 39.6% of the total PCDD/Fs. From 2018 onward, 1,2,3,7,8-PCDD became more dominant, accounting for 15.0 to 27.1%. According to the results from the receptor model PMF (n = 150), the sources of PCDD/Fs were identified as dust storms and monsoon events (19.3%), anthropogenic activity (28.5%), and biomass burning events (52.2%). The PSCF values higher than 0.7 highlighted potential PCDD/F emission source regions for Mt. Lulin during biomass burning events, indicating high PSCF values in southern Thailand, Cambodia, and southern Vietnam.
1. Introduction
Ambient particulate matter (PM) can cause a variety of health risks to the public due to the toxicity of chemical compounds, such as polychlorinated dibenzo-p-dioxin dibenzofurans (PCDD/Fs), polycyclic aromatic hydrocarbons (PAHs), water-soluble ions (WSIs), and heavy metals [1,2]. PM is emitted from primary and secondary sources, including natural and anthropogenic activities [3,4]. Polychlorinated dibenzo-p-dioxins (PCDDs) and polychlorinated dibenzofurans PCDF (PCDFs), collectively known as dioxins, are persistent organic pollutants (POPs), as classified by the United Nations Environment Programme (UNEP) [5,6,7]. Polycyclic aromatic hydrocarbons (PAHs) are teratogenic and carcinogenic, capable of causing damage to the nervous and immune systems [8,9].
Previous studies have indicated that uncontrolled combustion, such as the open burning of agricultural residues, forest fires, and waste combustion, are significant potential sources of PCDD/Fs that remain unregulated [10]. Chang, et al. [11] showed that more than 70% of dioxins and furans in the atmosphere are attached to the solid phase of atmospheric particulates. Although many of these dioxin species have low toxicity, they have long half-lives and can easily diffuse in the atmosphere. PCDD/Fs are deposited through dry and wet deposition, landing in the topsoil and eventually entering the human body via the food chain [12].
Generally, biomass burning occurs during the dry season each year in the tropical areas of Asia, including Thailand, Vietnam, and Indochina [13,14,15]. This activity causes pollutants to rise to high altitudes in the atmosphere [16,17,18,19,20]. Additionally, the El Niño phenomenon significantly affected the atmosphere in 2015 [21,22]. Previous studies have noted that forest fires, including biomass burning, open burning, and agriculture burning, become more frequent during extremely dry years [23,24,25]. Between 1997 and 2004, the yearly PCDD/F emissions from open burning in mainland China were estimated to range from 1.38 to 1.52 g I-TEQ/year, accounting for about 10% to 20% of the total PCDD/F emissions in the region [10]. Recently, global-scale climate change phenomena such as El Niño (temperature increase) and La Niña (temperature decrease) are two different forms of the El Niño–Southern Oscillation (ENSO), distinguished by increased and decreased temperatures on the surface of the East Pacific Ocean [24,26,27]. The La Niña phenomenon is characterized by a large amount of rain and increased humidity in the air [28].
The main concern with these pollutants is their adverse health effects on humans and potential exposure, as some have been identified as carcinogenic and mutagenic [29,30,31,32,33]. Therefore, this study aims to evaluate the chemical compound profile and contributions of Southeast Asia biomass burning to atmospheric concentration variations in PCDD/Fs at a high-altitude sampling site at Mt. Lulin station (Taiwan). Additionally, we further assess the potential source region for the long-range transport of HAPs using receptor models such as positive matrix factorization (PMF) and potential source contribution function (PSCF).
2. Materials and Methods
2.1. The Information on the Sampling Site and Instrumentation
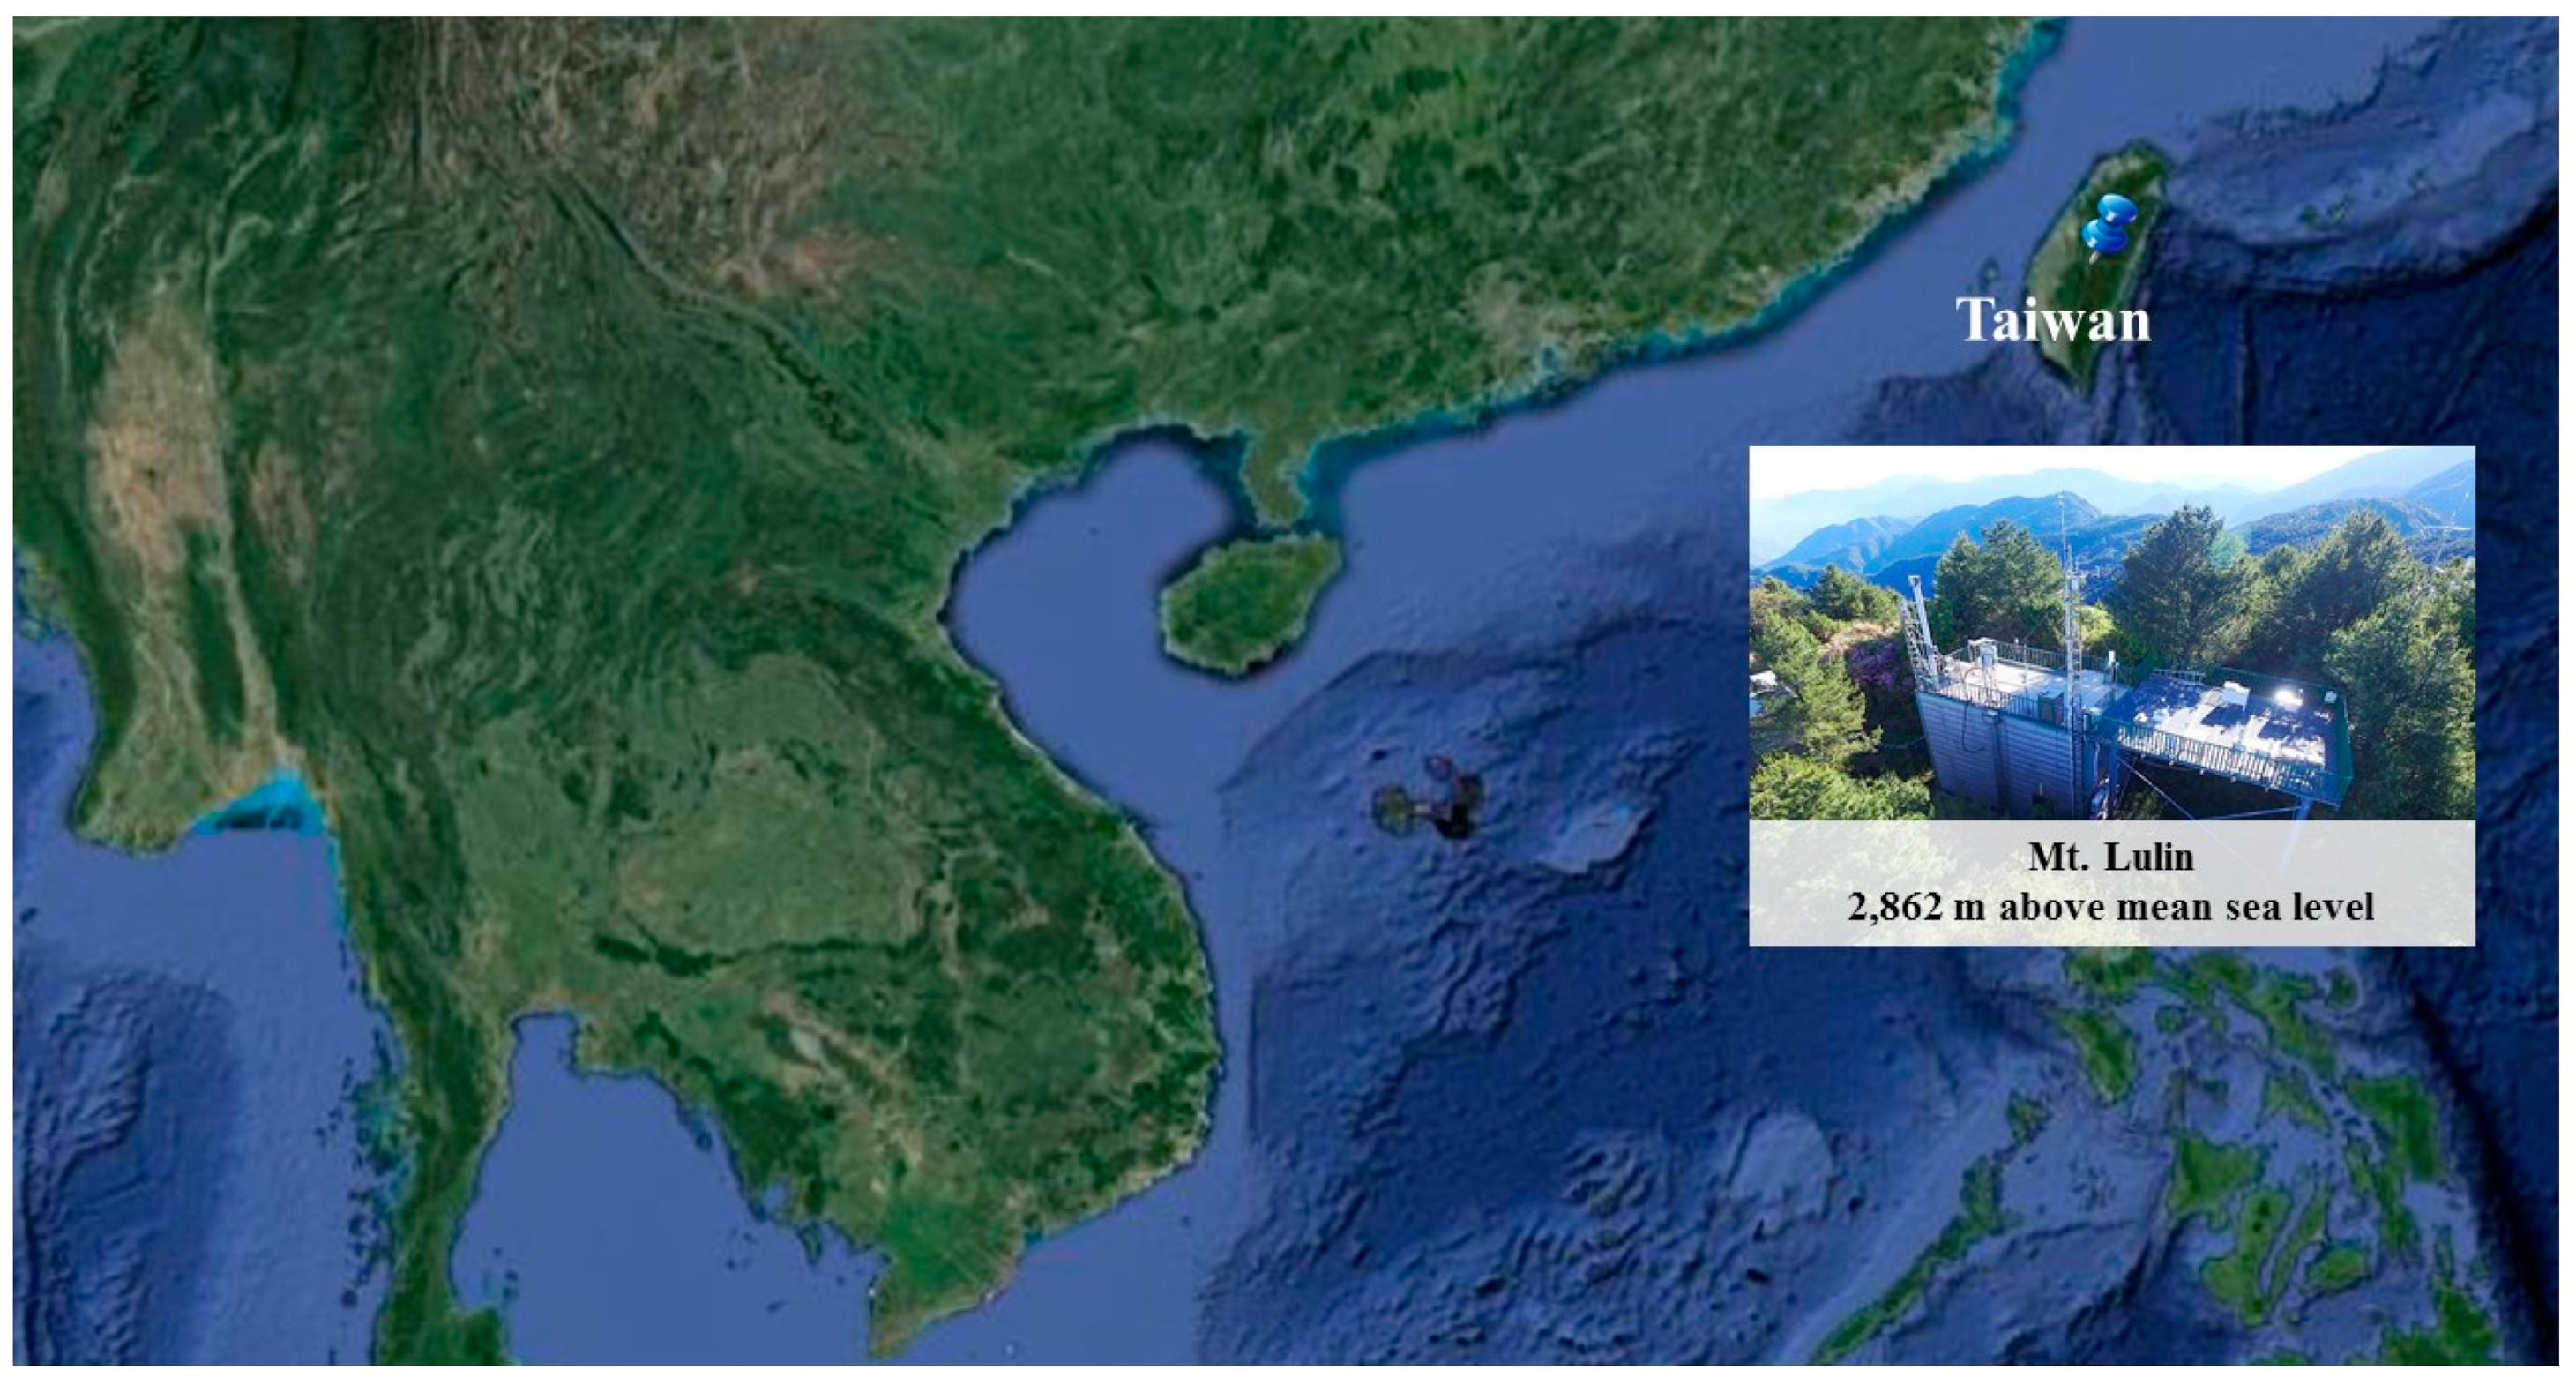
In this study, the sampling site was chosen to quantify the long-range transport of chemical compounds from a high altitude based on location relative to long-range transport events and meteorological data in Eastern Asia (Figure 1). The sampling station is located at the peak of Mt. Lulin in central Taiwan (23.51° N, 120.92° E; 2862 m above mean sea level). This high elevation ensures that the site is generally free of local contamination, allowing for the investigation of the influence of long-range transported air pollutants in the free troposphere in East Asia [18]. There are no significant PCDD/F emission sources near the high-altitude station. From 2007 to 2023, one sample was collected every 24 h at Mt. Lulin station during the special long-range transport seasons (spring and winter). The ambient air samples were obtained using a high-volume sampler (Sibata HV-1000R) to analyze chemical compounds [34]. The air samplers were equipped with quartz fiber filters (8 × 10 inches, Pall Corporation, NY, USA) for collecting particle-bound compounds and the flow rate was set to 1000 L/min for a typical sampling duration of one day, with the air sample volume exceeding 1400 m3 [35,36].

Figure 1.
The locations of the high-altitude sampling site (Mt. Lulin) in Taiwan.
2.2. Analysis of Chemical Compounds
After sampling, one-eighth of each filter was used for metal component analysis and one-eighth for WSI analysis. The last three-quarters of each filter were allocated for PCDD/F analysis.
Initially, atmospheric PCDD/Fs were extracted using Soxhlet extraction by toluene for 16 h. Subsequently, the PCDD/F samples underwent purification using silica gel and active carbon with toluene. The purified sample was then evaporated to dryness under nitrogen to 100 μL, and 10 μL of 20 pg/μL recovery standards was added before analysis by HRGC. The method detection limits (MDLs) for the 17 PCDD/Fs ranged from 0.28 pg/g-dw to 1.86 pg/g-dw, achieving recovery efficiencies between 77% and 130%. Lastly, the WSIs were extracted using deionized water and the recovery rates ranged from 88% to 104% [37]. In this study, the seventeen 2, 3, 7, 8-substituted PCDD/F congeners were analyzed using high-resolution gas chromatography, HRGC (TRACE GC, Thermo Fisher Scientific, USA), coupled with high-resolution mass spectrometry (DFS, Thermo Fisher Scientific, USA) and equipped with a DB-5 MS fused silica capillary column (fused silica capillary, length: 60 m, I.D.: 0.25 mm, film: 0.25μm, DiKMA Technol. Inc., Foothill Ranch, CA, USA). The method of HRGC in the analysis of PCDD/Fs is listed in Table S1. The analysis of WSIs (Cl−, NO3−, NO2−, PO43−, SO42−, Na+, NH4+, K+, Ca2+, and Mg2+) was conducted using Dionex ICS-1000 ion chromatography, IC (Thermo Fisher Scientific, Waltham, MA, USA) [37,38,39].
2.3. Source Apportionment
In our study, the possible pollution source profile and contribution were considered by positive matrix factorization (PMF). On the other hand, the potential sources’ attributed regions were used for the potential source contribution function (PSCF). The PMF software (version 5.0), provided by the U.S. EPA (2014), was utilized to identify and quantify sources related to ambient PCDD/F concentrations at the Lulin station. To identify the potential sources of Southeast Asia biomass burning events occurring during the spring and winter seasons throughout the sampling period, back trajectories were conducted with HYSPLIT from the location of Lulin station, which is at an altitude of 3 km in central Taiwan. The spanning is from 5 to 25° N and 90 to 110° E. Additionally, to identify the potential source regions of PCDD/Fs during the biomass burning period at Lulin station, the PSCF value was calculated using PCDD/F daily concentrations and three-day backward trajectories generated with the HYSPLIT model.
PMF, a multivariate factor analysis technique, played a crucial role in identifying and quantifying pollutant sources. The PMF model (version 5.0; 2014), developed by the U.S. EPA, specifically focuses on identifying and quantifying sources of PCDD/Fs [40,41]. In brief, the receptor model was implemented as follows:
where X is the matrix (m × n) of m measured chemical congeners in n samples. G is the matrix (n × p) of the contributions of p possible sources to the n samples. F is the matrix (m × p) of the m chemical congener profiles to the p possible sources. E is defined as the residual matrix.
The PSCF was employed to delineate potential contribution regions. PSCF calculations were based on three-day backward trajectories generated using the HYSPLIT model [42,43]. Back trajectory analyses using HYSPLIT were conducted at an altitude of 2862 m from the Lulin station.
where Mij represents the pollutant concentration exceeding the 75th percentile. Nij is the total number of trajectory endpoints in the ij cell.
3. Results
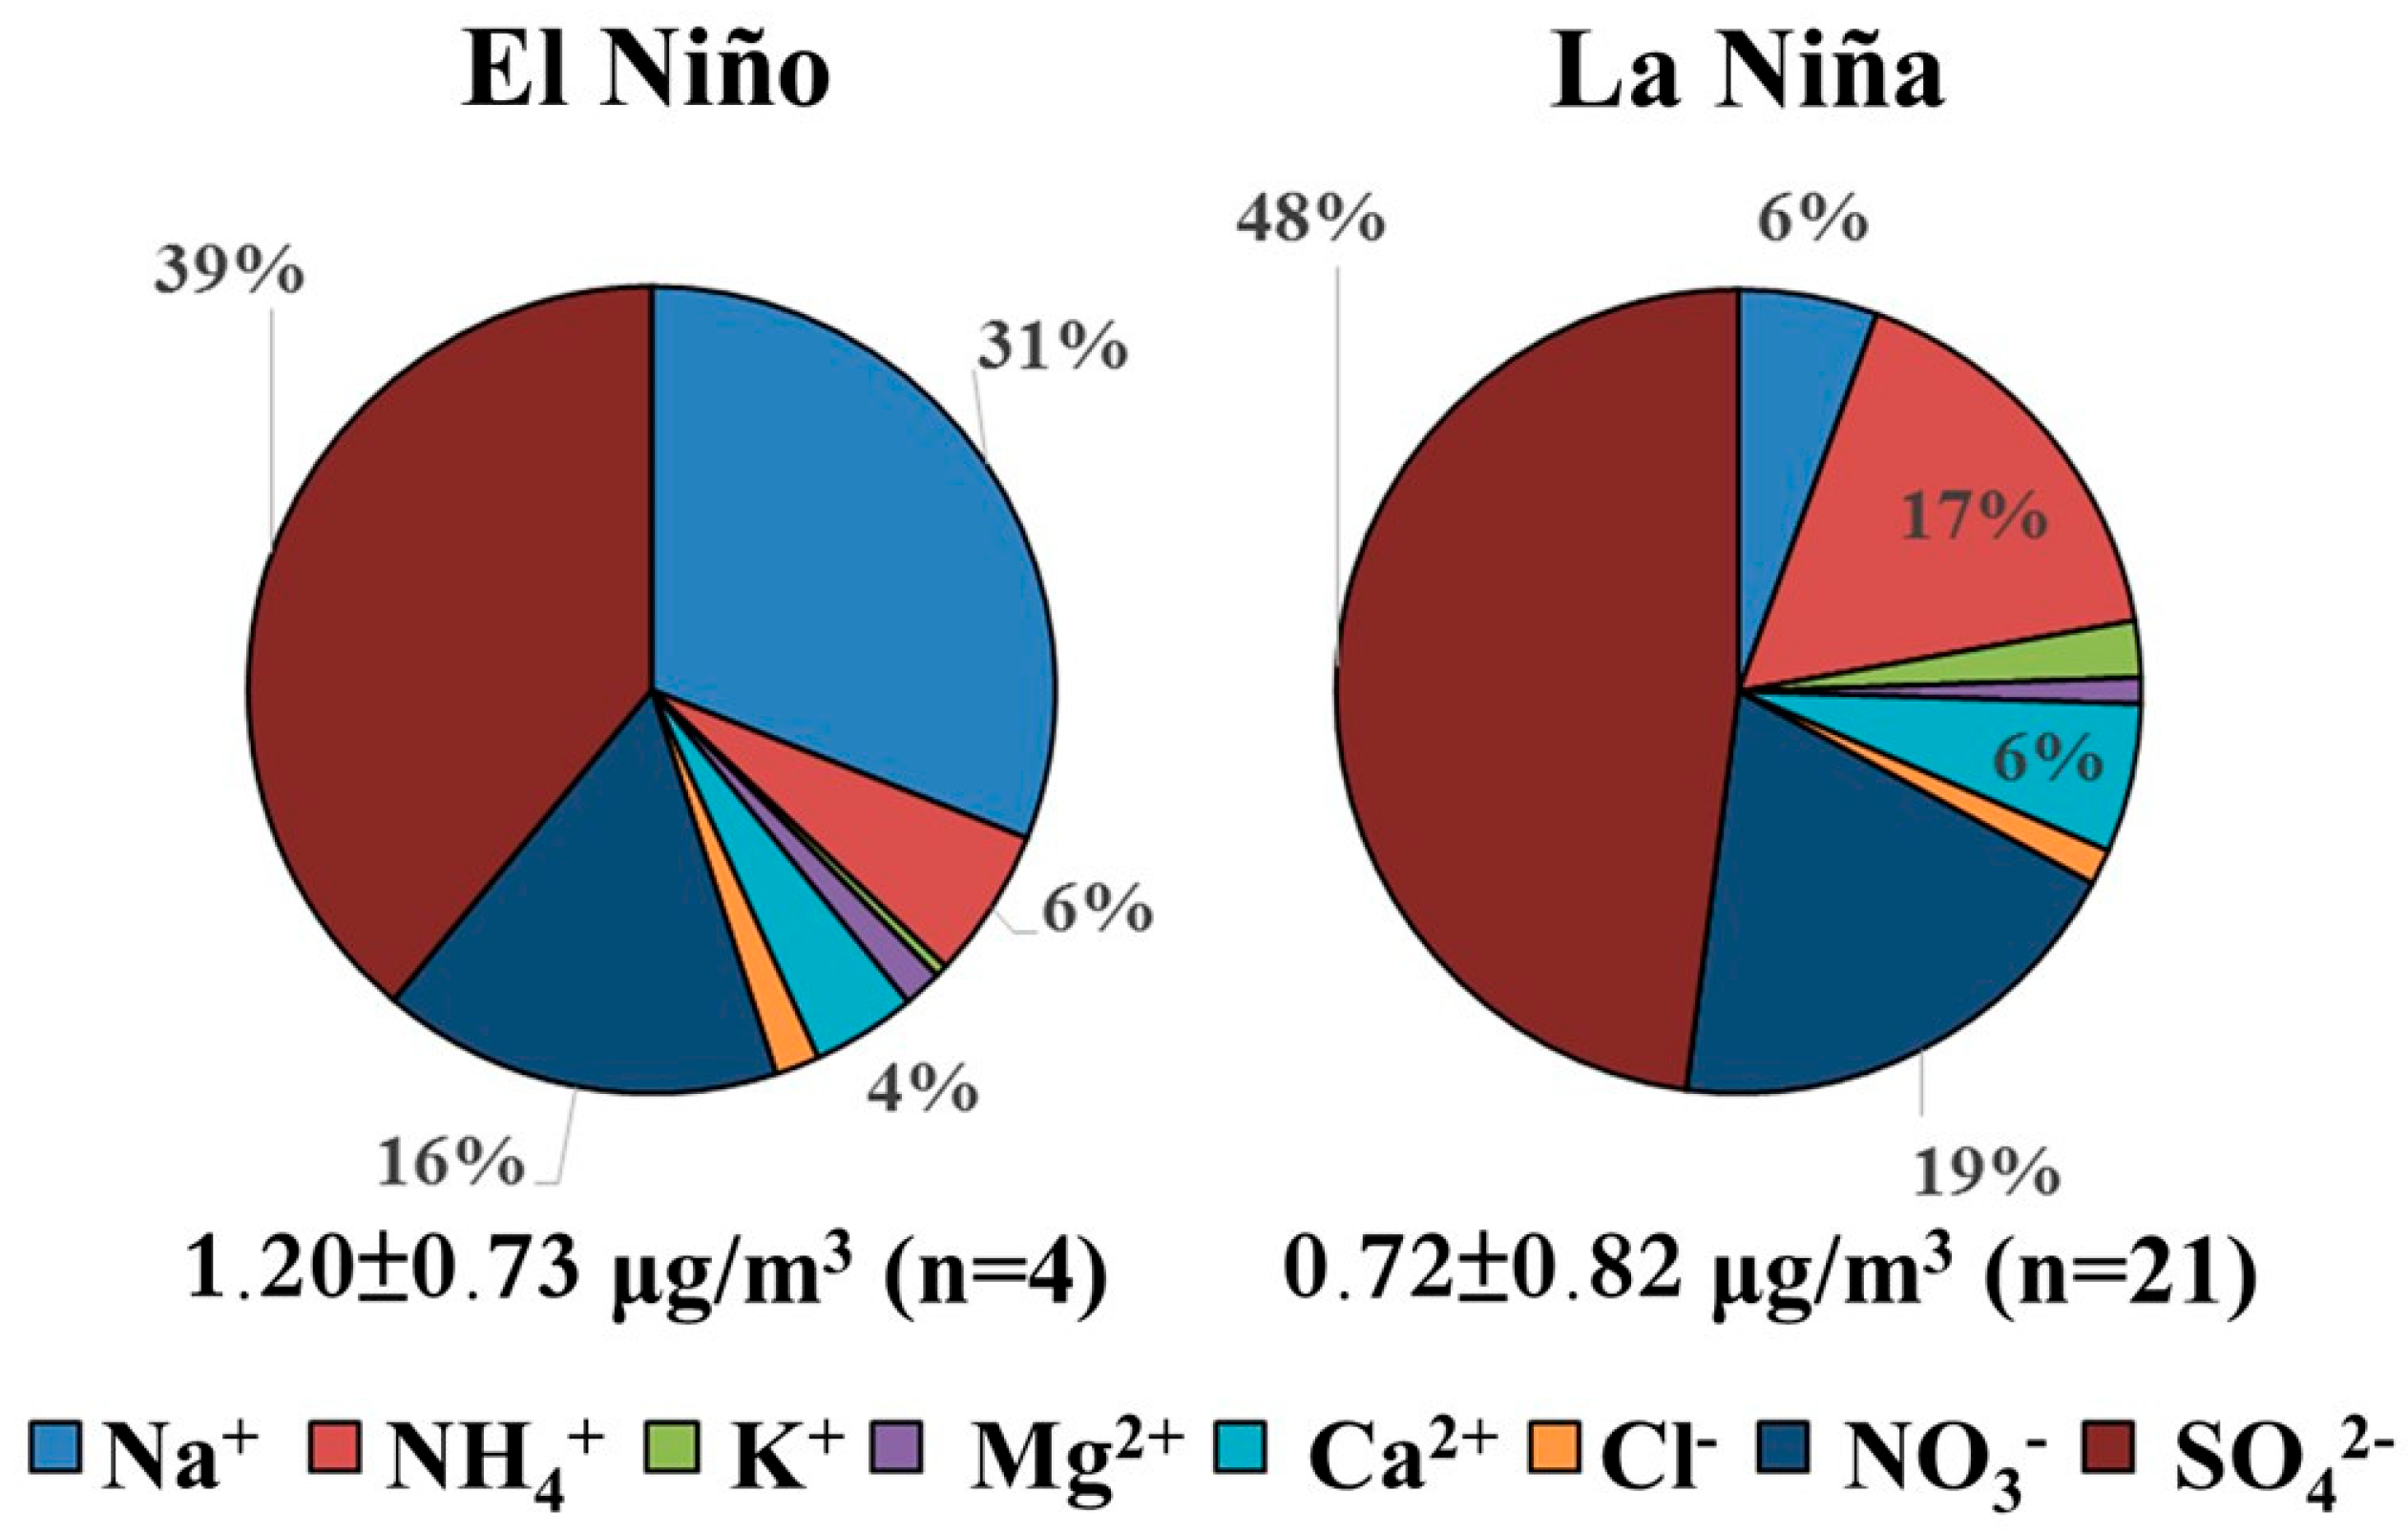
3.1. The Measurement of WSIs during El Niño and La Niña
We collected the chemical compounds from the ambient air PM during the sampling period and divided them into those present in El Niño and La Niña. The concentrations and distributions of the WSIs were 1.20 ± 0.73 and 0.72 ± 0.82 μg/m3 during El Niño and La Niña (from 2018 to 2023), respectively (Figure 2). During the regular period, the average concentrations of TSP and PM2.5 ranged from 2.00 to 55.6 μg/m3 and 5.17 to 17.8 μg/m3, respectively. In addition, we investigated the distribution of atmospheric chemical components from 2006 to 2016 in Taiwan [34]. Thus, the average concentration of WSIs ranged from 0.22 ± 0.07 to 2.27 ± 1.87 μg/m3 from 2018 to 2023. Conversely, lower concentrations of particulate matter (8.14 ± 1.47 μg/m3) and PCDD/Fs (0.74 ± 0.26 fg I-TEQ/m3) were observed during El Niño. Additionally, a lower concentration of K+ (0.006 ± 0.003 μg/m3) in El Niño was observed in our study. This finding is consistent with the components of TSP, PCDD/Fs, and K+ originating from biomass burning [15,37,44]. This indicated that the possible sources of the WSIs not only included biomass burning but also agricultural burning, coal combustion, and vehicle emissions as mixed pollution sources [20]. The components of WSIs were dominated by SO42− (39–61%), NO3− (9–25%), and NH4+ (6–22%). However, the concentration of non-sea-salt (nss) SO42− ranged from 0.13 to 0.95 μg/m3 during the observation period. As we know, aerosol chemical compounds can originate from emission sources and secondary aerosols [3,4,45,46]. There were no significant anthropogenic activities, such as stationary and mobile sources, at Mt. Lulin. Therefore, we collected the particulate chemical compounds to investigate the impact of long-range transport events. Table S2 illustrates the concentrations of WSIs during the observation years. A previous study revealed that the highest concentrations of nss SO42− (3.0 μg/m3) and NO3− (0.59 μg/m3) were transported through biomass burning events at Mt. Lulin from 2003 to 2018 [16]. However, the concentrations of nss SO42− (0.131–0.948 μg/m3) and NO3− (0.071–0.559 μg/m3) have decreased in recent years, as shown in our study. Moreover, the highest concentrations of nss SO42− (0.948 μg/m3) and NO3− (0.559 μg/m3) were observed in El Niño. This indicates that the intensity of the emission source has decreased in these years.
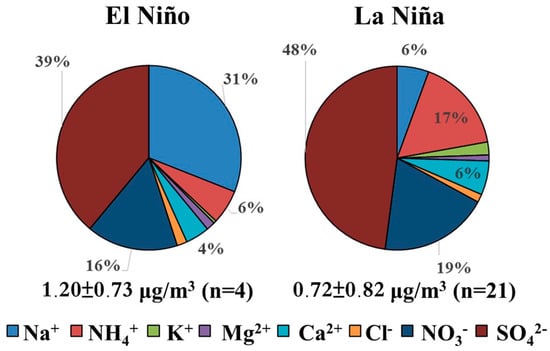
Figure 2.
The distribution of WSIs during El Niño and La Niña.
3.2. The Evaluation of Atmospheric PCDD/F Concentration in the Past Sixteen Years
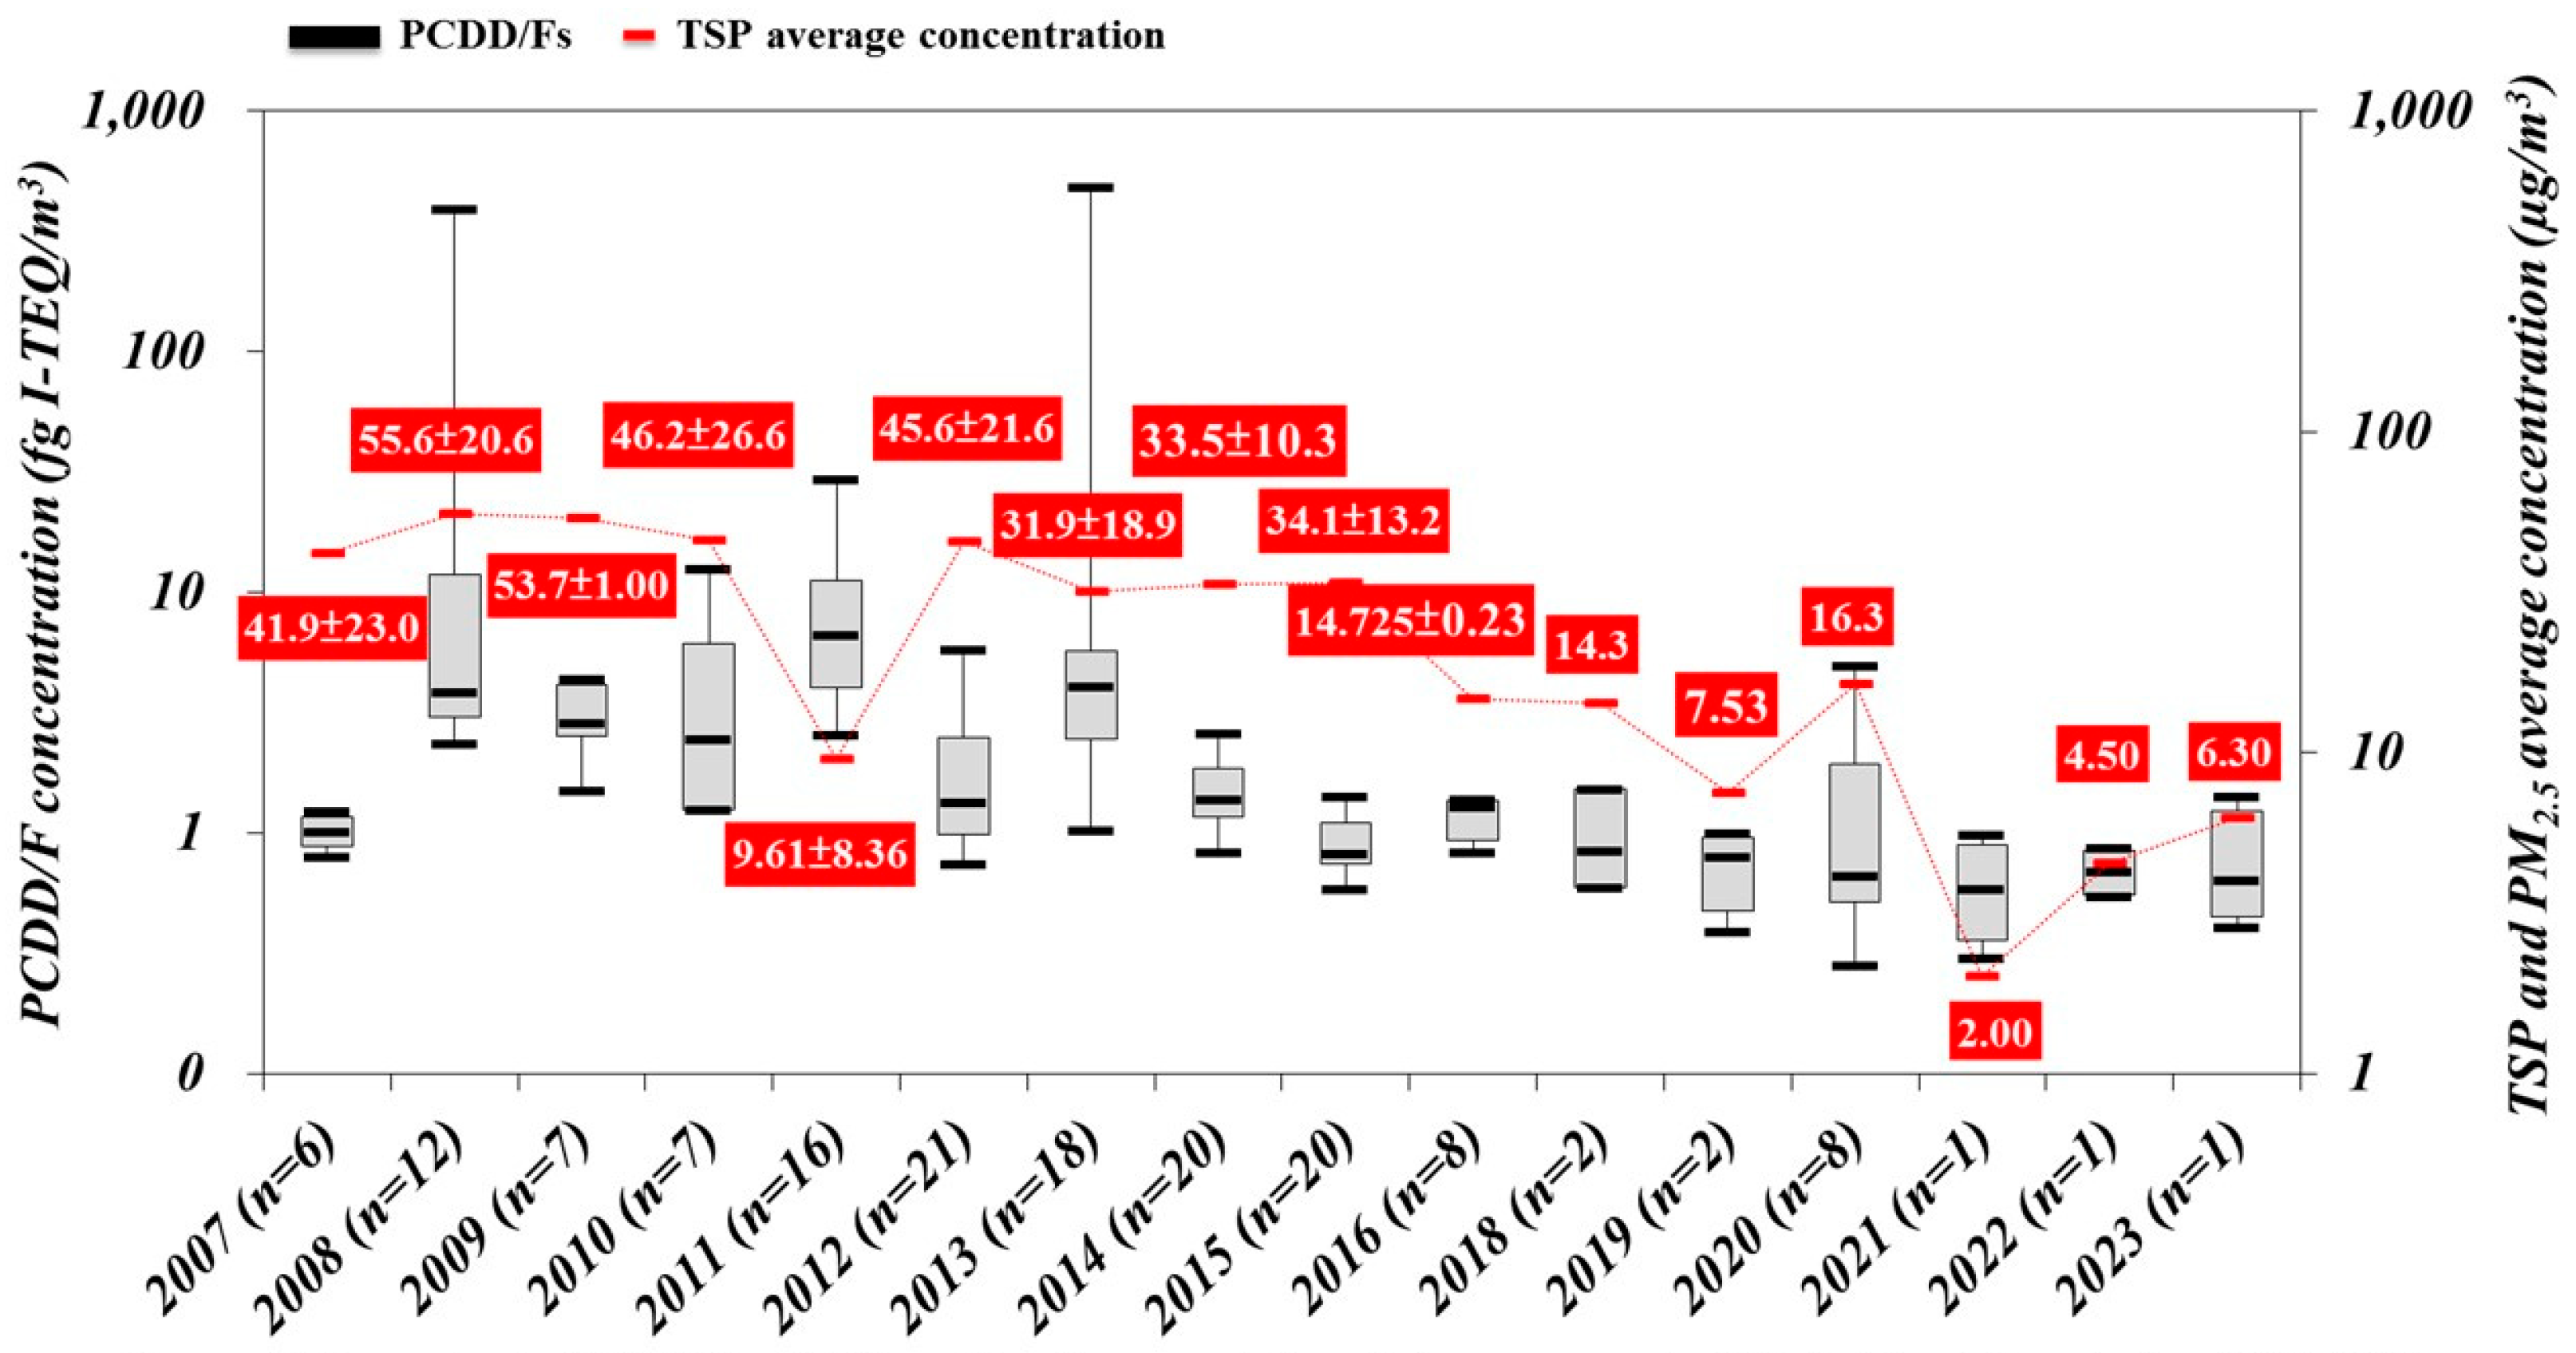
During the observation periods, the average atmospheric concentrations of PCDD/Fs and total suspended particles (TSPs) at Mt. Lulin station in the spring from 2007 to 2023 are depicted in Figure 3. According to our previous studies, the concentration of PCDD/Fs decreased from 2007 to 2015 (Table S3) [34]. Therefore, we continued to collect TSP and PCDD/F data over the following ten years. The TSP and PCDD/F concentrations ranged from 2.00 to 55.6 μg/m3 and 0.61 to 38.4 fg I-TEQ/m3, respectively, from 2007 to 2023. Particularly noteworthy were the higher concentrations of PCDD/Fs observed in 2008 (391 fg I-TEQ/m3) and 2013 (483 fg I-TEQ/m3). A biomass burning event was observed in 2008 and resulted in a high PCDD/F concentration [47]. The median concentration of PCDD/Fs during the sampling period at Mt. Lulin station was 1.37 fg I-TEQ/m3. Recent data indicate a decrease in the PCDD/F concentrations over the past eight years (average concentration of PCDD/Fs in 2015: 0.91 ± 0.25 fg I-TEQ/m3; average concentration of PCDD/Fs in 2023: 0.77 ± 0.44 fg I-TEQ/m3). Similarly, the average concentration of TSPs decreased from 55.6 ± 20.6 to 6.30 μg/m3 during the period from 2007 to 2023.

Figure 3.
Atmospheric PCDD/Fs, PAHs and total suspended particles measured at Mt. Lulin station during 2007–2023.
As we know, El Niño and La Niña events have been observed in recent years. El Niño is characterized by increased temperatures in the eastern Pacific Ocean, associated with warm currents from the equator, whereas La Niña is marked by decreased temperatures. Previous studies have identified El Niño occurrences during the years 2014 to 2016, 2018 to 2019, and 2023, while La Niña events were observed in the years 2007 to 2008, 2010 to 2012, 2017 to 2018, and 2022 to 2023 [27]. Our study observed a higher concentration of PCDD/Fs, reaching 390 fg I-TEQ/m3, during the La Niña event in 2008. These findings align with previous research conducted at Mt. Lulin, which consistently links PCDD/F concentrations to El Niño and La Niña phenomena [17,26,48]. Additionally, the highest concentration of PCDD/Fs, reaching 483 fg I-TEQ/m3, was recorded during a biomass burning event in 2013 [19]. The amounts of PCDD/Fs adsorbed onto suspended particles varied between each event. An analysis of the Pearson correlation between the atmospheric PCDD/Fs and TSPs, carbon monoxide, and potassium concentrations measured at Mt. Lulin station during the sampling period revealed a strong correlation between the PCDD/Fs and other pollutants. This suggests a clear association with biomass burning events, as indicated by the elevated levels of PCDD/Fs. Furthermore, the transport of pollutants through the air mass was related to El Niño and La Niña phenomena. Additionally, the average concentrations of TSPs, WSIs, and PCDD/Fs are illustrated in Table S4. The higher concentrations of TSPs (34.8 ± 27.5 μg/m3) and PCDD/Fs (13.0 ± 53.9 fg I-TEQ/m3) were observed during La Niña. On the contrary, the concentration of WSIs was 1.71 times higher during El Niño. When the El Niño and La Niña phenomena happened, the chemical compound concentration increased through the air mass transport to the receptor region.
3.3. Variation in Atmospheric PCDD/Fs Congener from 2007 to 2023
The distribution of atmospheric ΣPCDF dominated at 63% from 2007 to 2023 (Table S5). Specifically, 2,3,4,7,8-PeCDF (23.9%), 2,3,4,6,7,8-HCDF (8.95%), and 1,2,3,4,7,8-HCDF (8.92%) were attributed to ΣPCDF in this study. A previous study has identified PCDF as the major contributor during long-range transport events [49]. The ratio of ΣPCDD/ΣPCDF observed in our study was 0.59 from 2007 to 2023, consistent with ratios (greater than 0.6) measured in Da Nang and Ho Chi Minh City, Vietnam [50]. This suggests that long-range transport events contribute significantly to atmospheric PM at Mt. Lulin during spring. Moreover, 2,3,7,8-TCDD, 1,2,3,7,8-PCDD, 1,2,3,4,6,7,8-HCDD, and ΣPCDF showed a significant difference with p-values less than 0.05 for PCDD/F congener during the sixteen years. 2,3,4,7,8-PCDF dominated, accounting for 2.30 to 39.6% during the period 2007 to 2015, while 1,2,3,7,8-PCDD became dominant, accounting for 15.0 to 27.1%, after 2018. This shift suggests a slight decrease in the PCDF contribution during recent biomass burning events, indicating variability in PCDD/F sources. Hence, ΣPCDF was the primary contributor during La Niña while ΣPCDD was the major contributor during El Niño. Specifically, the highest concentration of OCDD (2.73 ± 13.0 fg I-TEQ/m3) was found during El Niño. On the other hand, the highest concentration of 2,3,4,7,8-PeCDF (4.26 ± 17.3 fg I-TEQ/m3) was found during La Niña. This indicates the different pollution sources of atmospheric PCDD/Fs during the observation period (Figure 4).
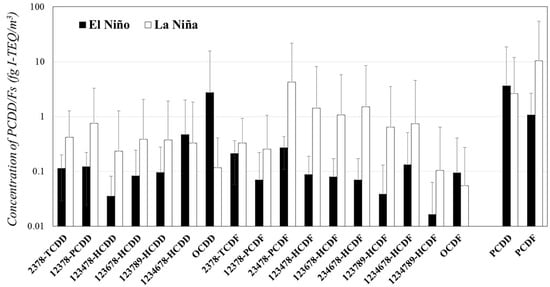
Figure 4.
The distribution of atmospheric PCDD/Fs in Mt. Lulin during El Niño and La Niña.
Moreover, Table S6 shows the content of PCDD/Fs in the TSPs from 2007 to 2023. A higher content of PCDD/Fs in the TSPs was observed in 2008 (1152 ± 2718 ng/g), 2011 (7027 ± 20,781 ng/g), and 2013 (969 ± 3352 ng/g). After 2014, the content of PCDD/Fs in the TSPs showed a decreasing trend. This indicates that the emission of atmospheric PCDD/Fs at Mt. Lulin due to biomass burning weakened year by year. However, the K+ bound in the TSPs was used to identify biomass burning events in the current and previous studies [14,31,51]. The concentration of WSIs ranged from 0.22 to 2.22 μg/m3. In addition, the highest concentration of K+ was 0.063 μg/m3, in 2023 (Table S2). Finally, during the El Niño phenomenon from 2014 to 2015, species such as 2,3,4,7,8-PCDF (25.3 to 25.5%) and 2,3,7,8-TCDF (16.0 to 19.6%) predominated. Conversely, major species during El Niño events in 2019 and 2023 included 1,2,3,7,8-PCDD (23.2 to 24.1%), 1,2,3,6,7,8-HCDD (12.4%), and 1,2,3,7,8,9-HCDD (18.1%). During the La Niña periods in 2008, 2010 to 2012, 2,3,4,7,8-PCDF was predominant (33.0 to 39.6%), while 1,2,3,7,8-PCDD dominated (15.0 to 27.1%) in 2018 and 2020 to 2022.
3.4. The Source Attribute Profile and Contribution of Atmospheric PCDD/Fs
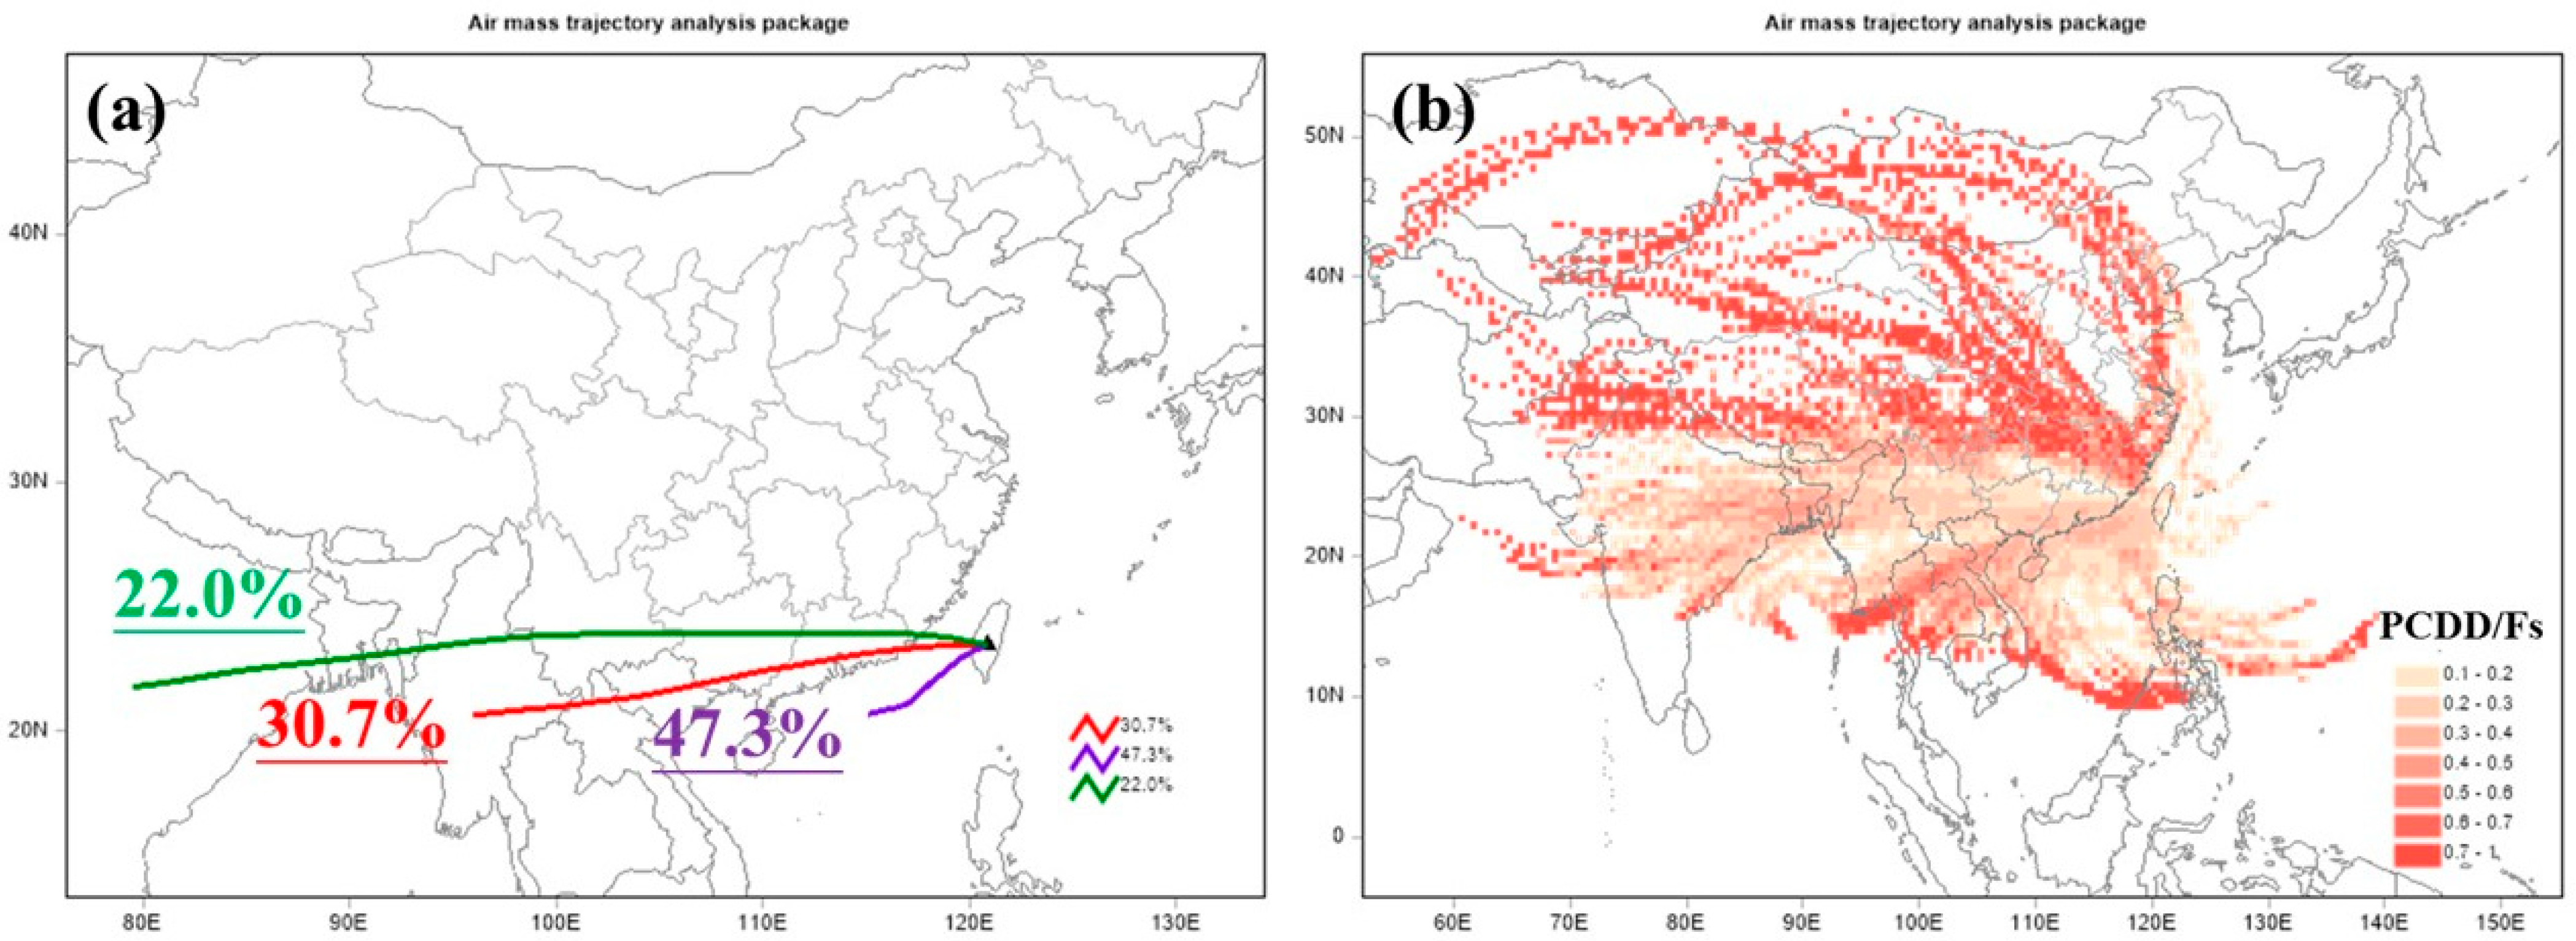
At Mt. Lulin, the sources of the Southeast Asia biomass burning episodes that occurred during spring were evaluated using backward trajectory analyses with HYSPLIT. Moreover, to identify the sources of atmospheric PCDD/Fs, PMF was employed to classify the emission sources and their contributions. According to the PMF user guide, using over 100 samples helps to control errors. Hence, this study used 150 samples collected between 2007 and 2023 to determine the possible pollution sources. The analysis using the PMF model identified three major sources of PCDD/Fs in the receptor region of Taiwan’s atmosphere: dust storm and monsoon events (19.3%), anthropogenic activities (28.5%), and biomass burning events (52.2%) (Figure S1). Factor 1 was dominated by 2,3,4,7,8-PeCDF (38.0%), 1,2,3,4,6,7,8-HpCDF (10.8%), and 2,3,7,8-TCDF (9.94%). Factor 2 was dominated by 1,2,3,7,8-PeCDD (21.3%), 2,3,7,8-TCDD (17.5%), 1,2,3,4,6,7,8-HpCDD (15.9%), and OCDD (12.1%). Factor 3 was dominated by 2,3,4,7,8-PeCDF (37.3%), 2,3,7,8-TCDF (12.4%), and 2,3,7,8-TCDD (10.1%). In addition, Figure 5 shows the results of the backward trajectory during the observation period. The trajectories indicate that 22.0% originated from India through southern China, 30.7% from Bengal through the Indo-China Peninsula, and 47.3% from the Pacific Ocean and Taiwan (Figure 5a). Based on the results of the PSCF, Figure 5b shows the maps of the potential PCDD/F emission source regions for the Mt. Lulin station during the biomass burning season from 2007 to 2023. The PSCF values are located at longitudes 50° to 145° and latitudes 10° to 60°. Obviously, the major potential contribution atmospheric PCDD/F source areas were located at the northern Asia continent, Southeast Asia, and coastal areas of the Philippines. Moreover, PSCF values with PCDD/F concentrations greater than 0.7 were observed in Mongolia, northern China and Southeast Asia (including southern Thailand, Cambodia, and southern Vietnam). This finding is consistent with the backward trajectory prediction.
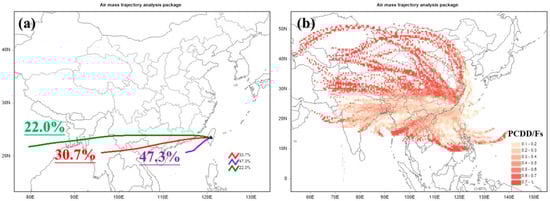
Figure 5.
The map of PSCF value in potential emission source region from 2007 to 2023: (a) backward trajectory. (b) the value of PSCF in ambient PCDD/Fs (n = 150).
4. Discussion
In this study, the data suggest that higher concentrations of air pollutants such as nss SO42− and NO3− are associated with El Niño. When the sea surface temperature and convection decreased, this led to burning events occurring on the Asian continent during El Niño. Chemical components such as CO and O3 indirectly affect transportation in the tropical troposphere. Therefore, we infer that WSIs (Na+ and NO3−) and PCDD/Fs (OCDD) have also influenced the composition of the tropical troposphere during El Niño events. Moreover, our findings highlight the significance of long-range transport in influencing air quality at Mt. Lulin in Taiwan. In addition, higher PCDD/F concentrations in 2008 were observed during La Niña. However, the highest PCDD/F concentration of 483 fg I-TEQ/m3 during a biomass burning event in 2013 was consistent with these climatic phenomena. Moreover, a strong correlation exists between PCDD/F concentrations and other pollutants such as TSPs and potassium, indicating a clear association with biomass burning events. Overall, the transport of air pollutants is influenced by El Niño and La Niña, leading to increased concentrations of chemical compounds in Taiwan. Notably, biomass burning is a major source of atmospheric PCDD/Fs, as evidenced by their high concentrations during specific events.
The difference in the dominant PCDD/F species and the variability in their concentrations during El Niño and La Niña events suggest that climatic phenomena significantly influence the distribution and transport of these pollutants. According to our results, biomass burning was the predominant source of atmospheric PCDD/Fs and contributed half of the total PCDD/F concentration. This is consistent with the backward trajectory and PSCF analyses that highlight significant contributions from southern Thailand, Cambodia, and southern Vietnam, which are known for biomass burning activities. However, there was a high probability of the PSCF value pointing to a potential region located in mainland China during specific extreme events. Lastly, the distinct congener profiles for different emission sources (e.g., biomass burning vs. anthropogenic activities) help accurately identify and quantify the contributions of various sources to the observed PCDD/F levels. In future studies, the concentration and composition of air pollutants during different scenarios could be investigated in Taiwan.
5. Conclusions
In this study, the average atmospheric PCDD/F concentrations measured at Mt. Lulin station range from 0.61 to 38.4 fg I-TEQ/m3 during the observation periods. Notably, a higher concentration of PCDD/Fs (483 fg I-TEQ/m3) was observed, which correlated with the La Niña phenomenon, indicating its significant impact on atmospheric conditions. The PSCF results were consistent with the back trajectory predictions. Specifically, 47.3% of the back trajectories originated from the Pacific Ocean and Taiwan. The PSCF values with PCDD/F concentrations greater than 0.7 were observed in southern Thailand, Cambodia, and southern Vietnam, aligning with the identified source regions. Our study spans multiple years, capturing the influence of climatic events like El Niño and La Niña on the transport and deposition of PCDD/Fs.
Supplementary Materials
The following supporting information can be downloaded at https://www.mdpi.com/article/10.3390/atmos15081002/s1, Figure S1: The result of atmospheric PCDD/Fs (n = 150) via PMF in Mt. Lulin; Table S1: The method of HRGC in the analysis of PCDD/Fs; Table S2: The cocentration of WSIs from 2018 to 2023; Table S3: The concentration of PCDD/Fs (fg I-TEQ/m3) from 2007 to 2023; Table S4: The average concentration of TSP, WSIs and PCDD/Fs during El Niño and La Niña; Table S5: The distribution of PCDD/Fs from 2008 to 2023; Table S6: The content of PCDD/Fs in TSP from 2008 to 2023.
Author Contributions
Methodology, C.C.-K.C. and N.-H.L.; Formal analysis, S.Y.P., Y.C.H., T.H.N. and C.C.-K.C.; Investigation, S.Y.P., T.H.N., C.C.-K.C. and K.H.C.; Writing—original draft, S.Y.P. and Y.-S.H.; Writing—review & editing, K.H.C.; Visualization, N.-H.L.; Supervision, K.H.C. All authors have read and agreed to the published version of the manuscript.
Funding
This research was funded by National Science and Technology Council grant number NSTC 112-2111-M-A49-001- of Taiwan.
Institutional Review Board Statement
Not applicable.
Informed Consent Statement
Not applicable.
Data Availability Statement
Data available on request due to restrictions.
Conflicts of Interest
The authors declare no conflict of interest.
References
- Boström, C.-E.; Gerde, P.; Hanberg, A.; Jernström, B.; Johansson, C.; Kyrklund, T.; Rannug, A.; Törnqvist, M.; Victorin, K.; Westerholm, R. Cancer risk assessment, indicators, and guidelines for polycyclic aromatic hydrocarbons in the ambient air. Environ. Health Perspect. 2002, 110, 451–488. [Google Scholar] [PubMed]
- Pope, C.A., III; Dockery, D.W. Health effects of fine particulate air pollution: Lines that connect. J. Air Waste Manag. Assoc. 2006, 56, 709–742. [Google Scholar] [CrossRef] [PubMed]
- Sitaras, I.E.; Siskos, P.A. The role of primary and secondary air pollutants in atmospheric pollution: Athens urban area as a case study. Environ. Chem. Lett. 2008, 6, 59–69. [Google Scholar] [CrossRef]
- Tomasi, C.; Lupi, A. Primary and secondary sources of atmospheric aerosol. In Atmospheric Aerosols: Life Cycles and Effects on Air Quality and Climate; John Wiley & Sons: Hoboken, NJ, USA, 2017; pp. 1–86. [Google Scholar]
- Needham, L.; Patterson, D., Jr.; Alley, C.; Isaacs, S.; Green, V.; Andrews, J.; Sampson, E.; Bagby, J. Polychlorinated Dibenzo-p-dioxins and Dibenzofurans Levels in Persons with High and Normal Levels of 2,3,7,8-tetrachlorodibenzo-p-dioxin. Chemosphere 1987, 16, 2027–2031. [Google Scholar] [CrossRef]
- Patterson, D., Jr.; Fingerhut, M.; Roberts, D.; Needham, L.; Sweeney, M.H.; Marlow, D.; Andrews, J., Jr.; Halperin, W. Levels of polychlorinated dibenzo-p-dioxins and dibenzofurans in workers exposed to 2,3,7,8-tetrachlorodibenzo-p-dioxin. Am. J. Ind. Med. 1989, 16, 135–146. [Google Scholar] [CrossRef]
- Mackay, D. Polynuckear aromatic hydrocarbon, polychlorinated Dioxins and Dibenzofurans. In Illustration Handbook of Physical-chemical Properties and Environmental Fate for Organic Chemicals; CRC Press: Boca Raton, FL, USA, 1992. [Google Scholar]
- Nisbet, I.C.; Lagoy, P.K. Toxic equivalency factors (TEFs) for polycyclic aromatic hydrocarbons (PAHs). Regul. Toxicol. Pharmacol. 1992, 16, 290–300. [Google Scholar] [CrossRef]
- Sulong, N.A.; Latif, M.T.; Sahani, M.; Khan, M.F.; Fadzil, M.F.; Tahir, N.M.; Mohamad, N.; Sakai, N.; Fujii, Y.; Othman, M. Distribution, sources and potential health risks of polycyclic aromatic hydrocarbons (PAHs) in PM2.5 collected during different monsoon seasons and haze episode in Kuala Lumpur. Chemosphere 2019, 219, 1–14. [Google Scholar] [CrossRef]
- Zhang, Q.; Huang, J.; Yu, G. Polychlorinated dibenzo-p-dioxins and dibenzofurans emissions from open burning of crop residues in China between 1997 and 2004. Environ. Pollut. 2008, 151, 39–46. [Google Scholar] [CrossRef]
- Chang, M.B.; Chang, S.H.; Chen, Y.W.; Hsu, H.C. Dioxin emission factors for automobiles from tunnel air sampling in Northern Taiwan. Sci. Total Environ. 2004, 325, 129–138. [Google Scholar] [CrossRef]
- Masuda, Y.; Schecter, A.; Päpke, O. Concentrations of PCBs, PCDFs and PCDDs in the blood of Yusho patients and their toxic equivalent contribution. Chemosphere 1998, 37, 1773–1780. [Google Scholar] [CrossRef]
- Tsai, Y.I.; Sopajaree, K.; Chotruksa, A.; Wu, H.-C.; Kuo, S.-C. Source indicators of biomass burning associated with inorganic salts and carboxylates in dry season ambient aerosol in Chiang Mai Basin, Thailand. Atmos. Environ. 2013, 78, 93–104. [Google Scholar] [CrossRef]
- Tsay, S.-C.; Hsu, N.C.; Lau, W.K.-M.; Li, C.; Gabriel, P.M.; Ji, Q.; Holben, B.N.; Welton, E.J.; Nguyen, A.X.; Janjai, S. From BASE-ASIA toward 7-SEAS: A satellite-surface perspective of boreal spring biomass-burning aerosols and clouds in Southeast Asia. Atmos. Environ. 2013, 78, 20–34. [Google Scholar] [CrossRef]
- Yadav, I.C.; Devi, N.L.; Li, J.; Syed, J.H.; Zhang, G.; Watanabe, H. Biomass burning in Indo-China peninsula and its impacts on regional air quality and global climate change—A review. Environ. Pollut. 2017, 227, 414–427. [Google Scholar] [CrossRef] [PubMed]
- Singh, A.; Chou, C.C.-K.; Chang, S.-Y.; Chang, S.-C.; Lin, N.-H.; Chuang, M.-T.; Pani, S.K.; Chi, K.H.; Huang, C.-H.; Lee, C.-T. Long-term (2003–2018) trends in aerosol chemical components at a high-altitude background station in the western North Pacific: Impact of long-range transport from continental Asia. Environ. Pollut. 2020, 265, 114813. [Google Scholar] [CrossRef] [PubMed]
- Ravindra Babu, S.; Ou-Yang, C.-F.; Griffith, S.M.; Pani, S.K.; Kong, S.S.-K.; Lin, N.-H. Transport pathways of carbon monoxide from Indonesian fire pollution to a subtropical high-altitude mountain site in the western North Pacific. Atmos. Chem. Phys. 2023, 23, 4727–4740. [Google Scholar] [CrossRef]
- Lee, C.-T.; Chuang, M.-T.; Lin, N.-H.; Wang, J.-L.; Sheu, G.-R.; Chang, S.-C.; Wang, S.-H.; Huang, H.; Chen, H.-W.; Liu, Y.-L. The enhancement of PM2.5 mass and water-soluble ions of biosmoke transported from Southeast Asia over the Mountain Lulin site in Taiwan. Atmos. Environ. 2011, 45, 5784–5794. [Google Scholar] [CrossRef]
- Hung, N.T.; Li, C.T.; Wang, S.H.; Ou-Yang, C.-F.; Lin, C.-Y.; Lee, C.-T.; Lin, N.-H.; Chi, K.H. Long-term monitoring of atmospheric PCDD/Fs at Mount Lulin during spring season: PCDD/F source apportionment through a simultaneous measurement in Southeast Asia. Chemosphere 2017, 185, 368–375. [Google Scholar] [CrossRef] [PubMed]
- Pani, S.K.; Lin, N.-H.; Lee, C.-T.; Griffith, S.M.; Chang, J.H.-W.; Hsu, B.-J. Insights into aerosol chemical composition and optical properties at Lulin Atmospheric Background Station (2862 m asl) during two contrasting seasons. Sci. Total Environ. 2022, 834, 155291. [Google Scholar] [CrossRef] [PubMed]
- Santoso, A.; Mcphaden, M.J.; Cai, W. The defining characteristics of ENSO extremes and the strong 2015/2016 El Niño. Rev. Geophys. 2017, 55, 1079–1129. [Google Scholar] [CrossRef]
- Hu, S.; Fedorov, A.V. The extreme El Niño of 2015–2016: The role of westerly and easterly wind bursts, and preconditioning by the failed 2014 event. Clim. Dyn. 2019, 52, 7339–7357. [Google Scholar] [CrossRef]
- Aragão, L.E.; Anderson, L.O.; Fonseca, M.G.; Rosan, T.M.; Vedovato, L.B.; Wagner, F.H.; Silva, C.V.; Junior, C.H.S.; Arai, E.; Aguiar, A.P. 21st Century drought-related fires counteract the decline of Amazon deforestation carbon emissions. Nat. Commun. 2018, 9, 536. [Google Scholar] [CrossRef]
- Field, R.D.; Van Der Werf, G.R.; Fanin, T.; Fetzer, E.J.; Fuller, R.; Jethva, H.; Levy, R.; Livesey, N.J.; Luo, M.; Torres, O. Indonesian fire activity and smoke pollution in 2015 show persistent nonlinear sensitivity to El Niño-induced drought. Proc. Natl. Acad. Sci. USA 2016, 113, 9204–9209. [Google Scholar] [CrossRef]
- Van Der Werf, G.R.; Randerson, J.T.; Giglio, L.; Van Leeuwen, T.T.; Chen, Y.; Rogers, B.M.; Mu, M.; Van Marle, M.J.; Morton, D.C.; Collatz, G.J. Global fire emissions estimates during 1997–2016. Earth Syst. Sci. Data 2017, 9, 697–720. [Google Scholar] [CrossRef]
- Nguyen, L.S.P.; Nguyen, K.T.; Griffith, S.M.; Sheu, G.-R.; Yen, M.-C.; Chang, S.-C.; Lin, N.-H. Multiscale temporal variations of atmospheric mercury distinguished by the Hilbert–Huang transform analysis reveals multiple El Niño–southern Oscillation Links. Environ. Sci. Technol. 2021, 56, 1423–1432. [Google Scholar] [CrossRef] [PubMed]
- Cataldo, D.; Leites, V.; Bordet, F.; Paolucci, E. Effects of El Niño-Southern Oscillation (ENSO) on the reproduction of migratory fishes in a large South American reservoir. Hydrobiologia 2022, 849, 3259–3274. [Google Scholar] [CrossRef]
- Kraisitnitikul, P.; Thepnuan, D.; Chansuebsri, S.; Yabueng, N.; Wiriya, W.; Saksakulkrai, S.; Shi, Z.; Chantara, S. Contrasting compositions of PM2.5 in northern Thailand during La niña (2017) and El niño (2019) years. J. Environ. Sci. 2024, 135, 585–599. [Google Scholar] [CrossRef] [PubMed]
- Kampa, M.; Castanas, E. Human health effects of air pollution. Environ. Pollut. 2008, 151, 362–367. [Google Scholar] [CrossRef]
- Tomašek, I.; Damby, D.E.; Andronico, D.; Baxter, P.J.; Boonen, I.; Claeys, P.; Denison, M.S.; Horwell, C.J.; Kervyn, M.; Kueppers, U. Assessing the biological reactivity of organic compounds on volcanic ash: Implications for human health hazard. Bull. Volcanol. 2021, 83, 30. [Google Scholar] [CrossRef]
- Punsompong, P.; Pani, S.K.; Wang, S.-H.; Pham, T.T.B. Assessment of biomass-burning types and transport over Thailand and the associated health risks. Atmos. Environ. 2021, 247, 118176. [Google Scholar] [CrossRef]
- Fadel, M.; Ledoux, F.; Afif, C.; Courcot, D. Human health risk assessment for PAHs, phthalates, elements, PCDD/Fs, and DL-PCBs in PM2.5 and for NMVOCs in two East-Mediterranean urban sites under industrial influence. Atmos. Pollut. Res. 2022, 13, 101261. [Google Scholar] [CrossRef]
- Ting, Y.-C.; Ku, C.-H.; Zou, Y.-X.; Chi, K.-H.; Soo, J.-C.; Hsu, C.-Y.; Chen, Y.-C. Characteristics and source-specific health risks of ambient PM2.5-bound PAHs in an urban city of northern Taiwan. Aerosol Air Qual. Res. 2023, 23. [Google Scholar] [CrossRef]
- Ngo, T.H.; Yang, Y.-H.; Chen, Y.-C.; Pan, W.C.; Chi, K.H. Continuous nationwide atmospheric PCDD/F monitoring network in Taiwan (2006–2016): Variation in concentrations and apportionment of emission sources. Chemosphere 2020, 255, 126979. [Google Scholar] [CrossRef]
- Chi, K.H.; Hsu, S.C.; Wang, S.H.; Chang, M.B. Increases in ambient PCDD/F and PCB concentrations in Northern Taiwan during an Asian dust storm episode. Sci. Total Environ. 2008, 401, 100–108. [Google Scholar] [CrossRef] [PubMed]
- Pan, S.Y.; Chen, H.W.; Hsu, S.C.; Chou, C.C.-K.; Lin, Y.C.; Chen, Y.W.; Chi, K.H. Assessment of Atmospheric PM2.5 and PCDD/Fs Collected by Different High-volume Ambient Air Sampling Systems. Aerosol Air Qual. Res. 2022, 22, 220116. [Google Scholar] [CrossRef]
- Chen, W.-R.; Singh, A.; Pani, S.K.; Chang, S.-Y.; Chou, C.C.-K.; Chang, S.-C.; Chuang, M.-T.; Lin, N.-H.; Huang, C.-H.; Lee, C.-T. Real-time measurements of PM2.5 water-soluble inorganic ions at a high-altitude mountain site in the western North Pacific: Impact of upslope wind and long-range transported biomass-burning smoke. Atmos. Res. 2021, 260, 105686. [Google Scholar] [CrossRef]
- Hsu, C.-Y.; Chiang, H.-C.; Lin, S.-L.; Chen, M.-J.; Lin, T.-Y.; Chen, Y.-C. Elemental characterization and source apportionment of PM10 and PM2.5 in the western coastal area of central Taiwan. Sci. Total Environ. 2016, 541, 1139–1150. [Google Scholar] [CrossRef] [PubMed]
- Maleki, R.; Asadgol, Z.; Kermani, M.; Jafari, A.J.; Arfaeinia, H.; Ghodsi, S.; Gholami, M. Concentration, sources, and inhalation-based risk assessment of PM2.5-bound PAHs and trace elements in ambient air of areas with low and high traffic density in Tehran. Arab. J. Geosci. 2021, 14, 855. [Google Scholar] [CrossRef]
- Callén, M.S.; Iturmendi, A.; López, J.M. Source apportionment of atmospheric PM2.5-bound polycyclic aromatic hydrocarbons by a PMF receptor model. Assessment of potential risk for human health. Environ. Pollut. 2014, 195, 167–177. [Google Scholar] [CrossRef]
- Paatero, P.; Tapper, U. Positive matrix factorization: A non-negative factor model with optimal utilization of error estimates of data values. Environmetrics 1994, 5, 111–126. [Google Scholar] [CrossRef]
- Ashbaugh, L.L.; Malm, W.C.; Sadeh, W.Z. A residence time probability analysis of sulfur concentrations at Grand Canyon National Park. Atmos. Environ. 1985, 19, 1263–1270. [Google Scholar] [CrossRef]
- Malm, W.; Johnson, C.; Bresch, J. Application of principal component analysis for purposes of identifying source-receptor relationships. Recept. Methods Source Apportionment 1986, 127, 148. [Google Scholar]
- Chang, S.-S.; Lee, W.-J.; Holsen, T.M.; Li, H.-W.; Wang, L.-C.; Chang-Chien, G.-P. Emissions of polychlorinated-p-dibenzo dioxin, dibenzofurans (PCDD/Fs) and polybrominated diphenyl ethers (PBDEs) from rice straw biomass burning. Atmos. Environ. 2014, 94, 573–581. [Google Scholar] [CrossRef]
- Rogge, W.F.; Hildemann, L.M.; Mazurek, M.A.; Cass, G.R.; Simoneit, B.R. Sources of fine organic aerosol. 3. Road dust, tire debris, and organometallic brake lining dust: Roads as sources and sinks. Environ. Sci. Technol. 1993, 27, 1892–1904. [Google Scholar] [CrossRef]
- Querol, X.; Alastuey, A.; Rodriguez, S.; Plana, F.; Mantilla, E.; Ruiz, C.R. Monitoring of PM10 and PM2.5 around primary particulate anthropogenic emission sources. Atmos. Environ. 2001, 35, 845–858. [Google Scholar] [CrossRef]
- Chi, K.H.; Lin, C.-Y.; Yang, C.-F.O.; Wang, J.-L.; Lin, N.-H.; Sheu, G.-R.; Lee, C.-T. PCDD/F measurement at a high-altitude station in Central Taiwan: Evaluation of long-range transport of PCDD/Fs during the Southeast Asia biomass burning event. Environ. Sci. Technol. 2010, 44, 2954–2960. [Google Scholar] [CrossRef]
- Hsueh, Y.-H.; Li, K.-F.; Lin, L.-C.; Bhattacharya, S.K.; Laskar, A.H.; Liang, M.-C. East Asian CO2 level change caused by Pacific decadal oscillation. Remote Sens. Environ. 2021, 264, 112624. [Google Scholar] [CrossRef]
- Ngo, T.H.; Hsu, W.T.; Chi, K.H. Evaluation of the relative health risk impact of atmospheric PCDD/Fs in PM2.5 in Taiwan. Aerosol Air Qual. Res 2018, 18, 2591–2599. [Google Scholar]
- Ngo, T.H.; Hien, T.T.; Thuan, N.T.; Minh, N.H.; Chi, K.H. Atmospheric PCDD/F concentration and source apportionment in typical rural, Agent Orange hotspots, and industrial areas in Vietnam. Chemosphere 2017, 182, 647–655. [Google Scholar] [CrossRef]
- Janta, R.; Sekiguchi, K.; Yamaguchi, R.; Sopajaree, K.; Pongpiachan, S.; Chetiyanukornkul, T. Ambient PM2.5, polycyclic aromatic hydrocarbons and biomass burning tracer in Mae Sot District, western Thailand. Atmos. Pollut. Res. 2020, 11, 27–39. [Google Scholar] [CrossRef]

Disclaimer/Publisher’s Note: The statements, opinions and data contained in all publications are solely those of the individual author(s) and contributor(s) and not of MDPI and/or the editor(s). MDPI and/or the editor(s) disclaim responsibility for any injury to people or property resulting from any ideas, methods, instructions or products referred to in the content. |
© 2024 by the authors. Licensee MDPI, Basel, Switzerland. This article is an open access article distributed under the terms and conditions of the Creative Commons Attribution (CC BY) license (https://creativecommons.org/licenses/by/4.0/).