Article

Carbon and Water Balances in a Watermelon Crop Mulched with Biodegradable Films in Mediterranean Conditions at Extended Growth Season Scale

by
Rossana M. Ferrara
1,*,
Alessandro Azzolini
1,*,
Alessandro Ciurlia
1,
Gabriele De Carolis
1,
Marcello Mastrangelo
1,
Valerio Minorenti
1,
Alessandro Montaghi
2,
Mariagrazia Piarulli
1,
Sergio Ruggieri
1,
Carolina Vitti
1,
Nicola Martinelli
1 and
Gianfranco Rana
1
1
Council for Agricultural Research and Economics, Agriculture and Environment Research Centre (CREA-AA), 70125 Bari, Italy
2
National Research Council of Italy (CNR), Institute of Research on Terrestrial Ecosystems (IRET), 50019 Sesto Fiorentino, Italy
*
Authors to whom correspondence should be addressed.
Atmosphere 2024, 15(8), 945; https://doi.org/10.3390/atmos15080945
Submission received: 2 July 2024 / Revised: 17 July 2024 / Accepted: 31 July 2024 / Published: 7 August 2024
(This article belongs to the Section Biosphere/Hydrosphere/Land–Atmosphere Interactions)

Abstract

:
The carbon source/sink nature and the water balance of a drip-irrigated and mulched watermelon cultivated under a semi-arid climate were investigated. Biodegradable films, plants and some fruits were left on the soil as green manure. The study spanned from watermelon planting to the subsequent crop (June–November 2023). The eddy covariance technique was employed to monitor water vapor (H2O) and carbon dioxide (CO2) fluxes, which were partitioned into transpiration, evaporation, photosynthesis and respiration, respectively, using the flux variance similarity method.This method utilizesthe Monin–Obukhov similarity theory to separate stomatal (photosynthesis and transpiration) from non-stomatal (respiration and evaporation) processes. The results indicate that mulching films contribute to carbon sequestration in the soil (+19.3 g C m−2). However, the mulched watermelon crop presented in this study functions as a net carbon source, with a net biome exchange, representing the net rate of C accumulation in or loss from ecosystems, equal to +230 g C m−2. This is primarily due to the substantial amount of carbon exported through marketable fruits. Fixed water scheduling led to water waste through deep percolation (approximately 1/6 of the water supplied), which also contributed to the loss of organic carbon via leaching (−4.3 g C m−2). These findings recommend further research to enhance the sustainability of this crop in terms of both water and carbon balances.

1. Introduction

Watermelon [Citrullus lanatus (Thun.) Matsum & Nakai] is a crop of considerable economic importance worldwide. Currently, Spain leads watermelon production in Europe, followed by Italy, whose production has been continuously increasing both in yield and surface terms, reaching approximately 650,000 Mg in 2023 [1]. Watermelon crop, when managed in irrigated conditions, requires substantial quantities of water to improve yield due to its high growth rate, short growing period, and water content of 90–92% in the fruits [2]. Since irrigated watermelon, like other cucurbit crops, benefits from mulching in open field [3], the adoption of soil partial mulching is a cropping management practice that is continuously expanding in the Mediterranean region, where water is a limiting factor for stable and high-quality productions [4,5].
The commercial value of watermelon fruits is strongly linked to marketable quality standards; therefore, non-saleable fruits (due to non-standard sizes, anomalous shapes or imperfect skin) are usually not harvested [6] and are left on the soil surface, until subsequent chopping. This final crop management step, following the scaled harvesting of watermelon fruits, has never been studied in terms of carbon dioxide (CO2) and water (H2O) balances, despite it being part of the cropping season.
Mulching efficiently reduces ineffective water consumption by reducing soil evaporation [7]; therefore, it is often recommended as an agrotechnical practice to enhance water use efficiency (WUE) [8] in high-value crops, both herbaceous and arboreal [9].
On the other hand, mulching with films was found to significantly affect greenhouse gas (GHG) emissions during the crop growth cycle, although the actual impacts on the GHG balance are still debated. Gao et al. [10] found a general consistent reduction in GHG emissions in mulched rice cropping; Li et al. [11] noted that a film-mulched cotton crop acts as a stronger carbon sink compared to a non-mulched canopy; Gong et al. [12] observed that partial mulching in maize stimulates assimilation more than respiration throughout the growing season, resulting in more efficient carbon storage; Qian et al. [13] found that film mulching combined with straw incorporation in a maize crop increases CO2 and nitrous oxide (N2O) emissions and, at season level, increases soil C storage with respect to other treatments. Conversely, other studies (see the review by [14]) have reported that mulching films increase N2O emissions, an effect largely dependent on the agricultural system adopted. Furthermore, Ming et al. [15] found that plastic mulching combined with drip irrigation in rice enhanced both carbon assimilation and respiration, with the latter increasing more than the former. Similarly, Xiong et al. [16] reported that in wheat, plastic mulching plus irrigation decreased the C footprint at high nitrogen (N) fertilization rates, whereas the C footprint increased under low N rates compared to cultivation without mulch.
The processes involved when a film uniformly covers part of the cultivated surface include alterations in the soil’s hydrological and thermal conditions, which, subsequently, influence the soil’s biogeochemical processes. These alterations stimulate (i) the decomposition of soil organic carbon (SOC) and (ii) the fermentation and nitrification/denitrification processes, producing methane (CH4) and N2O, respectively. On the other hand, the increase in the soil temperature and moisture content due to film mulching contributes to the rapid loss of SOC. These two contrasted processes can result in enhancing, stabilizing, or decreasing SOC conservation [17,18,19,20] depending on environmental factors, agricultural systems, crop types and field management practices [11,13]. However, in general, as reported by 21. Birkhofer et al. [21], short-term studies cannot provide a clear picture of changes in agroecosystem support services due to agricultural systems since soil carbon requires at least 8–10 years to detect meaningful changes.
The extensive use of plastic mulching films in agriculture has strong environmental impacts [22,23] which can potentially be mitigated by using biodegradable materials that degrade in the environment by between 85% and 95% depending on their components [24]. However, aside from the general improvement in WUE when biodegradable mulching films are used [25], information on carbon and water balances in such scenarios is scarce, especially considering that the film is typically not collected and removed but left on the soil surface post-harvest until it decomposes.
The eddy covariance (EC) technique for measuring scalar fluxes in the soil–crop–atmosphere continuum (see, e.g., [26]) is a suitable method for accurately establishing H2O and CO2 balances at the ecosystem level [27,28]. This capability of the EC technique can be notably enhanced to understand the separate active roles of the crop and the soil on H2O and CO2 exchanges when these EC fluxes are partitioned into transpiration (T) and evaporation (E) and photosynthesis (P) and respiration (R), respectively. The well-established flux variance similarity (FVS) method can be utilized for this purpose; this technique was first introduced by Scanlon et al. [29,30]. FVS can distinguish between stomatal (T and P) and non-stomatal (E and R) fluxes when active plants are present on the soil surface [31].
The aim of this study was to assess the dynamics of canopy CO2 assimilation and respiration, H2O crop transpiration and soil evaporation for a watermelon crop subjected to a Mediterranean semi-arid climate. Furthermore, water use efficiency has been determined over six months from planting to the next cultivation.

2. Materials and Methods

2.1. The Site, the Crop and the Mulching

The field site was at the CREA-AA Research Unit experimental farm located in southern Italy (Rutigliano–Bari, 41° 01′ N, 17° 01′ E, altitude 147 m a.s.l.). The site is characterized by a Mediterranean semi-arid climate, categorized as Csa according to the Köppen–Geiger classification. Over the past thirty years, the average annual rainfall has been 535 mm, primarily occurring between autumn and late winter. The year 2023 was hot and very dry compared to the preceding twenty years. The soil, classified as “Lithic Rhodoxeralf”, features a clay texture, stable structure, shallow profile (0.6–1.1 m) and rapid drainage due to an underlying cracked limestone subsoil. The SOC content averages around 12.0 g kg−1. The field capacity (FC) and the permanent wilting point (WP) volumetric water contents are 0.36 and 0.21 m3m−3, respectively. Consequently, with a bulk density of 1.15 Mg m−3, the available soil water ranges from 80 to 140 mm.
Measurements were conducted on a watermelon crop (seedless var. Lion king), following a broccoli cabbage crop harvested in April and partially incorporated (0.81 kg m−2 of fresh biomass in a soil layer depth of 0.30 m, corresponding to 0.69 kgH2O m−2) as green manure on 25 May 2023. Main tillage at medium depth ploughing (0.30 m) and seedbed preparation were performed between 25 and 30 May 2023; the biodegradable film mulch (model PC 100 d8, BASF, Italy, 1 m width) was applied on 1 June 2023. On the same day, driplines (2.1 Lh−1 emitters, 0.60 m apart) and the main organic fertilization (Orga-Kem 6.11.8 + 11CaO, 300 kg ha−1) were also applied. The watermelon plants were transplanted on 9 June at a spacing of 2.70 m between rows and 1 m between plants, covering an area of about 4.0 ha, with a density of approximately 3200 plants ha−1. Every 6 rows, the inter-row distance was 5 m to facilitate machinery passage. The first irrigation was performed the day before planting. Crop management adhered to the usual treatments in the area including mechanical weed removal every 4 weeks, irrigation around three times per week to maintain optimal soil water conditions and monthly fertigation (ammonium sulphate 50 kg ha−1, magnesium nitrate 30 kg ha−1, calcium nitrate 60 kg ha−1, mycorrhizae 20 kg ha−1). The scalar harvest of marketable fruits occurred between 28 and 31 August 2023. After harvesting, on 25 September 2023, the fresh plant residues (0.6 kg m−2 of fresh biomass, corresponding to 0.49 kgH2O m−2), unharvested fruits (4.0 kg m−2 of fresh material, corresponding to 3.7 kgH2O m−2) and the mulching film were chopped by a tractor shredder and ploughed in two steps, on 2 and 13 October 2023, to a soil depth of 0.30 m. Measurements concluded at the end of November 2023, when tillage for the new winter crop commenced.
For the development during the growing cycle, plants were harvested weekly or bi-weekly with randomized samples (3 plants). Each was analyzed for fresh biomass (FB) weight, dry matter (DM), leaf area index (LAI) using a Licor 3100 (Li-COR Inc., Lincoln, NE, USA) and plant height.
The field coverage ratio on sampled dates was obtained by NDVI. The instrumentation for multispectral remote sensing was the Phantom 4 RTK unmanned aerial vehicle (UAV) with DJI GS PRO software (v2.0.15) for planning the survey area. The flight altitude was 33 m with 80% front and side overlap and a flight speed of 2.3 m s−1. The Phantom 4 is equipped with six 1/29” CMOS sensors in the Blue (450 nm ± 16 nm), Green (560 nm ± 16 nm), Red (650 nm ± 16 nm), Red edge (730 nm ± 16 nm), Near-infrared (840 nm ± 26nm) and RGB bands for visible light. During image acquisition, the Phantom 4 RTK UAV was coupled to a DJI D-RTK 2 Mobile Station differential positioning system (https://www.dji.com/it/d-rtk-2/info; last accessed on 12 June 2024). PIX4D mapper v.4 software (https://www.pix4d.com/product/pix4dmapper-photogrammetry-software/; last accessed on 12 June 2024) was used to mosaic and orthorectify the images, achieving a resolution of 0.02 m. The UAV’s solar sensor was used for reflectance calibration (https://dl.djicdn.com/downloads/p4-multispectral/20200717/P4_Multispectral_Image_Processing_Guide_EN.pdf; last accessed on 12 June 2024). After importing the images produced by PIX4D into the QGIS environment (https://qgis.org/en/site/; last accessed on 12 June 2024), for each acquisition date, the NDVI vegetation index was calculated to determine the area covered by vegetation in the study area.

2.2. Continuous Monitoring of Agro- and Micro-Meteorological Variables

The EC flux tower was established in the center of the field a few days prior to the installation of the mulching film, specifically on 25 May 2023. The equipment comprised a three-dimensional sonic anemometer (uSonic 3 Scientific, Metek GmbH, 25337 Elmshorn, Germany) and a fast response open-path infrared gas analyzer (LI-7500, Li-COR Inc., Lincoln, NE, USA). The three wind components, sonic temperature and atmospheric concentrations of CO2 and H2O were continuously measured at 1.5 m above the crop canopy, with the sensor height adjusted to follow crop growth, reaching a maximum of 1.75 m. The gas analyzer was positioned 0.32 m laterally from the anemometer to avoid airflow distortions, endeavoring measurement of the same air parcels. Micrometeorological data were recorded at a frequency of 10 Hz on a dedicated computer using the MeteoFlux software (Servizi Territorio, S.n.c., Cinisello Balsamo, Italy) and were stored on an hourly scale. Post-processing and computation of hourly fluxes of H2O (Fq, mmol m−2 s−1) and CO2 (Fc, μmol m−2 s−1) were conducted using EddyPro® software, v7.0.9 (http://www.licor.com/eddypro, last accessed on 12 June 2024), applying 60 min block averaging, double coordinate rotation, the statistical test [32], the maximum cross-covariance method, and the WPL density correction [33].
Continuous hourly meteorological data, including air temperature (Ta, °C), relative humidity (RH, %), precipitation (P, mm), global radiation (Rg, W m−2) and photosynthetically active radiation (PAR, mmol m−2) were collected from an automatic weather station equipped with standard sensors, situated in proximity to the experimental field.
Soil water content in volume (θ, m3 m−3) was measured by capacitive probes (10HS, Decagon Devices Inc., Pullman, WA, USA). Three points were monitored: two along the row below the mulched surface (θr) and one between the rows (θir). At each point, two capacitive probes were installed horizontally into the soil profile and transversely to the row, at depths of −0.15 m and −0.30 m. These sensors were connected to dataloggers (Tecno.el srl, Roncade, Italy) with data stored hourly and averaged daily. Integrated soil water content for the profile was calculated by integrating values measured at each depth, as described in [34]. The θ measurements from the three points were pooled to obtain a single mean value as [35,36]:
θ = 0.7 θ r ¯ + 0.3 θ i r ,
where θ r ¯ is the mean of the two θ measurements along the rows. Soil water availability was determined by the relative extractable water (REW, unitless, [37]) calculated as:
R E W = θ θ m i n θ m a x θ m i n ,
where θmin and θmax represent the minimum and maximum soil water content, respectively, observed during the experiment.

2.3. The Net Biome Exchange, the Carbon and Water Balance

The hourly Fq and Fc fluxes were cumulated over the course of the day during the extended growth season to establish the water and carbon balance in this cropping system.
The net flux of CO2, which represents the net ecosystem exchange (NEE), also referred to as ecosystem productivity (NEP), is given by:
N E E = G P P + R e c o ,
where all terms are in g C m−2; GPP denotes the gross primary production (carbon assimilated via photosynthesis) and Reco represents the total ecosystem respiration. Both parameters were estimated by the EC measurements and FVS partitioning. In accordance with atmospheric conventions, fluxes moving downward from the atmosphere to the ecosystem (GPP) are negative, while fluxes moving upward are positive (Reco).
To determine if the watermelon crop under the present conditions can be classified as a carbon sink (C-sink, indicating carbon uptake from the atmosphere, negative) or a carbon source (C-source, indicating carbon loss from the ecosystem to the atmosphere, positive), the net biome exchange (NBE, [38,39]) is calculated by:
N B E = N E E + F C h a r v e s t ,
where FCharvest denotes the organic carbon exported through watermelon fruit harvesting.
The carbon budget of the watermelon field can be assessed by considering all C inputs and outputs. Rigorously, the CH4 flux should also be included in the C balance [40]. However, for this study, this term was not considered, and a simplified version was used for the variation in soil organic carbon stock (ΔSOC) over time (Δt):
S O C / t = N E E + F C i n + F C o u t ,
where FCin and FCout are the organic carbon imported (positive) and exported (negative), respectively. Negative values of NEE by Equation (3) indicate C import to the field; hence, for this balance, the sign must be inverted.
The total organic carbon input is given by:
F C i n = F C g r e e n . m a n u r e + F C o r g . f e r t + F C m u l c h i n g . f i l m ,
where FCgreen.manure is the organic carbon imported via green manure from broccoli, watermelon plants and fruits, FCorg.fert is the organic carbon imported by fertilization and FCmulching.film is the organic carbon imported via the incorporation of the biodegradable mulching film into the soil.
The total organic carbon out is given by:
F C o u t = F C h a r v e s t + F C l e a c h
where FCleach represents the organic carbon lost by leaching.
ΔSOC was measured in a 0–0.30 m soil layer, where all green manure operations were conducted and more than 80% of the total root length was found [41].
To determine the C content (%) in the fresh biomass and the biodegradable mulching film, a CHN Elemental Analyzer (Flash EA 1112, Thermo Scientific, Waltham, MA, USA) was employed. Broccoli biomass, watermelon plants and harvested fruit biomass were collected in triplicate samples of 1 m2, randomly collected in the area around the EC tower.
The ΔSOC of Equation (5) was computed by sampling soil before seeding after the green manure of the broccoli crop and at the end of the monitoring period (24 May 2023 and 30 November, respectively). On air-dried and sieved soil samples (0.5 mm particle size), SOC was measured by dry combustion [42] with a Vario Select analyzer (Elementar, Hanau, Germany).
C lost via leaching was estimated according to [43], by measuring the soil water-extractable organic carbon (WEOC) content at the beginning and end of the trial. WEOC was measured according to a protocol reported by [44].
Finally, the uncertainties on the presented terms of the C balance were evaluated using the error propagation law [45], where the final uncertainty is the sum of the absolute errors calculated through the relative error on the sampled values.
In arid and semi-arid areas with minimal slopes, surface runoff can be neglected, and capillary rise is nearly non-existent in shallow soils [4]. Thus, a simplified water balance was established on a daily scale as:
θ = P + I + E + T + D P ,
where I is the water supplied via irrigation, E and T are the actual evaporation and transpiration, respectively; DP is the water lost via deep percolation, and θ is the soil water content variation in the time interval. All terms in Equation (8) are in kg H2O m−2.
The FVS partitioning method was employed to determine the terms GPP, Reco, E, and T, in Equations (3) and (8), respectively. The FVS approach applies the flux variance similarity, derived from the Monin–Obukhov similarity theory, separately to stomatal (GPP and T) and non-stomatal (Reco and E) processes. The FVS method provides analytical expressions to partition CO2 and H2O fluxes simultaneously; it requires inputs of (i) the variables commonly derived from high-frequency EC measurements and (ii) the leaf-level water use efficiency (WUEl) for the analyzed crop. Here, the FVS calculation proposed by [46] was utilized; the H2O and CO2 EC fluxes were partitioned using an adaptation of the code in Phyton provided by [47] and downloaded from https://github.com/usda-ars-ussl/fluxpart, v0.2.10, last accessed on 26 May 2024. WUEl values were directly estimated by the cited code. Further details about the partitioning method used can be found in the study by [31] conducted at the same experimental site with the same equipment.

2.4. The Water Use Efficiencies

To provide practical agricultural and environmental indicators, several WUE values [39,48,49,50] are calculated on a seasonal growth scale.
The agronomic water use efficiency (WUEagro, kg m−3), often referred to as “water productivity” by several authors (see [49] for a review), is determined as the ratio between the final harvested crop production (yield of fresh fruits biomass, in kg m−2) and the cumulative evapotranspiration (ET, in m3 m−2) during the period from planting to harvest:
W U E a g r o = y i e l d E T .
The irrigation water use efficiency (WUEirr, kg m−3) is calculated as the ratio between yield (kg m−2) and the sum of irrigations (I, m3 m−2) and precipitations (P, m3 m−2) accumulated during the period from planting to harvest:
W U E i r r = y i e l d P + I .
The physiological water use efficiency (WUEph, g C kg H2O−1; [48,51]) over the extended growing period is given by:
W U E p h = G P P T .
More commonly, this indicator is defined as [39,52,53]:
W U E p h = G P P E T .
The environmental water use efficiency (WUEenv, g C kg H2O−1; [54]) at the ecosystem level over the extended growing period is:
W U E e n v = N E E E T

3. Results and Discussion

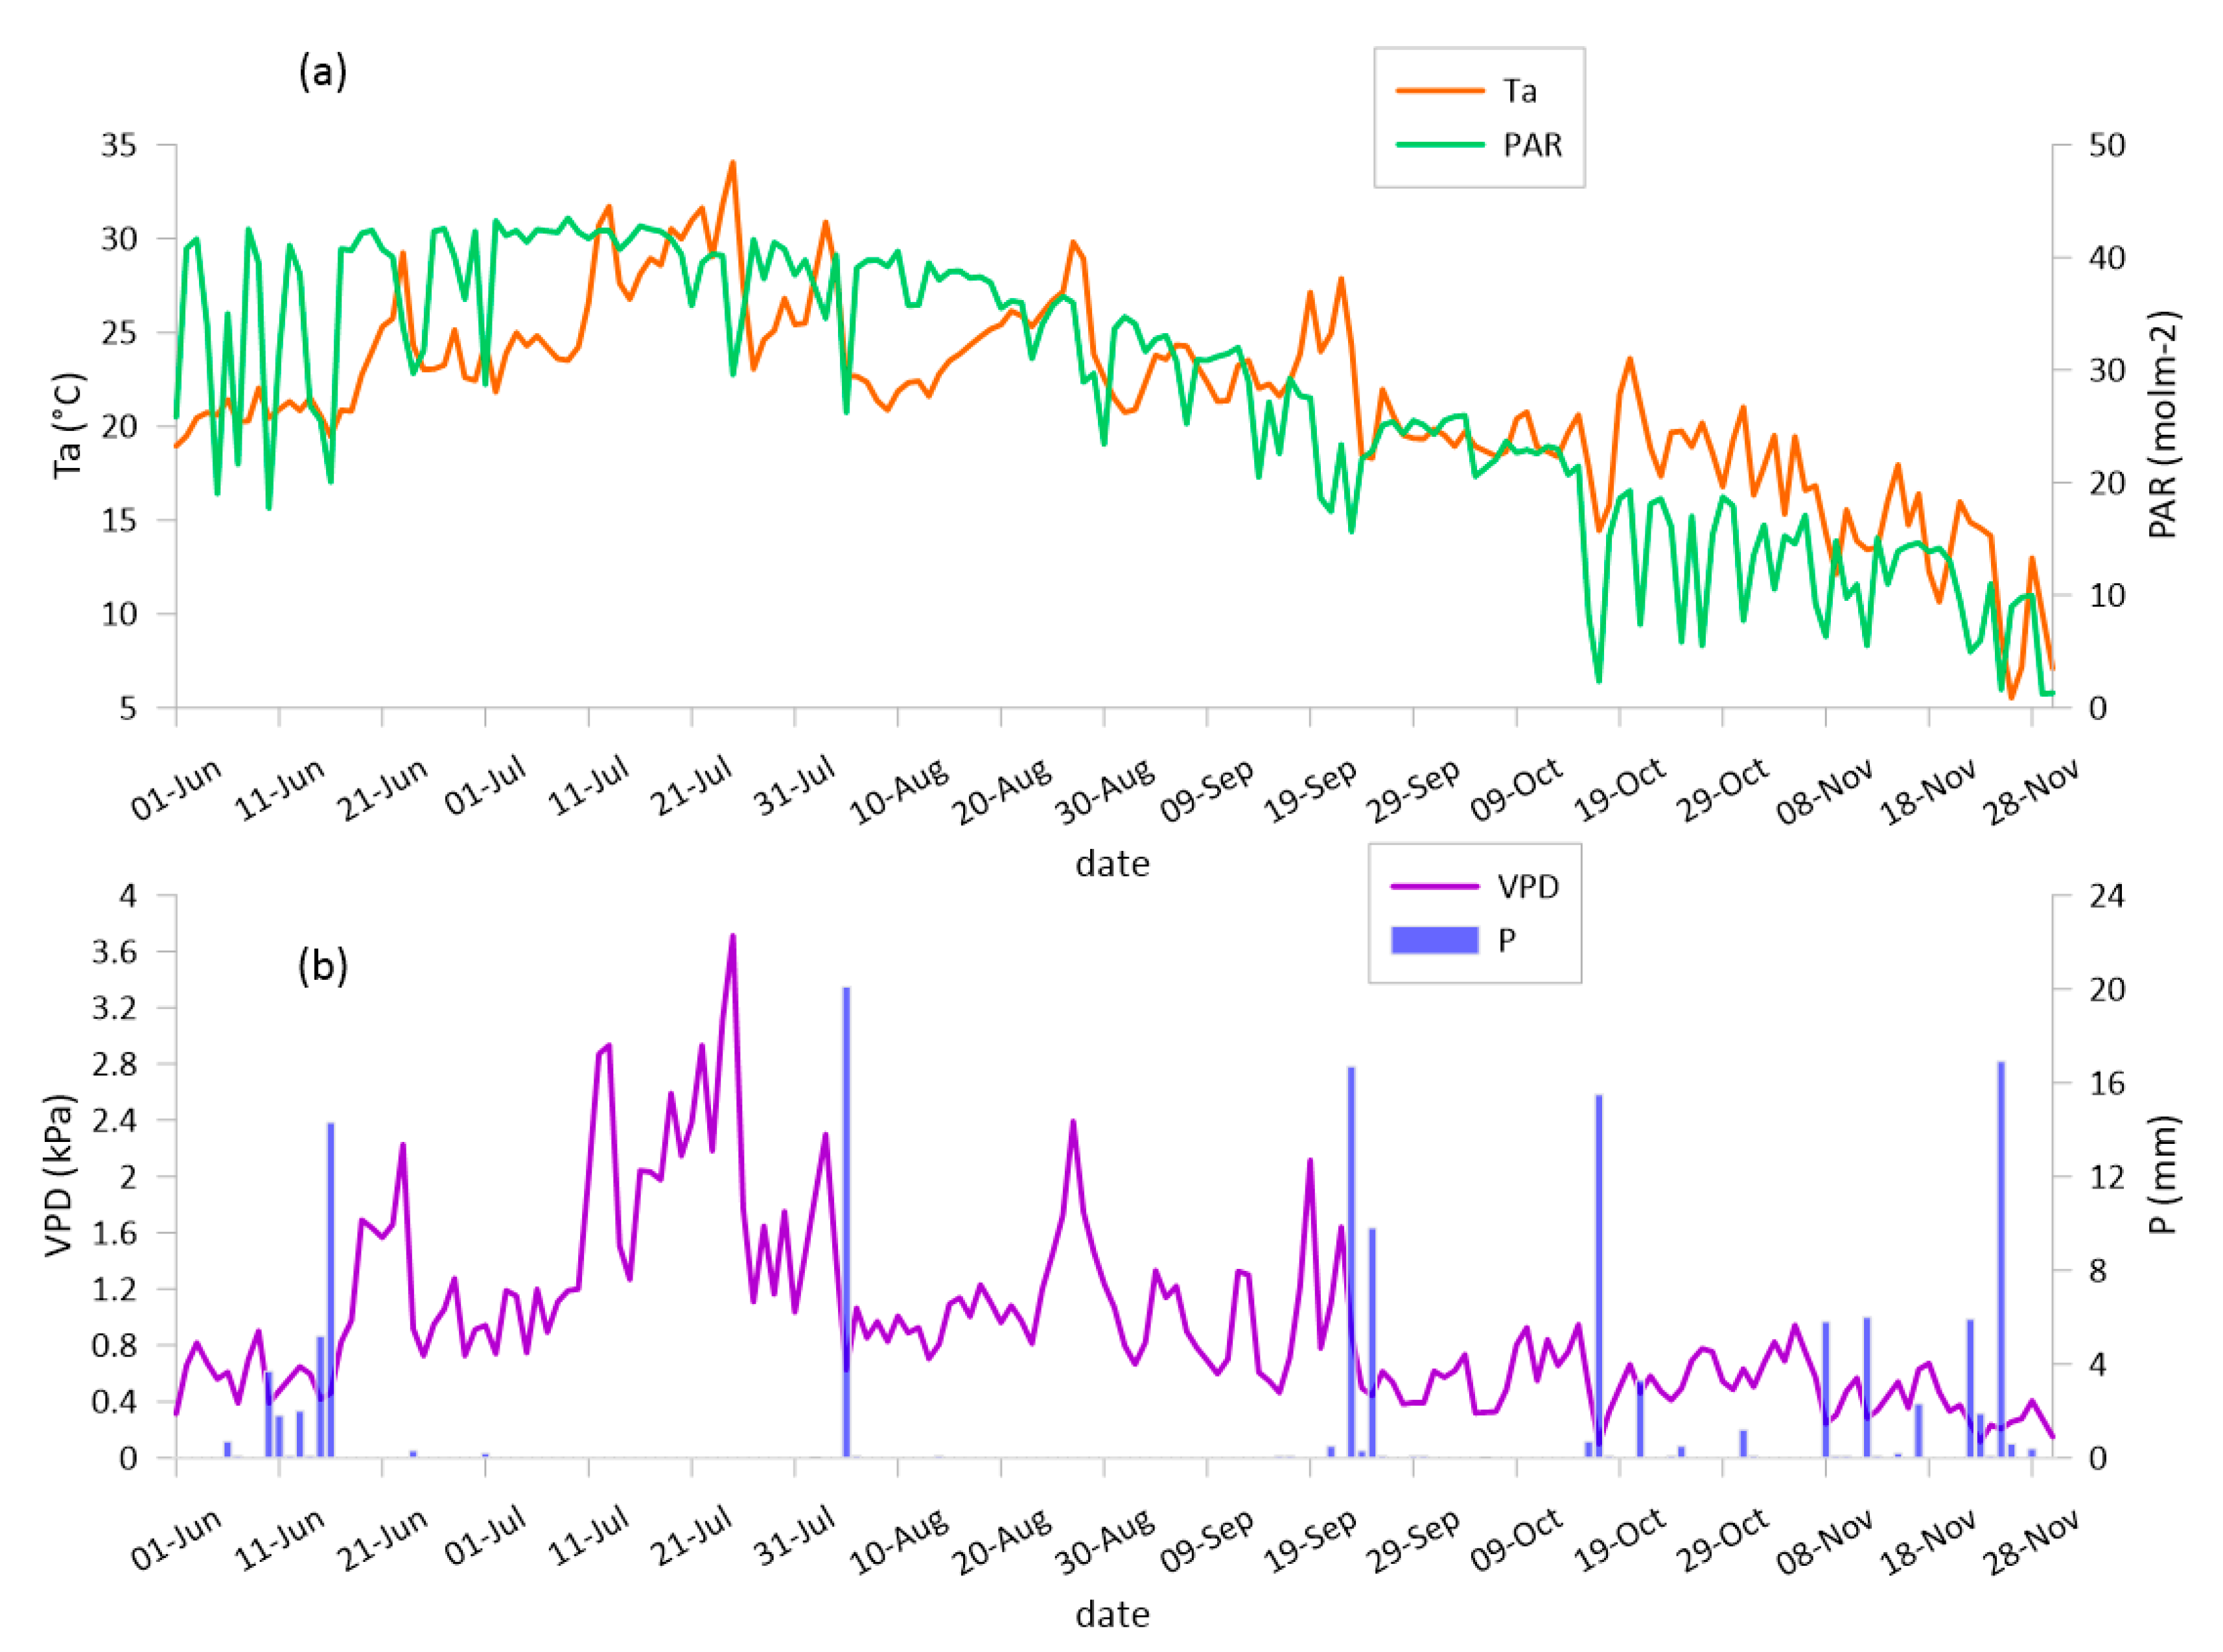
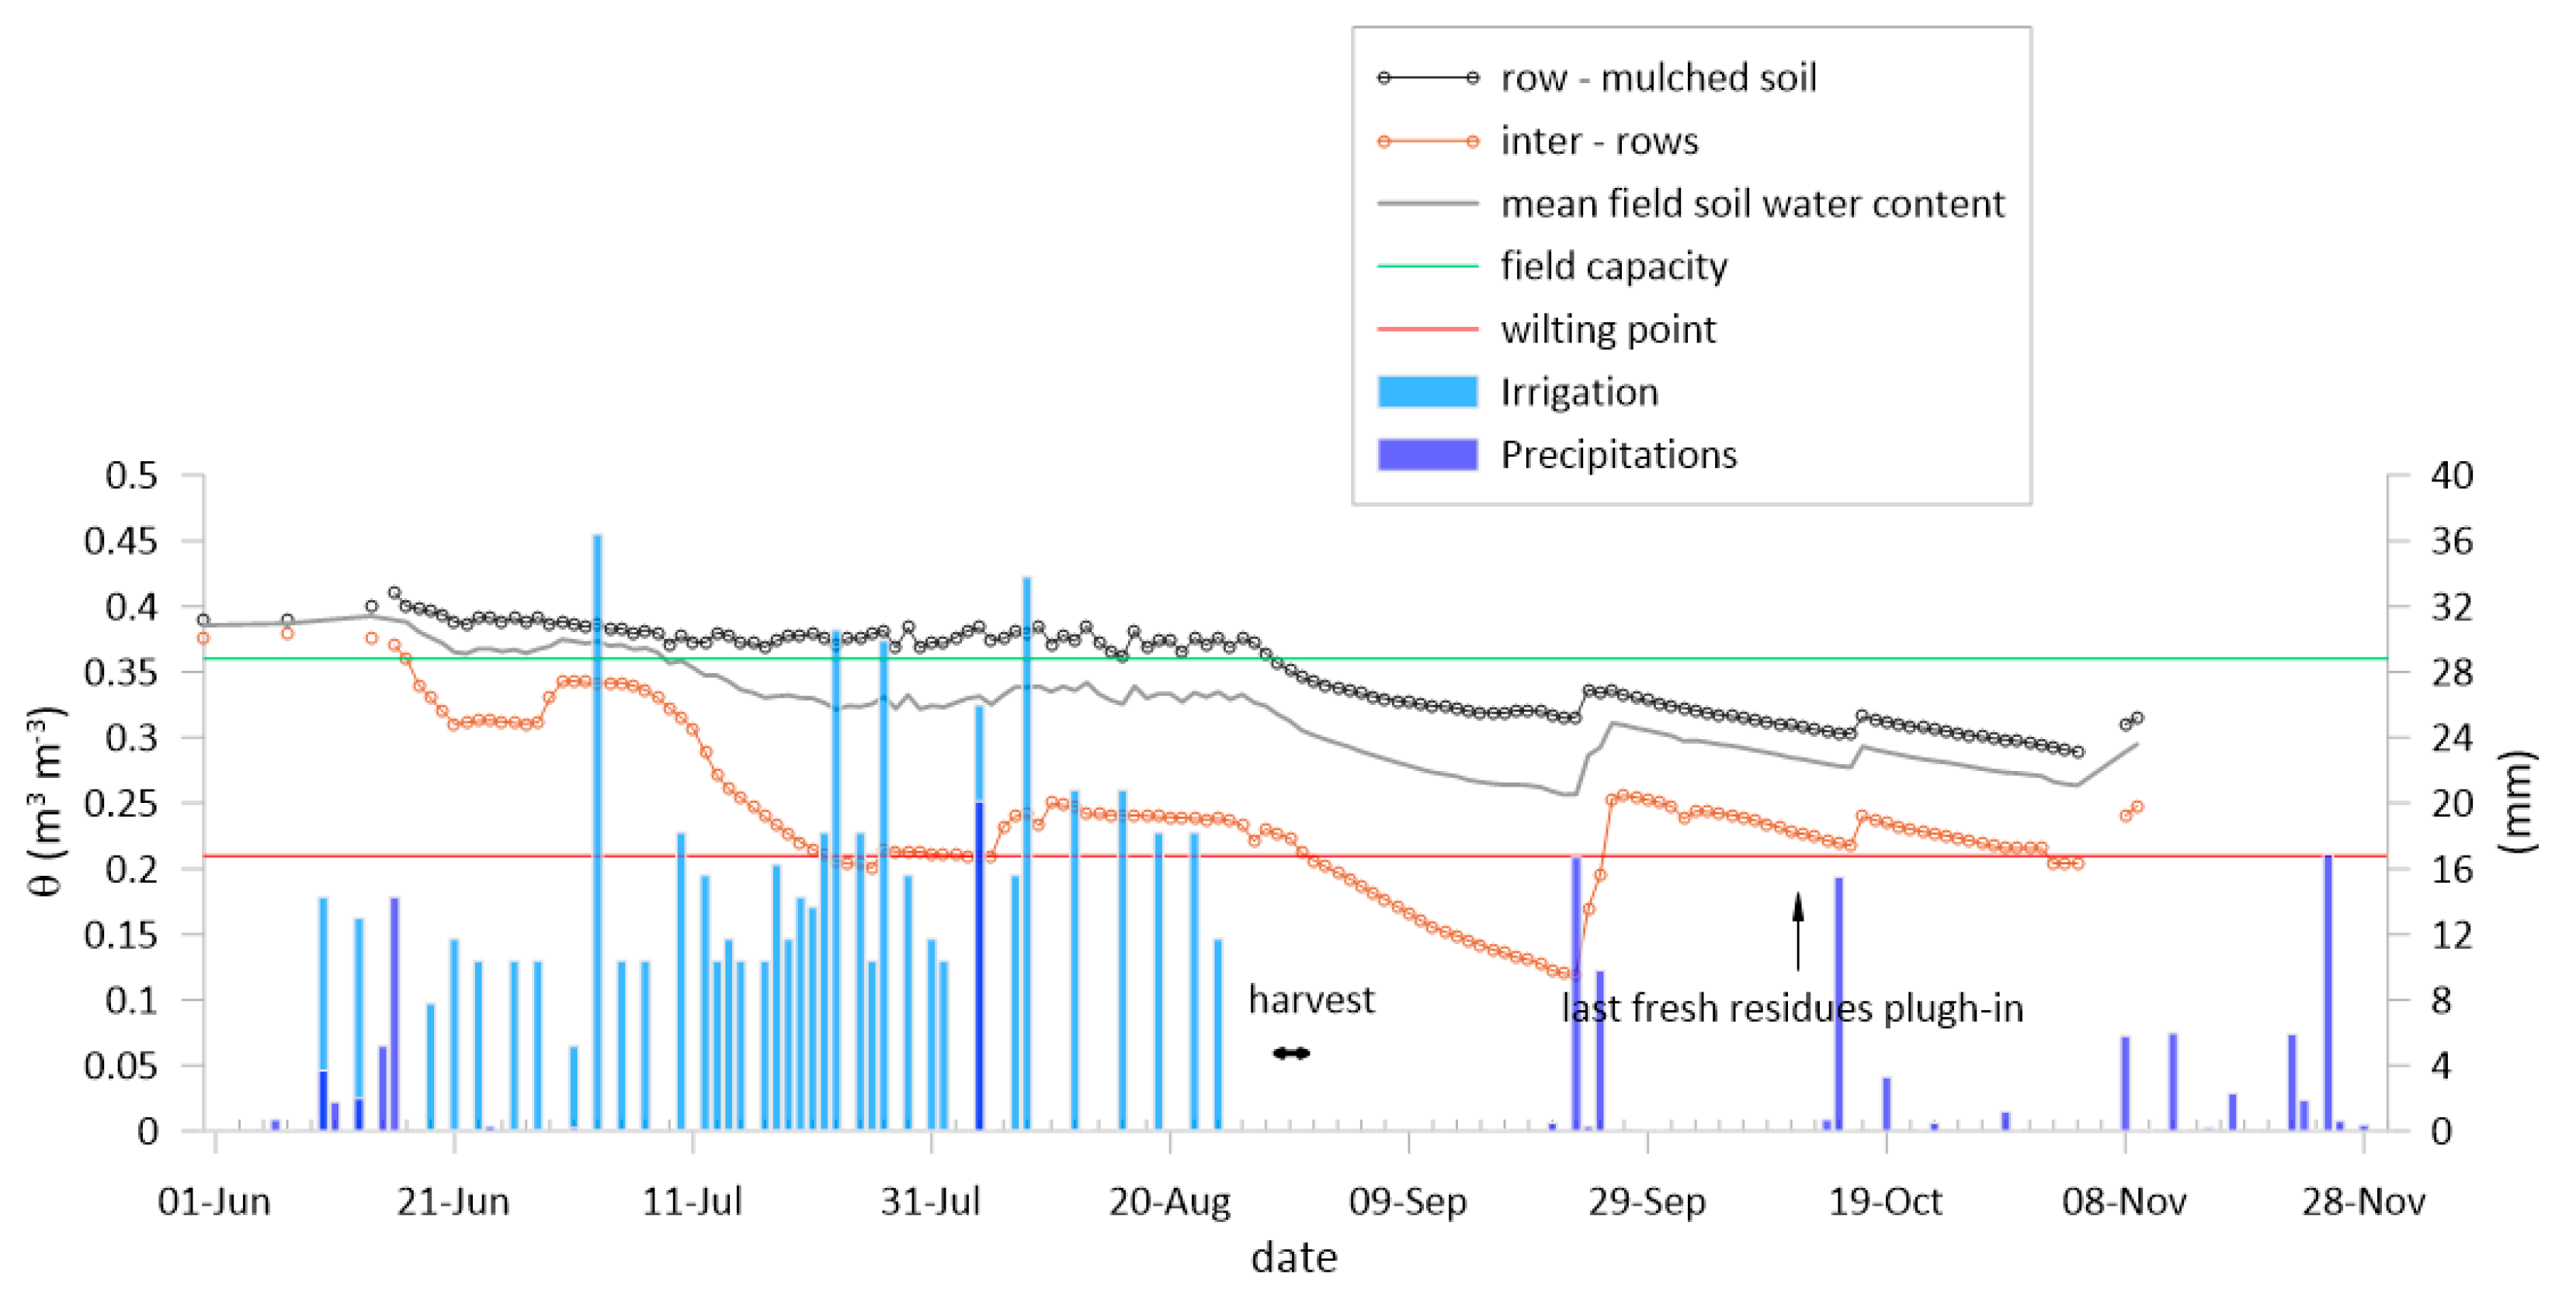
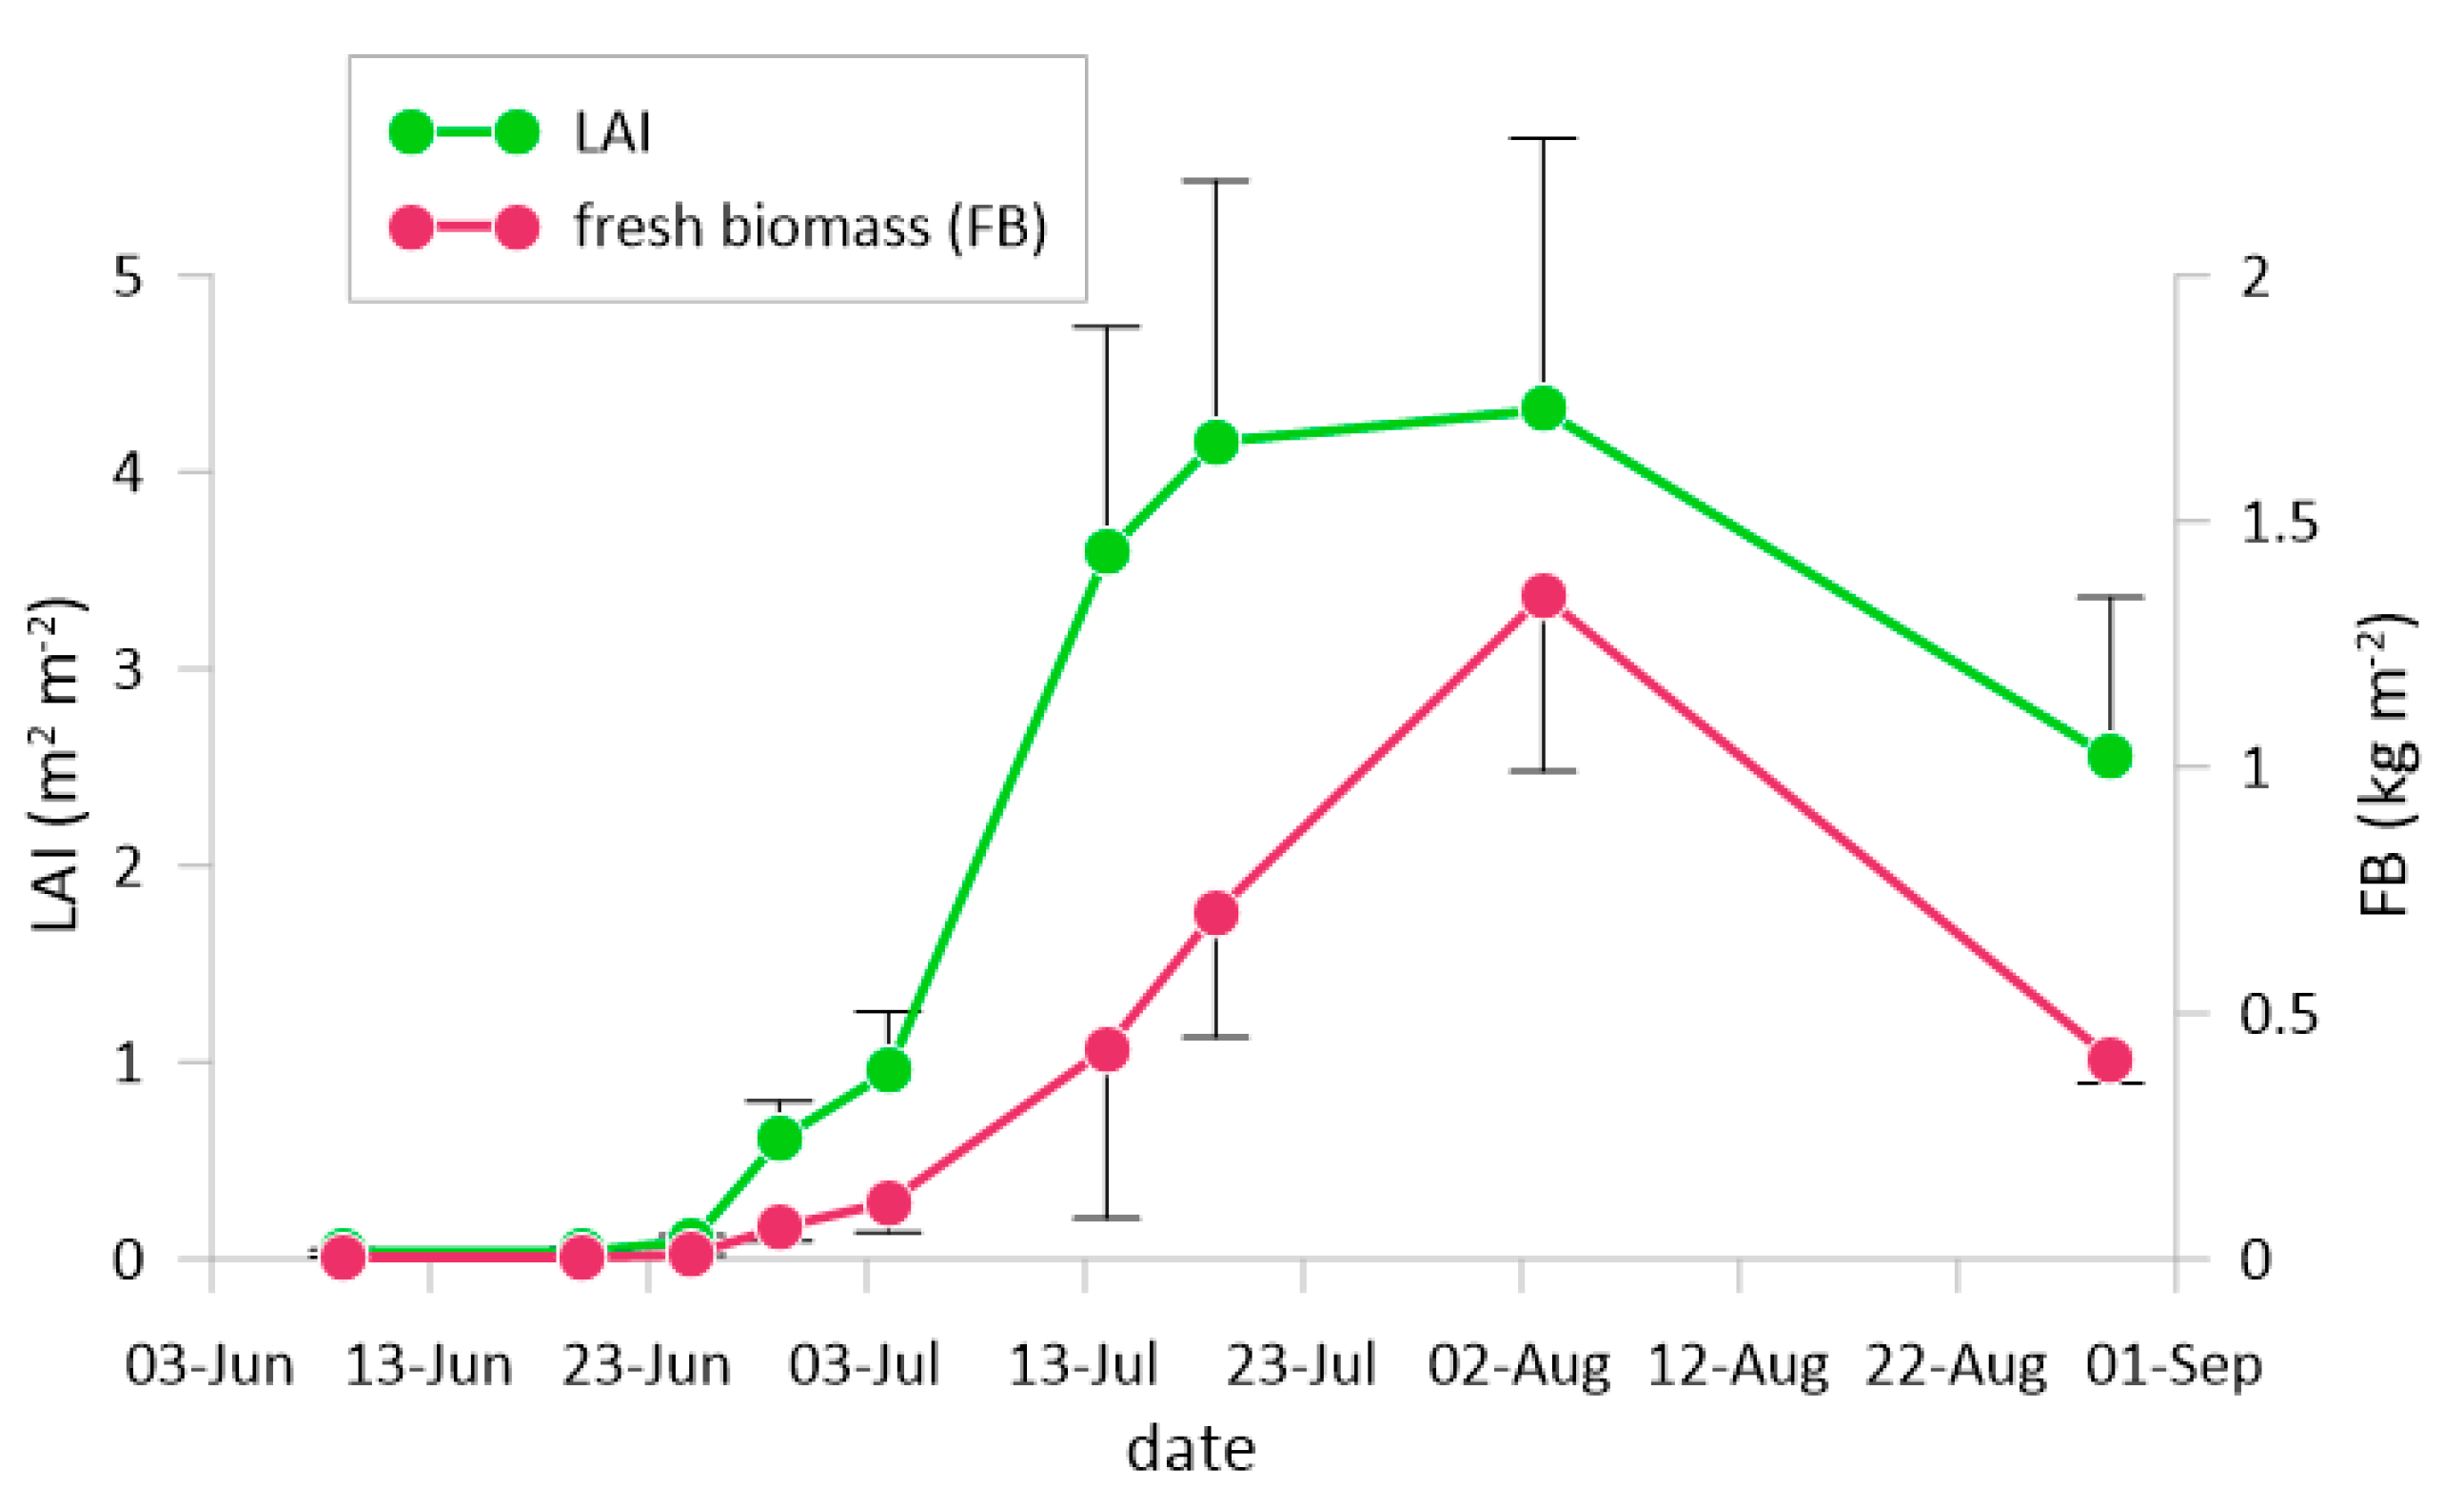
3.1. The Weather, the Soil Water Content and Crop Development

The seasonal daily time courses of the main agrometeorological variables—air temperature (Ta), photosynthetically active radiation (PAR), vapor pressure deficit (VPD, kPa) and precipitation (P)—during the experimental period (1 June–30 November) are shown in Figure 1a,b. Ta was 24.6 ± 3.4 °C, with a very hot period in the second half of July when daytime hourly temperatures exceeded 41 °C. During late spring and early summer, 48.8 mm of precipitation was recorded. The radiation pattern expressed by PAR follows the usual trend for the area, while VPD reached high values corresponding to high Ta in the second part of July.
The patterns of soil water content, expressed by θ, are illustrated in Figure 2, along with irrigation and rainfall events for clarity. In the figure, mean-field θ values are reported, distinguishing between mulched rows and non-mulched rows, along with the wilting point and field capacity. At the beginning and end of the experimental period, missing values were due to equipment malfunction. After irrigation began, θ values evolved differently for θr and θir; while soil water content below the mulched surface remained almost constant and around field capacity (FC), the water content in soil not covered by the films decreased rapidly as evaporation proceeded, even dropping below the WP in the middle part of the growth cycle and more severely after the crop harvesting. In the latter case, the sudden increase in θir corresponds solely to precipitation events. Mean θ values at the field level remained above WP. These high mean θ values were due to substantial water supply via irrigation (583 mm), resulting in high relative extractable water (REW) values in the first half of the growth cycle, well above the water stress threshold for food herbaceous crops, which ranges between 0.4 and 0.5 (i.a., [55,56]).
The development of the crop plants is shown in Figure 3, in terms of LAI and fresh green biomass. Both variables exhibit similar trends during the growth cycle, showing a slow increase in June, a rapid increase in July with a maximum in early August, followed by a decrease until the harvest of the watermelon fruits. The final yield of freshly harvested fruits for the market was 10.00 kg m−2.

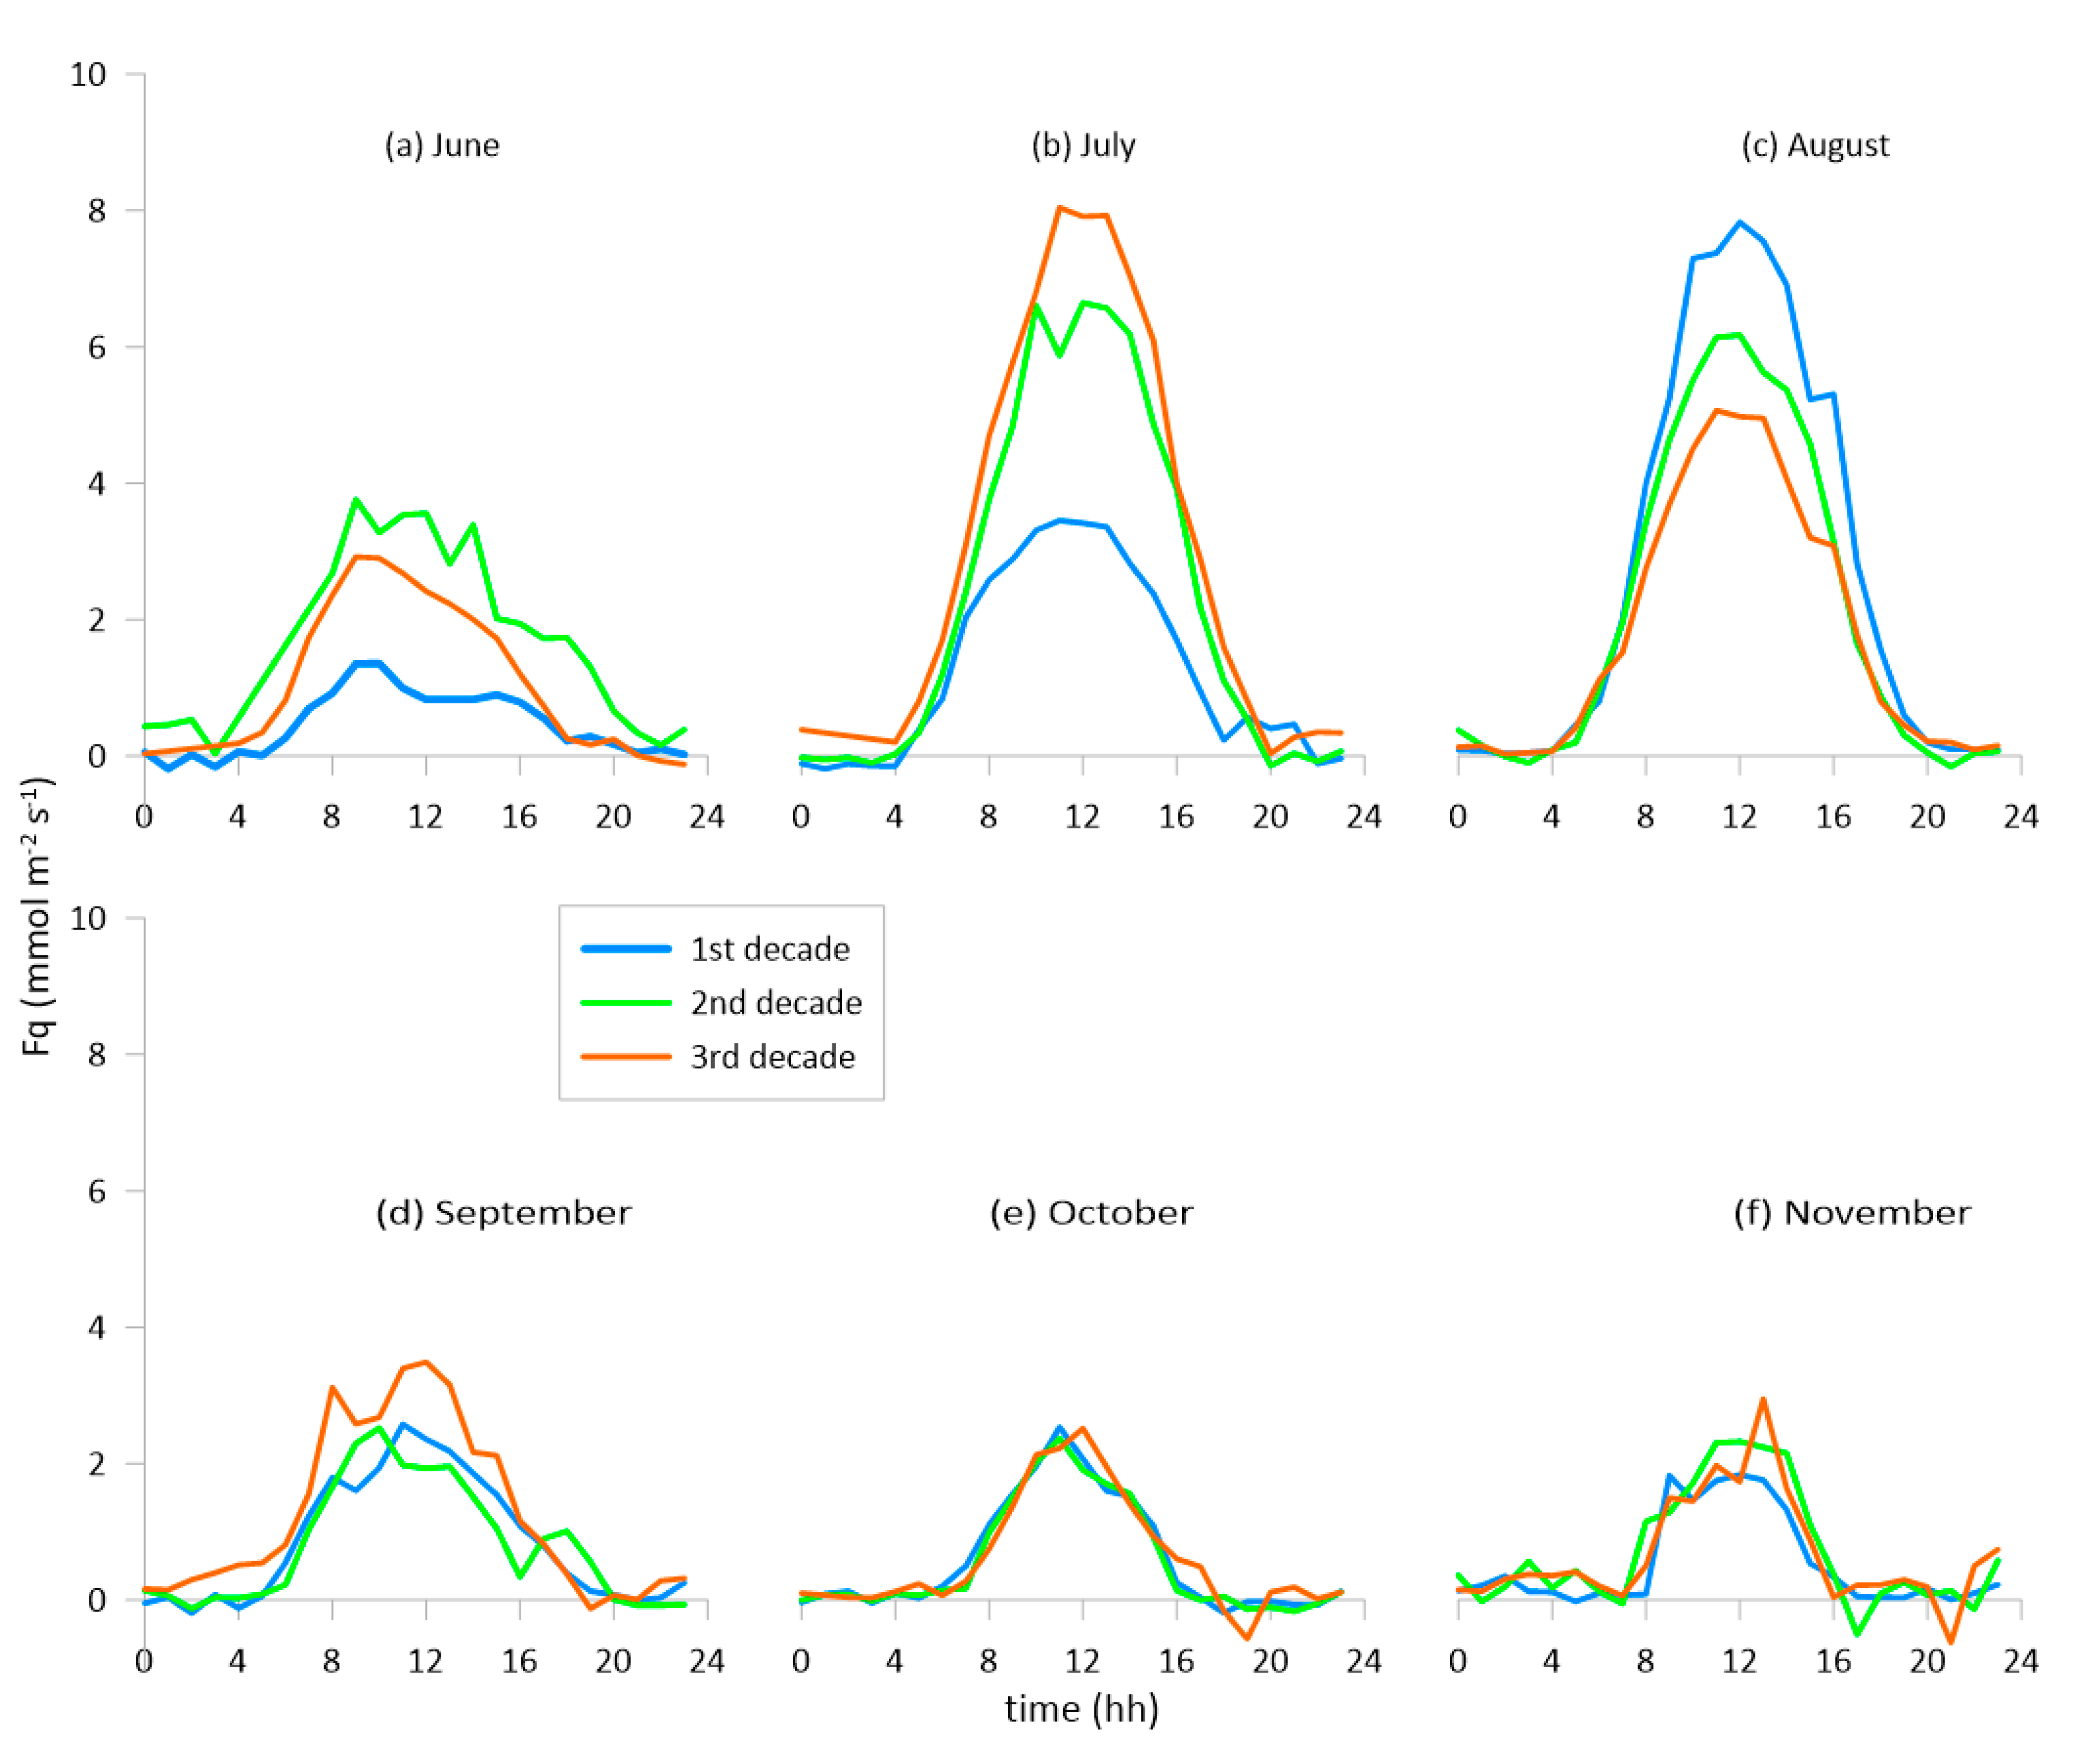
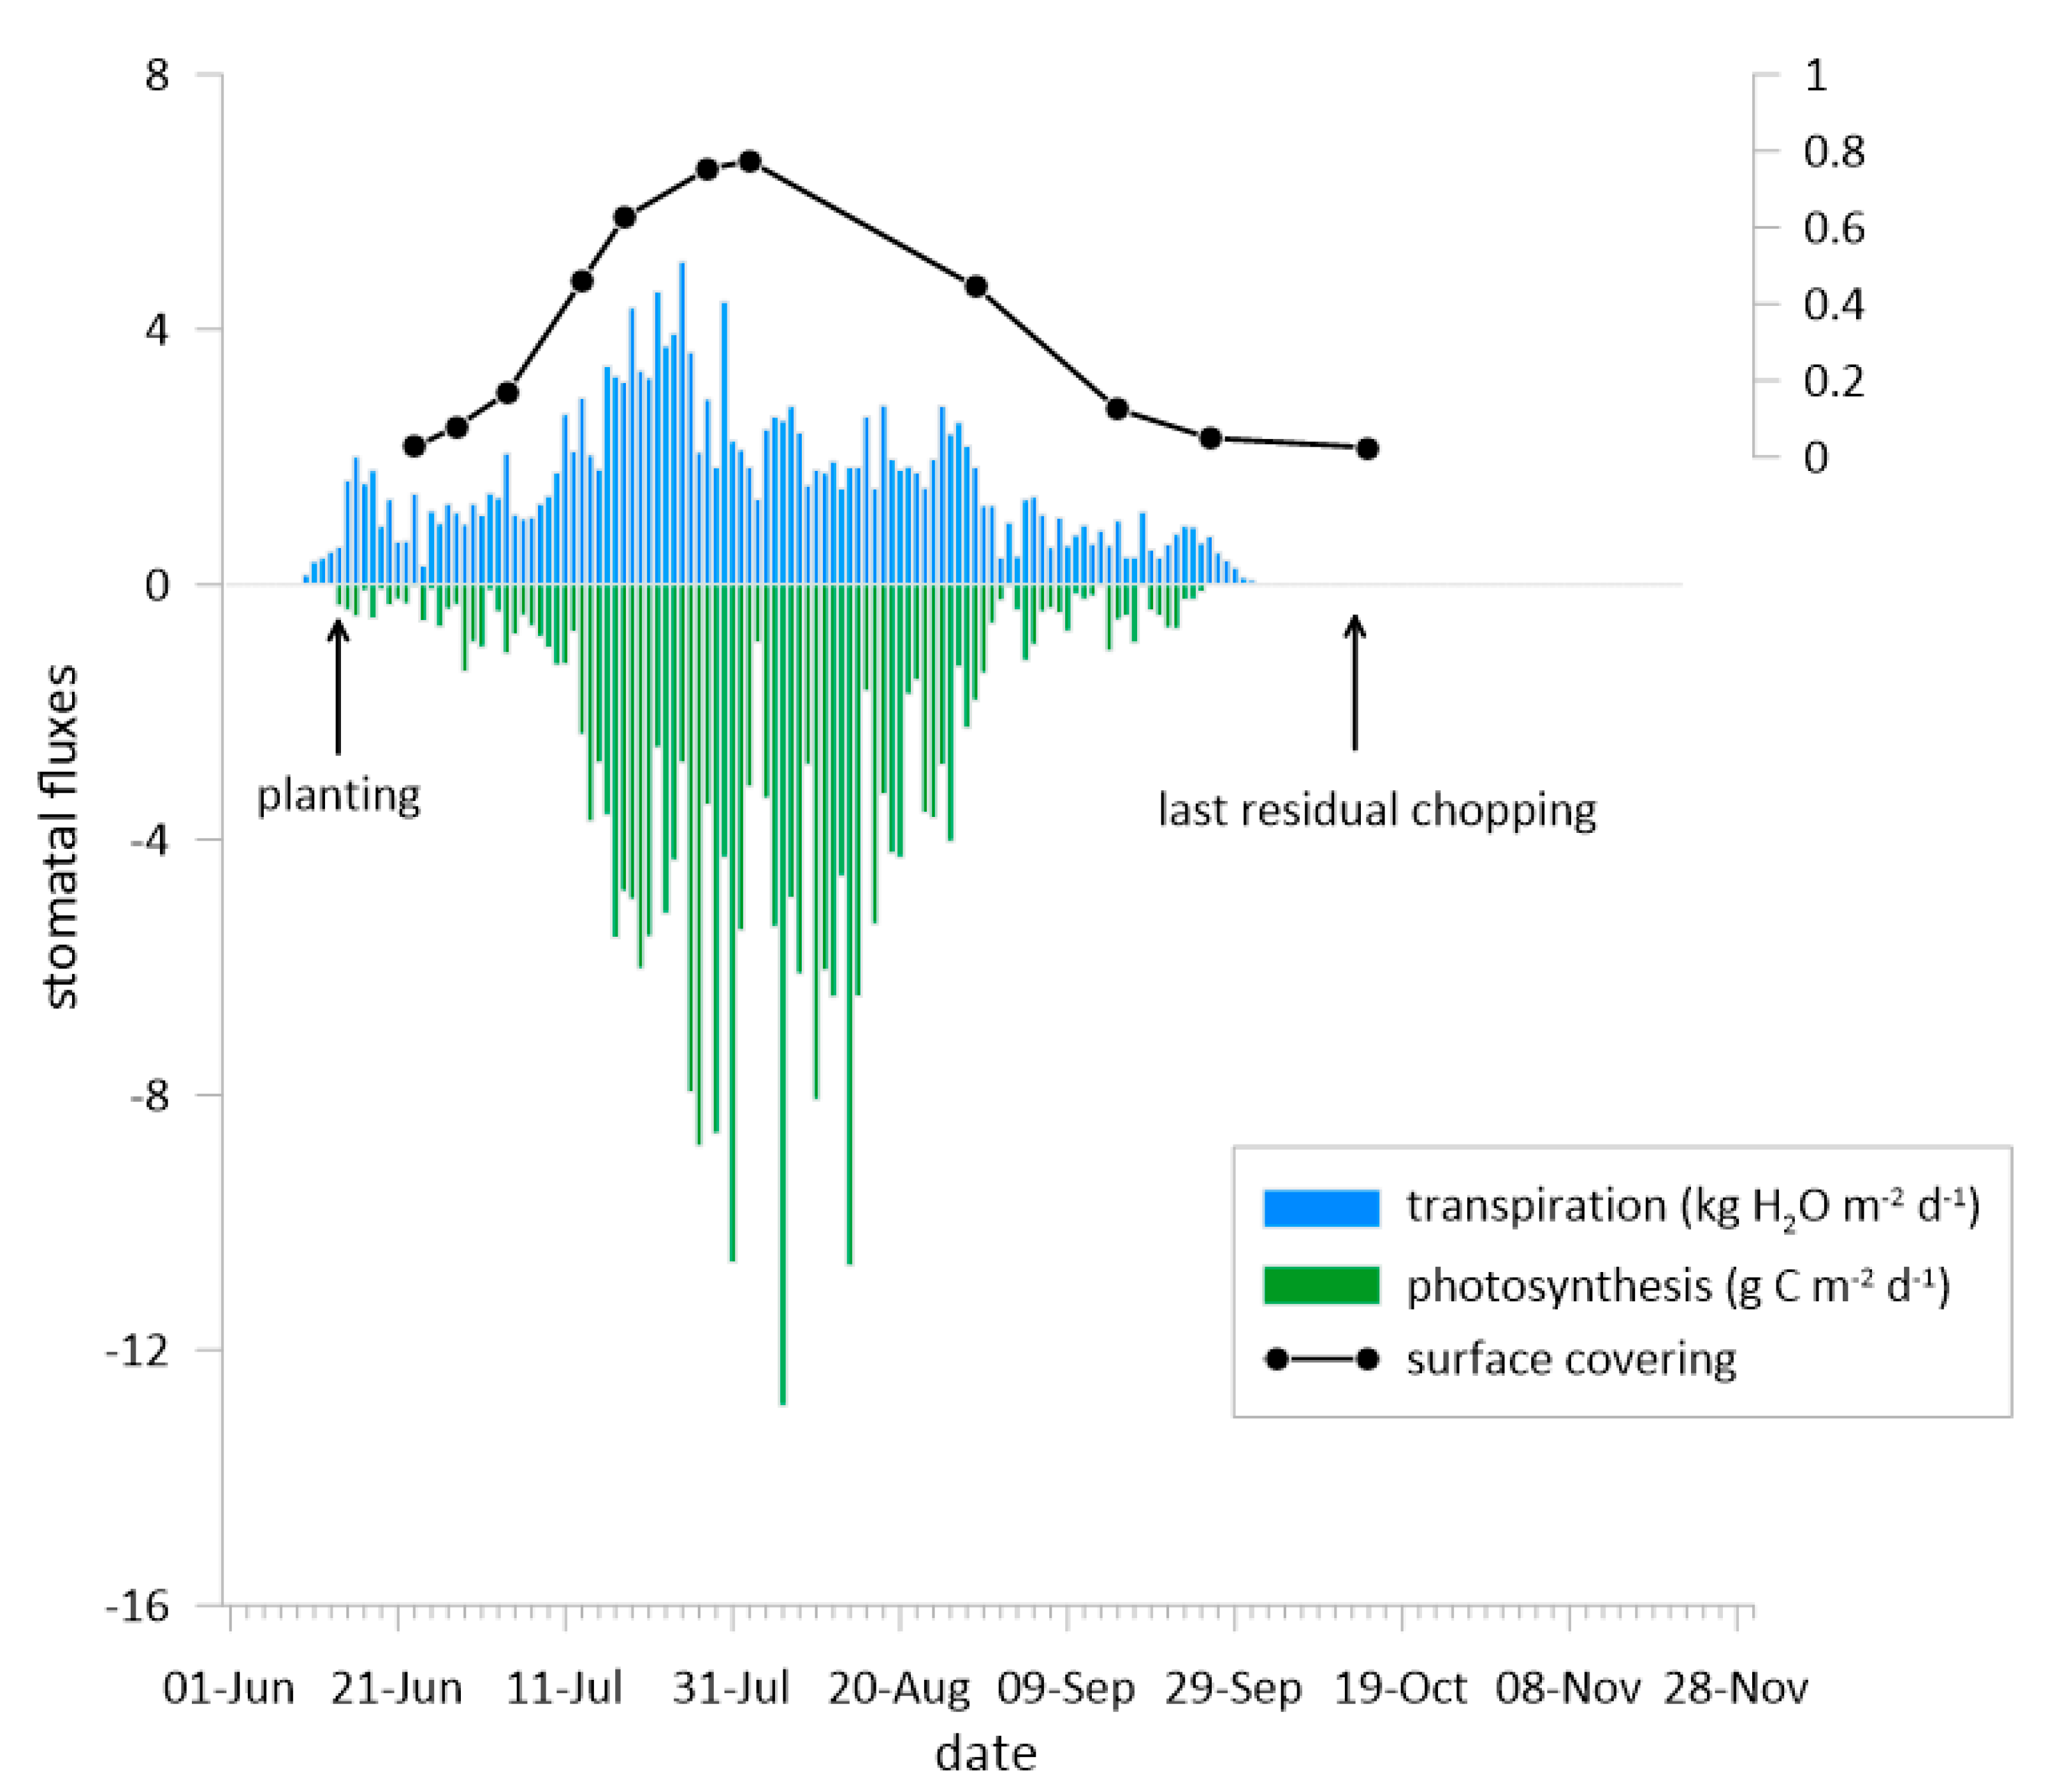
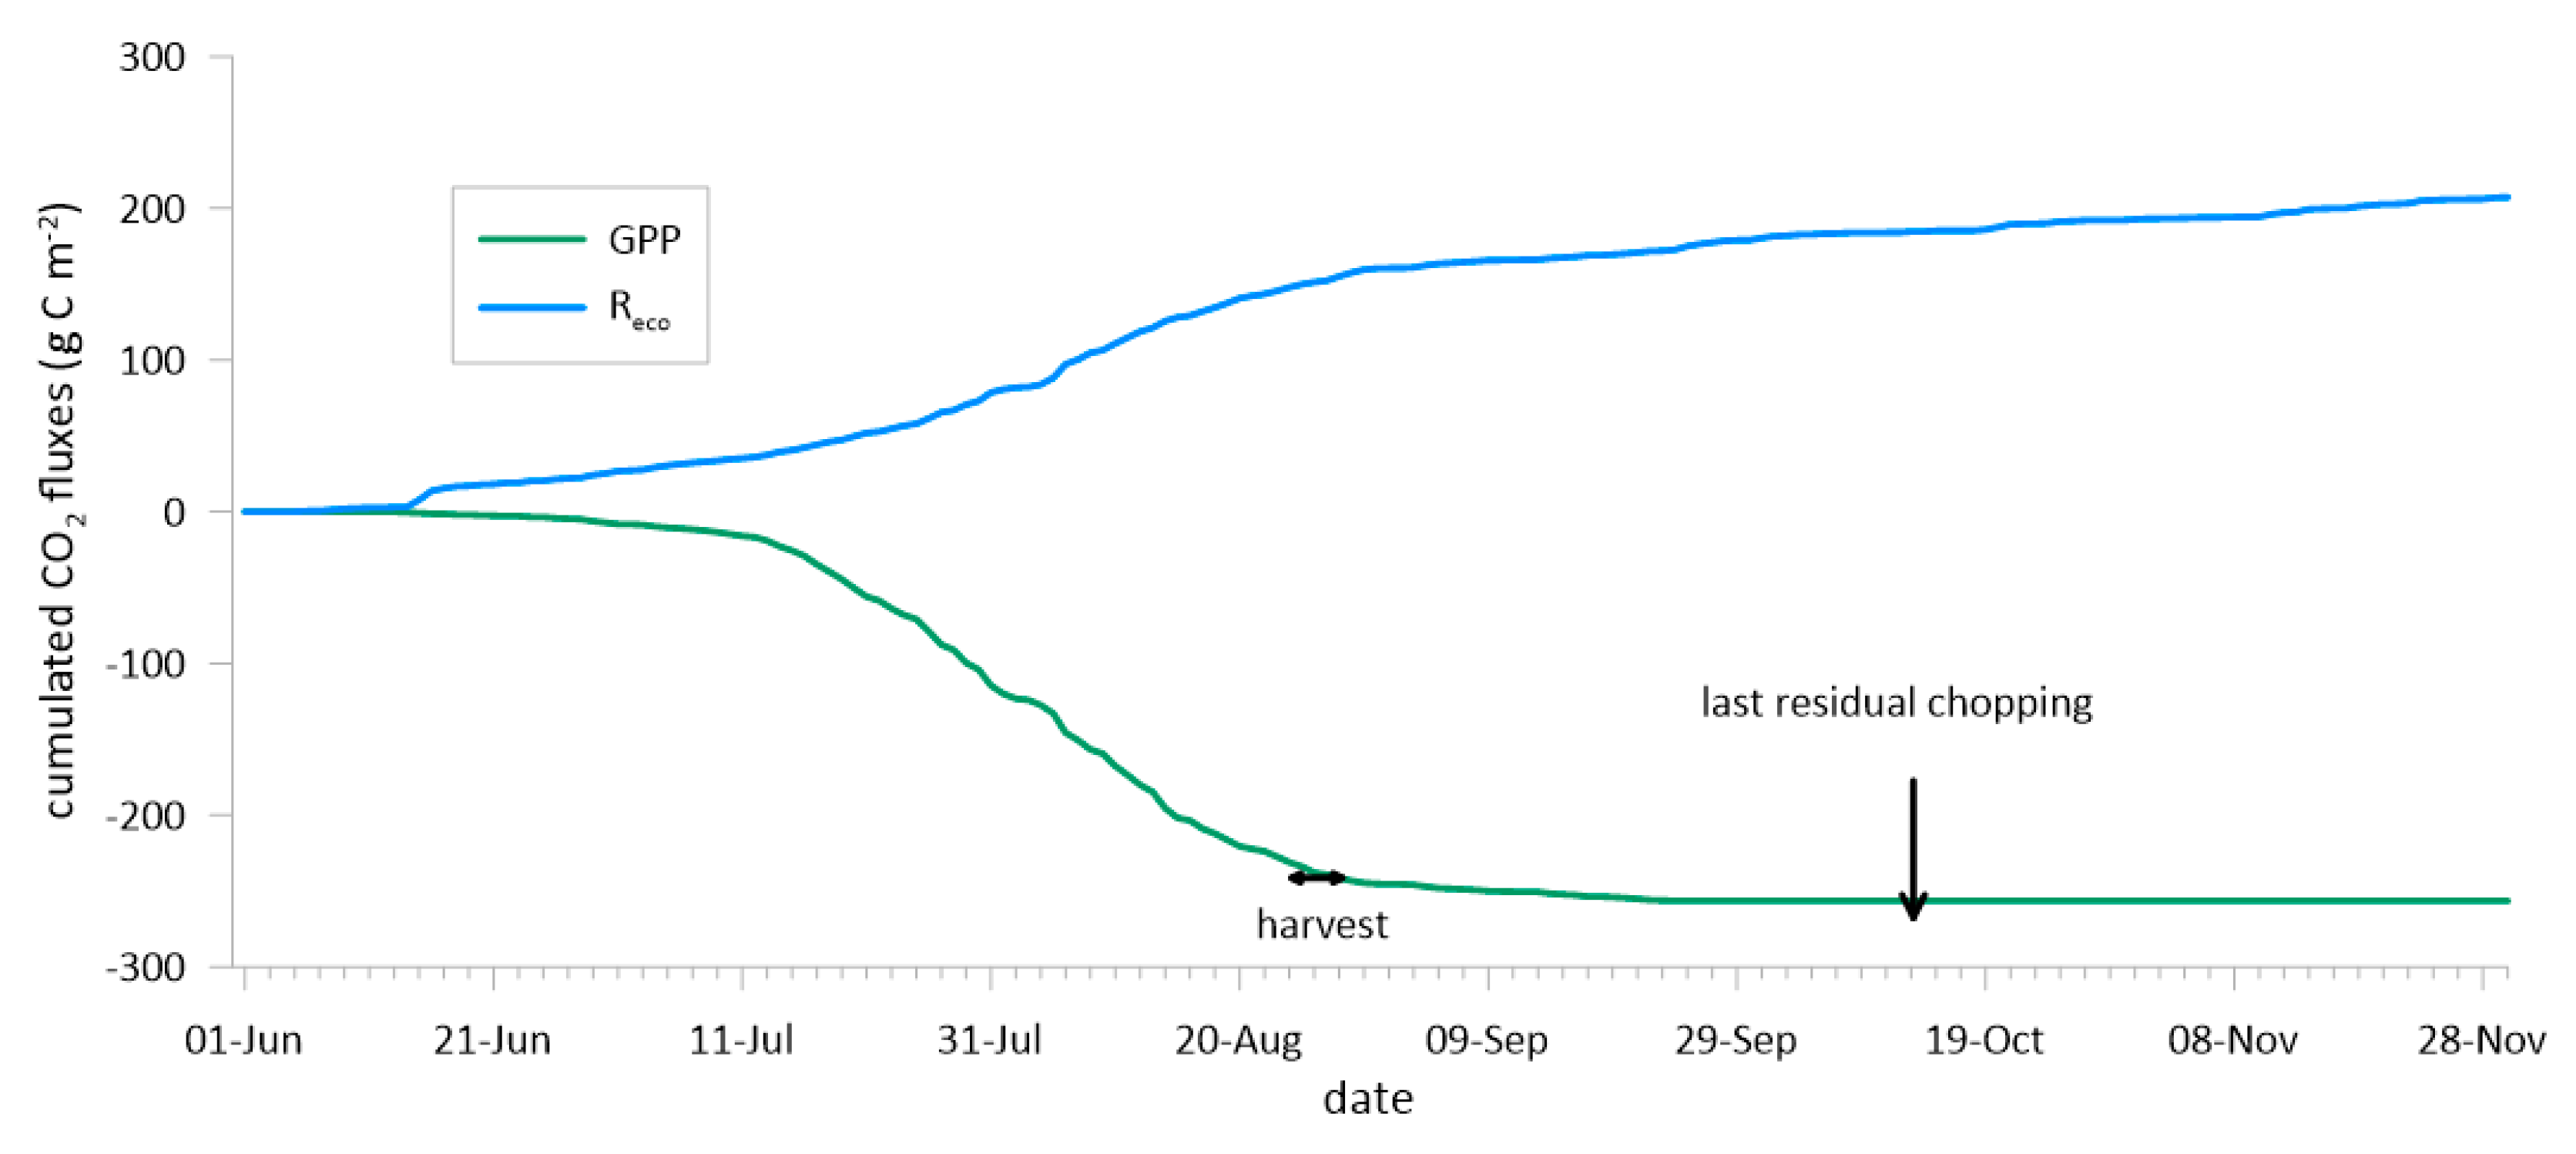
3.2. The Fluxes of CO2 and H2O

The trends of hourly EC fluxes Fc and Fq for the watermelon crop are reported in Figure 4 and Figure 5, respectively; the patterns are illustrated at a decadal scale to capture the dynamics during the entire experimental period.
During the first month after planting (June), Fc was always positive due to bare soil respiration, with values decreasing from the first to the third decade as vegetation developed, increasing LAI and FB and enhancing CO2 assimilation (Figure 3). During July and August, when the crop was fully developed, the system acted as a complete carbon sink during daytime, reaching maximum values from −15 up to −20 μmol m−2 s−1 in the third decade of July. In the third decade of August, during the scalar harvest of the fruits, the system became a weak carbon sink, gradually turning into a carbon source from September until the end of the experiment. In early November, a small CO2 assimilation likely resulted from weeds grown in the field before tillage for the successive crop. During nighttime, the system was always a very weak source of carbon.
The patterns of Fq (Figure 5), always at a decadal scale, followed the standard actual crop evapotranspiration trend throughout the experimental period. The only deviation from the standard ET trend can be seen in the third decade of September, when heavy rainfall (Figure 1) supplied water to the soil, which was available for evaporation. This feature can also be partially attributed to the inclusion of fresh chopped biomass rich in fully available water to the soil [57]. The maximum Fq values (around 8 mmol m−2 s−1) were reached in the third decade of July through the first decade of August, corresponding with the highest Fc values (see Figure 4). Furthermore, the Fq trend was very similar in the first and second decades of September, when a decrease in evaporation would have been expected in the absence of rainfall and irrigation (see Figure 1).
The partitioned fluxes of CO2 and H2O are presented at a daily scale for the entire experimental period in Figure 6 and Figure 7 for the stomatal and non-stomatal components, respectively; surface coverage is also shown in both figures.
The trends of plant transpiration and photosynthesis were naturally opposite (Figure 6), aligning perfectly with canopy development as indicated by coverage, from the beginning of the growth season until residual chopping in early October. Afterward, both transpiration and photosynthesis ceased until the end of the experiment.
The soil evaporation and respiration (Figure 7) followed the typical trend of a well-irrigated crop; however, in this case, the CO2 emissions from the soil presented quite high values a few days after harvesting of watermelon fruits and, further, after the residual chopping. This pattern was also reported for evaporation, even if with less evidence.
This increase in CO2 emissions post-harvest was likely due to biodegradation of the fresh biomass (see following C balance) from non-marketable watermelon fruits left on the soil, the incorporation of fresh plant biomass [57], and the initiation of mulching film degradation after chopping and incorporation into the soil in October, contributing a total of 2.96 g C m−2 to the soil
Furthermore, after incorporating watermelon plants at the end of September, H2O fluxes showed a clear decreasing trend (Figure 5e,f), as transpiration ceased and only evaporation from the soil-fresh biomass system was detected (Figure 7).
The overall trends of CO2 and H2O fluxes during the watermelon growing season were similar to those reported by [31,58] for fava beans cropped in the same environment under a similar fresh biomass incorporation process.
The patterns of the cumulative fluxes of assimilated and emitted CO2, expressed in Figure 8 as photosynthesis and respiration, clearly illustrated that GPP consistently increased (negatively) from planting until watermelon fruit harvest, and then plateaued in correspondence with the green residual chopping, followed by a short gentle decrease due to reduced photosynthesis activity in non-irrigated plants. Conversely, total emitted CO2 (Reco) continuously increased as the soil maintained high carbon dioxide emissions post-harvest and after incorporating the green fresh residuals and biodegradable mulching films (Figure 8). The CO2 emissions from the crop residuals left on the soil after harvesting until the end of measurements accounted for approximately 14% of the total.

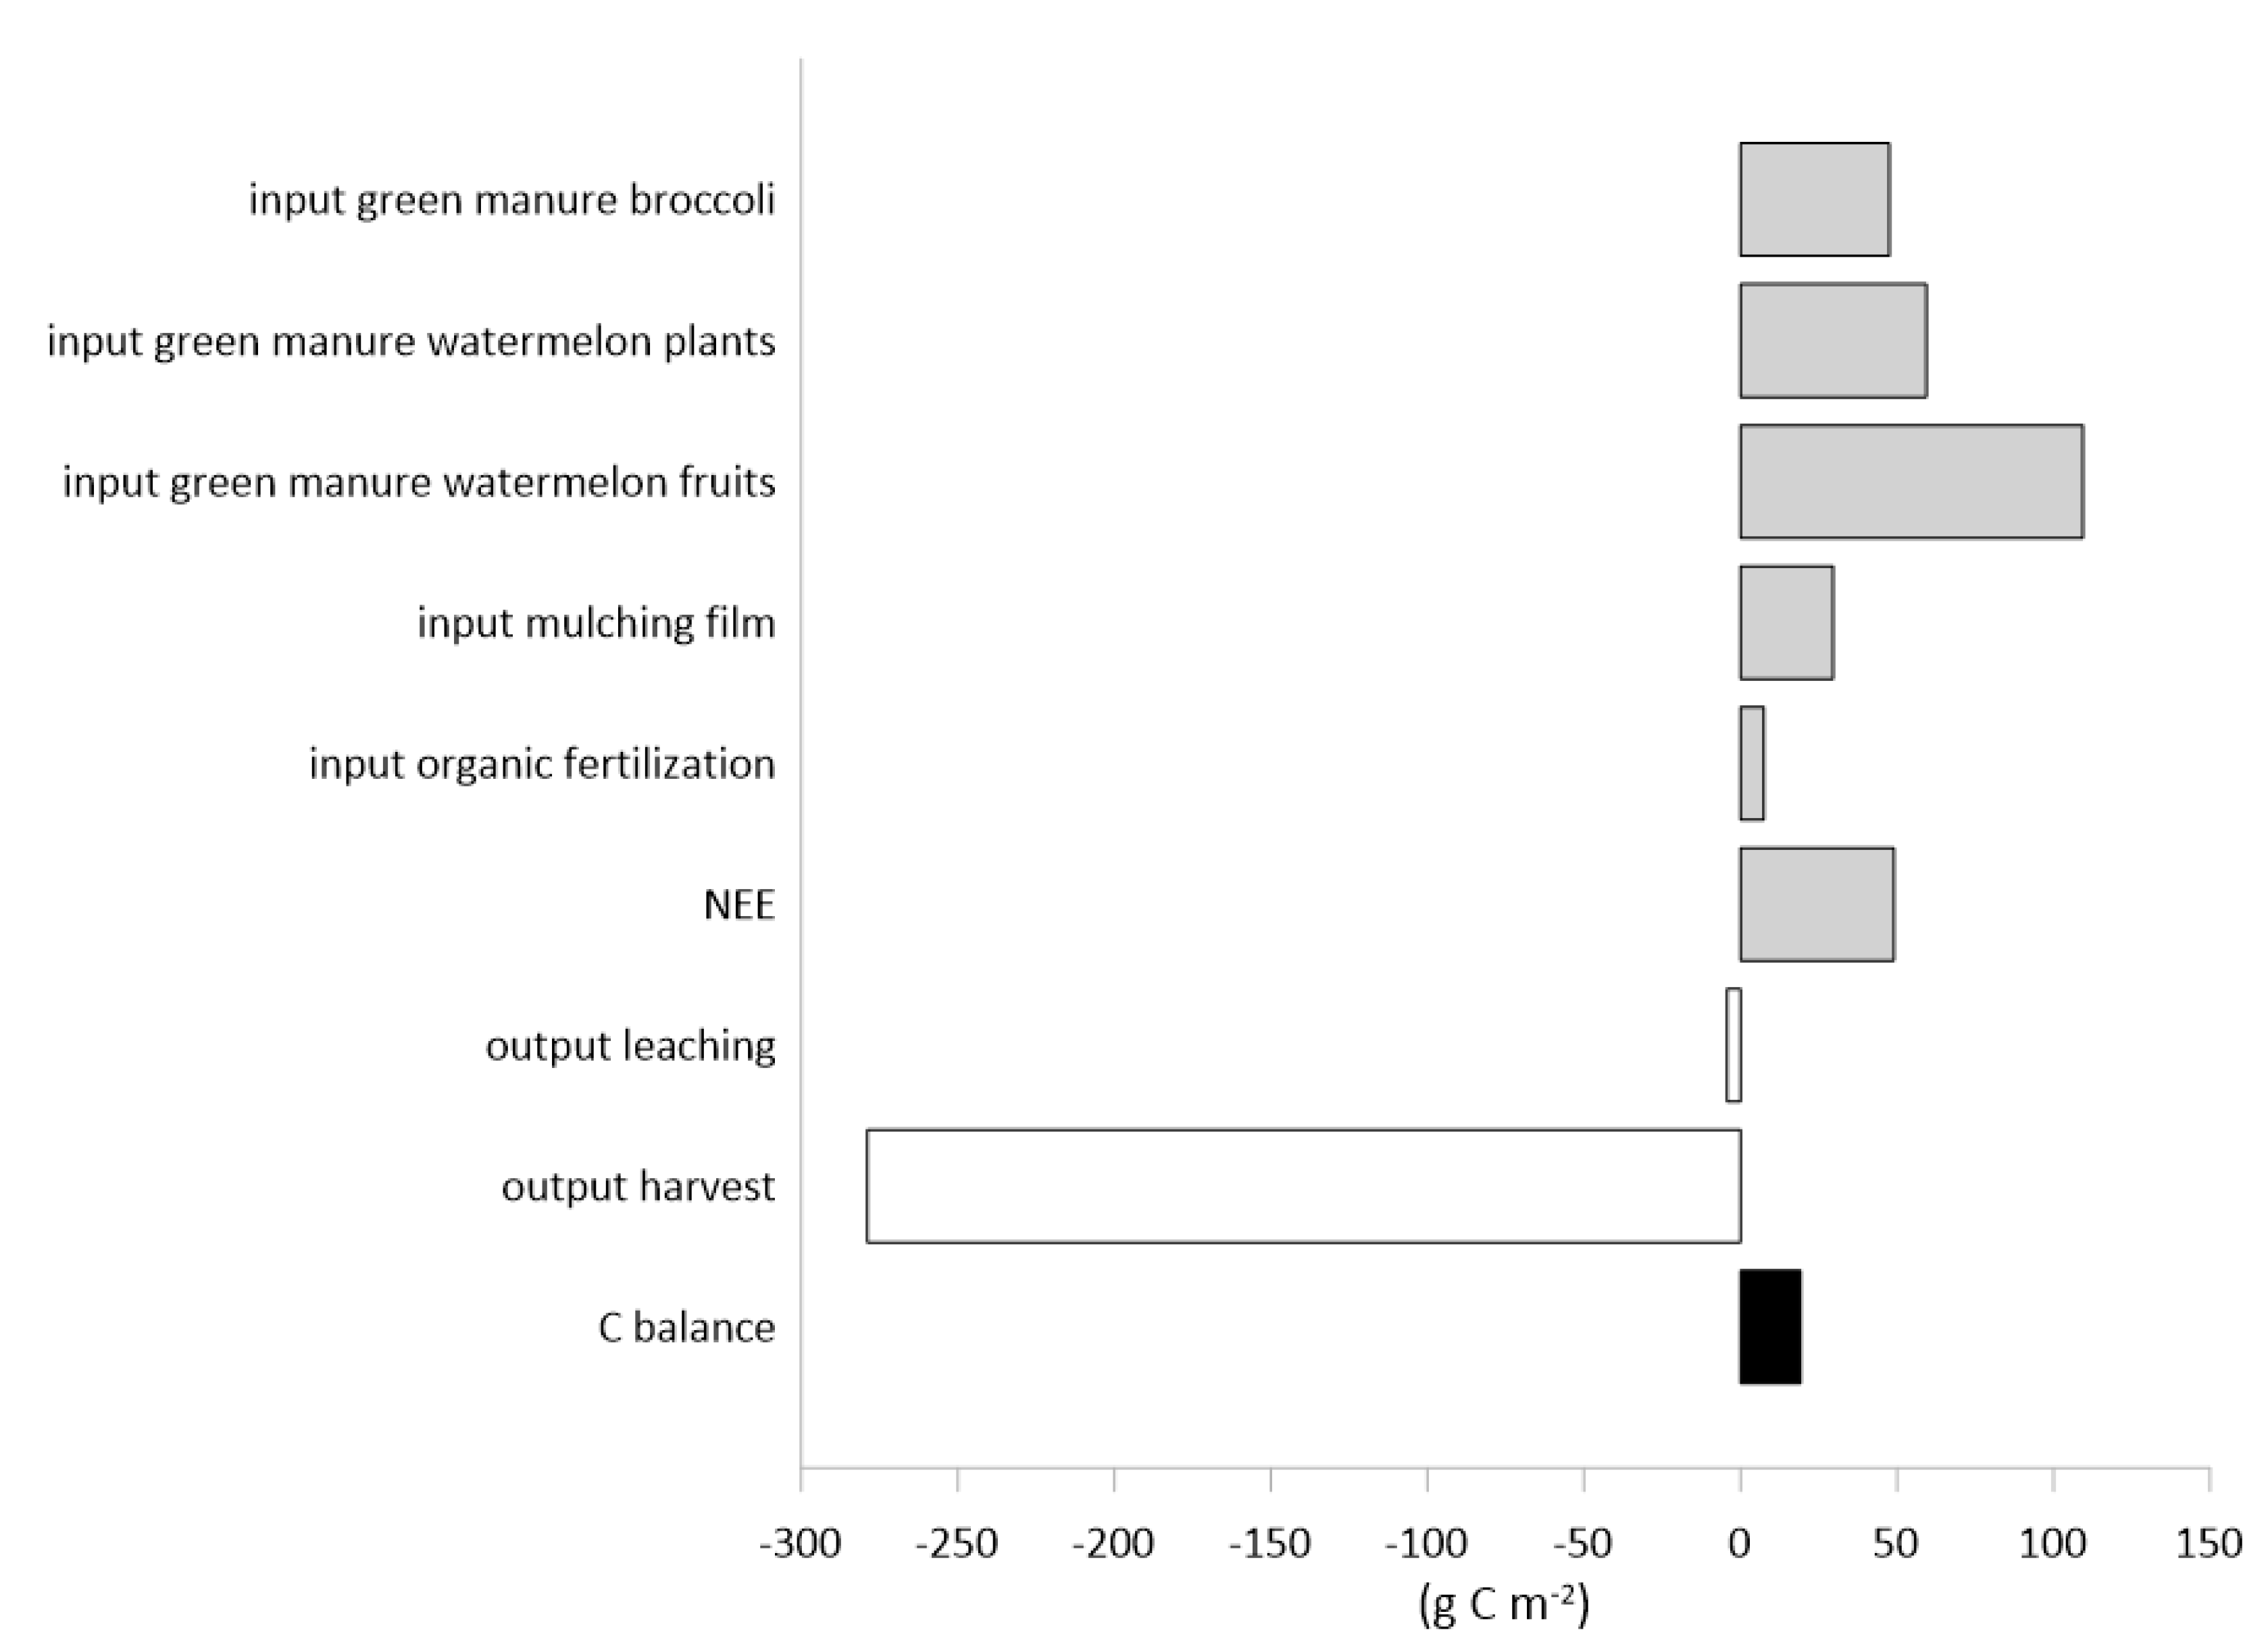
3.3. The Carbon and Water Balances and the Water Use Efficiencies

Over the entire extended watermelon cultivation period of six months, from June to November, photosynthetic CO2 uptake exceeded CO2 losses from respiration, resulting in a net C input of 49.0 g C m−2. By subtracting the C removed through harvesting (278.9 ± 70.1 g C m−2), the NBE yields a value of +229.9 g C m−2 over the experimental period, indicating that this biodegradable mulched watermelon crop, managed with organic fertilization and residual green manure, is a net carbon source.
In terms of carbon balance in the field, all terms of Equation (5) are reported in Figure 9. The largest amount of imported organic C is due to the green manure of non-marketable watermelon fruits left on the field, followed by the green manure of watermelon plants and broccoli, and the C input from NEE. The biodegradable mulching film contributes 12% to the carbon input, while organic fertilization has the lowest contribution. The substantial amount of C removed by harvest reduced the C stored in the soil to 19.3 g C m−2 over the investigated period. This finding is in accordance with results by [59,60] who reported increased carbon sustainability through conservative practices applied to horticultural water-consuming crops under Mediterranean conditions.
However, the directly measured ΔSOC from soil analysis of samples in the 0–0.30 m layer (352.2 ± 52.2 g C m−2) was much higher than the estimated C temporarily stored in the soil over the six-month experimental period (19.3 g C m−2). Conversely, this latter value is much lower than the uncertainties of the SOC measurement, being the 7% of the standard deviation of the carbon stock measured in the soil samples at the beginning of the trial (289.8 g C m−2). This result indicates the following: (i) it is extremely difficult to unambiguously establish the net C stored in the soil, as many input/output terms must be evaluated for a complete carbon balance [40,61,62]; (ii) C losses can be determined on a crop growth seasonal scale, but several years of continuous cultivations and green manure incorporation are necessary to detect a significant difference in soil carbon storage [40]; (iii) measurements of SOC are subject to great uncertainties, as indicated by large value spreads around the mean [63], likely linked to the spatial variability [64,65] and short-term time processes at the atmosphere-pedosphere interface [66], often making single point measurements ambiguous.
The water balance on an extended seasonal scale showed that the cumulative inputs were: precipitation, 139 mm; irrigation, 583 mm; and 5 mm of water supplied by the green manure of fresh materials (broccoli, watermelon plants and non-harvested fruits). Conversely, the outputs of evaporation and transpiration were 178 and 186 mm, respectively. These amounts, added to the water stored in the soil (272 mm), resulted in a significant amount of water lost through deep percolation (91 mm). This quantity represents 16% of the water supplied by irrigation. Similar values of deep percolation water losses were found by [67] in watermelon cultivation under a Mediterranean climate, whereas [68] found higher values of deep percolation in semi-arid continental conditions.
From the above-reported values of total gross primary production, net ecosystem exchange, and water terms, along with the marketable yield, it is possible to calculate all defined water use efficiencies. In the present case, we found WUEph = −1.38 g C kg H2O−1, WUEph = −0.70 g C kgH2O−1, WUEenv = −0.14 g C kg H2O−1. Any comparison with published values of eco-physiological water use efficiencies is challenging because they have not been previously published for the watermelon crop. However, the watermelon WUEph, in absolute value, is lower than the values reported by [39] for biomass food and non-food crops.
Regarding agronomic water productivity indicators, a comparison of our results with other values published in peer-reviewed papers (Table 1) shows that our biodegradable mulched watermelon has WUEagr values comparable to those found in plastic-mulched cultivations under semi-arid and arid climates. Concerning the WUEirr, our value is lower than those found for watermelon cropped under similar Mediterranean climates.

4. Conclusions

In terms of C balance, despite a NEE of −49 g C m−2, the watermelon cropping system became a net C source primarily due to substantial C removal through harvested fruits resulting in an NBE of 229.9 g C m−2. The considerable amount of fresh biomass left in the field (broccoli, watermelon plants, and non-harvested fruits) contributed 85% of the organic C input. This, in conjunction with the biodegradable mulching film, allows the addition of C in the soil, although only a small percentage of the directly measured C stock could be explained by the C balance terms.
The results indicated that the mulching technique maintained soil and plants in optimal water conditions. However, the fixed irrigation schedule only partially matched the actual evapotranspiration needs, leading to water inefficiencies. Consequently, the water lost through deep percolation represents about one-sixth of the supplied water, which also has implications for carbon leaching. The water applied through the green manure of fresh biomass left in the field accounted for less than 1% of the total water supply.
Finally, these results show that the biodegradable mulched watermelon crop, when fully irrigated under Mediterranean conditions, exhibits limited sustainability from both carbon and water perspectives. Further research is needed to enhance the ecosystem impacts and sustainability of this practice. Despite the noted general improvement in WUE whit the use of biodegradable mulching films, information on carbon and water balances in such scenarios is scarce, especially in terms of the effects of film left on the soil surface and their time of decomposition.

Author Contributions

Conceptualization, G.R. and R.M.F.; methodology, G.R. and R.M.F.; software, A.M.; formal analysis, G.R., S.R., G.D.C. and R.M.F.; investigation, R.M.F., A.A., A.C., G.D.C., M.M., V.M., M.P., S.R., C.V. and N.M.; resources, G.R.; data curation, G.R. and R.M.F.; writing—original draft preparation, G.R.; writing—review and editing, G.R., R.M.F. and A.A.; supervision, G.R.; funding acquisition, G.R. All authors have read and agreed to the published version of the manuscript.

Funding

This research was funded by the Italian Ministry of Agricultural, Food and Forestry Policies (MIPAAF), AgriDigit-Agromodelli project (DM n. 36502 of 20/12/2018).

Institutional Review Board Statement

Not applicable.

Informed Consent Statement

Not applicable.

Data Availability Statement

The data presented in this study are available on request from the corresponding author. The data are not publicly available due to project privacy restrictions

Conflicts of Interest

The authors declare no conflicts of interest.

References

  1. Food and Agriculture Organization of the United Nations (FAO). FAOSTAT Website. Available online: http://www.fao.org/faostat/en/#data/QC (accessed on 5 November 2023).
  2. Yavuz, D.; Seymen, M.; Suheri, S.; Yavuz, N.; Türkmen, Ö.; Kurtar, E.S. How do rootstocks of citron watermelon (Citrullus lanatus var. citroides) affect the yield and quality of watermelon under deficit irrigation? Agric. Water Manag. 2020, 241, 106351. [Google Scholar] [CrossRef]
  3. Cozzolino, E.; Di Mola, I.; Ottaiano, L.; Bilotto, M.; Petriccione, M.; Ferrara, E.; Mori, M.; Morra, L. Assessing Yield and Quality of Melon (Cucumis melo L.) Improved by Biodegradable Mulching Film. Plants 2023, 12, 219. [Google Scholar] [CrossRef] [PubMed]
  4. Rana, G.; Katerji, N. Measurement and estimation of actual evapotranspiration in the field under Mediterranean climate: A review. Eur. J. Agron. 2000, 13, 125–153. [Google Scholar] [CrossRef]
  5. Abdelkhalik, A.; Pascual-Seva, N.; Nájera, I.; Giner, A.; Baixaul, C.; Pascual, B. Yield response of seedless watermelon to different drip irrigation strategies under Mediterranean conditions. Agric. Water Manag. 2019, 212, 99–110. [Google Scholar] [CrossRef]
  6. Leskovar, D.; Othman, Y.; Dong, X. Strip tillage improves soil biological activity, fruit yield and sugar content of triploid watermelon. Soil Tillage Res. 2016, 163, 266–273. [Google Scholar] [CrossRef]
  7. Zribi, W.; Aragüés, R.; Medina, E.; Faci, J.M. Efficiency of inorganic and organic mulching materials for soil evaporation control. Soil Tillage Res. 2015, 148, 40–45. [Google Scholar] [CrossRef]
  8. Zhang, W.; Dong, A.; Liu, F.; Niu, W.; Siddique, K.H.M. Effect of film mulching on crop yield and water use efficiency in drip irrigation systems: A meta-analysis. Soil Tillage Res. 2022, 221, 105392. [Google Scholar] [CrossRef]
  9. Mudare, S.; Li, M.; Kanomanyanga, J.; Lamichhane, J.R.; Lakshmanan, P.; Cong, W.-F. Ecosystem services of organic versus inorganic ground cover in peach orchards: A meta-analysis. Food Energy Secur. 2023, 12, e463. [Google Scholar] [CrossRef]
  10. Gao, H.; Liu, Q.; Yan, C.; Wu, Q.; Gong, D.; He, W.; Liu, H.; Wang, J.; Mei, X. Mitigation of greenhouse gas emissions and improved yield by plastic mulching in rice production. Sci. Total Environ. 2023, 880, 162984. [Google Scholar] [CrossRef]
  11. Li, X.; Liu, L.; Yang, H.; Li, Y. Relationships between carbon fluxes and environmental factors in a drip-irrigated, film- mulched cotton field in arid region. PLoS ONE 2018, 13, e0192467. [Google Scholar] [CrossRef]
  12. Gong, D.; Hao, W.; Mei, X.; Gao, X.; Liu, Q.; Caylor, K. Warmer and Wetter Soil Stimulates Assimilation More than Respiration in Rainfed Agricultural Ecosystem on the China Loess Plateau: The Role of Partial Plastic Film Mulching Tillage. PLoS ONE 2015, 10, e0136578. [Google Scholar] [CrossRef] [PubMed]
  13. Qian, R.; Guo, R.; Liu, Y.; Naseer, M.A.; Hussain, S.; Liu, D.; Zhang, P.; Chen, X.; Ren, X. Biodegradable film mulching combined with straw incorporation can significantly reduce global warming potential with higher spring maize yield. Agric. Ecosyst. Environ. 2022, 340, 108181. [Google Scholar] [CrossRef]
  14. Yu, Y.; Zhang, X.; Xiao, M.; Zhao, C.; Yao, H. A meta-analysis of film mulching cultivation effects on soil organic carbon and soil greenhouse gas fluxes. Catena 2021, 206, 105483. [Google Scholar] [CrossRef]
  15. Ming, G.; Hu, H.; Tian, F.; Khan, M.Y.A.; Zhang, Q. Carbon budget for a plastic-film mulched and drip-irrigated cotton field in an oasis of Northwest China. Catena 2021, 206, 105483. [Google Scholar] [CrossRef]
  16. Xiong, L.; Liang, C.; Ma, B.; Shah, F.; Wu, W. Carbon footprint and yield performance assessment under plastic film mulching for winter wheat production. J. Clean. Prod. 2020, 270, 122468. [Google Scholar] [CrossRef]
  17. Wang, Y.; Li, X.; Fu, T.; Wang, L.; Turner, N.C.; Siddique, K.H.M.; Li, F. Multi-site assessment of the effects of plastic-film mulch on the soil organic carbon balance in semiarid areas of China. Agric. For. Meteorol. 2016, 228, 42–51. [Google Scholar] [CrossRef]
  18. Zhang, F.; Zhang, W.; Li, M.; Yang, Y.; Li, F.-M. Does long-term plastic film mulching really decrease sequestration of organic carbon in soil in the Loess Plateau? Eur. J. Agron. 2017, 89, 53–60. [Google Scholar] [CrossRef]
  19. Wang, J.; Fu, X.; Zhao, F.; Sainju, U.M. Response of soil carbon fractions and dryland maize yield to mulching. Soil Sci. Soc. Am. J. 2018, 82, 371–381. [Google Scholar] [CrossRef]
  20. Yin, M.; Li, Y.; Fang, H.; Chen, P. Biodegradable mulching film with an optimum degradation rate improves soil environment and enhances maize growth. Agric. Water Manag. 2019, 216, 127–137. [Google Scholar] [CrossRef]
  21. Birkhofer, K.; Diehl, E.; Andersson, J.; Ekroos, J.; Früh-Müller, A.; Machnikowski, F.; Mader, V.L.; Nilsson, L.; Sasaki, K.; Rundlöf, M.; et al. Ecosystem services—Current challenges and opportunities for ecological research. Front. Ecol. Evol. 2015, 2, 87. [Google Scholar] [CrossRef]
  22. Gonzalez-Sanchez, C.; Martinez-Aguirre, A.; Perez-Garcia, B.; Martinez-Urreaga, J.; de la Orden, M.U.; Fonseca-Velero, C. Use of residual agricultural plastics and cellulose fibers for obtaining sustainable eco-composites prevents waste generation. J. Clean. Prod. 2014, 83, 228–237. [Google Scholar] [CrossRef]
  23. Steinmetz, Z.; Wollmann, C.; Schaefer, M.; Buchmann, C.; David, J.; Tröger, J.; Munoz, K.; Frör, O.; Schaumann, G.E. Plastic mulching in agriculture. Trading short-term agronomic benefits for long-term soil degradation? Sci. Total Environ. 2016, 550, 690–705. [Google Scholar] [CrossRef] [PubMed]
  24. Sintim, H.Y.; Bary, A.I.; Hayes, D.G.; Wadsworth, L.C.; Anunciado, M.B.; English, M.E.; Bandopadhyay, S.; Schaeffer, S.M.; DeBruyn, J.M.; Miles, C.A.; et al. In situ degradation of biodegradable plastic mulch films in compost and agricultural soils. Sci. Total Environ. 2020, 727, 138668. [Google Scholar] [CrossRef] [PubMed]
  25. Gu, X.; Cai, H.; Fang, H.; Li, Y.; Chen, P.; Li, Y. Effects of degradable film mulching on crop yield and water use efficiency in China: A meta-analysis. Soil Tillage Res. 2020, 202, 104676. [Google Scholar] [CrossRef]
  26. Lee, X.; Massman, W.; Law, B.E. Handbook of micrometeorology: A guide for surface flux measurement and analysis. In Atmospheric and Oceanographic Sciences Library; Springer: Dordrecht, The Netherlands, 2004. [Google Scholar]
  27. Reichstein, M.; Falge, E.; Baldocchi, D.; Papale, D. On the separation of net ecosystem exchange into assimilation and ecosystem respiration: Review and improved algorithm. Glob. Change Biol. 2005, 11, 1424–1439. [Google Scholar] [CrossRef]
  28. Papale, D.; Reichstein, M.; Aubinet, M.; Canfora, E.; Bernhofer, C.; Kutsch, W.; Longdoz, B.; Rambal, S.; Valentini, R.; Vesala, T.; et al. Towards a standardized processing of net ecosystem exchange measured with eddy covariance technique: Algorithms and uncertainty estimation. Biogeosciences 2006, 3, 571–583. [Google Scholar] [CrossRef]
  29. Scanlon, T.M.; Sahu, P. On the correlation structure of water vapor and carbon dioxide in the atmospheric surface layer: A basis for flux partitioning. Water Resour. Res. 2008, 44, W10418. [Google Scholar] [CrossRef]
  30. Scanlon, T.M.; Kustas, W.P. Partitioning carbon dioxide and water vapor fluxes using correlation analysis. Agric. For. Meteorol. 2010, 150, 89–99. [Google Scholar] [CrossRef]
  31. Rana, G.; Palatella, L.; Scanlon, T.M.; Martinelli, N.; Ferrara, R.M. CO2 and H2O flux partitioning in a Mediterranean cropping system. Agric. For. Meteorol. 2018, 260–261, 118–130. [Google Scholar] [CrossRef]
  32. Vickers, D.; Mahrt, L. Quality Control and Flux Sampling Problems for Tower and Aircraft Data. J. Atmos. Ocean. Technol. 1997, 14, 515–526. [Google Scholar] [CrossRef]
  33. Webb, E.K.; Pearman, G.; Leuning, R. Correction of flux measurements fordensity effects due to heat and water vapour transfer. Q. J. R. Meteorol. Soc. 1980, 106, 85–100. [Google Scholar] [CrossRef]
  34. Campi, P.; Mastrorilli, M.; Stellacci, A.M.; Modugno, F.; Palumbo, A.D. Increasing the effective use of water in green asparagus through deficit irrigation strategies. Agric. Water Manag. 2019, 217, 119–130. [Google Scholar] [CrossRef]
  35. Searles, P.S.; Saravia, D.A.; Rousseaux, M.C. Root length density and soil water distribution in drip irrigated olive orchards in Argentina under arid conditions. Crop Pasture Sci. 2009, 60, 280–288. [Google Scholar] [CrossRef]
  36. Autovino, D.; Rallo, G.; Provenzano, G. Predicting soil and plant water status dynamic in olive orchards under different irrigation systems with Hydrus-2D: Model performance and scenario analysis. Agric. Water Manag. 2018, 203, 225–235. [Google Scholar] [CrossRef]
  37. Granier, A. Evaluation of transpiration in a Douglas-fir stand by means of sap flow measurements. Tree Physiol. 1987, 3, 309–320. [Google Scholar] [CrossRef] [PubMed]
  38. Chapin, F.; Woodwell, G.; Randerson, J.; Rastetter, E.; Lovett, G.; Baldocchi, D.; Clark, D.; Harmon, M.; Schimel, D.; Valentini, R.; et al. Reconciling carbon-cycle concepts, terminology, and methods. Ecosystems 2006, 9, 1041–1050. [Google Scholar] [CrossRef]
  39. Rana, G.; Ferrara, R.M.; Vitale, D.; D’Andrea, L.; Palumbo, A.D. Carbon assimilation and water use efficiency of a perennial bioenergy crop (Cynara cardunculus L.) in Mediterranean environment. Agric. For. Meteorol. 2016, 217, 137–150. [Google Scholar] [CrossRef]
  40. Loubet, B.; Laville, P.; Lehuger, S.; Larmanou, E.; Fléchard, C.; Mascher, N.; Genermont, S.; Roche, R.; Ferrara, R.M.; Stella, P.; et al. Carbon, nitrogen and Greenhouse gases budgets over a four years crop rotation in northern France. Plant Soil 2011, 343, 109–137. [Google Scholar] [CrossRef]
  41. Miller, G.; Khalilian, H.; Adelberg, J.W.; Farahani, H.J.; Hassell, R.L.; Wells, C.E. Grafted Watermelon Root Length Density and Distribution under Different Soil Moisture Treatments. HortScience 2013, 48, 1021–1026. [Google Scholar] [CrossRef]
  42. Vitti, C.; Stellacci, A.M.; Leogrande, R.; Mastrangelo, M.; Cazzato, E.; Ventrella, D. Assessment of organic carbon in soils: A comparison between the Springer–Klee wet digestion and the dry combustion methods in Mediterranean soils (Southern Italy). Catena 2016, 137, 113–119. [Google Scholar] [CrossRef]
  43. Herbrich, M.; Gerke, H.H.; Bens, O.; Sommer, M. Water balance and leaching of dissolved organic and inorganic carbon of eroded Luvisols using high precision weighing lysimeters. Soil Tillage Res. 2017, 165, 144–160. [Google Scholar] [CrossRef]
  44. Ferrara, R.M.; Campi, P.; Muschitiello, C.; Leogrande, R.; Vonella, A.V.; Ventrella, D.; Rana, G. Soil respiration during three cropping cycles of durum wheat under different tillage conditions in a Mediterranean environment. Soil Use Manag. 2022, 38, 1547–1563. [Google Scholar] [CrossRef]
  45. Rana, G.; Katerji, N. A Measurement Based Sensitivity Analysis of the Penman-Monteith actual evapotranspiration model for crops of different height and in contrasting water status. Theor. Appl. Climatol. 1998, 60, 141–149. [Google Scholar] [CrossRef]
  46. Palatella, L.; Rana, G.; Vitale, D. Toward a flux-partitioning procedure based on the direct use of high-frequency eddy-covariance data. Bound. Layer Meteorol. 2014, 153, 327–337. [Google Scholar] [CrossRef]
  47. Skaggs, T.H.; Anderson, R.G.; Alfieri, J.G.; Scanlon, T.M.; Kustas, W.P. Fluxpart: Open-source software for partitioning carbon dioxide and water vapor fluxes. Agric. For. Meteorol. 2018, 253–254, 218–224. [Google Scholar] [CrossRef]
  48. Katerji, N.; Mastrorilli, M.; Rana, G. Water use efficiency of crops cultivated in Mediterranean region: Review and analysis. Eur. J. Agron. 2008, 28, 493–507. [Google Scholar] [CrossRef]
  49. Fernández, J.-E.; Alcon, F.; Diaz-Espejo, A.; Hernandez-Santana, V.; Cuevas, M.V. Water use indicators and economic analysis for on farm irrigation decision: A case study of a super high density olive tree orchard. Agric. Water Manag. 2020, 237, 106074. [Google Scholar] [CrossRef]
  50. Ferrara, R.M.; Bruno, M.R.; Campi, P.; Camposeo, S.; De Carolis, G.; Gaeta, L.; Martinelli, N.; Mastrorilli, M.; Modugno, A.F.; Mongelli, T.; et al. Water use of a super high-density olive orchard submitted to regulated deficit irrigation in Mediterranean environment over three contrasted years. Irrig. Sci. 2024, 42, 57–73. [Google Scholar] [CrossRef]
  51. Beer, C.; Ciais, P.; Reichstein, M.; Baldocchi, D.; Law, B.E.; Papale, D.; Soussana, J.F.; Ammann, C.; Buchmann, N.; Frank, D.; et al. Temporal and among-site variability of inherent water use efficiency at the ecosystem level. Glob. Biogeochem. Cycles 2009, 23, GB2018. [Google Scholar] [CrossRef]
  52. Tian, H.; Chen, G.; Liu, M.; Zhang, C.; Sun, G.; Lu, C.; Xu, X.; Ren, W.; Pan, S.; Chappelka, A. Model estimates of net primary productivity, evapotranspiration, andwater use efficiency in the terrestrial ecosystems of the southern United Statesduring 1895–2007. For. Ecol. Manag. 2010, 259, 1311–1327. [Google Scholar] [CrossRef]
  53. Cabral, O.M.R.; Rocha, H.R.; Gash, J.H.; Ligo, M.A.V.; Ramos, N.P.; Packer, A.P.; Batista, E.R. Fluxes of CO2 above a sugarcane plantation in Brazil. Agric. For. Meteorol. 2013, 182–183, 54–66. [Google Scholar] [CrossRef]
  54. Baldocchi, D. A comparative study of mass and energy exchange rates over a closed C3(wheat) and an open C4(corn) crop: II. CO2 exchange and water use efficiency. Agric. For. Meteorol. 1994, 67, 291–321. [Google Scholar] [CrossRef]
  55. Steduto, P.; Hsiao, T.C.; Raes, D.; Fereres, E. AquaCrop—The FAO Crop Model to Simulate Yield Response to Water: I. Concepts and Underlying Principles. Agron. J. 2009, 101, 426–437. [Google Scholar] [CrossRef]
  56. Ding, Y.; Huang, J.; Qian, C.; Liu, B.; Ni, L. Applicability of Biodegradable Mulch in Maize Production in Northeastern Yunnan. Agric. Sci. Tech. 2015, 16, 2324–2330. [Google Scholar]
  57. Ferrara, R.M.; Carozzi, M.; Decuq, C.; Loubet, B.; Finco, A.; Marzuoli, R.; Gerosa, G.; Di Tommasi, P.; Magliulo, V.; Rana, G. Ammonia, nitrous oxide, carbon dioxide, and water vapor fluxes after green manuring of faba bean under Mediterranean climate. Agric. Ecosyst. Environ. 2021, 315, 107439. [Google Scholar] [CrossRef]
  58. Ferrara, R.M.; Martinelli, N.; Rana, G. CO2 and H2O fluxes due to green manuring under Mediterranean conditions. Ital. J. Agrometeorol. 2020, 45–53. [Google Scholar] [CrossRef]
  59. Aguilera, E.; Lassaletta, L.; Gattinger, A.; Gimeno, B.S. Managing soil carbon for climate change mitigation and adaptation in Mediterranean cropping systems: A meta-analysis. Agric. Ecosyst. Environ. 2013, 168, 25–36. [Google Scholar] [CrossRef]
  60. Farina, R.; Marchetti, A.; Francaviglia, R.; Napoli, R.; Di Bene, C. Modeling regional soil C stocks and CO2 emissions under Mediterranean cropping systems and soil types. Agric. Ecosyst. Environ. 2017, 238, 128–141. [Google Scholar] [CrossRef]
  61. Aubinet, M.; Moureaux, C.; Bodson, B.; Dufranne, D.; Heinesch, B.; Suleau, M.; Vancutsem, F.; Vilret, A. Carbon sequestration by a crop over a 4-year sugar beet/winter wheat/seed potato/winter wheat rotation cycle. Agric. For. Meteorol. 2009, 149, 407–418. [Google Scholar] [CrossRef]
  62. Osborne, B.; Saunders, M.; Walmsley, D.; Jones, M.; Smith, P. Key questions and uncertainties associated with the assessment of the cropland greenhouse gas balance. Agric. Ecosyst. Environ. 2010, 139, 293–301. [Google Scholar] [CrossRef]
  63. Lamichhane, S.; Kumar, L.; Wilson, B. Digital soil mapping algorithms and covariates for soil organic carbon mapping and their implications: A review. Geoderma 2019, 352, 395–413. [Google Scholar] [CrossRef]
  64. O’Rourke, S.M.; Angers, D.A.; Holden, N.M.; McBratney, A.B. Soil organic carbon across scales. Glob. Change Biol. 2015, 21, 3561–3574. [Google Scholar] [CrossRef] [PubMed]
  65. Funes, I.; Savé, R.; Rovira, P.; Molowny-Horas, R.; Alcañiz, J.M.; Ascaso, E.; Herms, I.; Herrero, C.; Boixadera, J.; Vayred, J. Agricultural soil organic carbon stocks in the north-eastern Iberian Peninsula: Drivers and spatial variability. Sci. Total Environ. 2019, 668, 283–294. [Google Scholar] [CrossRef]
  66. Mishra, U.; Riley, W.I. Scaling impacts on environmental controls and spatial heterogeneity of soil organic carbon stocks. Biogeosciences 2015, 12, 3993–4004. [Google Scholar] [CrossRef]
  67. Ventrella, D.; Di Giacomo, E.; Fiorentino, C.; Giglio, L.; Lopez, R.; Guastaferro, F.; Castrignanò, A. Soil Water Balance and Irrigation Strategies in an Agricultural District of Southern Italy. Ital. J. Agron. 2010, 5, 193–204. [Google Scholar] [CrossRef]
  68. Ren, D.; Xu, X.; Hao, Y.; Huang, G. Modeling and assessing field irrigation water use in a canal system of Hetao, upper Yellow River basin: Application to maize, sunflower and watermelon. J. Hydrol. 2016, 532, 122–139. [Google Scholar] [CrossRef]
  69. AlKhader, A.M.F.; Qaryouti, M.M.; Okasheh, T.Y.M. Effect of nitrogen on yield, quality, and irrigation water use efficiency of drip fertigated grafted watermelon (Citrullus lanatus) grown on a calcareous soil. J. Plant Nutr. 2019, 42, 737–748. [Google Scholar] [CrossRef]
  70. Fuentes, C.; Enciso, J.; Nelson, S.D.; Anciso, J.; Setamou, M.; Elsayed-Farag, S. Yield Production and Water Use Efficiency under Furrow and Drip Irrigation Systems for Watermelon in South Texas. Subtrop. Agric. Environ. 2018, 69, 1–7. [Google Scholar]
  71. Wang, X.-C.; Liu, R.; Luo, J.; Zhu, P.; Wang, Y.; Pan, X.; Shu, L. Effects of water and NPK fertigation on watermelon yield, quality, irrigation-water, and nutrient use efficiency under alternate partial root-zone drip irrigation. Agric. Water Manag. 2022, 271, 107785. [Google Scholar] [CrossRef]
  72. Wang, Z.; Yu, S.; Zhang, H.; Lei, L.; Liang, C.; Chen, L.; Su, D.; Li, X. Deficit mulched drip irrigation improves yield, quality, and water use efficiency of watermelon in a desert oasis region. Agric. Water Manag. 2023, 277, 108103. [Google Scholar] [CrossRef]
Figure 1. Meteorological conditions during the experimental period (1 June–30 November 2023); (a) air temperature, Ta, and Photosynthetically Active Radiation, PAR; (b) vapor pressure deficit, VPD, and precipitation, P.
Atmosphere 15 00945 g001
Figure 2. The soil water content (θ) daily trend in the experimental period (1 June–30 November 2023). The horizontal green and red lines indicate the field capacity and the wilting point, respectively; irrigation and precipitations are also reported.
Atmosphere 15 00945 g002
Figure 3. Patterns of leaf area index (LAI) and fresh biomass (FB) measured during the crop growth cycle. The error bars represent the standard deviations, shown for clarity only in one direction.
Atmosphere 15 00945 g003
Figure 4. The temporal trends of hourly eddy covariance fluxes of carbon dioxide (Fc) from June to November are delineated in panels (a) through (f). Fc patterns are reported at decadal scale in the whole experimental period (June–November 2023) of the watermelon crop.
Atmosphere 15 00945 g004
Figure 5. The trends of hourly eddy covariance water vapor fluxes (Fq) from June to November are presented in panels (a) through (f). Fq patterns are reported at a decadal scale in the whole experimental period (June–November 2023) of watermelon crop.
Atmosphere 15 00945 g005
Figure 6. Stomatal fluxes (transpiration and photosynthesis) at daily timescale as partitioned by the FVS method during the growth seasons; the surface covering is also reported.
Atmosphere 15 00945 g006
Figure 7. Non-stomatal fluxes (evaporation and respiration) at daily timescale as partitioned by the FVS method during the growth seasons; the surface covering is also reported.
Atmosphere 15 00945 g007
Figure 8. Cumulative values of C absorbed by photosynthesis (GPP) and released by respiration (Reco) in the whole experimental period (1 June–30 November 2023).
Atmosphere 15 00945 g008
Figure 9. Carbon balance of the field over the whole experimental period, from June to November 2023; positive numbers denote a gain for the field while negative ones denote a loss.
Atmosphere 15 00945 g009
Table 1. Mean agronomic and irrigation water use efficiencies (WUEagro and WUEirr) for watermelon cropped using plastic mulched and drip optimal irrigation.
ClimateWUEagro
[kg m−3]
WUEirr
[kg m−3]
References
Mediterranean 21.28[5]
Mediterranean 26.76[69]
Semi-arid27.6060.00[70]
Warm-temperate-humid 33.40[71]
Arid oasis desert39.00 [72]
Mediterranean38.3815.82Present work
Disclaimer/Publisher’s Note: The statements, opinions and data contained in all publications are solely those of the individual author(s) and contributor(s) and not of MDPI and/or the editor(s). MDPI and/or the editor(s) disclaim responsibility for any injury to people or property resulting from any ideas, methods, instructions or products referred to in the content.

