Abstract
The remarkable expansion of lake areas across the Changtang Plateau (CTP, located in the central Tibetan Plateau) since the late 1990s has drawn considerable scientific interest, presenting a striking contrast to the global decline in natural lake water storage observed during the same period. This study systematically investigates the mechanisms underlying lake area variations on the CTP by integrating glacierized area changes derived from the Google Earth Engine (GEE) platform with atmospheric circulation patterns from the ERA5 reanalysis dataset. Our analysis demonstrates that the limited glacier coverage on the CTP exerted significant influence only on glacial lakes in the southern region (r = −0.65, p < 0.05). The widespread lake expansion across the CTP predominantly stems from precipitation increases (r = 0.74, p < 0.01) associated with atmospheric circulation changes. Enhanced Indian summer monsoon (ISM) activity facilitates anomalous moisture transport from the Indian Ocean to the southwestern CTP, manifesting as increased specific humidity (Qa) in summer. Simultaneously, the weakened westerly jet stream reinforces moisture convergence across the CTP, driving enhanced annual precipitation. By coupling glacier coverage variations with atmospheric processes, this research establishes that precipitation anomalies rather than glacial meltwater primarily govern the extensive lake expansion on the CTP. These findings offer critical insights for guiding ecological security strategies and sustainable development initiatives on the CTP.
1. Introduction
The Tibetan Plateau (TP), renowned as the “roof of the world”, plays a pivotal role owing to its considerable elevation and vast expanse [1,2]. The high elevation of the TP results in a climate that significantly differs from that of adjacent regions at similar latitudes. The TP is the source of several of the major rivers in Asia, including the Yangtze River, Yellow River, Lantsang River, Nu River, the Ganges River, and Indus River [3,4]. The TP supplies varying proportions of runoff to these rivers, which in turn provide freshwater to downstream Asian countries. Given the TP ’s capacity for water supply, it is often referred to as the “Asian Water Tower” [5] or “Towering Asian Spring” [6].
The TP boasts approximately 1400 lakes with areas exceeding 1 km2, and about 70% of the total lake area is concentrated in the endorheic basins of its central region, known as the Changtang Plateau (CTP) [7,8]. Over the period from 1992 to 2020, global natural lake water storage (LWS) experienced statistically significant declines, with a net reduction rate of −21.51 ± 2.54 G/yr [9]. The CTP, characterized by its harsh natural climate and minimal human activity, hosts lakes that are almost entirely natural. In contrast, previous studies have revealed a significant and rapid expansion of lake areas on the CTP from the late 1990s to the present, with a water volume increase of ~7 Gt/yr in 2000–2009 [10]. This contrasting trend raises a critical scientific question: what specific factors are driving the rapid expansion of CTP lakes amidst the global decline in LWS? Understanding these drivers is essential for predicting future hydrological changes and their ecological and socio-economic impacts.
Numerous studies have investigated lake expansion, as reflected by changes in surface area, volume, and water levels on the CTP [11]. However, due to the scarcity of observational data, comprehensive quantitative studies of lake hydrological processes remain challenging. Zhu et al. [12] conducted a quantitative study of Nam Co, the second largest endorheic lake on the CTP, and found that glacial meltwater is the primary driver of its expansion. Similarly, Lei et al. [13] demonstrated the dominant role of glacial meltwater in the expansion of Linggo Co in the central CTP. These conflicting results highlight the ongoing controversy regarding the primary drivers of lake expansion on the CTP. Song et al. [14] examined the relationship between lake levels and glacial meltwater on the CTP, finding that the rates of change in non-glacier-fed lakes were as high as those in glacier-fed lakes across the CTP. Lei et al. [15] identified a significant water surplus on the CTP since the late 1990s, which they primarily attributed to increased regional precipitation. Zhang et al. [16] conducted a quantitative water mass budget analysis for the entire CTP, revealing that increased net precipitation contributes the majority of the water supply (74%) to lake volume expansion. However, Li et al. [17] attributed the expansion of CTP lakes to increased precipitation and glacial meltwater.
Lake evaporation tends to be the only output of a lake system for most endorheic lakes in the CTP when ignoring the effect of lake leakage [18]. The influence of evapotranspiration on lake systems operates through two distinct mechanisms. First, lake surface evaporation directly affects water balance through mass loss from the lake surface [19,20]. Second, land surface evapotranspiration indirectly influences lake systems by regulating catchment runoff that feeds into the lakes [19,21,22]. Previous studies have demonstrated that EW rates far exceed ETL rates in this region [23]. However, the exact impact of evaporation on lake water storage changes remains uncertain, owing to variations and limitations in evaporation rate estimates among studies [24,25].
Furthermore, recent studies indicate that by 2100 C.E., the continued expansion of lake areas in the CTP may result in the merging or reorganization of lake basins, threatening local infrastructure and ecological security [26,27,28]. Therefore, it is imperative to investigate the mechanisms behind the differences in lake area changes in the CTP compared to global patterns to develop timely and effective preventive measures against ecological threats and associated economic losses.
One of the main reasons for the ongoing controversy is the limited availability of high-resolution observations of lake and climatic variables. To address these research gaps, this study employs an integrated approach, combining high-temporal-resolution remote sensing data with ERA5 reanalysis data to systematically investigate the relationships between lake dynamics and key influencing factors, including precipitation, glacial changes, and atmospheric circulation patterns. The goal of this study is to investigate the driving mechanisms behind the significant lake expansion observed on the CTP since the late 1990s, which presents a contrasting trend to the global decline in natural LWS during the same period.
2. Materials and Methods
2.1. Study Area
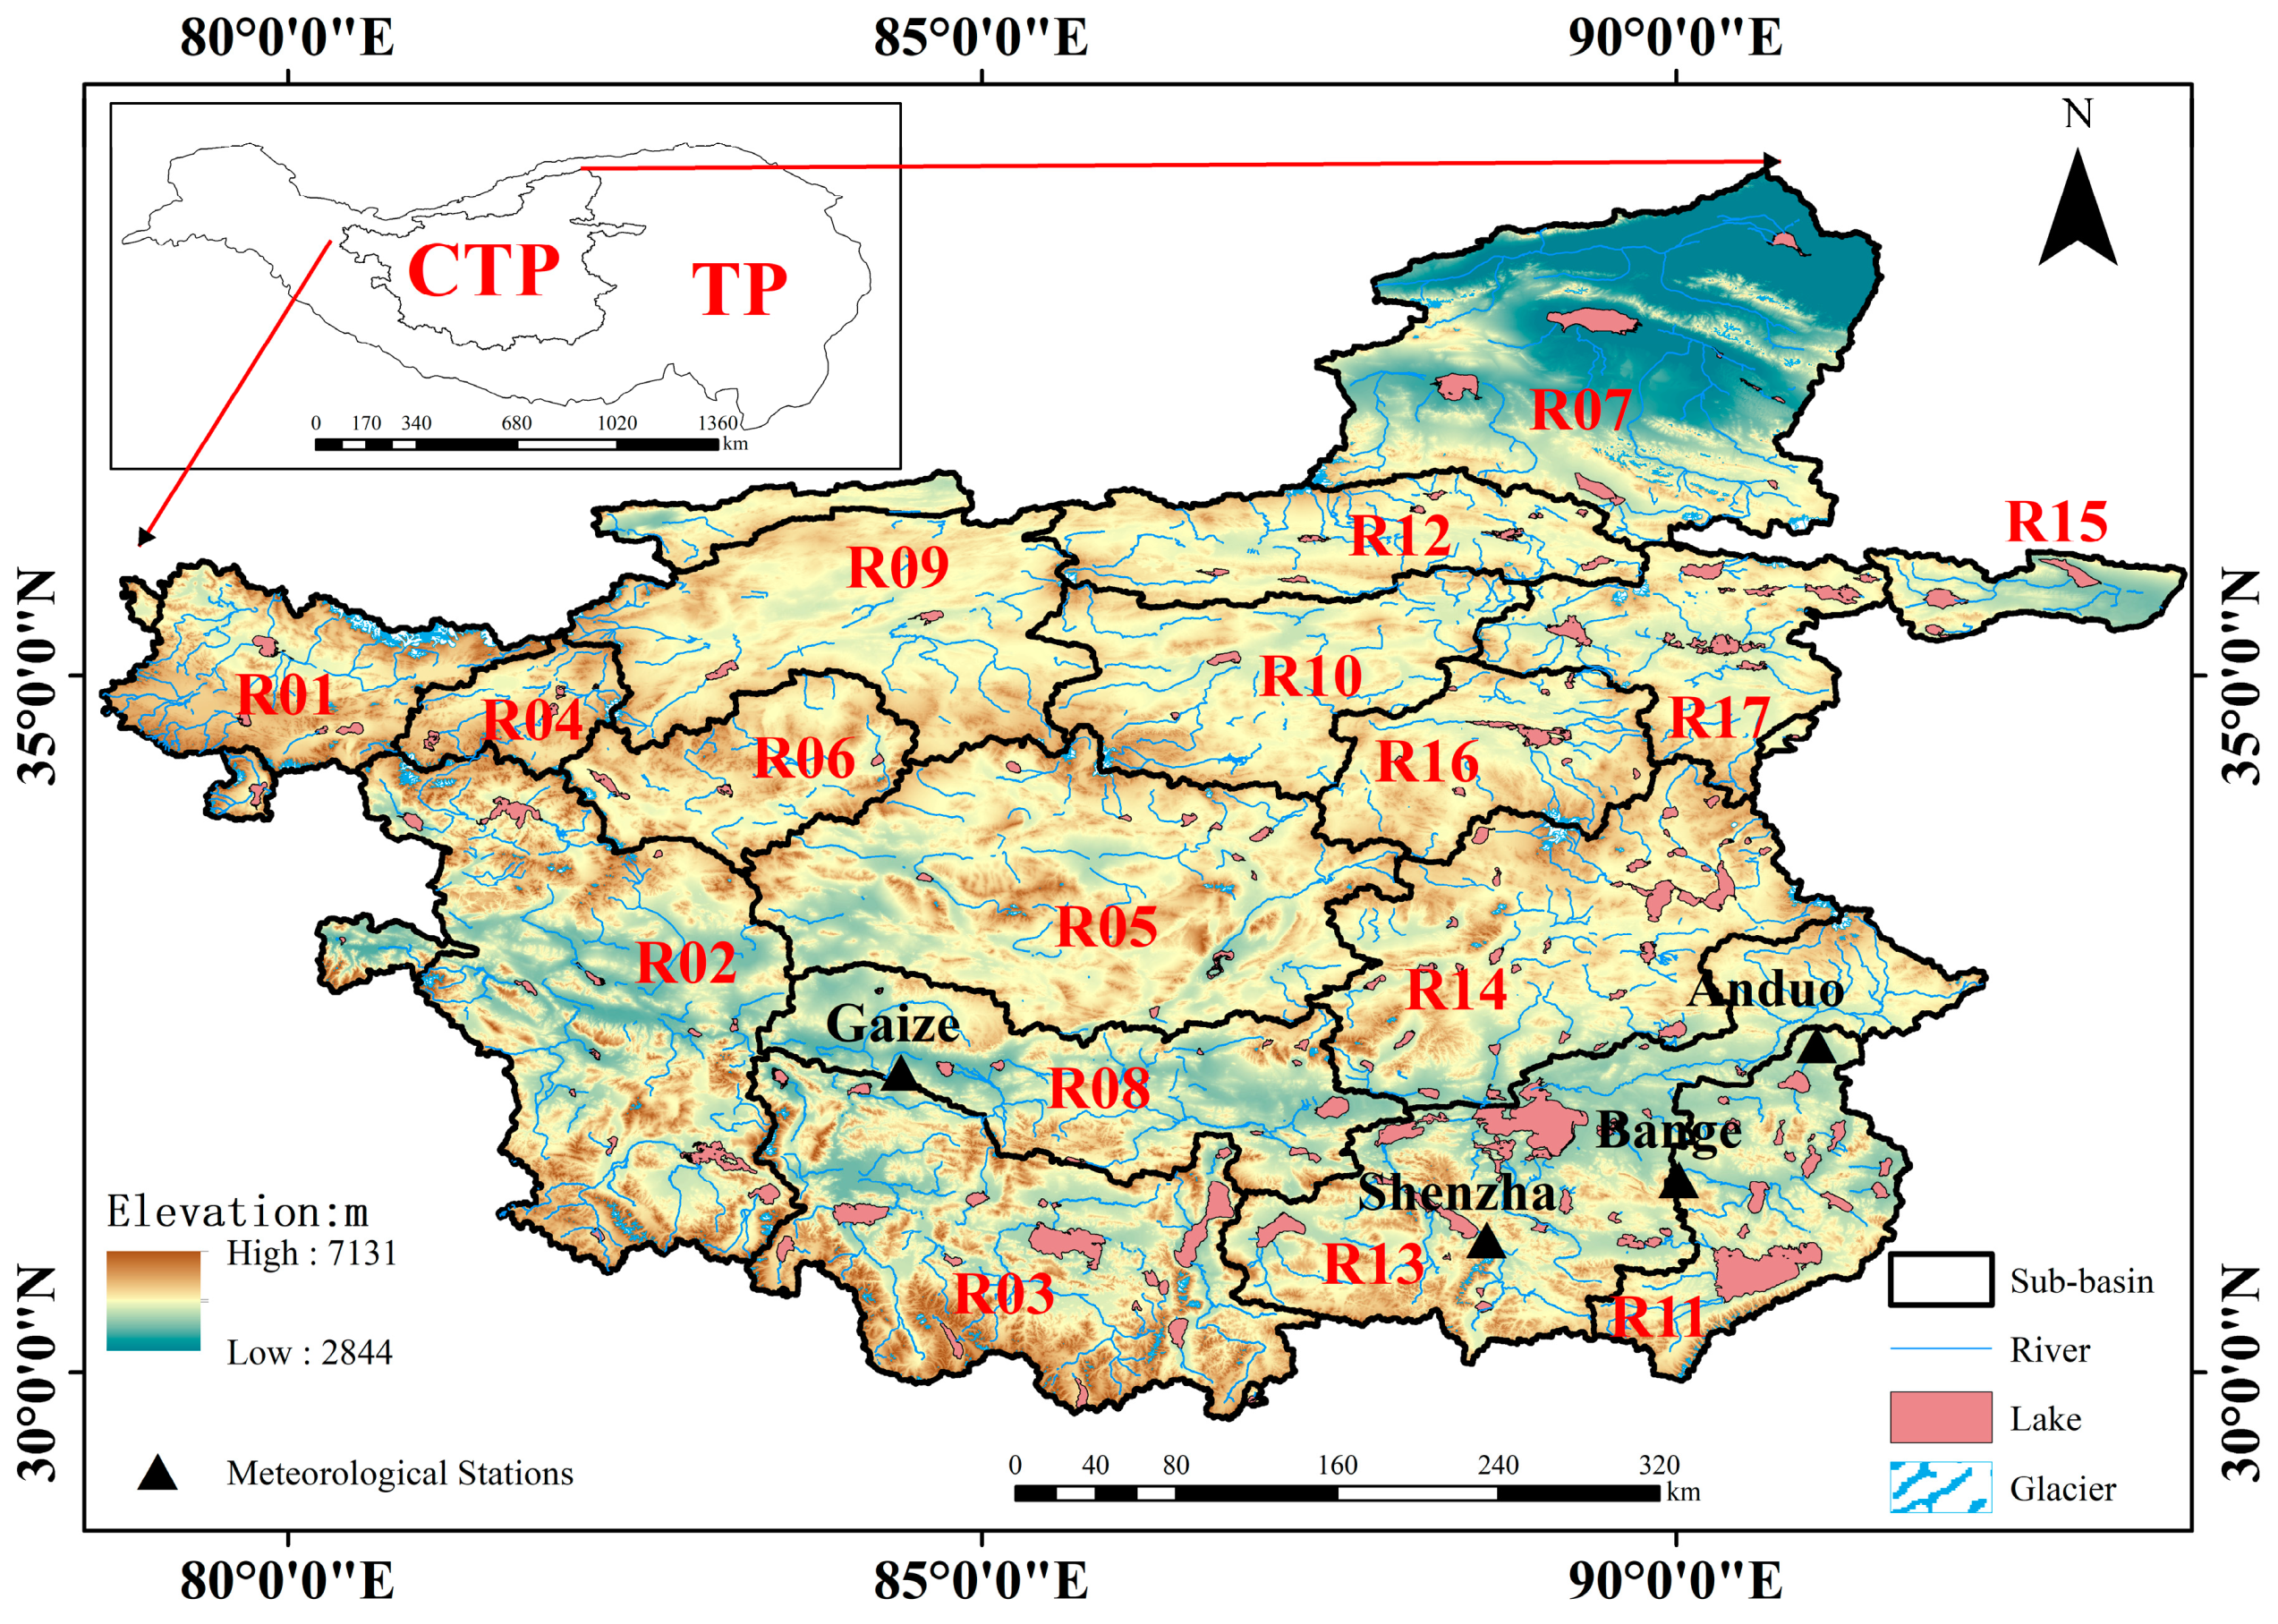
The CTP (29°39′57″–38°39′51″ N; 78°38′53″–93°38′43″ E), depicted in Figure 1, is a vast endorheic basin located in central TP, with an average elevation exceeding 4800 m and an area of approximately 590,000 km2. It hosts a significant portion of the lakes on the TP, encompassing about 70% of the total lake area [8]. Additionally, it contains over 5000 glaciers, covering an area of roughly 7069 km2 [29]. Based on the HydroSHEDS data product [30], the CTP is further subdivided into 17 sub-basins. According to the coefficient of variation (CV) of precipitation in each sub-basin related to lake expansion, these sub-basins are ranked from largest to smallest and labeled as R01 to R17 (See Section 3.1). The harsh natural environment and sparse human presence characterize the plateau, which hosts only four long-term meteorological stations: Gaize, Shenzha, Bange, and Anduo, with the latter three clustered in the southeastern corner. Notably, there is a complete absence of long-term meteorological stations in the middle and northern parts of the CTP.
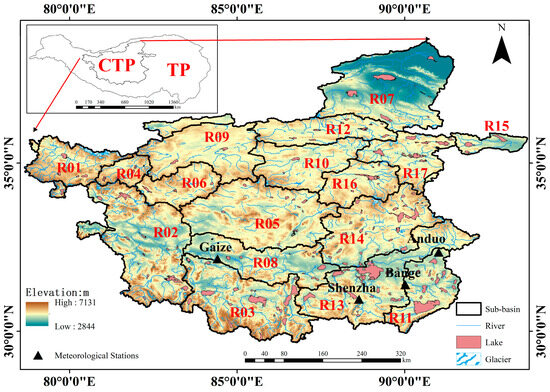
Figure 1.
The geographical location of the CTP and the hydrological watershed delineation. Bold black solid lines denote the division of the CTP into 17 sub-basins. Red polygons denote locations of lakes, blue lines denote rivers and blue-white polygons denote glacier distribution. Black triangles denote locations of meteorological stations on CTP.
2.2. Materials
2.2.1. Lake Area Data
Numerous scholars have compiled and processed imagery from the high-water season (June to November) and early aerial photography-derived topographic maps to create annual datasets of lake areas for the TP. This study utilized two long-term datasets [31,32,33] to compile a comprehensive collection of 172 lakes within the CTP, spanning the period from 1960 to 2020 (See Table 1). The selected lakes met strict quality control criteria, with fewer than 5% of years missing, thereby enhancing data precision and ensuring the reliability of our results.

Table 1.
Introduction of lake datasets.
2.2.2. Glacier Data
We compiled imagery data obtained from various satellites in the Landsat series, specifically Landsat 4 (operating from 1982 to 1993 with the Thematic Mapper, TM), Landsat 5 (1984 to 2012, also equipped with TM), Landsat 7 (1999 to 2021, Enhanced Thematic Mapper Plus, ETM+), and Landsat 8 (2013 to 2020, Operational Land Imager/Thermal Infrared Sensor, OLI/TIRS), for the purpose of assessing glacierized area on the CTP. The spatial resolution of the images employed in this study was 30 m. Owing to the significant striping artifacts in Landsat 7 imagery, resulting from the malfunction of the ETM+ sensor after 2003, our analysis exclusively utilized Landsat 7 images captured prior to this date. During the rigorous process of image quality control, it was observed that, as of early June, the seasonal snow cover on glaciers within the CTP had not yet fully melted. To ensure the accuracy and temporal consistency of our glacier data with the lake area dataset, we strictly selected images from July and August that exhibited less than 20% cloud cover and no cloud obstructions over the glaciers for subsequent glacier information extraction. This extraction process was conducted on the Google Earth Engine (GEE) platform, harnessing its extensive imagery database and powerful computational resources. Notably, the quality limitations inherent in the available imagery restrict the availability of high-quality monitoring results from the 1970s and 1980s.
2.2.3. Meteorological Reanalysis Data
Given that summer precipitation constitutes approximately 70% of the annual total on the CTP, with the present study focusing on summer rainfall discussion [34], and recognizing the limitations imposed by the sparse and uneven distribution of meteorological stations in the CTP, we employed the ECMWF-produced ERA5 reanalysis dataset. We utilized this reanalysis data spanning the summer (June–July–August, JJA) period from 1960 to 2020, providing gridded estimates at 0.25° × 0.25° resolution for hydroclimatic parameters. The selected variables included specific humidity (Qa), zonal/meridional wind components (u/v), total precipitation, 2 m air temperature, surface runoff, and potential evapotranspiration (PET). The Qa and u/v-component of wind cover vertical atmospheric layers from 500 hPa to 200 hPa. No spatial interpolation was performed on the variables.
2.3. Methods
2.3.1. Ratio Threshold Method
The ratio threshold method, as shown in Equation (1), was used. This method is a commonly employed multi-band digital image enhancement technique, where the ratio of the gray values of two bands highlights the slope changes in the spectral curves of surface features, thereby enhancing subtle differences in spectral characteristics. The threshold selection is based on interactive manual determination for each image, with optimal values concentrated in the 1.8–2.0 range. Areas with ratios exceeding this threshold are considered glaciated. Liu et al. (2015) successfully applied this methodology in compiling the Second Glacier Inventory of China [35].
where represents the gray value of the red band, represents the gray value of the shortwave infrared band, corresponding to band 3 and band 5 of the TM/ETM+ sensor and band 4 and band 6 of the OLI sensor, respectively.
2.3.2. Mutations Test
The cumulative deviation [36,37], shown in Equation (2), was employed to identify phases of change. This study used both methods to analyze and determine the years of phase transitions in climatic variables (e.g., precipitation) and lake area.
where represents the cumulative deviation, is the annual value of the variable, and is the multi-year average of the variable
2.3.3. Climatic Diagnosis Based on Euler’s Method
To diagnose the changes in atmospheric circulation before and after abrupt years, this study calculated the vertically integrated water vapor flux as shown in Equation (3), with its divergence as shown in Equation (4) [7,34].
where , represent the vertically integrated water vapor flux, its divergence, and the boundary moisture budget, and , , , , denote the lowest and highest integration levels, gravitational acceleration, meridional wind component and zonal wind component, respectively.
2.3.4. Correlation and Composite Analysis
This study employed composite analysis to investigate the differences in the atmospheric circulation background fields between two periods before and after lake changes, as well as the possible mechanisms behind these changes. Additionally, Pearson correlation analysis and Student’s t-test were used for climatic statistical analysis and climatic diagnostic analysis.
2.3.5. Coefficient of Variation
The coefficient of variation (CV) is a commonly used metric for measuring the relative variability of a variable and reflects the degree of dispersion in the data [38]. In this study, the CV of precipitation was used to reasonably rank the sub-basins of CTP. A higher CV indicates greater data fluctuation and a larger deviation from the mean, implying stronger variability and more pronounced climate change in the region. Conversely, a lower CV suggests smaller data variability, indicating more regular and stable climatic conditions in the region. For a given time series, the CV was calculated using the Equation (5):
where represents the standard deviation of the variable during the study period, and represents the mean of the variable during the study period.
3. Results
3.1. Relationship Between Lake Area Change and Precipitation Anomaly
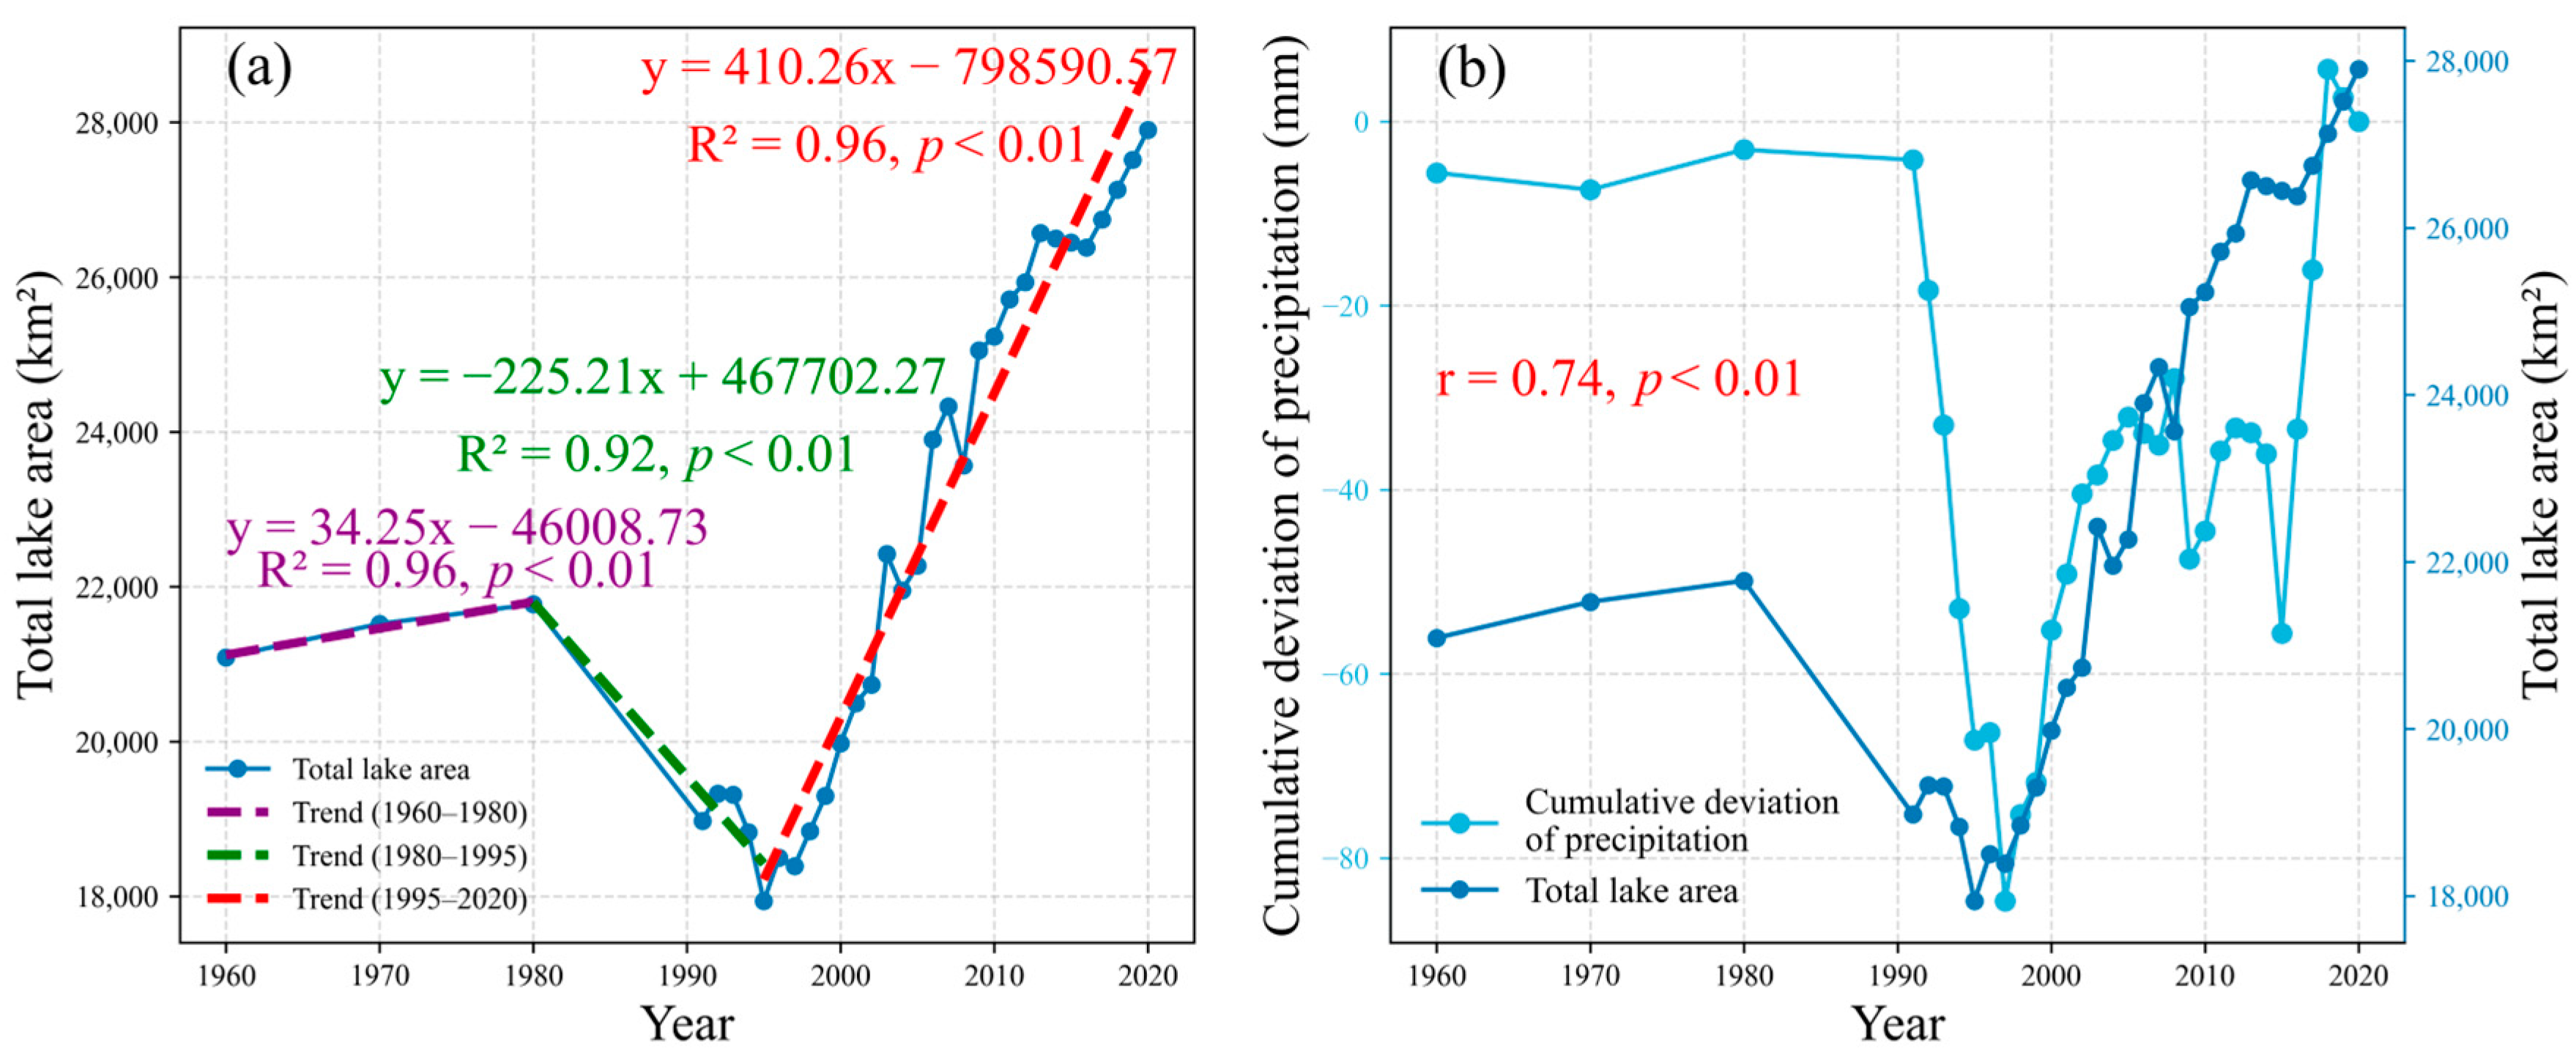
Initially, this study investigated the changes in the total lake area on the CTP and their correlation with the cumulative anomaly of regional average summer precipitation (29° N to 38° N, 81° E to 92° E). As illustrated in Figure 2a, the lake area on the CTP over the past six decades (1960–2020) exhibited three distinct phases: (1) a period of slow expansion from the 1960s to the 1980s, during which the lake area increased at a rate of 34.25 km2/yr, reaching 21,773.96 km2 by the 1980s; (2) a contraction period from the 1980s to the late 1990s, characterized by a significant decrease in lake area at a rate of −287.16 km2/yr; and (3) a period of rapid expansion from the late 1990s to 2020, with the lake area increasing at a rate of 410.26 km2/yr and reaching 28,000 km2 in 2020. Figure 2b reveals a significant positive correlation between the total lake area and the cumulative anomaly of summer precipitation (r = 0.74, p < 0.01), with a notable turning point occurring at the end of the 20th century. Additionally, abrupt declines in precipitation were observed in 1997/98, 2009/10, and 2015/16.
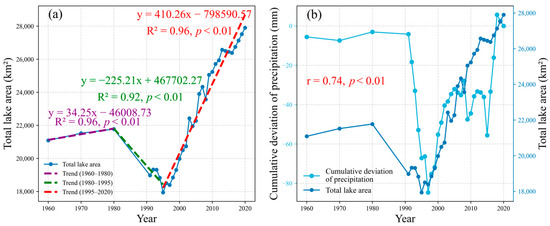
Figure 2.
Lake area change on the CTP over the past 60 years (1960–2020): (a) changes in the total lake area; (b) correlation between total lake area and cumulative anomaly in regional average summer precipitation for the CTP.
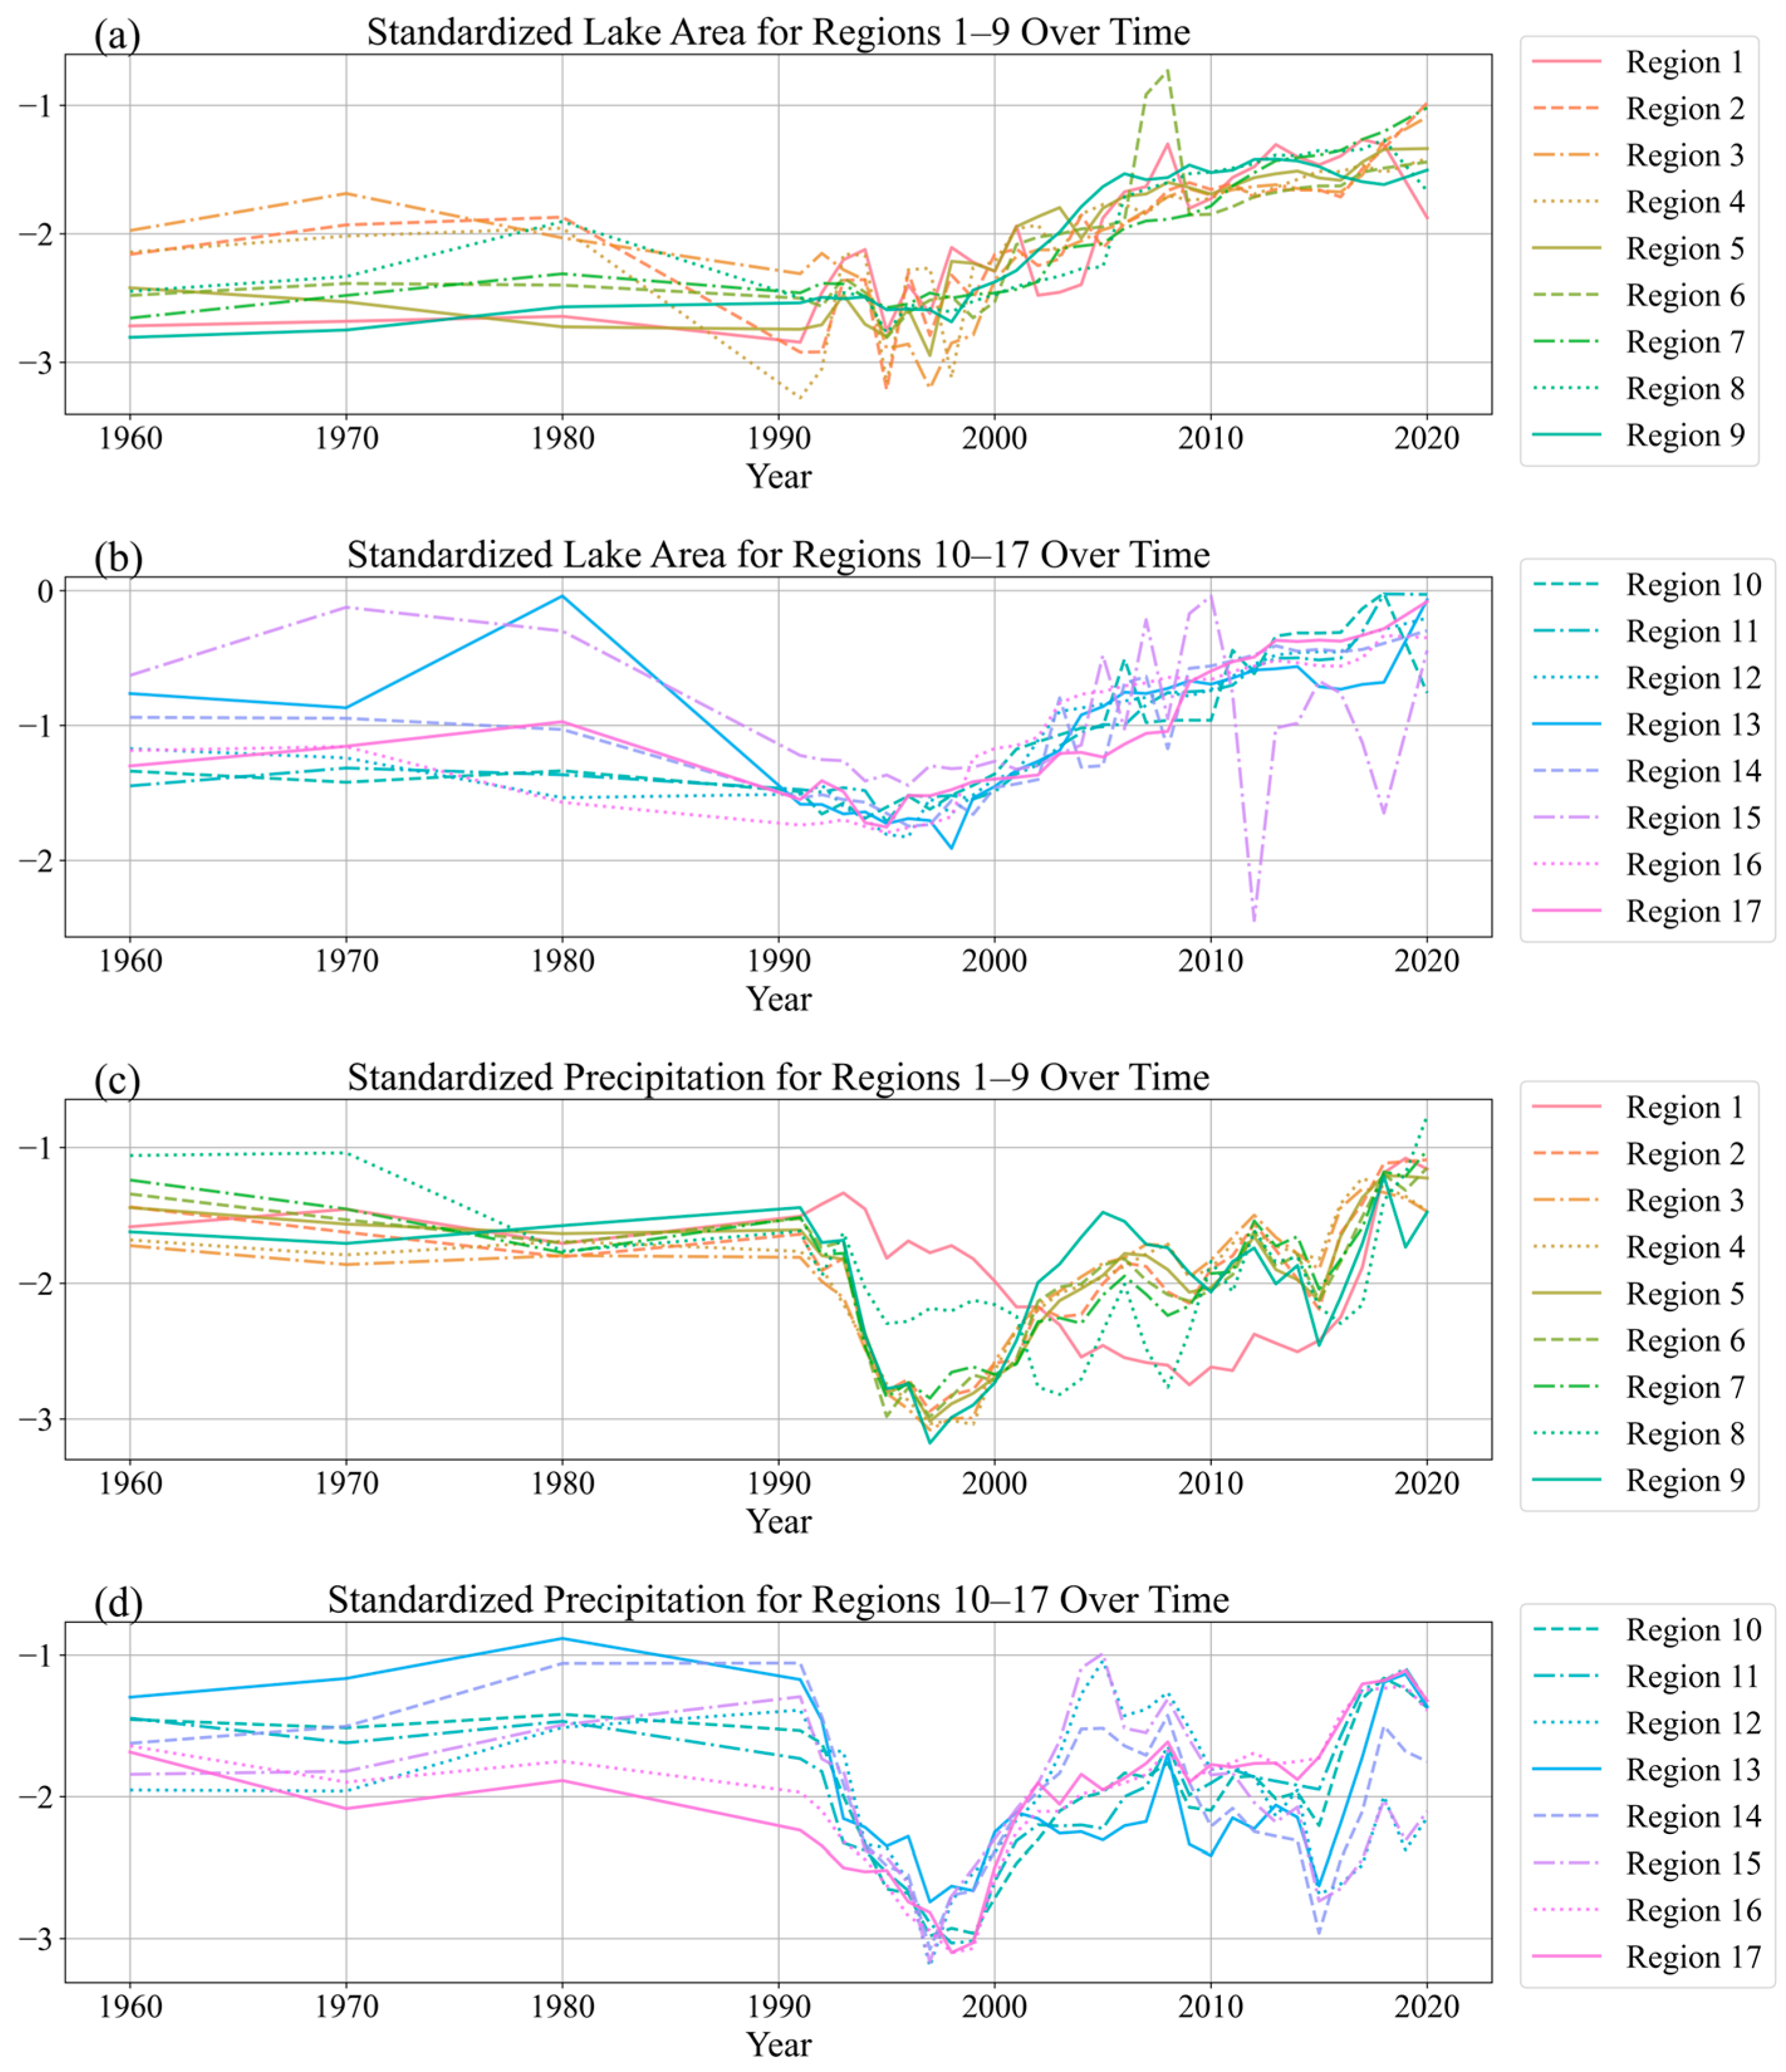
Subsequently, we examined the correlation between the lake area within each of the sub-basins and the corresponding regional summer precipitation (Figure 3). Based on the CV of summer precipitation since the late 1990s, the 17 sub-basins could be classified into two groups: R01–R09, characterized by higher CV values (ranging from 15.04 to 22.35), and R10–R17, with lower CV values (ranging from 10.26 to 14.10). This indicates that the greater variability of precipitation within the R01–R09 sub-basins during the lake expansion period (Figure 3c), compared to the relatively stable precipitation in the R10–R17 sub-basins (Figure 3d). Spatially, the R01–R09 sub-basins are distributed in the western CTP, while the R10–R17 sub-basins are located in the eastern CTP.

Figure 3.
Changes in lake area and summer precipitation on the CTP from 1960 to 2020: (a) lake area changes in sub-basins R01-R09, (b) lake area changes in sub-basins R10–R17, (c) cumulative deviation of regional summer precipitation in sub-basins R01–R09, and (d) cumulative deviation of regional summer precipitation in sub-basins R10–R17. All time series were standardized using Z-score normalization.
As shown in Figure 3a,b, changes in lake area across individual sub-basins over the past 60 years exhibit three distinct phases, consistent with the trend observed in the total lake area: (1) a period of slow growth from the 1960s to the 1980s, (2) a contraction period from the 1980s to the mid/late 1990s, and (3) a period of rapid expansion from the late 1990s to 2020, consistent with the overall trend observed for the entire CTP. Figure 3c–d further demonstrates that the turning points in summer precipitation primarily occurred in the late 1990s. Moreover, sharp declines in summer precipitation were observed across the sub-basins in 1997/98, 2009/10, and 2015/16, aligning with the precipitation variations on the CTP. Previous studies have attributed these abrupt precipitation declines to extreme El Niño events [39,40].
3.2. Relationship Between Glacierized Area and Lake Area Change
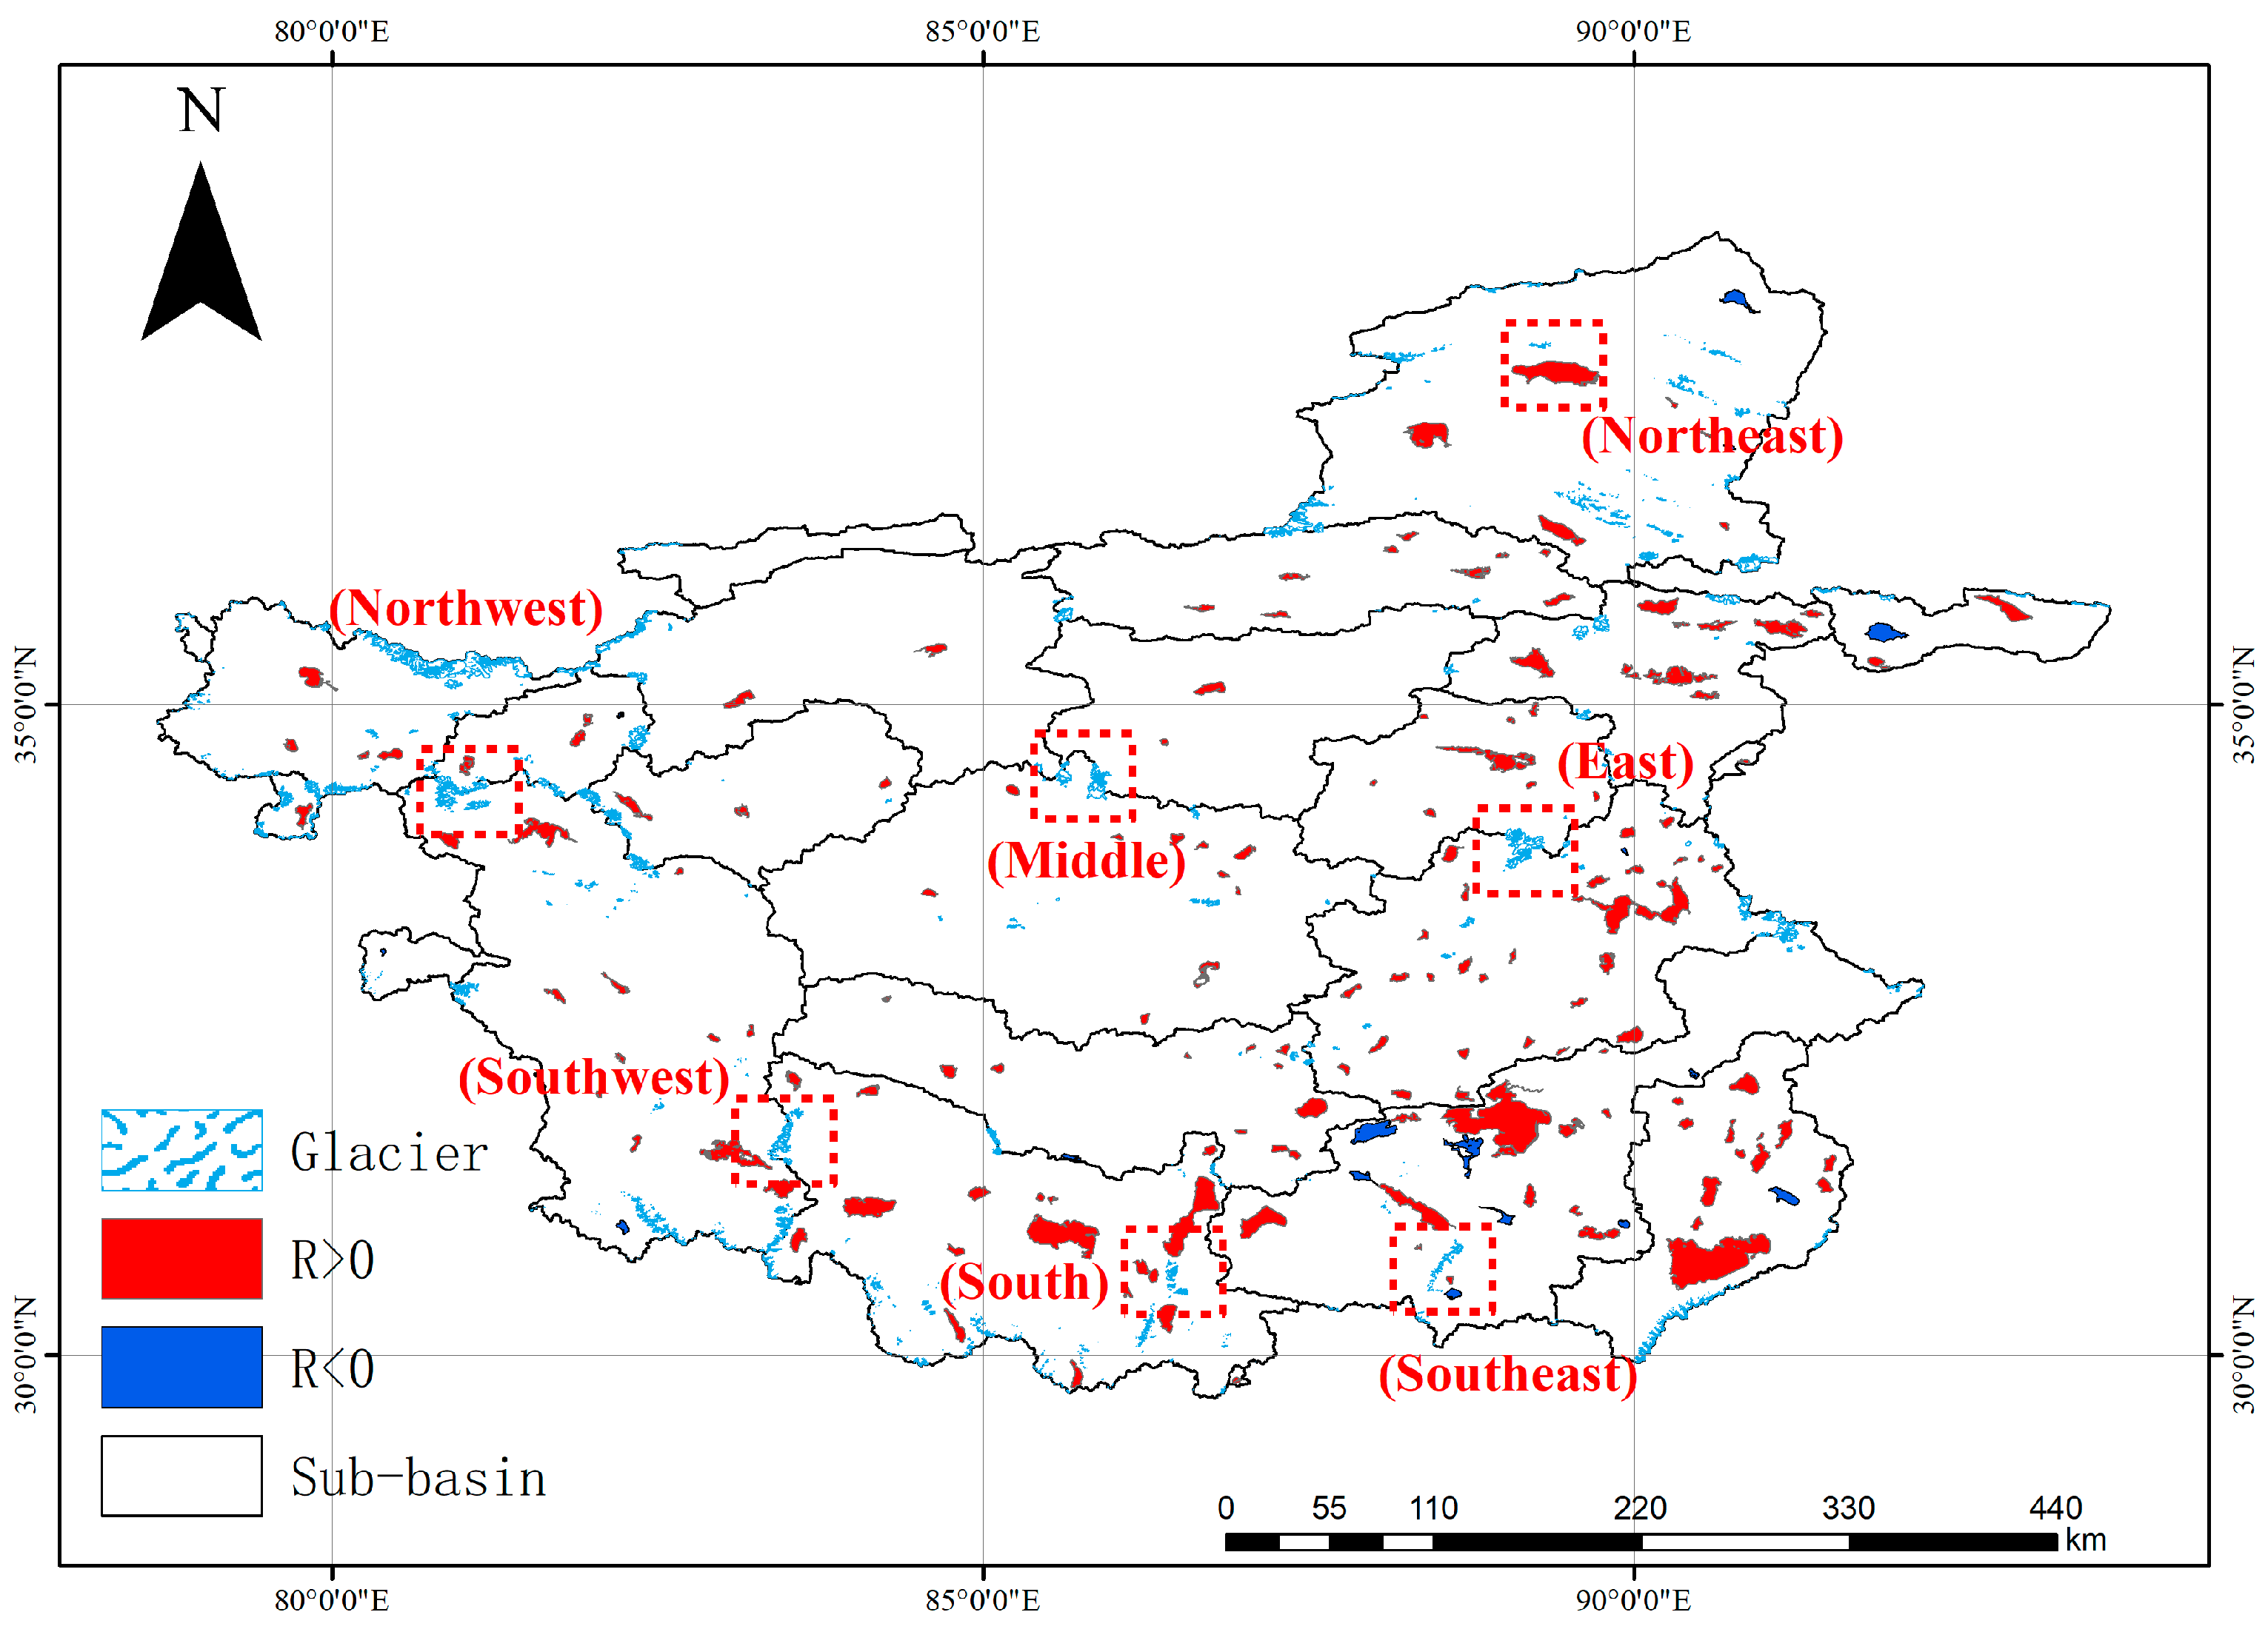
As shown in Figure 4, we selected seven representative regions for glacierized area monitoring based on spatial distribution characteristics of glaciers. These regions contain extensive, clearly identifiable glacier coverage that is visually discernible in satellite imagery. Spatially, as shown in the red dashed rectangles in Figure 4, these glacierized areas are distributed in the southeastern, southern, southwestern, northwestern, middle, northeastern and eastern CTP.
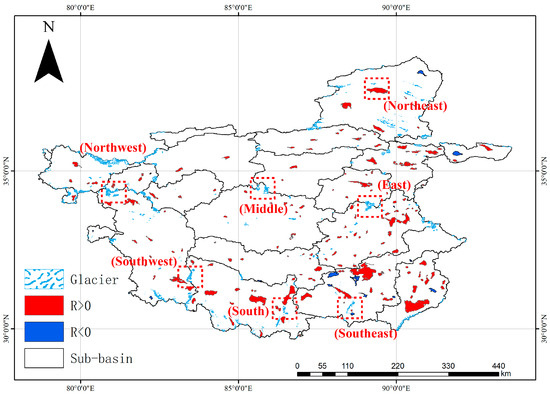
Figure 4.
The spatial distribution of the correlations between the area of 172 lakes and the corresponding regional average summer precipitation over the past 60 years. The range in the red dotted rectangle box indicates the distribution of the seven selected glacier regions.
However, it should be noted that due to the influences of lake depth characteristics, basin surface conditions, and groundwater discharge, the correlation results between lake area and summer precipitation exhibit a heterogeneous response, specifically manifested in variations in the magnitude of correlation coefficients [3]. But, due to the current lack of observational data in these areas, it is not possible to conduct individual assessments. So, in order to facilitate the discussions, we have simplified the lakes’ responses to summer precipitation into two categories: positive correlation (R > 0) and negative correlation (R < 0) (Figure 4).
The results (Figure 5) indicate that glacierized area changes on the CTP can be categorized into two distinct trends over the entire period of study.
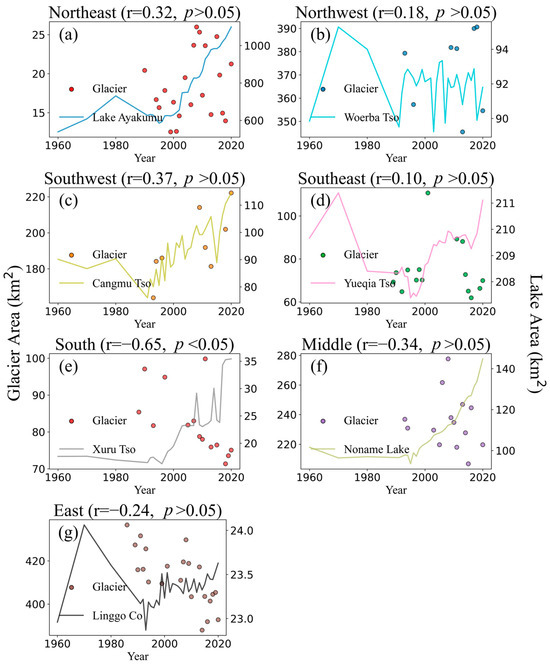
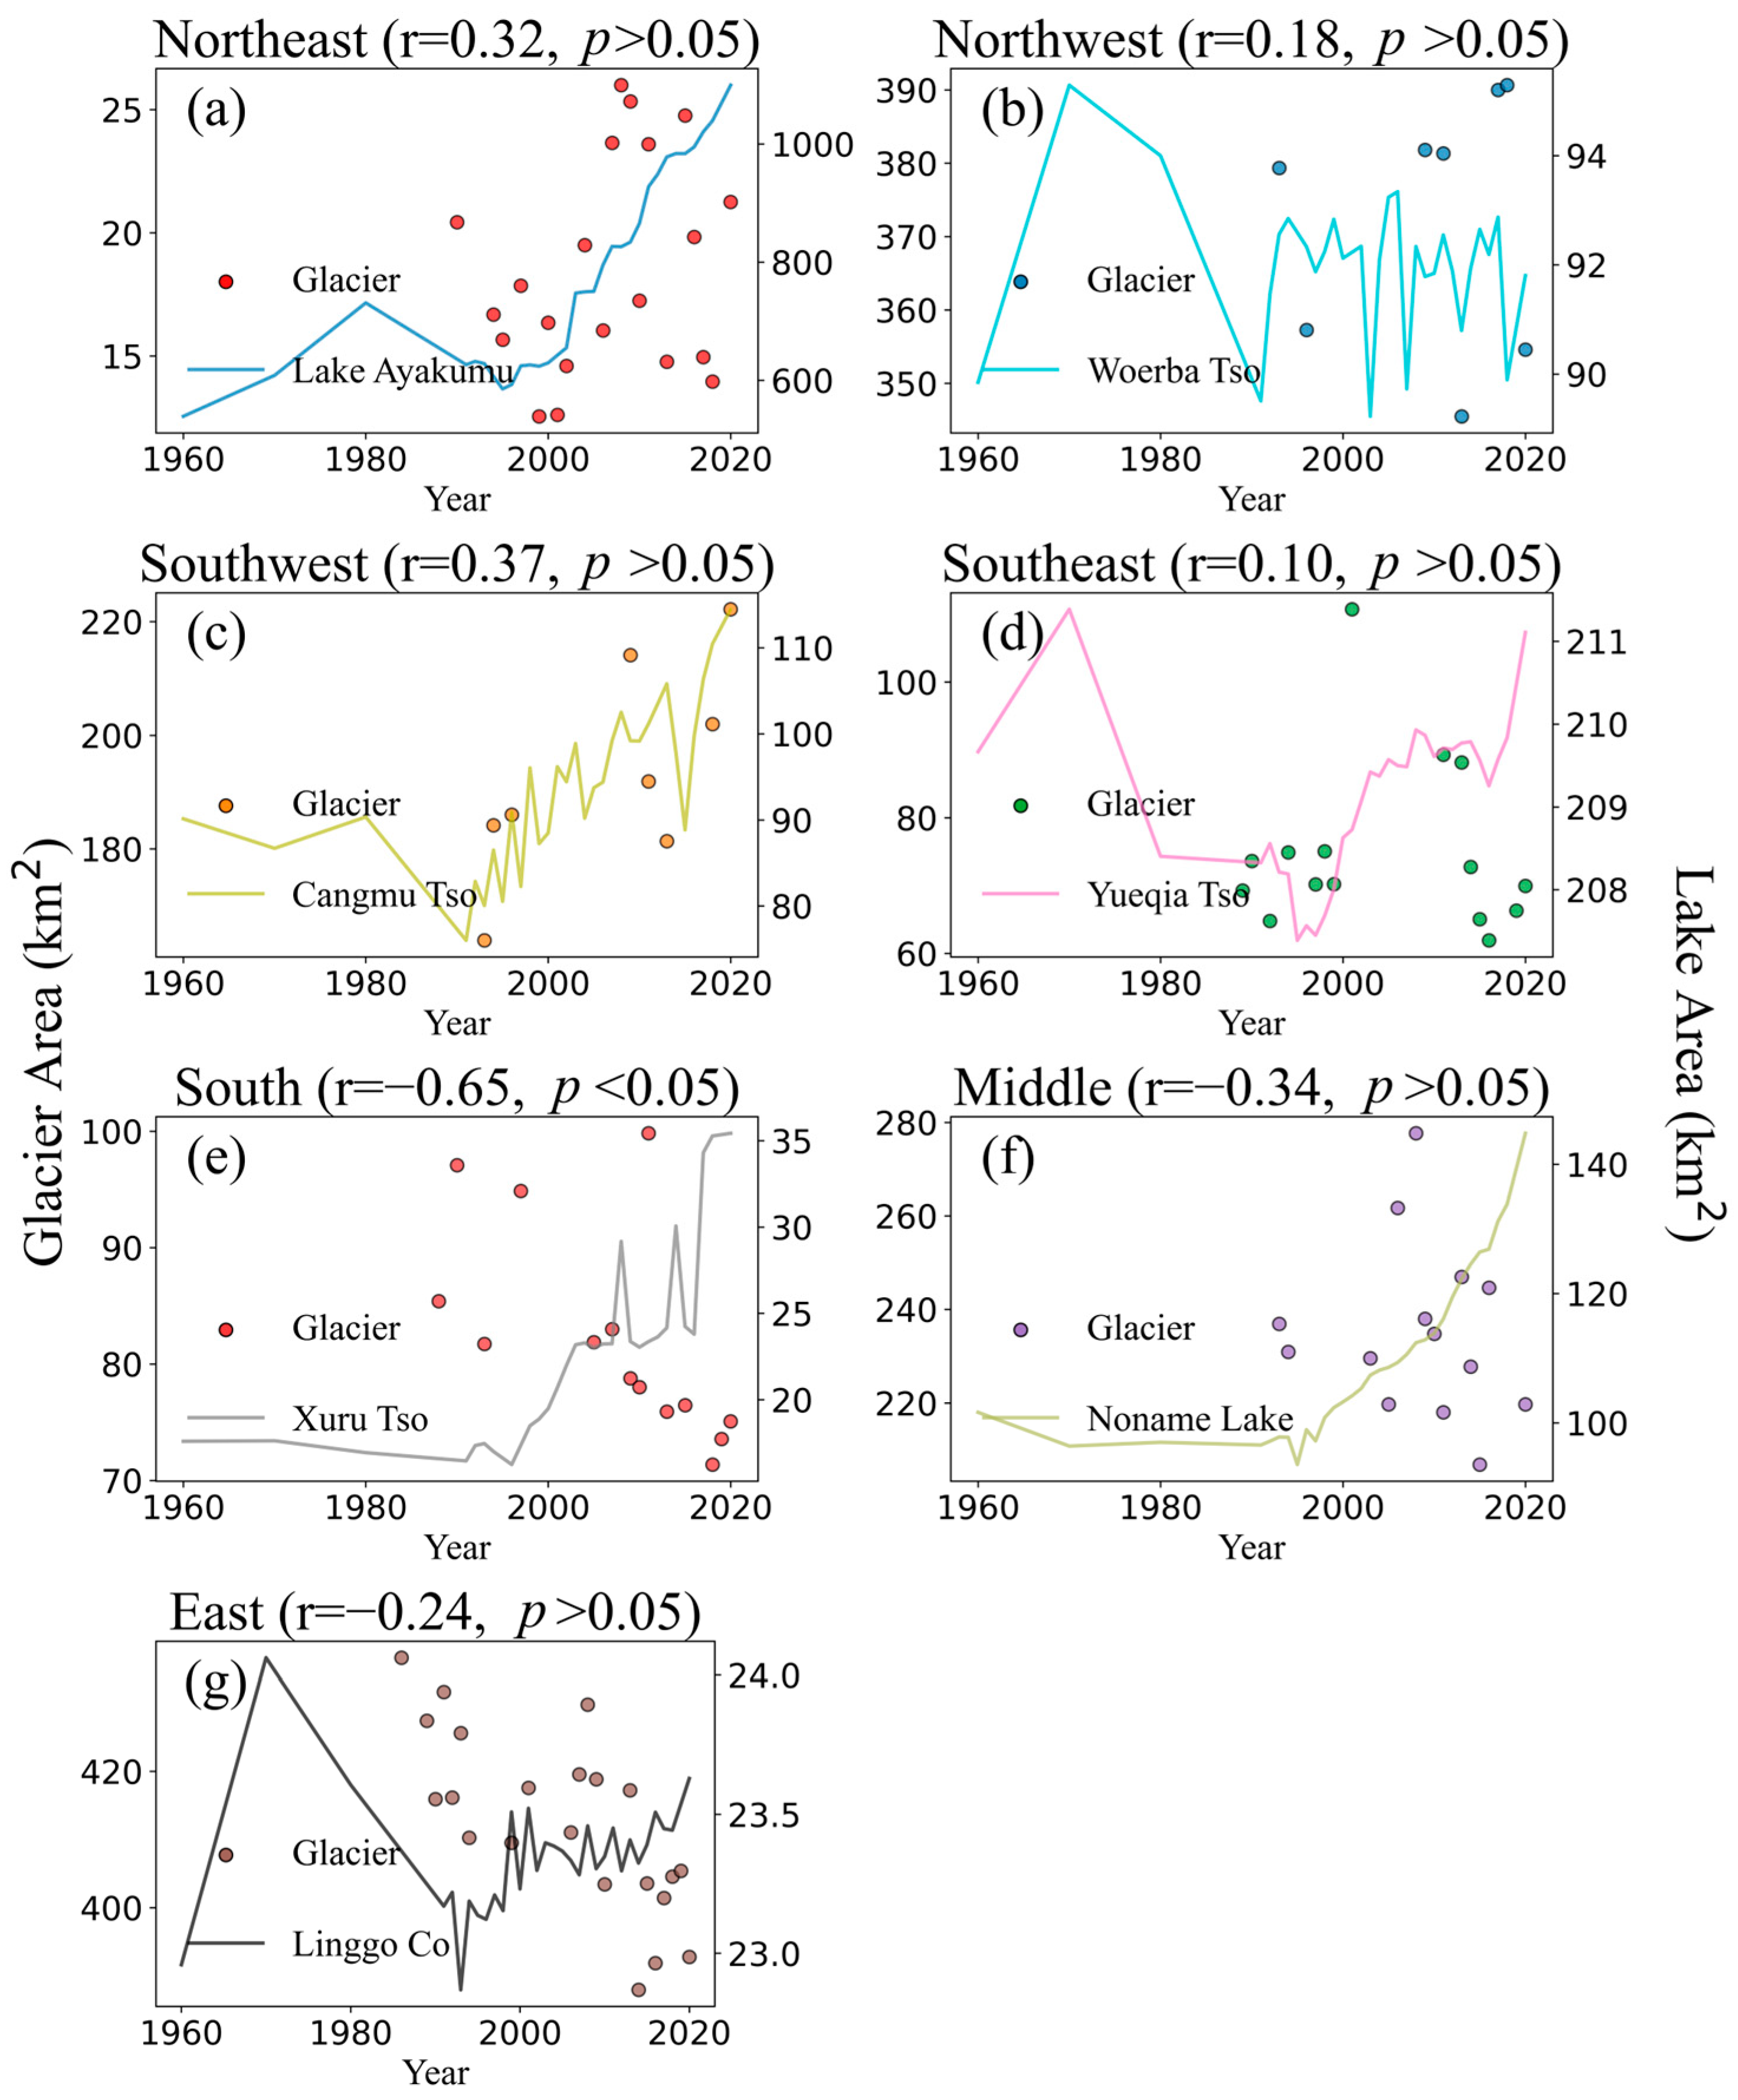
Figure 5.
Changes in the area of glaciers in each region and their relationship with the largest replenishing lake they feed over the past 60 years. Dots denote glacierized area, and the solid line denotes the lake area: (a) Lake Ayakumu in the northeast, (b) Woerba Tso in the northwest, (c) Cangmu Tso in the southwest, (d) Yueqia Tso in the southeast, (e) Xuru Tso in the south, (f) Noname Lake in the middle region, and (g) Linggo Co in the east.
Specifically, over the past several decades, the glacierized area on the northeastern CTP (Figure 5a) increased from 20.43 km2 to 30.25 km2, at a rate of +0.33 km2 per year (R2 = 0.45, p < 0.01). The northwestern CTP (Figure 5b) increased from 379.34 km2 to 390.64 km2, at a rate of +0.45 km2 per year (R2 = 0.01, p > 0.05). Similarly, in the southwestern region (Figure 5c), the glacierized area expanded significantly from 163.9 km2 to 222.19 km2, at a rate of +2.16 km2 per year (R2 = 0.53, p < 0.05).
In contrast, the southeastern region (Figure 5d) experienced a slight decline in glacierized area, from 69.26 km2 to 66.3 km2, at a rate of −0.1 km2 per year (R2 = 0.00, p > 0.05). The southern region (Figure 5e) showed a more pronounced decrease, with glacierized area shrinking from 85.4 km2 to 75.08 km2, at a rate of −0.32 km2 per year (R2 = 0.38, p < 0.05). The middle region (Figure 5f) also exhibited a decline, with glacierized area decreasing from 236.92 km2 to 219.68 km2, at a rate of −0.64 km2 per year (R2 = 0.02, p > 0.05). The most significant reduction was observed in the eastern region (Figure 5g), where glacierized area decreased from 436.55 km2 to 392.79 km2, at a rate of −1.29 km2 per year (R2 = 0.54, p < 0.05).
Then, we investigated the correlation between glacierized area and lake area. Given that glacial meltwater primarily replenishes nearby lakes, we focused on lakes in close proximity to the selected glacier regions. The results indicated that glaciers in the northwestern (Figure 5b), southwestern (Figure 5c), southeastern (Figure 5d), and middle (Figure 5f) regions of the CTP showed no significant positive correlations with their respective nearby lakes: Woerba Tso (r = 0.18, p > 0.05), Cangmu Tso (r = 0.37, p > 0.05), Yueqia Tso (r = 0.10, p > 0.05), and Noname Lake (r = −0.34, p > 0.05). However, a significant positive correlation was observed between the glacier in the northeastern region (Figure 5a) and Lake Ayakumu (r = 0.35, p < 0.05). Notably, a significant negative correlation was found between the glacier in the southern region (Figure 5e) and Xuru Tso (r = −0.65, p < 0.05). In contrast, no significant negative correlation was detected between the glacier in the eastern region (Figure 5g) and Linggo Co (r = −0.24, p > 0.05).
In summary, while glacier changes exhibit regional variability across the CTP, they are unlikely to be the dominant driver of the widespread lake expansion observed on the plateau. The limited and region-specific correlations between glacierized area and lake area suggest that glacial meltwater plays a secondary role in influencing lake dynamics. Instead, other factors, such as precipitation changes or surface runoff may be more critical in driving the observed lake expansion. Detailed discussions on these potential mechanisms will be presented in the following section.
4. Discussion
4.1. The Relatively Minor Contribution of Glacial Meltwater to Lake Expansion
As illustrated in Figure 4, the distribution of glaciers on the CTP is relatively dispersed, with most glaciers exhibiting small spatial extents. However, lakes on the CTP are widely distributed, and many of them are not adjacent to glaciers. Given that glacier-fed lakes are primarily sustained by meltwater discharge from adjacent glaciers, we examined the temporal correlation between glacier and lake area fluctuations across seven regions mentioned in Section 3.2. Our results revealed that a significant negative correlation between glacier and lake areas was only observed in the southern CTP. Moreover, more than half of the lakes located near or connected to glaciers exhibited a positive correlation with glacierized area changes. It is suggested that glacier meltwater contributes to the expansion of certain glacier-fed lakes but has relatively less impact on the majority of the lakes across the CTP. Overall, changes in glacierized area do not align well with the widespread lake expansion observed across the CTP. Thus, our analysis indicates that glacier meltwater does not serve as the dominate factor driving the lake expansion observed across the CTP.
We identified 17 lakes where area changes exhibited a negative correlation with summer precipitation, as marked by dark blue in Figure 4. An anomalous decline in lake areas was observed in the R15 sub-basin (Figure 3b). Previous studies have attributed this phenomenon to the dam break of Zonag Lake [9,17,41]. By examining the spatial distribution of these 17 lakes, it is observed that two of them are located within the R07 sub-basin. As mentioned in the previous section, the R07 sub-basin is situated in the northeastern CTP, where the CV of precipitation is the highest in the eastern CTP. Monitoring results of glacierized area in this region also indicate a trend of glacier expansion, which aligns with the lake enlargement. Therefore, no significant correlation between glaciers and lakes was observed in R07. As illustrated in Figure 1, the R07 sub-basin is characterized by relatively low topographic elevation, averaging 2000 m, notably lower than the CTP’s mean elevation of approximately 4000 m. Consequently, the climate pattern in the R07 region differs markedly from those in most other sub-basins.
In addition, 9 of these 17 lakes are located in the Selin Co Basin (R13) and Nam Co Basin (R11) in the southeastern CTP. Previous studies on the quantitative water balance of lakes in the Nam Co Basin have indicated that glaciers contribute significantly to the lake dynamics in this region [12,42]. The glacier mass balance observations conducted by Liu et al. in the Selin Co basin demonstrated the limited contribution of glacial meltwater to lake expansion [43]. Our analysis further revealed weak correlations between precipitation and lake area within the basin, suggesting that precipitation makes a minor contribution to the changes in lake area, whereas human activities or extreme hydrological events may have exerted a significant impact on the lake area. Several factors support this interpretation: (1) the Selin Co basin experiences relatively intensive human activities compared to other regions of the CTP, including road construction across river channels [26]; (2) research by Lei et al. [44] documented that the expansion of Selin Co triggered dam-failure events, causing substantial water discharge into surrounding lakes and damaging roads; (3) subsequent human interventions, including the obstruction of the outlet with rocks for the purpose of road maintenance, have notably modified the hydrological connectivity within the basin. These interactions between extreme hydrological events and human interventions have significantly impacted the hydrological conditions in the Selin Co basin.
4.2. Atmospheric Circulation Dynamics as the Dominant Factor in CTP Lake Expansion
Based on the preceding analysis, we have ruled out glacier meltwater as the primary factor contributing to the lake expansion on the CTP. In light of the substantial positive correlation observed between lake area and summer precipitation as presented in the results (Figure 2b), it is apparent that summer precipitation on the CTP has likely served as one of the most critical drivers of the rapid expansion witnessed in the majority of lakes over recent decades. Previous research has demonstrated that precipitation variability aligns with atmospheric circulation patterns. Consequently, the marked increase in summer precipitation across the CTP may correspond to shifts in large-scale atmospheric circulation systems [15]. Analysis of summer precipitation variations identifies a significant regime shift around 1998/1999 (Figure 2b). Based on this shift, we delineated two periods (1960–1998 and 1999–2020), subsequently termed the ’low-rainfall’ and ’high-rainfall’ periods.
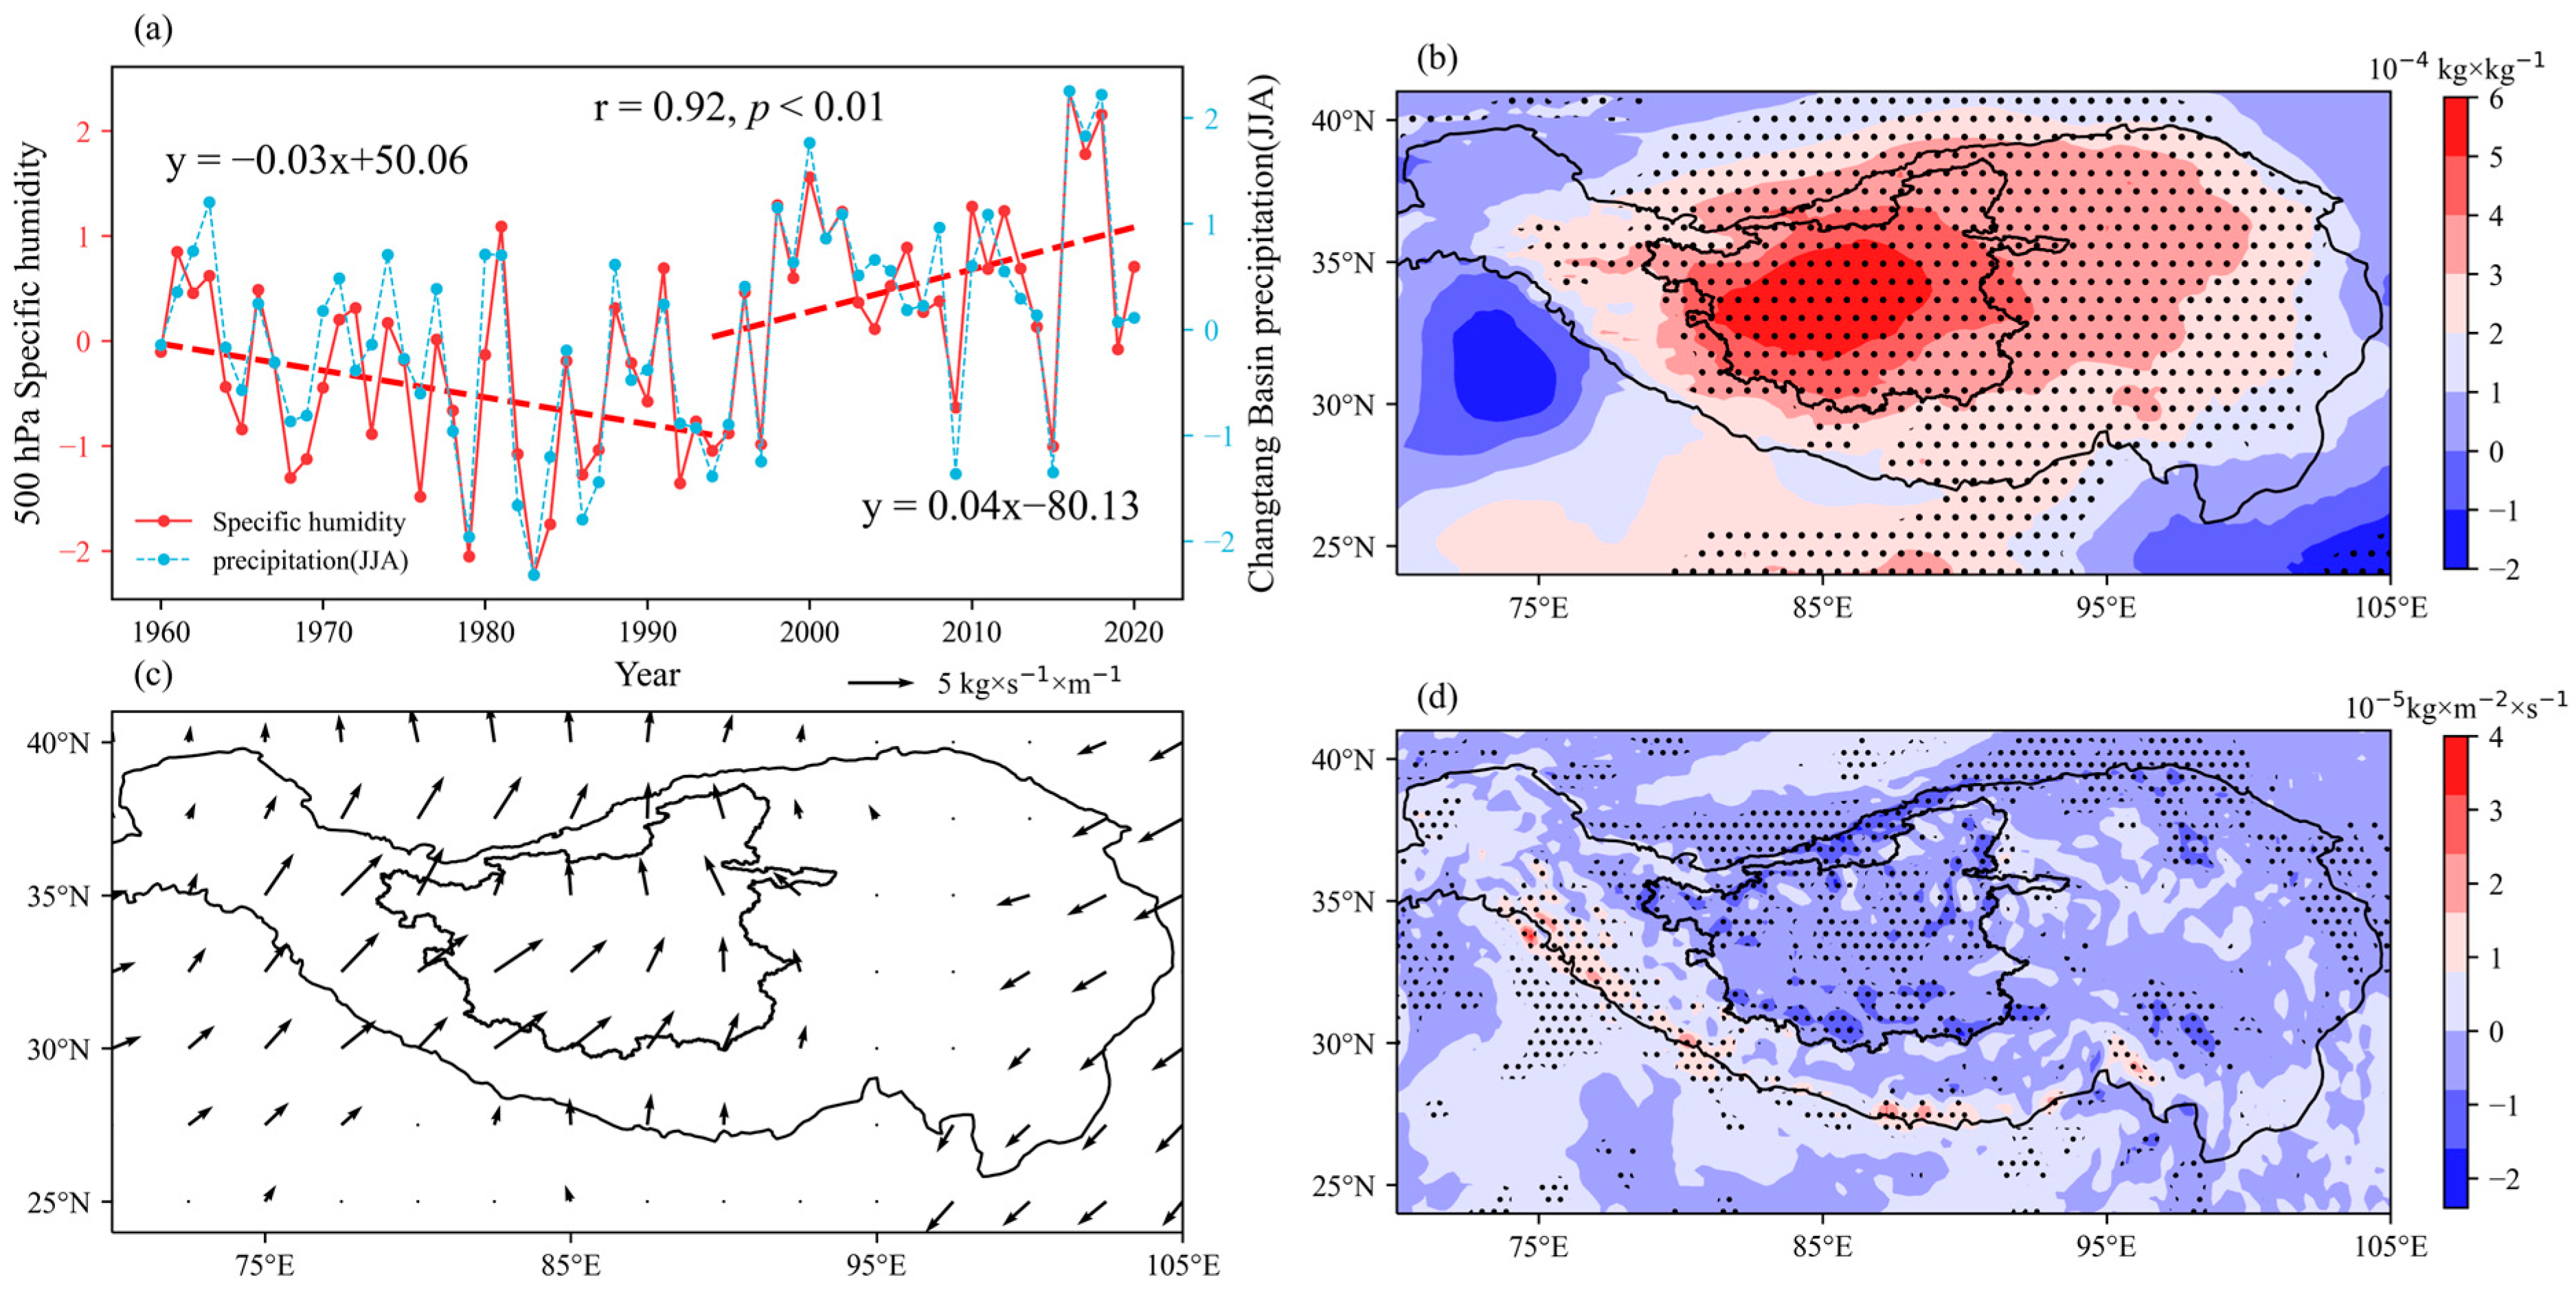
Water vapor serves as a crucial factor in precipitation, and alterations in atmospheric humidity exert a significant influence on precipitation patterns [45]. The present study reveals that, over the past six decades, there has been a notably positive correlation between summer precipitation and Qa at 500 hPa over the CTP, with a correlation coefficient of 0.92 and a p-value less than 0.01 (Figure 6a). Consistent with the precipitation phase division, the Qa variations in the CTP can be delineated into two distinct periods: a declining trend from the 1960s to the late 1990s, followed by an ascending trend from the late 1990s to 2020. This pattern aligns closely with the observed trends during the higher and lower rainfall periods.

Figure 6.
(a) The relationship between Qa of 500 hPa and precipitation, averaged over the CTP, from 1960 to 2020. (b) Composite Qa of 500 hPa between higher (1999–2020) and lower (1960–1998) rainfall periods (the former minus the latter). The composite summer water vapor flux (c) and its divergence (d) integrated from 500 hPa to 200 hPa between higher (1999–2020) and lower (1960–1998) rainfall periods (the former minus the latter). Only vectors of the U or V components with differences significant at the 95% confidence level are plotted. The black dots indicate the differences are significant at the 95% confidence level.
Further analysis of the spatial distribution of 500 hPa summer Qa during the higher and lower rainfall periods using composite analysis (Figure 6b) reveals that summer Qa significantly increased in most regions during the higher rainfall period compared to the lower rainfall period. The increase in Qa over the CTP was the most pronounced. In addition, we can clearly observe that there is a significant spatial difference in the increase in summer Qa over the CTP. From west to east across the CTP, the degree of increase in Qa gradually diminishes. This phenomenon provides a compelling explanation for the significant differences in summer precipitation variability between the two types of sub-basins in the CTP, as discussed earlier (Figure 3c,d).
The increase in summer Qa from the surface to the mid-troposphere is primarily due to enhanced atmospheric moisture, influenced mainly by moisture sources. To investigate the sources of water vapor contributing to increased atmospheric moisture during the higher rainfall period in the CTP, we employed the Eulerian method for water vapor budget analysis. We calculated the summer vertically integrated water vapor flux and its divergence from the 500 hPa to 200 hPa layer. Composite analysis was then used to examine the differences in moisture sources between the higher and lower rainfall periods. The results indicated that the summer vertical integration of water vapor flux divergence from 500 hPa to 200 hPa showed that during periods of higher rainfall, there was significantly stronger water vapor convergence over the CTP (Figure 6d). The primary source of this moisture anomaly is an increase in moisture from the southwest, originating from the Indian Ocean (Figure 6c). This indicates that the increase in summer Qa over the CTP during periods of higher rainfall has been primarily due to the strengthening of the ISM. Additionally, previous studies on the moisture source and transport in the TP indicate that the southwestern moisture source from the Indian Ocean, primarily dominated by the ISM, serves as a major pathway for water vapor [46,47,48,49,50,51].
In addition to the influence of the ISM on precipitation over the CTP, the East Asian subtropical westerly jet (EASWJ) also constitutes a significant contributing factor [15,52]. To quantify the intensity index of the EASWJ during summer over the past 60 years, we calculated the magnitude of the maximum zonal wind speed at 200 hPa, averaged longitudinally over its activity range (30° N~55° N, 80° E~140° E).
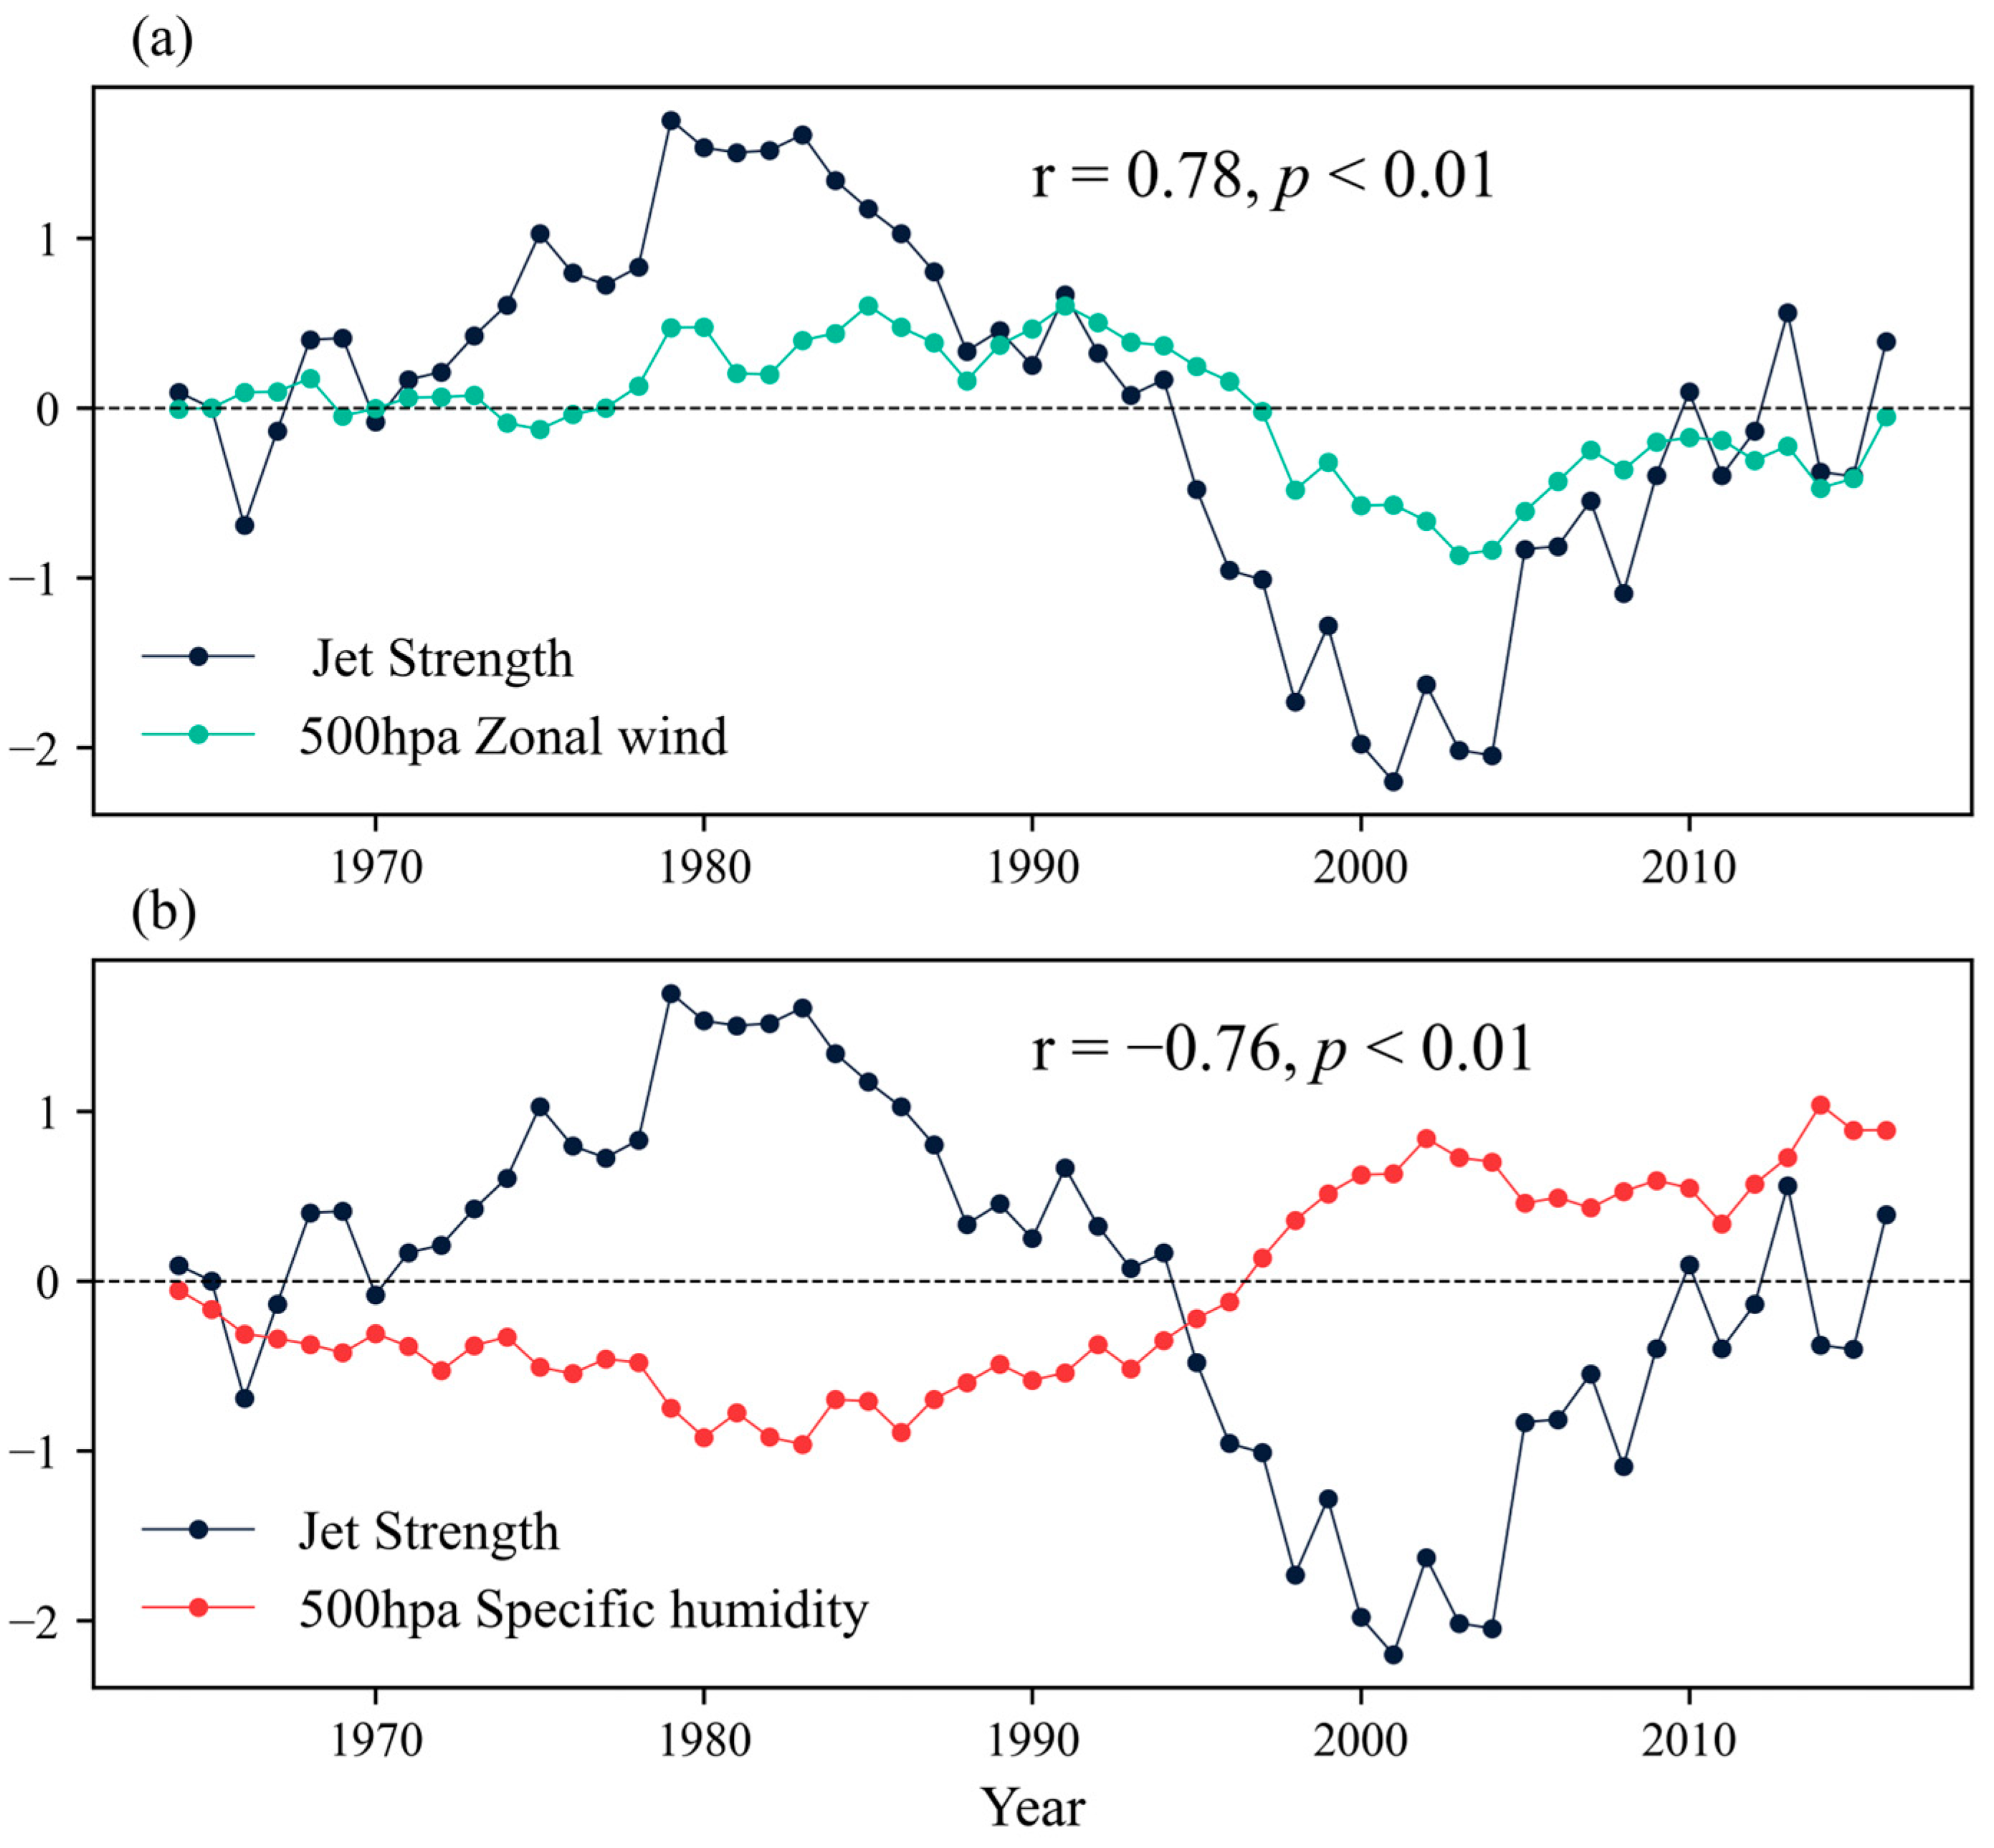
Based on the calculated jet intensity index, the EASWJ exhibited two distinct phases: an anomalously strong phase (1960s to late 1990s) followed by an anomalously weak phase (late 1990s to 2020). Analysis of the jet intensity in relation to the zonal wind at 500 hPa (Figure 7a) and Qa at 500 hPa (Figure 7b) shows that during periods of anomalously strong EASWJ, the 500 hPa zonal wind also exhibits strong anomalies, while both Qa of 500 hPa and precipitation are anomalously weak. Conversely, during periods of anomalously weak EASWJ, the opposite trends are observed. Notably, the periods of anomalously strong and weak jet intensity align with the lower (1960–1998) and higher (1999–2020) rainfall periods on the CTP, respectively. The significant increase in 500 hPa summer Qa in the late 1990s, concurrent with the anomalously weak intensity of the EASWJ, resulted in a weaker zonal wind at 500 hPa over the CTP during summer. This led to increased convergence of water vapor over the CTP, culminating in more summer precipitation and the formation of the higher rainfall period, which drove the rapid expansion of lakes in the CTP.

Figure 7.
The relationship between the intensity of the subtropical jet stream and summer 500 hPa (a) zonal wind; (b) specific humidity, averaged over the CTP from 1960 to 2020.
4.3. Divergent Hydrological Trends: Accelerated Lake Expansion in the CTP Versus Global Lake Contraction
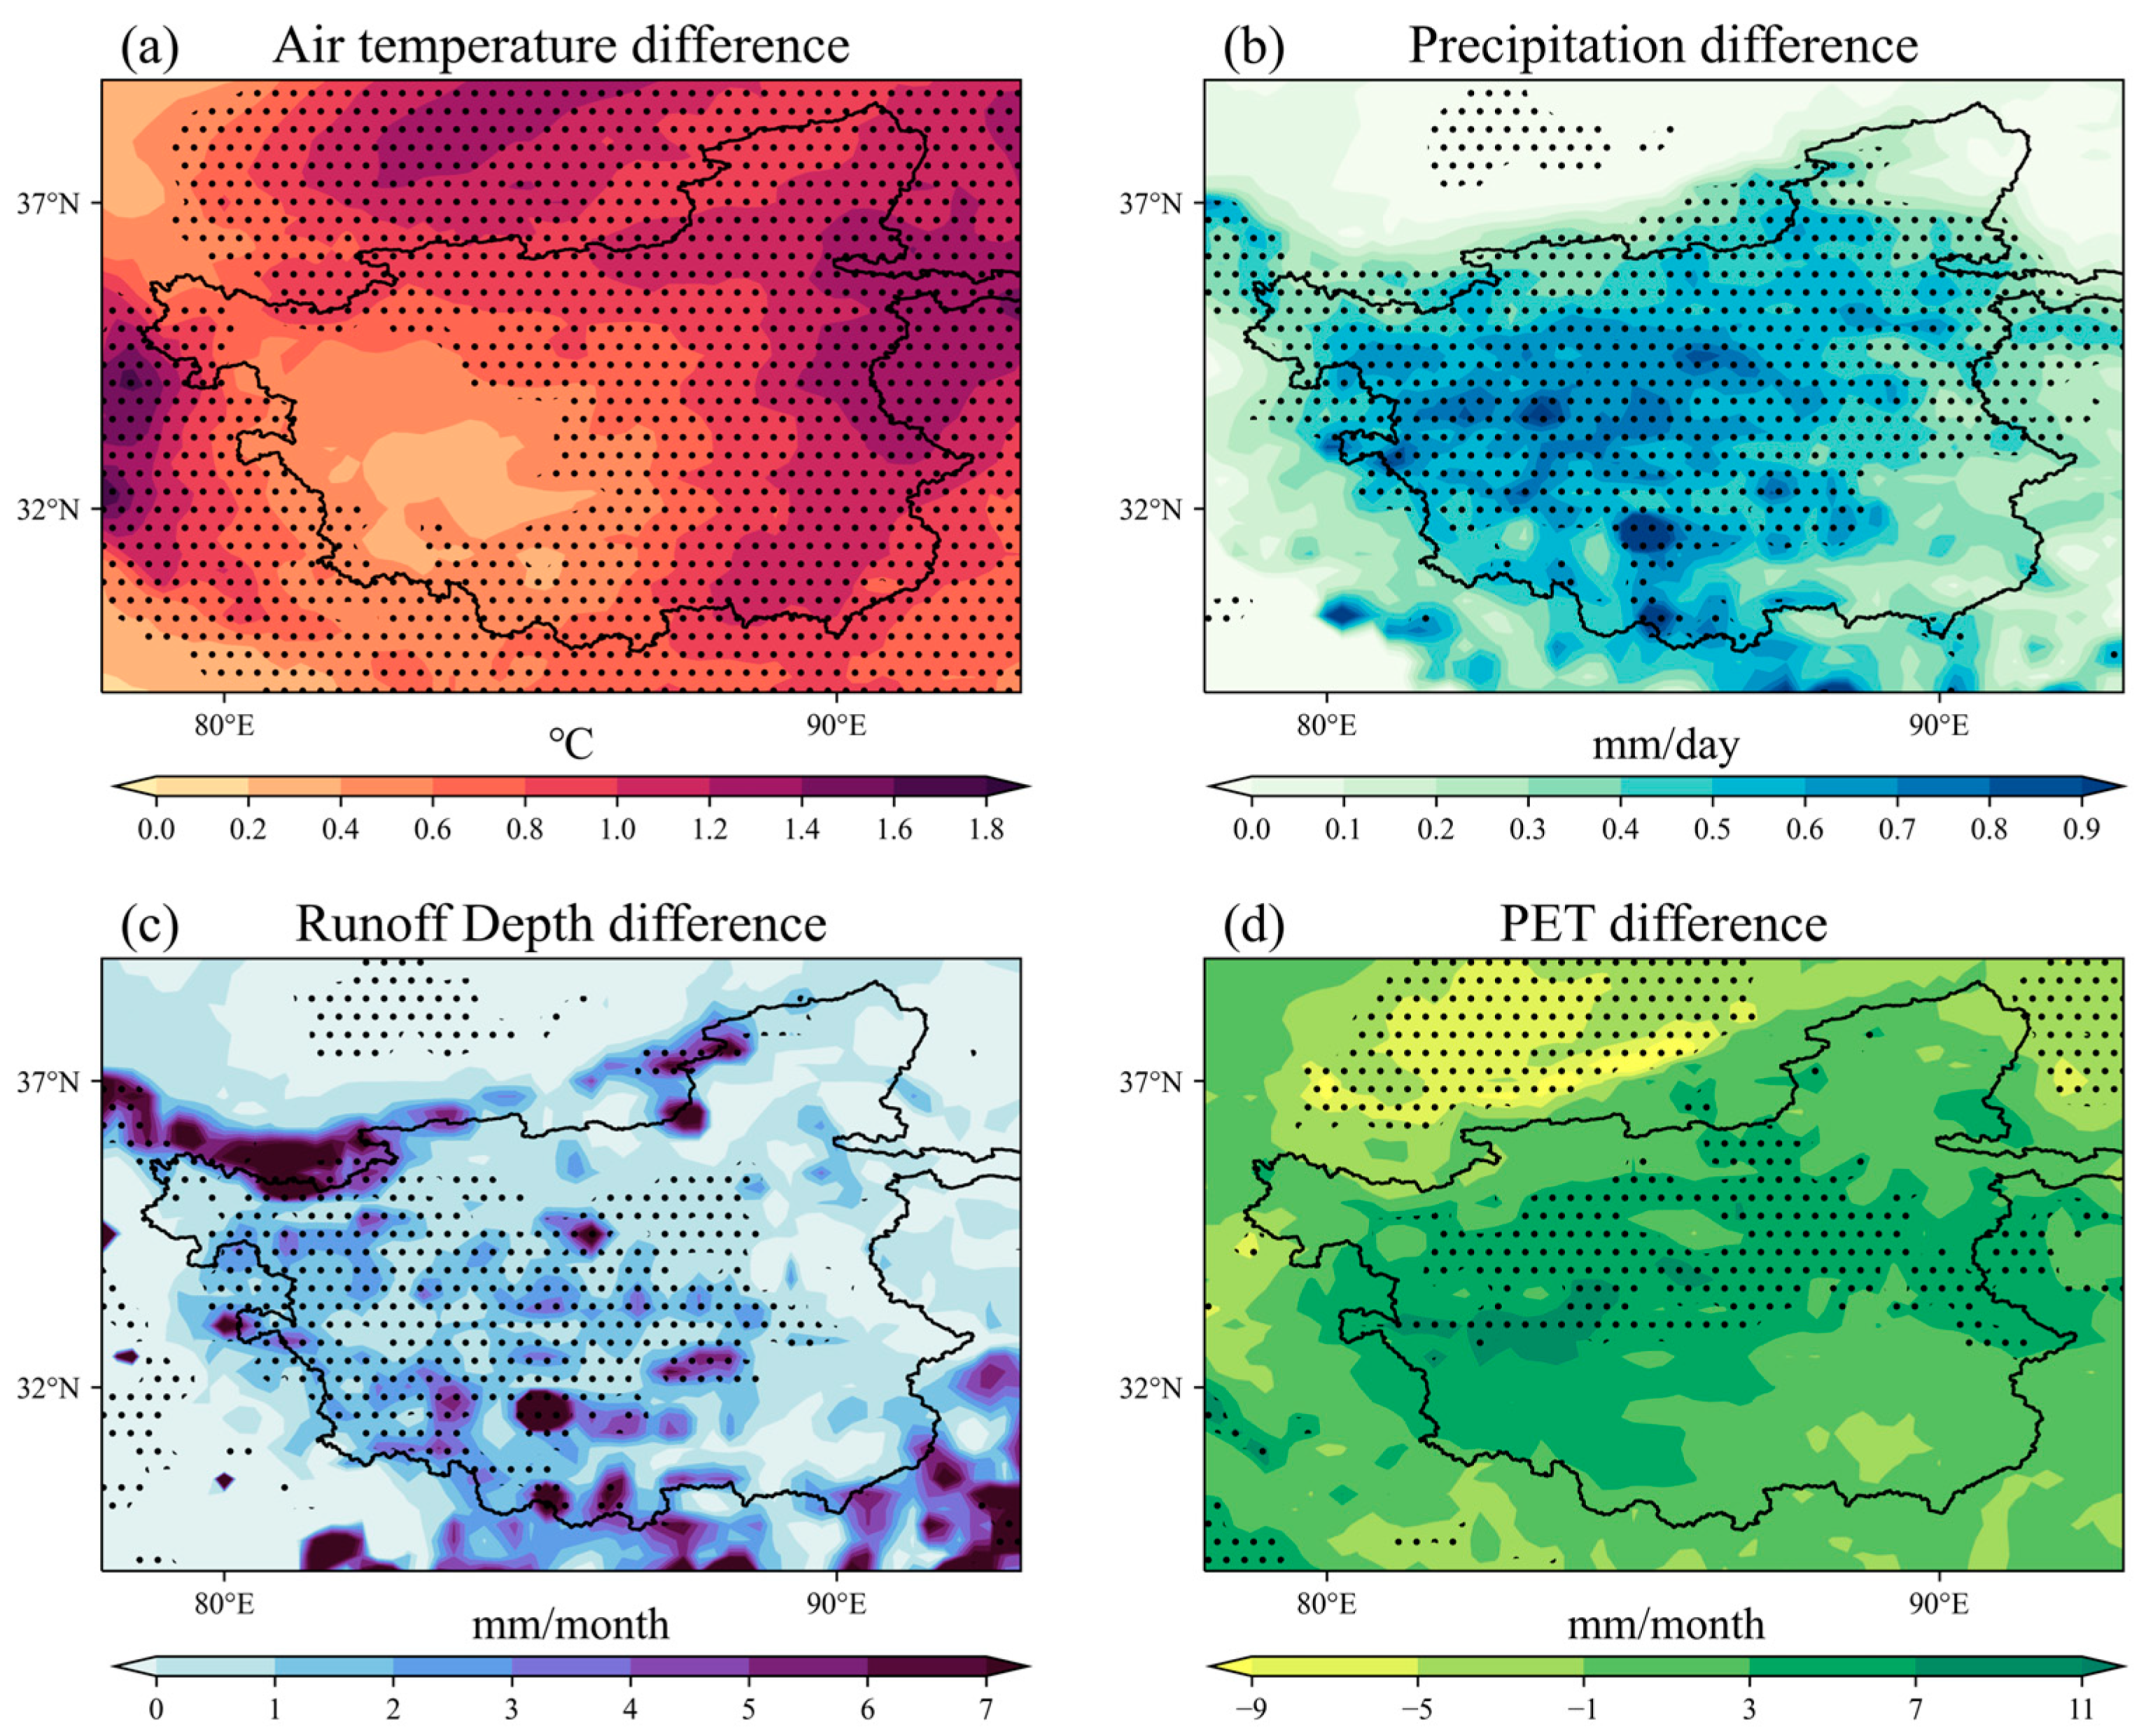
Our results have demonstrated that the precipitation variability in the western CTP is greater than in the eastern part during the period of lake expansion. We further investigated the distributions of spatial differences about air temperature, precipitation, surface runoff, and PET from late 1990s to 2020. During this lake expansion period, the western sub-basins (R01–R09) exhibited higher variability, while the western CTP showed a smaller temperature increase (Figure 8a) than the eastern CTP. Furthermore, summer precipitation (Figure 8b) exhibited a distinct spatial pattern, with a greater increase in the western CTP compared to the eastern CTP. This result aligns with the earlier classification based on the CV of precipitation. This spatial contrast in precipitation and temperature changes has led to a more pronounced increase in humidity in the western CTP, providing an explanation for the observed expansion of glacierized area in the western regions over the past few decades. Additionally, the spatial pattern of surface runoff changes (Figure 8c) closely mirrors that of precipitation, strongly supporting the conclusion that surface runoff is primarily driven by precipitation. And, no significant spatial difference was observed for PET changes (Figure 8d). Although PET may influence lake water balance on the CTP, its overall impact remains relatively minor [53].

Figure 8.
Differences in (a) air temperature, (b) precipitation, (c) surface runoff depth, (d) PET in summer (JJA) between higher and lower rainfall periods. The dotted areas indicate the differences are significant at the 95% confidence level.
These findings highlight the critical role of spatial heterogeneity in shaping hydroclimatic responses across the CTP. The enhanced precipitation variability and contrasting temperature trends between western and eastern regions suggest that climate warming does not uniformly affect glacial and hydrological processes, challenging simplified regionalization assumptions. The dominant control of precipitation over runoff underscores the vulnerability of western CTP water resources to shifting atmospheric circulation patterns, while the limited PET impact reinforces the primacy of moisture availability in recent lake expansions.
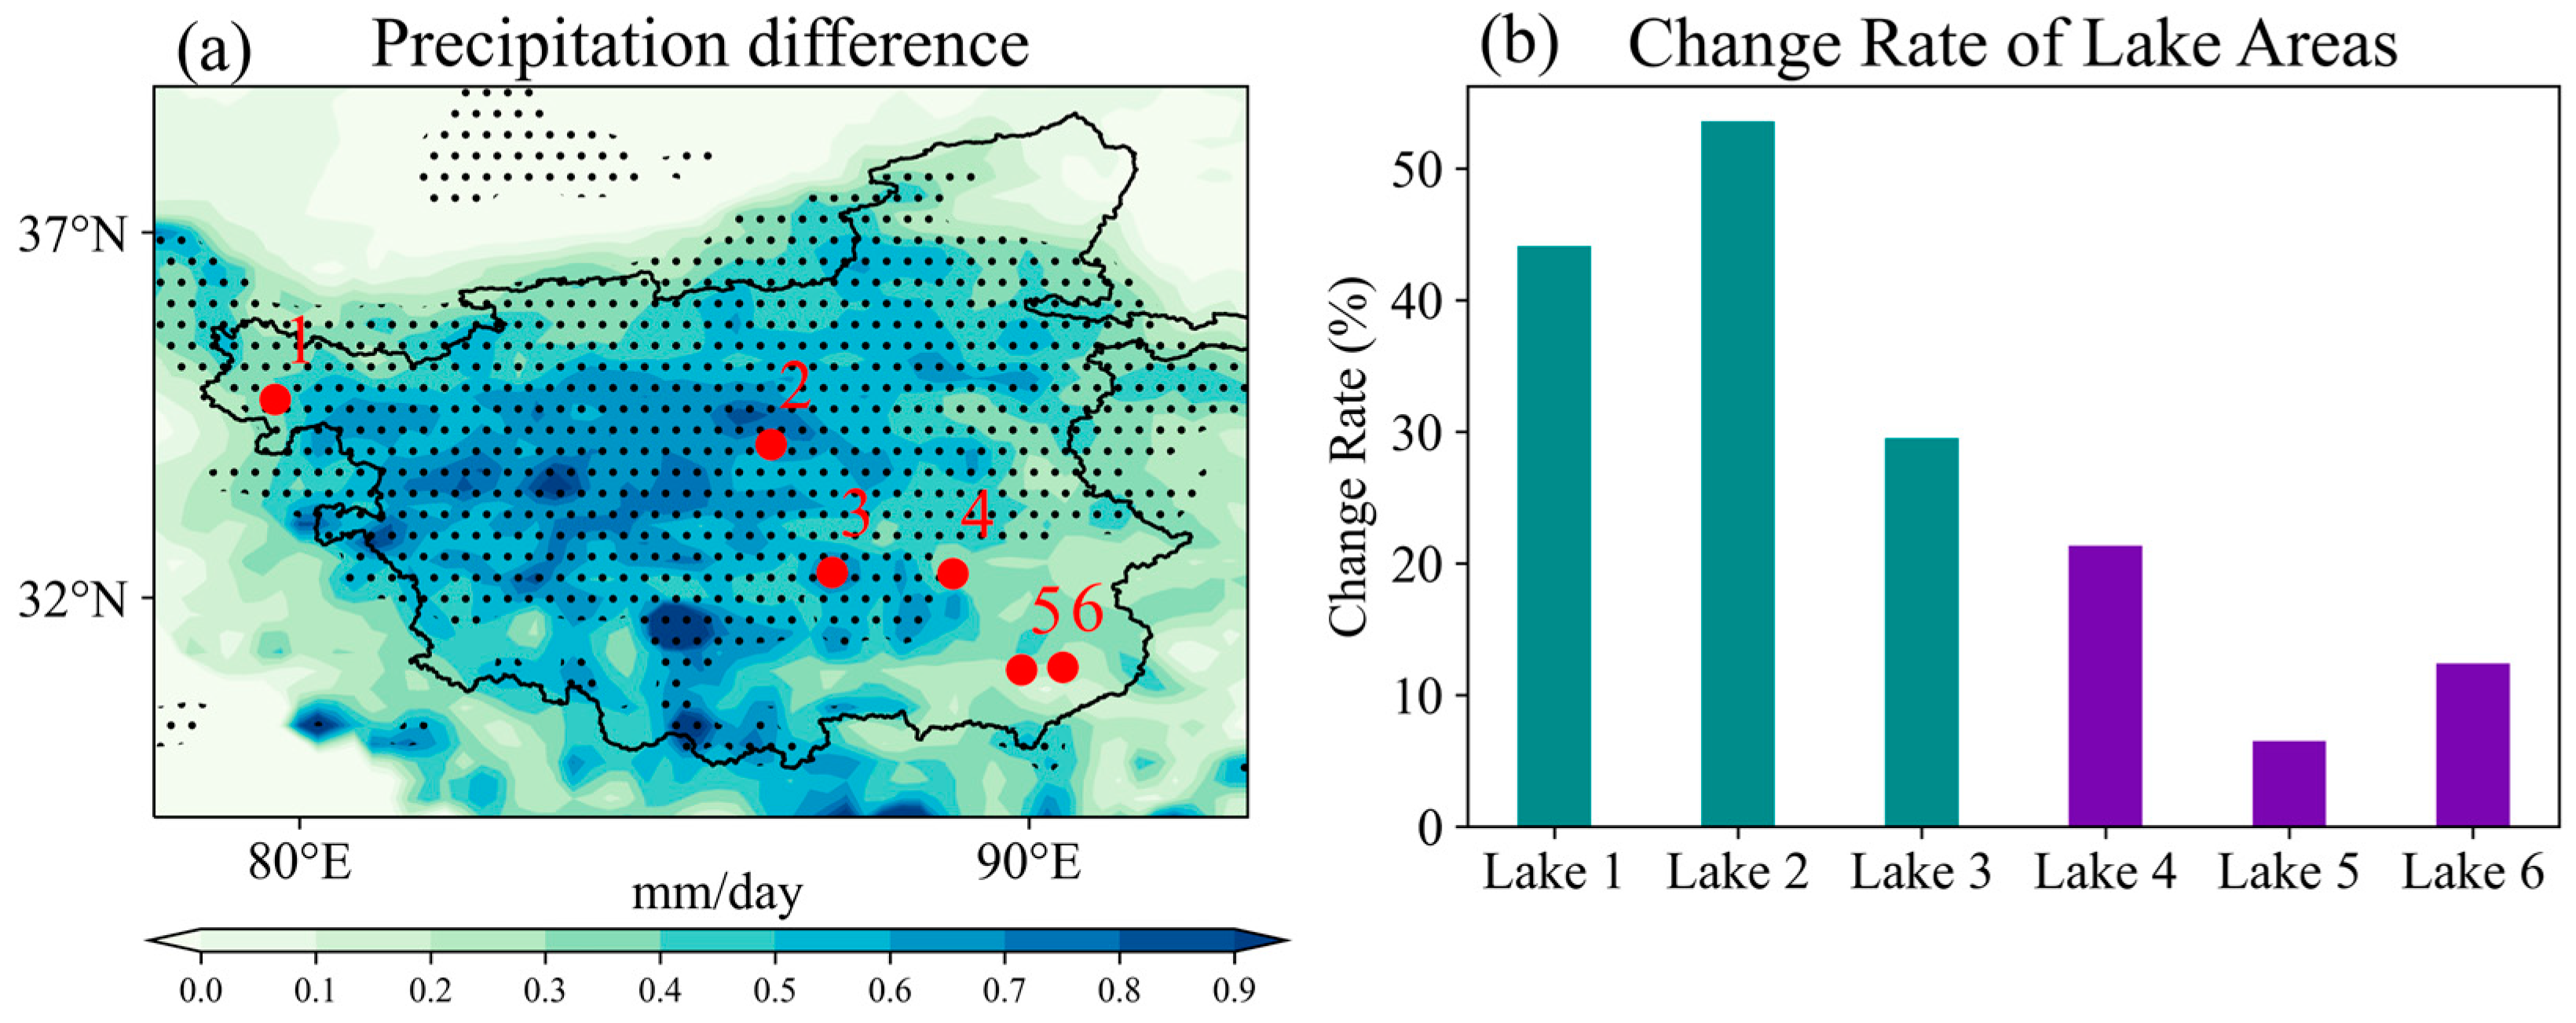
To further validate our findings, we performed an additional analysis focusing on six specific lakes (see Table 2) with comparable sizes and topographic conditions but situated in regions exhibiting distinct summer precipitation patterns (see Figure 9). Our results demonstrate significant spatial heterogeneity in precipitation increases across the CTP, with more pronounced increases observed in the central and western regions compared to the eastern regions. Notably, lakes 1–3 (Figure 9a), which experienced higher precipitation increments, displayed faster expansion rates than lakes 4–6 (Figure 9a), where precipitation increments were lower. In particular, Lake 2, located in the area with the highest precipitation increase, exhibited the most rapid expansion rate, whereas Lakes 5 and 6, situated in areas with the smallest precipitation increase, showed the slowest expansion rates (Figure 9b). This pronounced correlation between lake expansion rates and precipitation increase provides compelling evidence supporting our conclusion that precipitation anomalies constitute the primary driver of lake expansion in the CTP. The observed spatial differences in climatic factors highlight the complex interplay between temperature, precipitation, and hydrological processes on the CTP. These findings underscore the importance of considering spatial heterogeneity when studying climate-driven environmental changes in high-altitude regions.
Table 2.
Location information of six specific lakes depicted in Figure 9a.

Figure 9.
(a) Locations of the six specific lakes mentioned in Section 4.3, and (b) change rates of average areas between two periods.
These quantified relationships demonstrate a robust causal linkage between precipitation anomalies and lake expansion magnitudes, effectively decoupling temperature effects through spatial comparison. The observed west–east hydroclimatic gradient further highlights the atmospheric condition controls on moisture transport. Crucially, the tight coupling between precipitation and surface runoff patterns (R = 0.72, p < 0.01) confirms dominantly precipitation-fed hydrological regimes, with limited evapotranspiration buffering capacity characteristic of ultra-arid alpine environments.
5. Conclusions
The contrasting phenomenon of rapid lake expansion on the CTP against the backdrop of global LWS decline underscores the critical role of region-specific climatic drivers. This study conclusively demonstrates that precipitation anomalies, driven by atmospheric circulation dynamics, serve as the dominant mechanism governing lake area variations across the CTP. While glacial meltwater exhibits localized influence on glacier in the southern region, its limited spatial coverage precludes it from being a dominate driver for the lake area on the CTP. The composite analysis of intensified ISM activity and a weakened EASWJ stream establish favorable moisture transport pathways, enhancing Qa at mid-tropospheric levels and promoting precipitation amplification. These processes collectively explain the observed spatial heterogeneity in lake expansion rates, with precipitation-enhanced regions exhibiting the most pronounced hydrological responses. Our findings reconcile the apparent paradox between the CTP’s lake expansion trend and global lake shrinkage patterns, emphasizing the plateau’s unique sensitivity to atmospheric circulation reorganization.
Our integrated approach overcomes previous methodological limitations by simultaneously considering surface hydrological changes and atmospheric processes, offering new insights into the complex interactions within the lake–glacier–atmosphere system on the CTP. Furthermore, while these processes occur naturally, understanding their mechanisms is crucial for predicting and managing potential ecological consequences. The continued expansion of lake areas may lead to significant landscape reorganization, affecting local ecosystems and infrastructure. Therefore, investigating these changes provides essential insights for developing adaptive management strategies in this ecologically sensitive region.
Author Contributions
Conceptualization, D.Z. and Y.P.; methodology, D.Z.; software, D.Z.; validation, J.H., Y.N. and D.Z.; formal analysis, D.Z.; investigation, C.J.; resources, Y.P.; data curation, D.Z.; writing—original draft preparation, D.Z.; writing—review and editing, Y.P.; visualization, D.Z.; supervision, Y.P.; project administration, Y.P.; funding acquisition, Y.P. All authors have read and agreed to the published version of the manuscript.
Funding
This research was supported by the National Natural Science Foundation of China (Grant No. 42171160).
Institutional Review Board Statement
Not applicable.
Informed Consent Statement
Not applicable.
Data Availability Statement
The original lake area data presented in the study are openly available in A Big Earth Data Platform for Three Poles (http://poles.tpdc.ac.cn/en/, accessed on 12 January 2025) and scientific data (https://www.nature.com/sdata/, accessed on 12 January 2025). The ERA5 reanalysis data were provided by ECMWF (https://cds.climate.copernicus.eu/, accessed on 27 January 2025). The HydroSHEDS database can be found in website: https://www.hydrosheds.org/ (accessed on 16 January 2025).
Acknowledgments
We thank the USGS for providing the Landsat data (https://earthexplorer.usgs.gov/, accessed on 22 September 2024) and the Google Earth Engine provide data processing support (https://earthengine.google.com/, accessed on 22 September 2024).
Conflicts of Interest
The authors declare no conflicts of interest.
References
- Da, W.; Rana, S.K.; Bawa, K.; Kunte, K.; Wang, Z. Roof of the world: Home and border in the genomic era. Mol. Ecol. Resour. 2023, 25, e13827. [Google Scholar] [CrossRef]
- Qiu, J. China: The third pole. Nature 2008, 454, 393–397. [Google Scholar] [CrossRef] [PubMed]
- Pritchard, H.D. Asia’s shrinking glaciers protect large populations from drought stress. Nature 2019, 569, 649–654. [Google Scholar] [CrossRef] [PubMed]
- Xiang, L.; Wang, H.; Steffen, H.; Wu, P.; Jia, L.; Jiang, L.; Shen, Q. Groundwater storage changes in the Tibetan Plateau and adjacent areas revealed from GRACE satellite gravity data. Earth Planet. Sci. Lett. 2016, 449, 228–239. [Google Scholar] [CrossRef]
- Yao, T.; Bolch, T.; Chen, D.; Gao, J.; Immerzeel, W.; Piao, S.; Su, F.; Thompson, L.; Wada, Y.; Wang, L. The imbalance of the Asian water tower. Nat. Rev. Earth Environ. 2022, 3, 618–632. [Google Scholar] [CrossRef]
- Tian, F.; Nan, Y.; Ni, G.; Yang, L.; Tang, Q.; Grey, D. Is the Tibetan Plateau really a water tower? Hydrol. Process. 2024, 38, e15103. [Google Scholar] [CrossRef]
- Chen, W.; Liu, Y.; Zhang, G.; Yang, K.; Zhou, T.; Wang, J.; Shum, C.K. What Controls Lake Contraction and Then Expansion in Tibetan Plateau’s Endorheic Basin Over the Past Half Century? Geophys. Res. Lett. 2022, 49, e2022GL101200. [Google Scholar] [CrossRef]
- Immerzeel, W.W.; Lutz, A.F.; Andrade, M.; Bahl, A.; Biemans, H.; Bolch, T.; Hyde, S.; Brumby, S.; Davies, B.; Elmore, A. Importance and vulnerability of the world’s water towers. Nature 2020, 577, 364–369. [Google Scholar] [CrossRef]
- Yao, F.; Livneh, B.; Rajagopalan, B.; Wang, J.; Crétaux, J.-F.; Wada, Y.; Berge-Nguyen, M. Satellites reveal widespread decline in global lake water storage. Science 2023, 380, 743–749. [Google Scholar] [CrossRef]
- Zhang, G.; Luo, W.; Chen, W.; Zheng, G. A robust but variable lake expansion on the Tibetan Plateau. Sci. Bull. 2019, 64, 1306–1309. [Google Scholar] [CrossRef]
- Pu, Y.; Zhan, M.; Shao, X.; Werne, J.P.; Meyers, P.A.; Yao, J.; Zhi, D. Changes in lake area and water level in response to hydroclimate variations in the source area of the Yellow River: A case study from Lake Ngoring. Front. Earth Sci. 2023, 17, 920–932. [Google Scholar] [CrossRef]
- Zhu, L.; Xie, M.; Wu, Y. Quantitative analysis of lake area variations and the influence factors from 1971 to 2004 in the Nam Co basin of the Tibetan Plateau. Chin. Sci. Bull. 2010, 55, 1294–1303. [Google Scholar] [CrossRef]
- Lei, Y.; Yao, T.; Yi, C.; Wang, W.; Sheng, Y.; Li, J.; Joswiak, D. Glacier mass loss induced the rapid growth of Linggo Co on the central Tibetan Plateau. J. Glaciol. 2012, 58, 177–184. [Google Scholar] [CrossRef]
- Song, C.; Huang, B.; Richards, K.; Ke, L.; Hien Phan, V. Accelerated lake expansion on the Tibetan Plateau in the 2000s: Induced by glacial melting or other processes? Water Resour. Res. 2014, 50, 3170–3186. [Google Scholar] [CrossRef]
- Lei, Y.; Yang, K.; Wang, B.; Sheng, Y.; Bird, B.W.; Zhang, G.; Tian, L. Response of inland lake dynamics over the Tibetan Plateau to climate change. Clim. Change 2014, 125, 281–290. [Google Scholar] [CrossRef]
- Zhang, G.; Yao, T.; Shum, C.; Yi, S.; Yang, K.; Xie, H.; Feng, W.; Bolch, T.; Wang, L.; Behrangi, A. Lake volume and groundwater storage variations in Tibetan Plateau’s endorheic basin. Geophys. Res. Lett. 2017, 44, 5550–5560. [Google Scholar] [CrossRef]
- Li, M.; Weng, B.; Yan, D.; Bi, W.; Wang, H. Variation trends and attribution analysis of lakes in the Qiangtang Plateau, the Endorheic Basin of the Tibetan Plateau. Sci. Total Environ. 2022, 837, 155595. [Google Scholar] [CrossRef]
- Wang, L.; Wang, J.; Wang, L.; Zhu, L.; Li, X. Lake evaporation and its effects on basin evapotranspiration and lake water storage on the inner Tibetan Plateau. Water Resour. Res. 2023, 59, e2022WR034030. [Google Scholar] [CrossRef]
- Biskop, S.; Maussion, F.; Krause, P.; Fink, M. Differences in the water-balance components of four lakes in the southern-central Tibetan Plateau. Hydrol. Earth Syst. Sci. 2016, 20, 209–225. [Google Scholar] [CrossRef]
- Zhou, J.; Wang, L.; Zhang, Y.; Guo, Y.; Li, X.; Liu, W. Exploring the water storage changes in the largest lake (Selin Co) over the T ibetan P lateau during 2003–2012 from a basin-wide hydrological modeling. Water Resour. Res. 2015, 51, 8060–8086. [Google Scholar] [CrossRef]
- Vystavna, Y.; Harjung, A.; Monteiro, L.R.; Matiatos, I.; Wassenaar, L.I. Stable isotopes in global lakes integrate catchment and climatic controls on evaporation. Nat. Commun. 2021, 12, 7224. [Google Scholar] [CrossRef] [PubMed]
- Zhou, J.; Wang, L.; Zhong, X.; Yao, T.; Qi, J.; Wang, Y.; Xue, Y. Quantifying the major drivers for the expanding lakes in the interior Tibetan Plateau. Sci. Bull. 2022, 67, 474–478. [Google Scholar] [CrossRef] [PubMed]
- Song, C.; Sheng, Y.; Zhan, S.; Wang, J.; Ke, L.; Liu, K. Impact of amplified evaporation due to lake expansion on the water budget across the inner Tibetan Plateau. Int. J. Climatol. 2020, 40, 2091–2105. [Google Scholar] [CrossRef]
- Lazhu; Yang, K.; Wang, J.; Lei, Y.; Chen, Y.; Zhu, L.; Ding, B.; Qin, J. Quantifying evaporation and its decadal change for Lake Nam Co, central Tibetan Plateau. J. Geophys. Res.-Atmos. 2016, 121, 7578–7591. [Google Scholar] [CrossRef]
- Ma, N.; Szilagyi, J.; Niu, G.-Y.; Zhang, Y.; Zhang, T.; Wang, B.; Wu, Y. Evaporation variability of Nam Co Lake in the Tibetan Plateau and its role in recent rapid lake expansion. J. Hydrol. (Amst.) 2016, 537, 27–35. [Google Scholar] [CrossRef]
- Xu, F.; Zhang, G.; Woolway, R.I.; Yang, K.; Wada, Y.; Wang, J.; Crétaux, J.-F. Widespread societal and ecological impacts from projected Tibetan Plateau lake expansion. Nat. Geosci. 2024, 17, 516–523. [Google Scholar] [CrossRef]
- Jia, B.; Wang, L.; Xie, Z. Increasing lake water storage on the Inner Tibetan Plateau under climate change. Sci. Bull. 2023, 68, 489–493. [Google Scholar] [CrossRef]
- Yang, K.; Lu, H.; Yue, S.; Zhang, G.; Lei, Y.; La, Z.; Wang, W. Quantifying recent precipitation change and predicting lake expansion in the Inner Tibetan Plateau. Clim. Change 2018, 147, 149–163. [Google Scholar] [CrossRef]
- Guo, W.; Liu, S.; Xu, J.; Wu, L.; Shangguan, D.; Yao, X.; Wei, J.; Bao, W.; Yu, P.; Liu, Q.; et al. The second Chinese glacier inventory: Data, methods and results. J. Glaciol. 2015, 61, 357–372. [Google Scholar] [CrossRef]
- Lehner, B.; Grill, G. Global river hydrography and network routing: Baseline data and new approaches to study the world’s large river systems. Hydrol. Process. 2013, 27, 2171–2186. [Google Scholar] [CrossRef]
- Zhang, G. China Lake Dataset (1960s-2020); National Tibetan Plateau/Third Pole Environment Data Center: Beijing, China, 2019. [Google Scholar] [CrossRef]
- Zhang, G.; Yao, T.; Chen, W.; Zheng, G.; Shum, C.; Yang, K.; Piao, S.; Sheng, Y.; Yi, S.; Li, J. Regional differences of lake evolution across China during 1960s–2015 and its natural and anthropogenic causes. Remote Sens. Environ. 2019, 221, 386–404. [Google Scholar] [CrossRef]
- Zhao, R.; Fu, P.; Zhou, Y.; Xiao, X.; Grebby, S.; Zhang, G.; Dong, J. Annual 30-m big Lake Maps of the Tibetan Plateau in 1991–2018. Sci. Data 2022, 9, 164. [Google Scholar] [CrossRef] [PubMed]
- Sun, J.; Yang, K.; Guo, W.; Wang, Y.; He, J.; Lu, H. Why Has the Inner Tibetan Plateau Become Wetter since the Mid-1990s? J. Clim. 2020, 33, 8507–8522. [Google Scholar] [CrossRef]
- Liu, S.; Yao, X.; Guo, W.; Xu, J.; Shangguan, D.; Wei, J.; Bao, W.; Wu, L. The contemporary glaciers in China based on the Second Chinese Glacier Inventory. Acta Geogr. Sin. 2015, 70, 3–16. [Google Scholar] [CrossRef]
- Li, H.; Wang, X.; Choy, S.; Wu, S.; Jiang, C.; Zhang, J.; Qiu, C.; Li, L.; Zhang, K. A new cumulative anomaly-based model for the detection of heavy precipitation using GNSS-derived tropospheric products. IEEE Trans. Geosci. Remote Sens. 2021, 60, 1–18. [Google Scholar] [CrossRef]
- Lozowski, E.; Charlton, R.; Nguyen, C.; Wilson, J. The use of cumulative monthly mean temperature anomalies in the analysis of local interannual climate variability. J. Clim. 1989, 2, 1059–1068. [Google Scholar] [CrossRef]
- Nyatuame, M.; Owusu-Gyimah, V.; Ampiaw, F. Statistical analysis of rainfall trend for Volta region in Ghana. Int. J. Atmos. Sci. 2014, 2014, 203245. [Google Scholar] [CrossRef]
- Lei, Y.; Zhu, Y.; Wang, B.; Yao, T.; Yang, K.; Zhang, X.; Zhai, J.; Ma, N. Extreme lake level changes on the Tibetan Plateau associated with the 2015/2016 El Niño. Geophys. Res. Lett. 2019, 46, 5889–5898. [Google Scholar] [CrossRef]
- Zhang, G.; Yao, T.; Xie, H.; Yang, K.; Zhu, L.; Shum, C.K.; Bolch, T.; Yi, S.; Allen, S.; Jiang, L.; et al. Response of Tibetan Plateau lakes to climate change: Trends, patterns, and mechanisms. Earth-Sci. Rev. 2020, 208, 103269. [Google Scholar] [CrossRef]
- Liu, W.-h.; Xie, C.-w.; Zhao, L.; Wu, T.-h.; Wang, W.; Zhang, Y.-x.; Yang, G.-q.; Zhu, X.-f.; Yue, G.-y. Dynamic changes in lakes in the Hoh Xil region before and after the 2011 outburst of Zonag Lake. J. Mt. Sci. 2019, 16, 1098–1110. [Google Scholar] [CrossRef]
- Wang, X.; Siegert, F.; Zhou, A.-g.; Franke, J. Glacier and glacial lake changes and their relationship in the context of climate change, Central Tibetan Plateau 1972–2010. Glob. Planet Change 2013, 111, 246–257. [Google Scholar] [CrossRef]
- Liu, L.; Jiang, L.; Xiang, L.; Wang, H.; Sun, Y.; Xu, H. The effect of glacier melting on lake volume change in the Siling Co basin (5Z2), Tibetan Plateau. Chin. J. Geophys. 2019, 62, 1603–1612. [Google Scholar] [CrossRef]
- Lei, Y.; Zhou, J.; Yao, T.; Bird, B.W.; Yu, Y.; Wang, S.; Yang, K.; Zhang, Y.; Zhai, J.; Dai, Y. Overflow of Siling Co on the central Tibetan Plateau and its environmental impacts. Sci. Bull. 2024, 69, 2829–2832. [Google Scholar] [CrossRef] [PubMed]
- Trenberth, K.E.; Dai, A.; Rasmussen, R.M.; Parsons, D.B. The changing character of precipitation. Bull. Am. Meteorol. Soc. 2003, 84, 1205–1218. [Google Scholar] [CrossRef]
- Chen, B.; Xu, X.-D.; Yang, S.; Zhang, W. On the origin and destination of atmospheric moisture and air mass over the Tibetan Plateau. Theor. Appl. Climatol. 2012, 110, 423–435. [Google Scholar] [CrossRef]
- Tian, L.; Yao, T.; Numaguti, A. Rainfall stable isotope fluctuation and the water vapor transport process in the southern Qinghai-Tibet Plateau monsoon. Sci. China D 2001, 31, 215–220. Available online: https://www.sciengine.com/doi/pdf/f5247e8d88a9427aaadcc5ba1e71ffec (accessed on 18 October 2024).
- Xu, K.; Zhong, L.; Ma, Y.; Zou, M.; Huang, Z. A study on the water vapor transport trend and water vapor source of the Tibetan Plateau. Theor. Appl. Climatol. 2020, 140, 1031–1042. [Google Scholar] [CrossRef]
- Xinru, X.; Qinglong, Y.; Yuntao, B.; Xianhong, M. The connection between the precipitation and water vapor transport over Qinghai-Tibetan Plateau in summer based on the multiple datasets. Plateau Meteorol. 2018, 37, 78–92. [Google Scholar] [CrossRef]
- Li, Y.; Su, F.; Chen, D.; Tang, Q. Atmospheric water transport to the endorheic Tibetan Plateau and its effect on the hydrological status in the region. J. Geophys. Res. Atmos. 2019, 124, 12864–12881. [Google Scholar] [CrossRef]
- Hu, L.; Xiaoduo, P. An Overview of Research Methods on Water Vapor Transport and Sources in the Tibetan Plateau. Adv. Earth Sci. 2022, 37, 1025. [Google Scholar] [CrossRef]
- Gao, Y.; Cuo, L.; Zhang, Y. Changes in moisture flux over the Tibetan Plateau during 1979–2011 and possible mechanisms. J. Clim. 2014, 27, 1876–1893. [Google Scholar] [CrossRef]
- Qiao, B.; Zhu, L.; Yang, R. Temporal-spatial differences in lake water storage changes and their links to climate change throughout the Tibetan Plateau. Remote Sens. Environ. 2019, 222, 232–243. [Google Scholar] [CrossRef]
Disclaimer/Publisher’s Note: The statements, opinions and data contained in all publications are solely those of the individual author(s) and contributor(s) and not of MDPI and/or the editor(s). MDPI and/or the editor(s) disclaim responsibility for any injury to people or property resulting from any ideas, methods, instructions or products referred to in the content. |
© 2025 by the authors. Licensee MDPI, Basel, Switzerland. This article is an open access article distributed under the terms and conditions of the Creative Commons Attribution (CC BY) license (https://creativecommons.org/licenses/by/4.0/).