Article

The Potential for Water Banking in Australia’s Murray–Darling Basin to Increase Drought Resilience

1
Commonwealth Scientific and Industrial Research Organisation (CSIRO), Waite Laboratories, Adelaide 5000, Australia
2
National Centre for Groundwater Research and Training (NCGRT) & College of Science and Engineering, Flinders University, Adelaide 5000, Australia
*
Author to whom correspondence should be addressed.
Water 2020, 12(10), 2936; https://doi.org/10.3390/w12102936
Submission received: 11 September 2020 / Revised: 11 October 2020 / Accepted: 15 October 2020 / Published: 21 October 2020
(This article belongs to the Section Hydrology)

Abstract

:
Banking water in aquifers during wet years for long-term storage then recovering it in drought is an application of managed aquifer recharge (MAR) that minimises evaporation losses. This requires a suitable aquifer for long-term storage of banked water and occasional periods when entitlements to surface water are available and affordable. This has been widely practised in Arizona and California but thus far not in Australia, in spite of severe impacts on agriculture, society, and the environment during recent droughts in the Murray–Darling Basin. This preliminary study based on a simple area exclusion analysis using six variables, some on a 90 m grid, over the 1 million km2 basin produced a first estimate of the order of 2–4 × 10⁹ m3 of additional aquifer storage potential in surficial aquifers close to rivers. For 6 of the 23 catchments evaluated, banking capacity exceeded an average water depth of 0.3 m for the irrigated area. At one prospective site in the Macquarie River catchment in New South Wales, water banking operations at various scales were simulated using 55 years of historical monthly hydrologic data, with recharge and recovery triggered by dam storage levels. This showed that the estimated 300 × 106 m3 additional local aquifer capacity could be fully utilised with a recharge and recovery capacity of 6 × 10⁶ m3/month, and recharge occurred in 67% of months and recovery in 7% of months. A novel simulation of water banking with recharge and recovery triggered by water trading prices using 11 years of data gave a benefit cost ratio of ≈ 2. Data showed that water availability for recharge was a tighter constraint on water banking than aquifer storage capacity at this location. The analysis reveals that water banking merits further consideration in the Murray–Darling Basin. Firstly, management across hydrologically connected systems requires accounting for surface water and groundwater entitlements and allocations at the appropriate scale, as well as developing equitable economic and regulatory arrangements. Of course, site-specific assessment of water availability and hydrogeological suitability would be needed prior to construction of demonstration projects to support full-scale implementation.

1. Introduction

This paper presents a preliminary assessment of the physical and economic feasibility of water banking in surficial aquifers of Australia’s largest river system to buffer water supplies against recurring drought. While the results are geographically specific, the methods are intended to be broadly adaptable. These are firstly the use of a geographic information system (GIS) including satellite-derived data for a binary multi-criteria assessment to screen out unfavorable locations. Subsequently, monthly hydrological modelling using historical flow, storage, and water trading price were employed to enable an assessment of water banking volumes and economics for an identified target area.
Variability of available surface water and the consequences of this on agriculture and environment can be attenuated by using aquifers for strategic storage and drought supply through a concept known as water banking [1,2]. Storing surplus surface water in aquifers avoids evaporation losses that come from storing water in reservoirs and expands accessible storage without incurring environmental costs of new in-stream or off-stream reservoirs.
The concept of water banking is simple, water is recharged when demand and cost are low so that the resource can be recovered when demand and cost of water are high. The term water banking is generally used to describe long-term storage, usually over multiple years, as distinct from short-term storage, e.g., for seasonal irrigation supplies. The term also invokes a banking concept whereby credits are given for deposits that can be withdrawn later. Subsurface storage is insulated from evaporation losses that can be around 40% of their capacity annually for shallow storages [3]. In a warming climate, evaporative losses from reservoirs in Australia are estimated to increase by 6% over 2030–2050 and 15% over 2070–2090 compared to the 1990–2010 baseline [4].
The water banking concept has been tested and proven in the USA [2,5,6,7]. In the Central Valley of California, a scheme initiated in the 1960s accumulated 1.1 × 10⁹ m3 over 20 years, which was drawn upon during a significant drought in the 1990s [5,6]. Another example comes from the State of Arizona. In 1996, the Arizona Water Bank Authority was set up to manage multiple infiltration schemes through the Central Arizona Project on the Colorado River. Over 17 years of operation, 4.5 × 10⁹ m3 was stored using multiple recharge schemes varying in capacity from 0.6 to 185 × 106 m3/year [2]. Policies were developed to support the Arizona Water Bank, specifically to permit conditional recharge and storage in regional aquifers, allow carry-over of recharged volume credits across multiple years, allow recovery from outside the immediate zone of recharge, and substitute uses of alternative water sources (e.g., treated sewage) for groundwater credits [8].
In Australia, managed aquifer recharge (MAR) has found application mainly in short-term seasonal water supply augmentation for irrigation [1,9]. Perhaps the most advanced example of the water banking concept for long-term water security is the Beenyup Groundwater Replenishment Scheme in the city of Perth in Western Australia. Groundwater replenishment is being expanded along with sea water desalination to offset chronic potable water supply shortages as a result of decades of declining rainfall and surface water storages [10]. The scheme recharges highly treated recycled water into a deep, confined aquifer for subsequent potable water supply augmentation after an estimated 50-year aquifer residence time. Its current capacity is 28 × 106 m3/year, with projections to exceed 100 × 106 m3/year by 2060 [11]. In this case, the value of stored water increases as it underpins city water supplies and provides additional long-term water security.
Water banking to secure rural water supplies over the long term has not yet been attempted in Australia, in spite of evident need. The Murray–Darling Basin (MDB) covers more than 1 million square kilometres and supports more than 60% of Australia’s total irrigated area [12]. During the “millennium drought” from the mid-1990s to the mid to late 2000s that affected large parts of southern Australia, the drop in agricultural production was equivalent to a loss of 1.6% in gross domestic product and the cost to the environment was also significant, e.g., death of native old-growth riparian forests along 1500 km of the Murray River, and losses of shorebird populations across the Ramsar-listed Lower Lakes and Coorong region [13].
Groundwater use is highest in the large riverine plains located in the mid to upper parts of the MDB, while use is limited across the lower sections where groundwater is saline [14]. Salinity tolerances range from 600 mg/L total dissolved solids (TDS) for sensitive crops to 1200 mg/L for moderately sensitive crops [15]. MAR needs to produce water at an acceptable quality for its intended use and not suffer excessive efficiency losses through mixing with saline native groundwater. However, with a fresh water source, storage in a brackish aquifer is still possible and recovery efficiency depends on scale of recharge, salinity of the native groundwater, groundwater hydraulic gradient (lateral flow), and the heterogeneity and anisotropy of the aquifer [16]. In a brackish limestone aquifer with annual recharge and recovery in the order of 1 × 10⁶ m3, approximately 80% has been recovered at a salinity <600 mg/L in an aquifer with ambient salinity of 2000 mg/L over an operational life of >10 years [17]. At the same aquifer storage and recovery site in Parafield, South Australia, where water is injected into a confined aquifer via a well and recovered from the same well, Clark et al. [18] calculated an average annual fresh water storage depreciation rate due to mixing with brackish groundwater of 15.6% over an 11-year period, which encompassed dry years with low rainfall and recharge, as well as high demand.
Water banking raises a number of issues that need to be addressed at a preliminary level before investing in more detailed and costly feasibility investigations. These include technical issues (e.g., recharge and recovery capacity, water quantity) and non-technical issues such as legal and economic constraints, social acceptance, and governance [19]. The risks to be managed and the investigations required to comprehensively assess and manage these are well documented [20,21]. This study focused on surficial aquifers, as the cost to recharge via infiltration is an order of magnitude lower than injection into confined aquifers [22,23,24] in rural areas. The principal issues are whether suitable aquifers exist to accept useful volumes of recharge, whether the quality of water available for recovery is suitable for the intended use/s, whether sufficient water is available for recharge, whether operations are likely to be economically feasible and sustainable, and how the process would be managed and governed. The objectives of this study were to address some of these issues, firstly to estimate the potential additional surficial aquifer storage capacity in the MDB using existing accessible data, and secondly, to model a specific sub-catchment using time series data on river flow, reservoir storage, and water trading price to evaluate volumes of water that could be stored and recovered and the economic costs and benefits.

2. Materials and Methods

After giving an overview of the Murray–Darling Basin hydrology, including surface water–groundwater interactions, we present a whole-of-basin-scale preliminary assessment of aquifer storage potential. This is followed by modelling a time series of hydrological data in one prospective area that was performed to serve as an example of the ability to bank water in an aquifer to buffer against drought.

2.1. Murray–Darling Basin Overview

The MDB covers an area of > 1 million km2 and supports 40% of Australia’s agricultural production value, accounting for 7.5 × 10⁹ m3 66% of Australia’s agricultural water use, about 6.5 × 10⁹ m3 from surface water and 1 × 10⁹ m3 from groundwater extraction [25]. The majority (≈85%) of water use in the MDB is for agriculture, however, water supply losses (mainly through evaporation and seepage during conveyance) account for 13%, and 2% is accounted for by domestic use [25]. Long-term total annual flow measured at lock 1 on the River Murray at Blanchetown (approximately 270 km from the river mouth, Figure 1) is 5.9 × 10⁹ m3, and during dry years can be < 25% of this [26].
The long-term average annual rainfall and runoff across the MDB are 460 and 25 mm, respectively, with the majority distributed in the elevated parts of the basin on the eastern and southern boundaries (Figure 1). During the decade-long drought beginning in the mid-1990s that affected the majority of the MDB, rainfall in places was 20% lower than the long-term average and runoff was 50% lower in some parts [27]. The potential annual evaporation rate across the basin was 1200 mm and it has been estimated that evapotranspiration processes use 94% of rainfall. Climate change is expected to further reduce rainfall and runoff in the MDB; under a 2-degree warming scenario, rainfall is expected to decline by up to around 20% and runoff by up to 40% [28]. Under the current trajectory, average surface water availability across the MDB compared to historic levels is expected to be reduced by 10% by 2030 [28]. Climate change has been forecast to reduce natural recharge of groundwater and increase demand for water in many areas of Australia, notably in southern Australia [29]. Estimated changes in recharge in response to changes in rainfall were amplified on average by a factor of 2.2 across sites in the MDB; however, this was complicated in arid and semi-arid zones where episodic recharge from higher intensity rainfall events is more significant [30].
An overview of groundwater and surface water interactions in the MDB can be summarised as three basic systems: connected systems where rivers can be both gaining and losing water, typical of the highland areas dominated by fractured rock and narrow alluvium; disconnected losing river systems in the mid-basin floodplain alluvial systems where surface water recharges surficial groundwater; and connected gaining river systems at the lower end of the basin where groundwater provides flow to surface water [31].
Groundwater levels are monitored in over 1200 wells of the 12,000 in the MDB and 3 different trends have been observed [32]. Firstly, declining water tables (and pressures in deeper aquifers) occur where groundwater is of good quality and groundwater irrigation has expanded or recharge has reduced due to drier conditions. Secondly, there are areas where no trend has been observed, and generally where groundwater use is low or direct connections between aquifers and streams do not occur. Thirdly, rising levels occur primarily in lowland areas with shallow water tables due to land clearing or excess surface water irrigation, which in certain places can lead to land salinisation. Falling and stable levels predominate, as subsequently reported by Leblanc et al. [33], who estimated a net groundwater storage loss between August 2002 and December 2010 of ≈ 4.5 × 10¹⁰ m3 ± 3 × 10⁹ m3 (≈18 ± 1.3 mm/year) over the 300,000 km2 Murray Groundwater Basin. The two targets for water banking are aquifers with declining or stable water tables, and each would need governance arrangements that allow sustainable existing groundwater extractions to continue while ensuring that banked water is accessible when needed. Water tables that are shallow or rising or where water is too saline must be excluded from consideration for water banking.
Water in the MDB is managed through a market where water can be traded either permanently (as water entitlements) or temporarily (as water allocations). Trade is permitted within or between catchments with hydrological connection (Figure 1), and while most trade occurs with surface water, some groundwater is also traded. The market is designed to be a self-regulating system that encourages water efficiency and directs water to the highest price use and has provisions for maintaining environmental flows. Groundwater and surface water entitlements in the MDB total 1.96 × 10¹⁰ m3 [26]. The Commonwealth Environmental Water Holder currently has a total of 3 × 10⁹ m3 of groundwater and surface water entitlements held for environmental allocation [34]. Trade prices reflect supply and demand factors that vary across different river regions, types of water rights, and across time. Trading provides flexibility for business decisions that reduce risk [35]. Water entitlements are a fixed share among users with water rights of the available water within a catchment in a normal year, and allocations as a percentage of each share are varied by catchment water managers at the start of each water accounting year, depending on the measured availability of the resource, and can be updated periodically if it changes. Water entitlements are partitioned within some states into high-security (typically for urban use and perennial plantings such as vines and orchards) and lower security water (typically for annual crops). High-security water allocations are generally more robust but low security allocations are volatile and can shrink to 0% in drought. While the water sharing arrangements are logical, the terminology and allocation assessment processes differ among jurisdictions and even among catchments within a jurisdiction, with much remaining to be done in order to ensure transparency in measurements, increased democratic processes including those for aboriginal custodians, and giving primacy to environmental goals [36].

2.2. Regional Aquifer Storage Potential Assessment

This assessment identified areas across the MDB that met feasibility criteria for infiltration-based MAR using national- and basin-scale spatial data. The focus was on unconfined aquifers because the cost of recharge through broad area infiltration systems is an order of magnitude lower than well injection systems into confined aquifers [22,23,24] in rural areas. Infiltration techniques require unconfined aquifers with suitable, typically unconsolidated coarse material in order to reach acceptable recharge and recovery rates. The analysis considered topographic slope, soil clay content, surface geology, regolith thickness, depth to water table, and groundwater salinity (Table 1). The implication is that if no exclusion criteria are met, the location is potentially suitable for water banking through area elimination [37] (Figure 2). Results were precise to a scale of 1:1 million, or an effective resolution of ≈500 m. Results were summarised for each major catchment in the MDB and related to the area of irrigation in each catchment to help identify at this scale those catchments where water banking could have measurable local benefits. This was done to expedite development of the pioneering phase of water banking in the MDB.
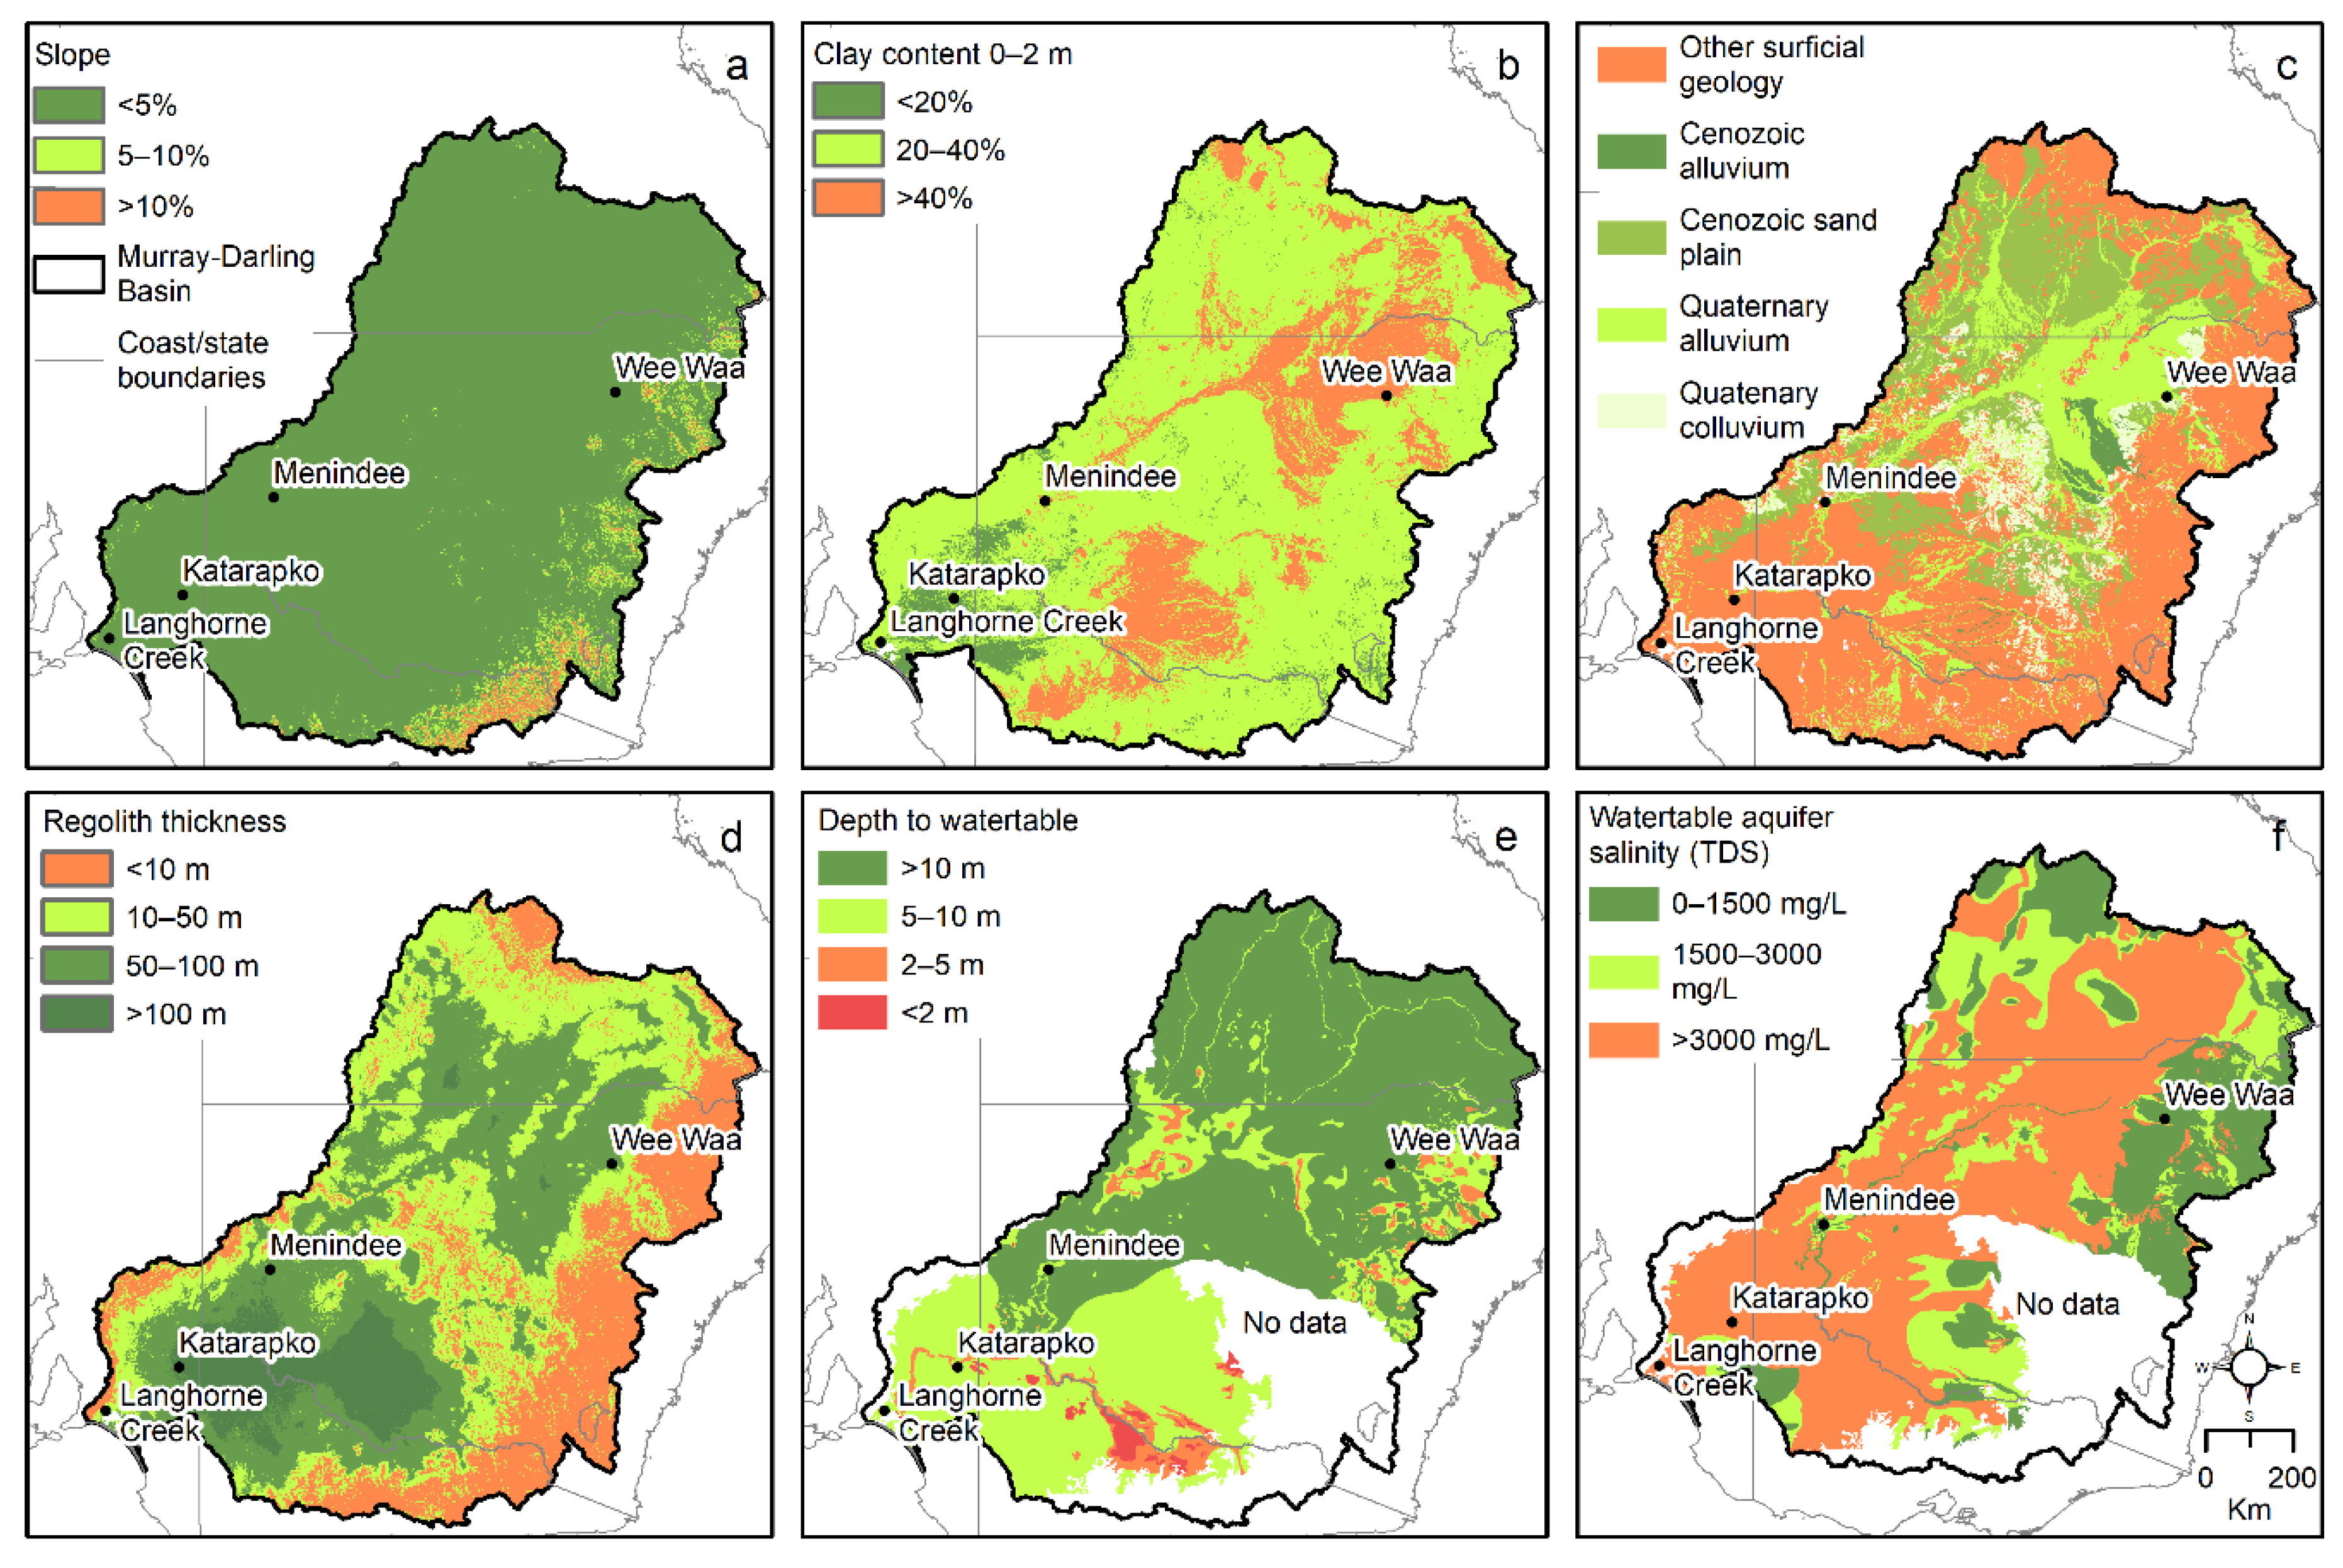
Slope influences natural recharge, with higher infiltration rates occurring on gentle slopes and conversely higher velocity runoff on steep slopes. Previous MAR suitability studies [43,44] have applied a slope criterion of < 10% to identify favourable areas for infiltration-based techniques. Slope was calculated on the basis of digital elevation data [38] resampled to 900 m resolution. Streams originating from the highlands are generally fast-flowing and slow as they reach lower lying areas to form meandering systems over largely flat topography throughout the majority of the basin. Almost all runoff contribution to rivers in the MDB is generated from the highlands comprising 15% of the total area of the MDB [28]. The majority (94%) of the MDB has a slope of < 5%, and just 2% has a slope >10% which was excluded from the analysis (Figure 2a).
Infiltration methods are dependent on soil permeability, particularly for profiles beyond the depth of typical basin excavation (e.g., 2–3 m). The hydraulic conductivity of clay is typically in the order of 10−5 or 10−6 m/day [45] and infiltration rates typically need to be > 10−1 m/day to be economically viable (requiring saturated hydraulic generally of 10−1 m/day (e.g., Dillon and Arshad [46]) under a unit vertical gradient). Gridded national scale soil clay content data [39] for 6 depth intervals to 2 m below the surface were depth averaged and classified into 3 groups: 0–20%, 20–40%, and >40% (Figure 2b). On the basis of experimental data that showed hydraulic conductivity for a range of soils with >40% clay content was limited to <10−2 m/day [47] it was assumed this was indicative of insufficient permeability; thus areas with >40% clay content (totaling 21% of the MDB) were excluded from consideration for water banking.
The MDB overlies two main geological basins, the Great Artesian Basin that was formed 60–250 million years ago underlying most of the northern Darling River catchment, and the Murray Groundwater Basin that formed in the last 60 million years and lies beneath the southern Murray River catchment [28]. Layers of alluvial sediments of 600 m thickness in places were deposited through erosion and weathering as rivers fanned from the highlands in the much wetter climate of 40–60 million years ago. The southwest part of the MDB was inundated several times as seas rose and retreated over the last 26 million years, peaking around 6 million years ago where the coastline reached up to about the mid-point of the MBD, resulting in deposition of marine sediments. The formation of the rivers, dunes, and alluvial plains of the basin visible today occurred during glacial cycles 10,000 and 100,000 years ago as a result of glacial melt from the eastern highlands. National 1:1 million scale mapping of outcrop and surficial geology [40] was used to identify suitable geological formations (alluvium, colluvium, and sand plain formations) by filtering out areas of highly consolidated or fine-grained material, as well as igneous and metamorphic rocks unlikely to support acceptable infiltration rates, totalling 55% of the MDB (Figure 2c).
The probability of adequate aquifer storage space increases with aquifer thickness. Median estimates of regolith thickness made at a national scale and 90 m resolution [41] were used as an indicator of the thickness of the surficial aquifers. The depth of regolith digital mapping product [41] is designed to represent an estimation of the combined depth of pedolith, transported regolith, saprolite, and slightly weathered bedrock (saprock), encompassing the extent of the alluvium, colluvium, and sand plain formations in the MDB. It was assumed a depth of regolith < 10 m indicated a low chance of intersecting an aquifer of sufficient thickness to accept additional recharge, and thus these areas were eliminated. These areas generally coincided with outcropping rocks of igneous and metamorphic origin along the eastern and northern boundaries, accounting for 25% of the area of the MDB (Figure 2d).
Adequate storage space in an unconfined aquifer is also dependent on the water table depth—there must be sufficient freeboard to allow additional recharge without increasing flooding risk, soil salinity or sodicity, or geotechnical constraints (e.g., for construction). The Australian MAR guidelines [21] recommend a minimum water table depth of 4 m in rural areas to reduce these risks. No restriction is placed on maximum depth to water table on the expectation that infiltration from a basin will ultimately recharge the unconfined aquifer. Water table depth maps covering the majority of the MDB [42] contained broad but disparate depth classes that were merged into a single layer with common classes. The coverage of water table depth data was absent across 13% of the MDB, precluding these areas from analysis (Figure 2e). Assuming a porosity of 0.1, additional recharge of 100 mm over an extensive area would result in a water table rise of 1 m. Water table depth of < 5 m indicated areas with insufficient storage space, which eliminated 6% of the area of the MDB from consideration for water banking. A porosity of 0.1 for alluvial materials (e.g., sands, gravels) is conservative in comparison with typical values for similar porous media of 0.2 to 0.3 [45,48]. Assuming a higher porosity, e.g., 0.2, would halve the water table rise in response to the same recharge or allow double the recharge with the same water table response.
Groundwater salinity is an important influence on the suitability of recovered water for its intended use/s. Mixing in a brackish or saline aquifer can reduce the amount of water that is recoverable at an acceptable salinity. Water table aquifer salinity maps [42] contained broad but disparate salinity classes that were merged into a single layer with 3 common classes: <1500 mg/L, 1500–3000 mg/L, and >3000 mg/L (Figure 2f). This was used to eliminate 18% of the area of the MDB from consideration for water banking where salinity was >3000 mg/L. Above this level the fraction of recharged water that could be recovered at a suitable salinity for its intended use (known as MAR recovery efficiency) was likely to be low and limiting. Data were absent across similar areas to that of the water table depth coverage, precluding them from analysis.
In the evaluation that follows, it is conservatively assumed that where there is a suitable aquifer with a water table depth of at least 5 m, about 100 mm water can be recharged and recovered via MAR. Clearly, in many places with deep water tables and permeable alluvium, an order of magnitude or more of additional water could be stored. However, in places near streams, hydraulically disconnected aquifers could become hydraulically connected as a result of MAR, and hence recharged water could discharge to the stream and not be available for recovery in drought for irrigation or environmental flows. Hence, even a 1 m difference in head as a result of MAR (≈100 mm recharge) may not be storable until a drought. In addition, the area practically available for recharge may exclude some parts of the suitable aquifer from receiving this much additional storage. Hence, for the purposes of illustration, we adopted a uniform value of 100 mm over the area of suitable aquifer in order to estimate the storage capacity for water banking.
Suitable areas were then refined by considering proximity to sources of water for recharge and irrigation demand, acknowledging water transportation as an important economic consideration. A national river network map based on a 9 arc second digital elevation map [49] was used to identify areas with aquifer storage potential within a feasible distance from second order or higher rivers (hereafter referred to as “major” watercourses). This study considered 5 km indicative of the distance to which pumping to the recharge point would remain economically feasible assuming little elevation difference. Determining potential available volumes obviously requires hydrogeological analysis for specific locations. Additional factors including water sharing arrangements, resource management planning, and availability of tradeable allocations will also influence water availability for recharge.
Similarly, it was considered that banked water could generally be accessed up to 5 km from the storage zones for economic reasons. This is an indicative distance, as other factors, e.g., location of extraction bores, pipelines, cost of water, and value of end use, influence the distance to which it is viable to access aquifer-recovered water. Irrigated agricultural areas within the MDB were obtained from the Department of Agriculture [50].

2.3. Sub-Catchment Recharge Simulation

A case study scenario in the Dubbo area of the Macquarie River catchment in central New South Wales (NSW) was used to illustrate the functionality of water banking. This was one of the locations identified by the regional aquifer storage potential assessment as having storage capacity similar in magnitude to localised annual irrigation water use. Two sets of hypothetical MAR operations simulating recharge and recovery were conducted using monthly time-stepping calculations:
(1) Over a 55-year time series from 1965 to 2020 that was based on flow measured at Macquarie River near Dubbo and monthly storage volumes of Burrendong Dam (provided by Water NSW) to demonstrate the volumes of water recharged and recovered during long-term operation of a water bank, if one had been in place, for various sizes of recharge and recovery capacity; and
(2) simulations performed over a shorter period, 2009 to 2020, using the water trading price history (sourced from the Australian Government Bureau of Meteorology) and corrected for inflation using the consumer price index reference base in March 2016 [51], to enable an estimate of the potential economic costs and benefits of water banking.
For each set of simulations, we considered recharge to be via infiltration basins, the cheapest form of MAR for additional storage in rural areas if unconfined aquifers are available. Infiltration basins could be dispersed over the area considered as suitable for additional aquifer storage derived from the basin-scale study. A range of MAR scheme recharge/recovery capacities between 1 and 12 × 106 m3/month was tested. The upper value of this range was determined iteratively by comparing the maximum net storage during the simulation with the crudely estimated additional aquifer storage capacity available locally. The average levelised cost (corrected to USD in 2016) for MAR with surface water using infiltration basins across 8 schemes reviewed internationally was USD 0.19/m3 (or AUD 0.25 in June 2016) [23]. Allowing for a levelised supply cost of AUD 0.25/m3 covering operating expenses and amortised capital costs, a water purchase price of up to AUD 0.05/m3, and a further AUD 0.05/m3 for contingencies, we assumed aquifer recovery was viable if the cost of surface water allocation was > AUD 0.35/m3.
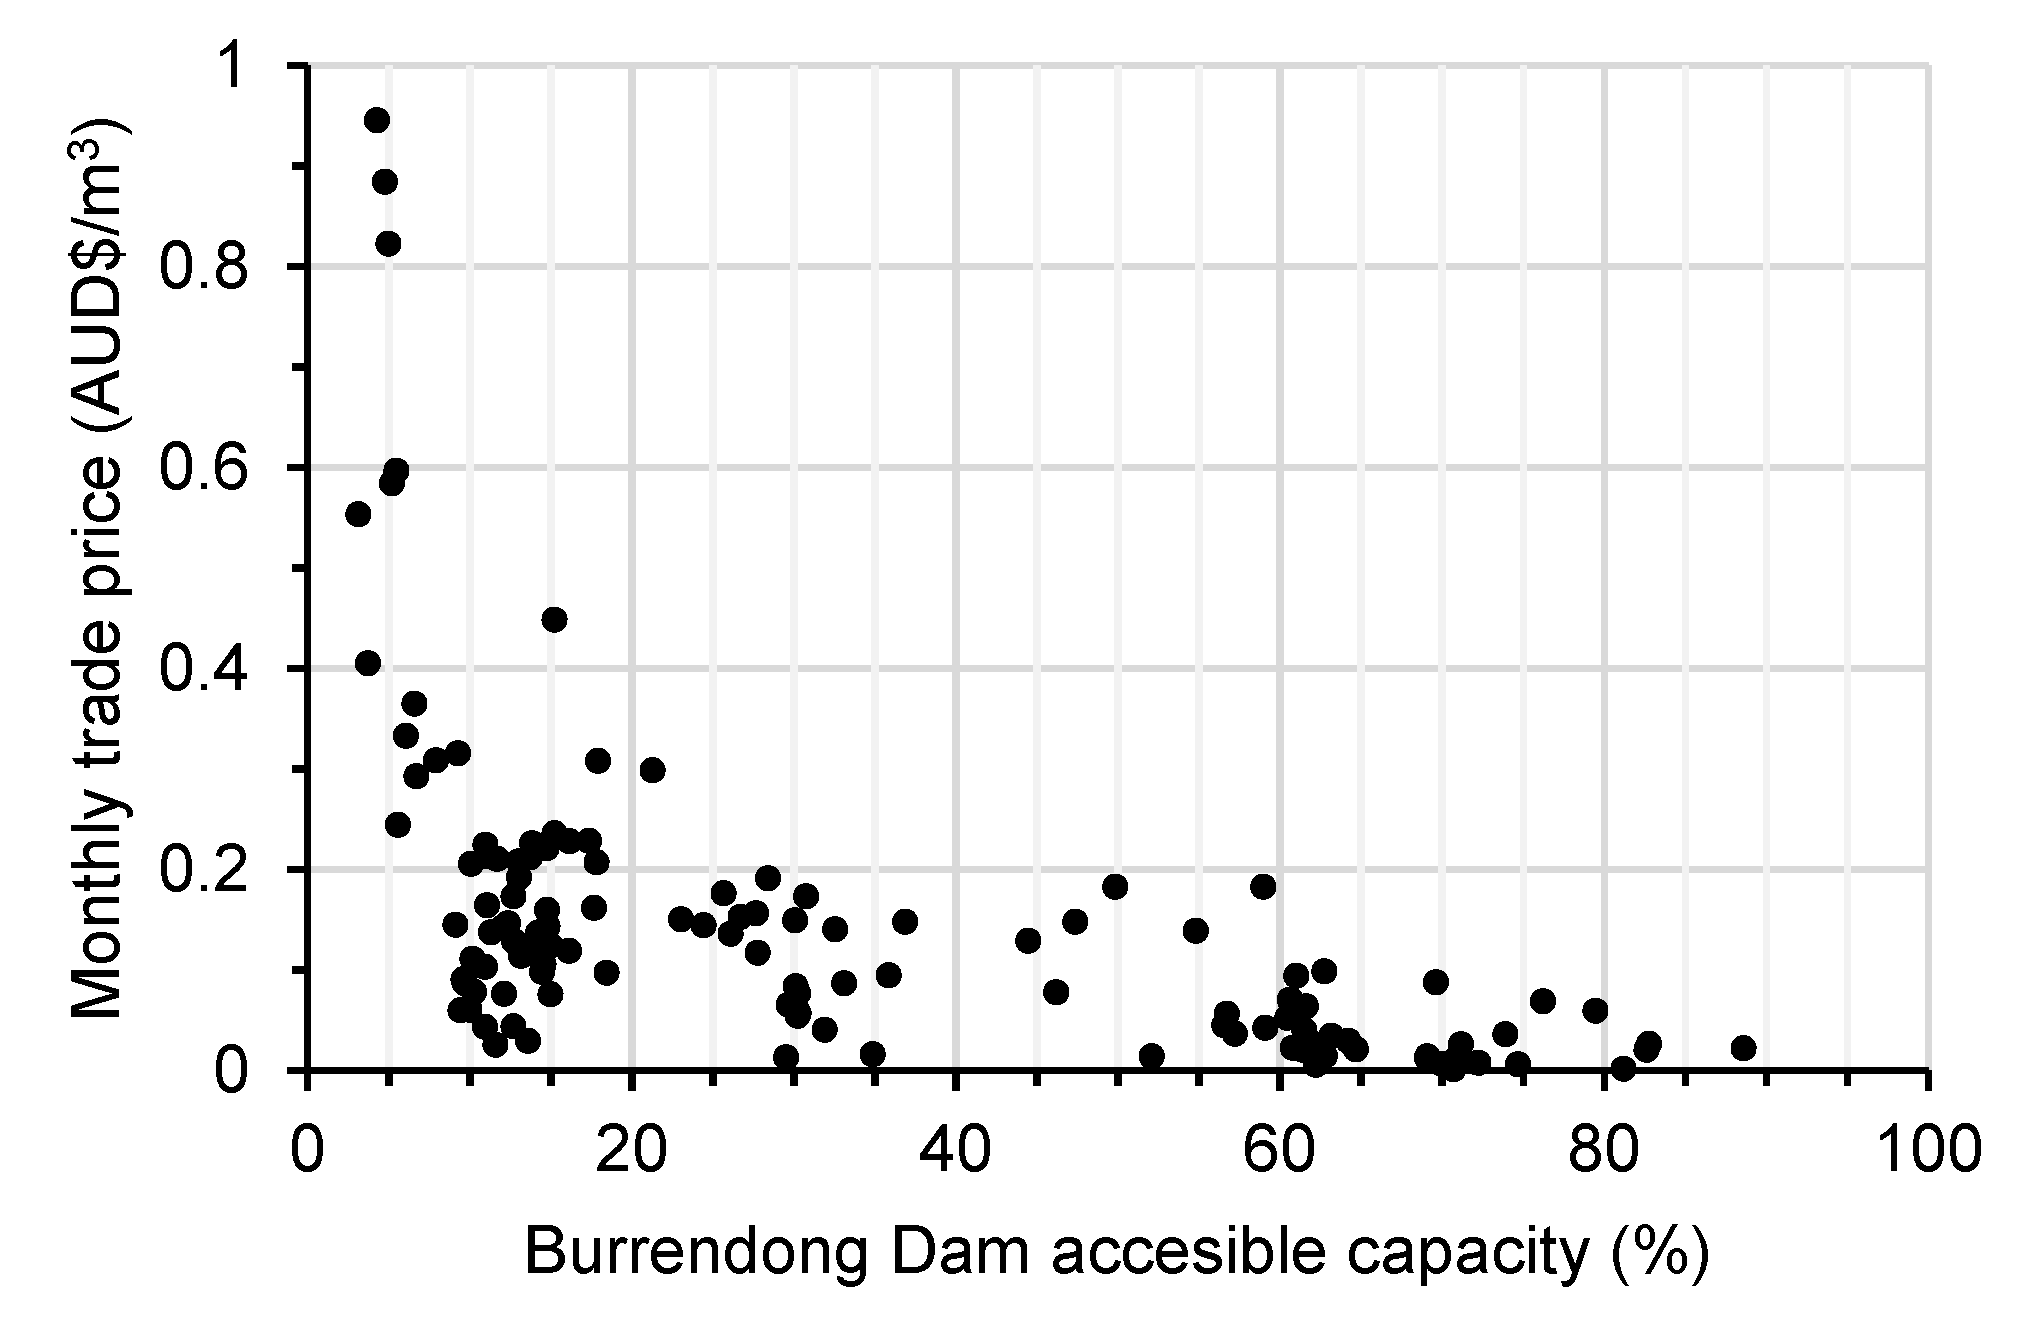
In simulation 1, recharge was triggered when storage in Burrendong Dam exceeded a specified capacity (here 25%), and a specified percentage (here 1%, 2% was also tested) of the mean monthly river discharge rate capped at the recharge capacity of the MAR system was diverted to MAR. The trigger for recovery at the rate of the MAR system capacity was when mean monthly dam storage dropped below 10%, with recovery only occurring if the water bank had a positive balance. The selection of 25% and 10% storage capacity of the dam as a trigger for recharge and recovery was based on the relationship between trade price and dam level (Figure 3). For the 2009–2020 trading period within the Macquarie and Cudgegong regulated river trading zone, the median monthly water allocation trade price when Burrendong dam was at < 10% capacity was AUD 0.32/m3, with a maximum of AUD 0.95 recorded in November 2019. When the dam was > 25% full, allocation trade prices remained below AUD 0.20/m3.
In simulation 2, mean monthly trade prices were used to trigger recharge and recovery. Recharge was initiated when the monthly trade price was < AUD 0.05/m3 and recovery when it was > AUD 0.35/m3. Costs were the sum of water purchase (trade) price, levelised supply cost (AUD 0.25/m3), and contingencies (AUD 0.05/m3). The value of recovered water was the product of the mean monthly trade price at the time of recovery and the recovered volume. The net benefit was calculated as the difference between the present value of water on recovery and costs of recharge and supply. No attempt was made to value the benefits to future water security of the residual unrecovered water banked. Clearly this has a value, but it was considered beyond the scope of this paper to speculate on this. Hence, the economic analysis presented in this paper underestimated the benefits and viability of water banking. More detailed economic and financial assessments are a priority aspect of further investigations.
Mixing of recharged water with saline groundwater can limit irrigation use. Groundwater salinity in the Narrabri formation that is part of the alluvium underlying the Macquarie River is reported to be < 1500 mg/L [52]. Macquarie River water is fresh (generally < 500 mg/L). The main irrigated crop in the area is cotton, followed by wheat and lucerne, and limited areas of irrigated pasture, other cereals, and oilseeds [53]. In moderate to slow draining soils, cotton tolerates irrigation water salinity of 3000–4000 mg/L before yield reductions are seen, wheat tolerates 2500–3200 mg/L, and lucerne tolerates up to 1500 mg/L. Fruit and nut crops and vegetables generally have lower salinity tolerances around 1000 mg/L [54]. For the purposes of irrigating the majority of crop types in the Macquarie River region, we found that aquifer storage loss through mixing with saline groundwater was therefore unlikely, and thus no depreciation of the groundwater volume was applied.

3. Results and Discussion

3.1. Regional Aquifer Storage Potential

Across the MDB assessment extent that excluded areas with no salinity or water table depth data (Figure 2), this study identified 96,000 km2 (almost 10% of the basin’s 1 million km²) where potentially suitable surface geology intersected with water table depth >5 m, groundwater salinity < 3000 mg/L, regolith thickness > 10 m, clay content < 40%, and slope < 10% (Figure 4). Assuming an average of 100 mm of storage across the area, this gives 9.6 × 10⁹ m3 of potential aquifer storage capacity for water banking, equivalent to 38% of the of 25 × 109 m3 total accessible surface water storage capacity of the MDB. Using the tighter groundwater salinity constraint of < 1500 mg/L narrowed the potential aquifer storage area to 36,000 km2.
This water banking capacity was subsequently refined to consider proximity to sources of surface water for recharge. This study considered 5 km indicative of the distance to which pumping to the recharge point would remain economically feasible, assuming little elevation difference. The total potentially suitable area occurring within 5 km of major water courses was 40,000 km2 (4% of the basin’s area), with an estimated supplemental storage capacity of 4 × 10⁹ m3 or 16% of the total accessible surface water storage capacity (Figure 4). For a stricter groundwater salinity criterion of 1500 mg/L, we estimated the supplemental aquifer capacity as 2 × 10⁹ m3 (across 19,000 km2), equivalent to 7.5% of surface storage capacity. Figure 4 also shows the areas of irrigated agriculture across the basin and highlights the areas within 5 km of potential storage zones near major rivers. These highlighted regions indicate that suitable aquifers with storage space and a potential water source may coincide with existing demand. Recharge and distribution costs, and end use value, remain important considerations for identifying potential MAR sites. Recharging some distance from a source water body may also lower the potential for discharge of stored water back to the surface water source (e.g., river or lake) before the next drought when it is intended to be recovered.
The main areas where water table depth and groundwater salinity data were absent were in the Lachlan River, Upper Murray, and Murrumbidgee River catchments (Figure 4). Median standing water level and salinity observations since 2000 [55] suggest that significant storage potential in fresh aquifers exist within the Upper Murray Alluvium, Billabong Creek Alluvium, Mid-Murrumbidgee Alluvium, and Upper Lachlan Alluvium that are close to major rivers and irrigation demand. Salinity was generally < 1500 mg/L and water table depths > 5 m in most places, and > 8 m in some areas. Regolith thickness estimates [41] indicated alluvial aquifers were generally > 20 m thick. This suggested a combined potential alluvial aquifer storage area within 5 km of major rivers of > 10,000 km2 or > 1 × 10⁹ m3 (assuming 0.1 m recharge) that in over 765 km2 of irrigated land within the same area would provide > 1 m additional water.
Figure 4 indicates areas where either MAR already occurs (Langhorne Creek in South Australia) or where previous localised studies have identified potential application for MAR (Darling River at Menindee, Namoi River near Narrabri, and at Katarapko floodplain). In South Australia, MAR in the Langhorne Creek area mainly along the Bremer River but also along the nearby Angus River has been occurring since the 1980s. There are two main aquifers: the Quaternary sediments of 10–35 m thickness, and the underlying Tertiary Murray Group Limestone aquifer that is up to 100 m thick; both are confined in places and unconfined in others [56]. Most extraction is from the Tertiary aquifer due to lower salinity (< 3000 mg/L) compared to the Quaternary sediments and is the target for MAR via injection across multiple wells using surface water. The 5-year (2013–18) annual average MAR volume was 1.1 × 10⁶ m3, equivalent to 73% of average annual extraction (1.5 × 10⁶ m3) over the same period [57]. The regional assessment identified a potentially suitable aquifer storage zone along a 16 km section of the Bremer River near Langhorne Creek in South Australia (Figure 4), corresponding to the approximate location of existing MAR sites. This assessment identified potential storage in the Quaternary alluvium where water table salinity was < 3000 mg/L. Targeted studies could reveal if and where the Quaternary and Tertiary aquifers are hydrologically connected to each other and to the surface and indicate whether injection into the Tertiary aquifer may have lowered the salinity of the overlying alluvium locally. Existing MAR in Langhorne Creek is used to accrue credits for extraction to support high-value irrigated agriculture (mainly viticulture). The fact that MAR has been used here for many decades using comparatively expensive well injection methods is evidence that injection methods can be economically viable in some cases for high value irrigation support. The area is also an example of where MAR was managed with tradeable entitlements and allocations and thus could provide a model for other rural areas [22]. Here, an operator can use surface water allocations to build “recharge allocation” through MAR that in the case of the Angus-Bremer Limestone aquifer up to 100% of the volume can be later extracted from a well up to 500 m from the point of injection for a period of 4 years from the year of recharge [58]. Conditions for MAR vary depending on the groundwater management zone and activities are subject to permit and licencing arrangements managed within the context of a regional water allocation plan administered by the local regulator.
An investigation into MAR to supplement water supply to the town of Broken Hill during droughts found suitable aquifers near Menindee on the Darling River in New South Wales [59]. This location is shown in Figure 4 and coincided with areas of aquifer storage potential identified through the regional assessment. Broken Hill’s water supply relies on storage in the Menindee Lakes System that with a high surface area to volume ratio and evaporation rate of > 2.4 m/year is subject to substantial evaporation loss, averaging 400 × 106 m3/year [60]. Studies found that the primary MAR targets were within the Pliocence aquifers at depths of some tens of metres, and that upper confining aquitards were variable across the area [59]. MAR was considered feasible at all sites by applying appropriate techniques (e.g., well injection, infiltration) depending on aquifer depth and degree of confinement. Salinities of the target formations were fresh to brackish (< 3000 mg/L), with some areas of higher salinity (≈7000 mg/L). In the upper unconfined Quaternary sediments across 14 sites, aquifer thickness ranged around 10–30 m, average depth to water was 8–23 m, and salinities were generally < 2000 mg/L [59]. These findings based on site specific bore measurements, lithological records, and airborne electromagnetic surveys support the findings of the regional scale assessment presented in this study that identified this area as potentially suitable for water banking.
Dillon and Arshad [46] also indicated that aquifers in the Lower Namoi region have the capacity to store an average 85 × 106 m3/year from high flow events. This area appears to have sufficient storage space according to regolith thickness (indicator for aquifer) generally over 20 m and water table depth over 10 m (Figure 2d,e). A MAR site suitability assessment was performed for the Namoi River catchment by Fuentes and Vervoort [61] that identified the alluvial sediments of the Namoi River and Pian Creek, Mooki River, and Bundella Creek as the most suitable areas. This broadly agreed with the areas identified in the current assessment (Figure 4 and Figure 5e), however, there were some localised discrepancies. Fuentes and Vervoort [61] identified high suitability between Wee Waa and Narrabri on the Namoi River, and along Pian Creek in the Lower Namoi using a weight-based ranking analysis that prioritised slope, aquifer salinity, and hydrogeological unit over nine other criteria (soil conductivity ranked eighth). The current assessment also identified the alluvium along the Namoi River, however, downstream of Wee Waa, high soil clay content (>40%) along the Namoi River and Pian Creek eliminated these areas (Figure 2b). This was based on ≈90 m resolution gridded data of clay content [39] as a surrogate for permeability. Fuentes and Vervoort [61] used 1992 Australian Soil Atlas data that in this area was classed as slow (5–50 mm/day), however, due to its low weighting, it was overridden by other criteria.
In 2020, construction and trials of an MAR scheme to improve floodplain ecosystem health through the creation of a fresh groundwater lens in an otherwise salt-affected area around Katarapko, South Australia (Figure 4), were underway. This area was not identified in the current regional assessment as groundwater salinity was generally > 3000 mg/L (and often much higher) in the region (Figure 2e), however, the objective of MAR here is precisely to combat this issue exacerbated by over a century of inappropriate land management practices, river regulation, overuse, and extended drought [62]. Inspection of other regional assessment parameters supports the suitability of the area for recharge (Figure 2). Successful operation of the site will depend on maintaining adequate recharge rates, which has been shown to be feasible [62] with sufficient volumes and regularity such that groundwater salinity reductions could be sustained for long enough for dependent ecosystems to benefit.
Irrigated agriculture in the MDB on average over 2006–2018 applied 6.6 × 10⁹ m3/year, for which over 15,700 km2 was at a rate of 0.49 m [63]. By area, average irrigation demand was highest for rice, almonds, and cotton (1.2, 0.92, and 0.67 m respectively), while other irrigated crops required 0.5 m or less [63]. Irrigated agricultural areas within the MDB are shown in Figure 4, which also highlights those within 5 km of storage zones. It was considered that banked water could generally be accessed up to 5 km from the storage zones for economic reasons, similar to the constraint on pumping water from a river to the recharge point. This is an indicative distance as other factors, e.g., location of extraction bores, pipelines, cost of water, and value of end use, influence the distance to which it is viable to access aquifer-recovered water. The areas of irrigated agriculture [50] within 5 km of identified groundwater storage potential are summarised in Table 2.
Table 2 reveals that there is sufficient storage capacity to provide 0.45 m of storage for almost 9000 km2 of irrigation area in the MDB. However, not all that water is available in locales where there is an irrigation demand. Within river regions, the subsurface storages fall into three classes:
(1) Storage capacity significantly exceeds localised annual irrigation water use (>3 m) and includes four river regions: Paroo, Warrego (Figure 5a), Darling (Figure 5b), and Castlereagh. The Paroo River region had the third largest groundwater storage potential of 0.6 × 10⁹ m3 but contained relatively little irrigated agriculture (3 km2) and none within 5 km of potential storage zones. Such storages, if recharged, could be released back into streams to service downstream irrigation areas directly or by substituting environmental flows, after accounting for transmission losses between water recovery and use locations.
(2) Storage capacity is similar in magnitude to localised annual water use (0.3–0.7 m) and includes three river regions: Condamine–Culgoa (Figure 5c), Macquarie–Bogan (Figure 5d), and Benanee–Willandra. Such storages, when recharged, could make a substantial improvement to water security for a wide variety of local crops. Broader benefits could be achieved by banked water supplies substituting for direct irrigation from rivers, allowing more water to flow downstream.
(3) Storage capacity is smaller than localised annual water use (<0.3 m); this includes many river regions but those with greatest storage potential are the Namoi River (Figure 5e) and Border Rivers (Figure 5f). In such areas, recharged storages could make a useful difference for a proportion of farms where small supplemental irrigation would make a large difference to production (e.g., pasture, cereals, broadacre crops) or to sustain fixed rooted crops where these are not a large fraction of irrigated land.
Storage areas could also be suitable for recovery for town water supplies, stock water, or environmental flows, subject to assessment following the processes laid out in Australian Guidelines for Managed Aquifer Recharge [21].
Infiltration techniques require surficial, unconfined aquifers with adequate storage space and conductivity for storage and recovery. In the MDB, the surficial geology indicated extensive alluvium, colluvium, and sand plain formations (Figure 2a) that were considered the most suitable geological settings for infiltration-based MAR. Other surficial geology in the MDB (Figure 2a) comprised a range of typically lower permeability, finer grained, more highly consolidated, siliclastic and igneous formations that are less conducive to infiltration than unconsolidated and typically younger sediments. The use of national scale surface geology data is appropriate for regional scale assessment, however, site-scale feasibility assessments will require much greater hydrogeological understanding, particularly of groundwater level trends, porosity, and conductivity.
The Australian MAR guidelines [21] recommend a minimum water table depth of 4 m in rural areas to reduce risks of water logging, salinity, and geotechnical constraints that could be induced through aquifer recharge. In this study, a minimum water table depth of 5 m was applied, allowing for a water table rise of 1 m to remain below the 4 m threshold. There would likely be discharge of stored water back into the stream if the water table in the aquifer adjacent to a stream rises above stream water level, and hence that water would not be available for subsequent recovery. In reality, a tighter constraint on water banking occurs in reaches where streams are already losing water to aquifers. This would continue to occur unabated until the water table reached the base of the stream bed. Then, the natural seepage from the stream would diminish significantly as the stream and aquifer become hydraulically connected [64]. At this point, the actual net increase in recharge due to water banking would be that recorded in infiltration basins minus the decrease in natural recharge caused by hydraulic connection. There is a solution to this—to harvest water by bank filtration for banking in a storage further from the stream; however, for simplicity, we are assuming that water table rise beneath the stream to the base of the stream bed at its closest point to the recharge basin is the realistic limit.

3.2. Sub-Catchment Recharge Simulation

The lower Macquarie River area near Dubbo, NSW, was selected as a recharge simulation case study as it was identified as having additional storage capacity similar in magnitude to localised annual irrigation water use, water security had been identified as a recent issue, and there were hydrological and economic data available. The main upstream storage on the Macquarie River, Burrendong Dam (Figure 4), with a capacity of 1.2 × 10⁹ m3, is the eighth largest storage in the MDB, and in March 2020 was reduced to 12% capacity, the lowest in the MDB at the time. The region was in drought and the Dubbo town water supply was at critically low levels with an estimated less than 6 months’ supply until water trucking or other emergency supply measures would be required. Dubbo’s urban water supply servicing 40,000 residents is sourced primarily from the Macquarie River (70%), and the remaining source (30%) is from groundwater [65]. Narromine urban water supply is sourced from a range of bores in the area [66]. In the Macquarie–Castlereagh region, irrigation rates over 2006–2018 were between 0.27 m and 0.42 m (average 0.31 m), with a total use averaging 192 × 106 m3/year [63].
In the Macquarie–Bogan River region, the potential aquifer storage volume within 5 km of major rivers also within 5 km of existing irrigated areas would provide a total of 0.37 m of irrigation across those areas (Table 2). Within surficial aquifers having a groundwater salinity of <1500 mg/L there is a potential additional storage volume of 260 × 106 m3 (Table 1). Median standing water levels from bore records since January 2000 [55] indicated that the water table is generally >8 m in the Lower Macquarie Alluvium groundwater management zone near Narromine in NSW (Figure 6a), and thus potential storage volumes could be an order of magnitude larger than indicated in Table 2. Median bore salinity observations since January 2000 appear to broadly agree with the salinity class layer [42] used in the regional assessment (Figure 6b). The area features substantial irrigation demand from surface and groundwater sources for high value, mainly for non-perennial agriculture (Figure 6). Modelling indicates that current levels of groundwater extraction in the Lower Macquarie region cannot be sustained, with climate change and growing demand being expected to put further pressure on water resources [52].
Figure 7 shows the 55-year time series of water banking scenarios for three representative recharge capacities across the range tested (1–12 × 106 m3/month). In all simulations, recharge could occur only in months when Burrendong Dam storage exceeded 25% of capacity. However, the monthly recharge volume was arbitrarily capped at a maximum of 1% of monthly discharge at Dubbo Gauging Station (smaller than the precision of discharge measurements), and up to the specified monthly recharge capacity. The monthly rate of recovery was taken to be the same as the maximum recharge capacity for each water bank size, and occurred whenever the volume in Burrendong Dam dropped below 10% capacity.
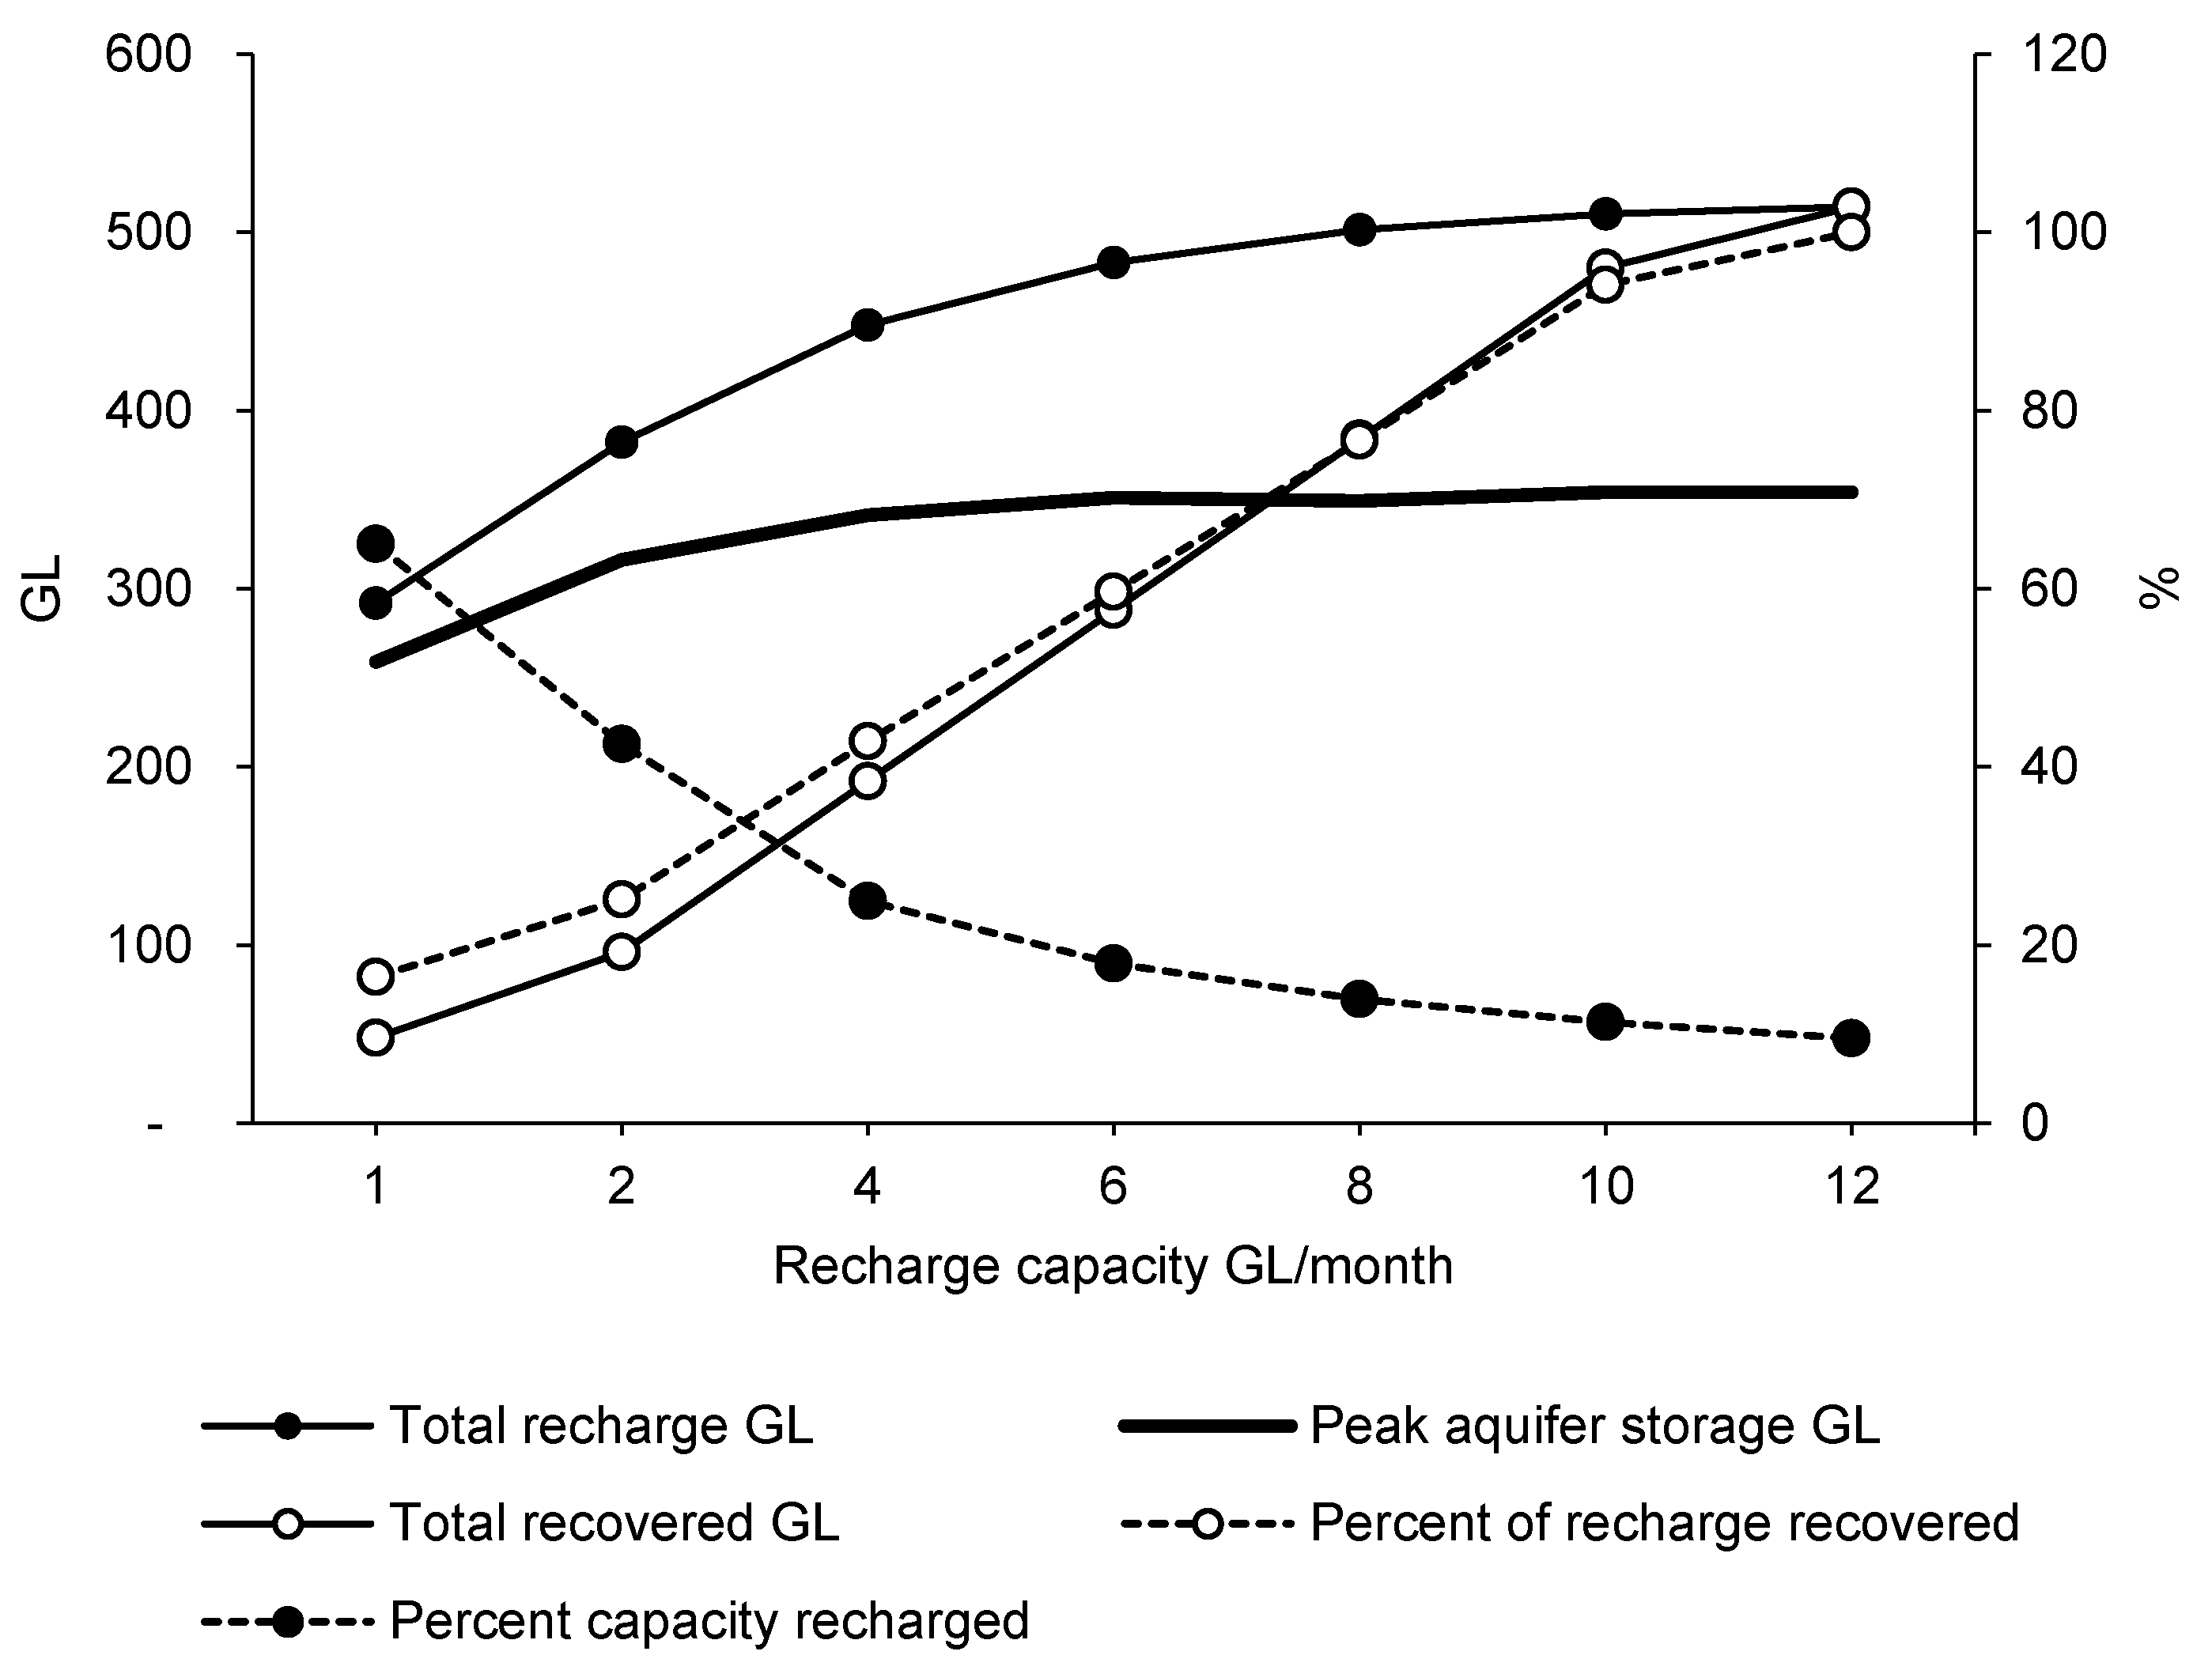
Figure 7 shows the initial filling of the dam over about 5 years from 1965 and shows that up until the mid-1990s, storage remained above 10% most of the time and hence the water bank was accumulating recharge and thus recovery credits. After this point, Burrendong storage began to dip below this level more frequently, and hence water was recovered more frequently from the water bank. This highlights the effect of lower rainfall and runoff on surface storages during the millennium drought that occurred in southern Australia from the mid-1990s to late 2000s [67]. For all simulations across the 663-month times series, recharge occurred in 449 months and recovery in 48 months (43 months at 12 × 106 m3/month capacity). Figure 6 shows that in order to supplement supplies during extended low flows at the end of the time series, multiple recharge cycles and years of storage were required to accumulate sufficient volumes. Simulations also showed that reaching peak storage was not highly sensitive to recharge capacity, indicating the constraint of water availability (here assuming a maximum of 1% of river flow). Lower capacity, however, resulted in more carry-over of stored water as it could not be drawn down as rapidly.
Over the millennium drought period (here assuming a start of 1997 to an end of 2009), the water bank was able to supply between 24 × 106 m3 and 288 × 106 m3, depending on scheme capacity. Increasing the proportion of river discharge available for recharge to 2% had no effect on recoverable volumes during the drought period or across the entire time series for capacities up to 10 × 106 m3/month; an additional 48 × 106 m3 (total 336 × 106 m3) was recovered at 12 × 106 m3/month.
The cumulative total volume recharged increased with increasing scheme capacity up to 8 × 10⁶ m3/month and the volumes recharged as a percentage of recharge capacity declined from 65% for 1 × 10⁶ m3/month capacity to 10% for 12 × 106 m3/month, indicating that source water availability was a tighter constraint on water banking than the capacity of the aquifer to contain this volume (Figure 8). Maximum peak aquifer storage of 350 × 106 m3 was reached with a capacity of 6 × 10⁶ m3/month, beyond this capacity the volume of available water limited storage. Increasing river discharge available for recharge from 1% to 2% almost doubled the peak storage volume recharged to 655 × 106 m3 with a 6 × 10⁶ m3/month capacity. Figure 8 also shows that the recovery rate (here equal to recharge rate) limited the ability to access stored water as a proportion of recharge. Across the time series, only higher capacities fully utilised storage. This type of modelling can be used to find the right balance between recharge capacity, time needed to build storage, and withdrawal rate. An amount of carry-over of stored water is part of the aim of water banking to provide drought resilience over the long term. This would be facilitated by a review of existing limits around carry-over (e.g., beyond a water accounting year) and is one aspect impeding progress towards integrated surface water–groundwater management in the MDB [68].
This type of modelling could be used to design the specifications for a water bank and the way in which it is operated in order to achieve specified reliability of supplies. For multiple water banks in a catchment, there could be an observable cumulative impact on moderate flows. Hence, it is suggested that water banking needs to be considered and managed across hydrologically connected systems and account for surface water and groundwater entitlements and allocations at the appropriate scale [68].
Water banking substitutes groundwater storage for surface water storage with the advantage of reducing losses through evaporation that can be significant, particularly in higher surface area to volume storages. An approximate estimate of mean annual evaporative loss for Burrendong Dam of about 50 × 106 m3 was made using mean monthly pan evaporation at the site, applying a pan factor of 0.794 representative of MDB mid-point at Cobar [69], and half the total surface area (7200 ha) of the dam. Further downstream, Menindee Lakes, with a similar capacity to Burrendong but a surface area of 45,700 ha, loses 400 × 106 m3/year on average through evaporation, and Lake Victoria, with a surface area of 12,200 ha and about half the capacity, loses 130 × 106 m3/year [60]. An evaluation of Lake Victoria mean monthly evaporation rate with respect to mean monthly temperature revealed an 8.7% increase in evaporation for each 1°C increase in temperature and compared to an 8% increase in evaporation estimated for a large reservoir in southeast Queensland with a 1.1 °C rise for a 2030–2050 climate simulation [4]. Through water banking, downstream storages could be held at lower levels and surface area over sustained periods and the combined system offers potential for evaporation savings while achieving the same level of water security. Assuming a minimum infiltration rate of 0.1 m/day, a mean daily evaporation rate of 0.002–0.008 m (at Dubbo station 065034) depending on time of year represents an evaporative loss of 2–8% during infiltration.
Results of simulations over the water trading period indicated that full utilisation of the banked volume was not reached below a recharge capacity of 6 × 10⁶ m3/month (Figure 9); however, this is dependent on the flow and trade price pattern across a relatively short time series. Over the 55-year simulations using dam level to trigger recharge and recovery, recovery of the full recharge volume only occurred at a capacity of 12 × 106 m3/month (Figure 8). The ratio of levelised cost of supply to the value of water on recovery indicated that the minimum capacity for MAR to show a net economic benefit (where the value of recovered water exceeded recharge cost) was 2 × 10⁶ m3/month (Figure 9). The ratio increased linearly in relation to recharge capacity up to 6 × 10⁶ m3/month, with a benefit/cost ratio of 2.
Across the simulations, average water supply costs ranged from AUD 0.88/m3 at a recharge capacity of 1 × 10⁶ m3/month to AUD 0.32/m3 at a recharge capacity of 6 × 10⁶ m3/month or more. The total value of recovered water (based on trade prices in the months of recovery) ranged from AUD 5.6 million to AUD 32 million, and the total value of recovered water was over AUD 30 million for recharge capacities > 6 × 10⁶ m3/month. It was decided that a trade price of AUD 0.35/m3 would be used as the trigger for recovery, as that represented the meeting of known demand. However, if water was recovered from the water bank at a threshold price, here assuming AUD 0.35/m3, this would likely stabilise prices at a lower level than that which historically occurred and would avoid spikes in very dry years. The benefits of using aquifers for water banking could accrue to irrigators, suggesting that policies on ownership of water banks needs careful consideration to maximise the benefits and broaden their distribution.

4. Conclusions

While water banks have been used successfully in the United States in areas with high evaporation to secure water supplies for irrigation and for cities and towns, they are yet to be applied in similar semi-arid areas of Australia to improve resilience of water supplies. The Murray–Darling Basin uses a high proportion of highly variable river flows for irrigation that is increasingly at risk due to changing climate. An opportunity assessment was considered an essential first step to investment in water banking in the MDB.
The screening process to exclude unsuitable sites was simple to apply over an area of 1 million km2 and avoided the need for setting weights for each factor as is commonly done in multi-criteria analyses. In spite of the rich density of some spatial data used in the analysis, there are uncertainties concerning the utility of some factors. The method proved to be a reliable indicator of potential at existing MAR operations or investigation sites. However, it is not a substitute for site-specific field investigations, and until further studies are undertaken, the reliability of the estimated aggregate additional storage capacity of aquifers cannot be evaluated.
The preliminary evaluation revealed additional aquifer storage capacity of the order of 4 × 10⁹ m3 in surficial aquifers within 5 km of major watercourses across the MDB. This represents 16% of the 25 × 109 m3 total accessible capacity of surface storages across the basin and approximately 4 years of current groundwater supplies of irrigation water. If fully recharged, this would provide ≈0.45 m of storage for almost 9000 km2 of existing irrigation area in the MDB as a drought buffer or to preserve environmental flows. Areas where mapped characteristics suggest strong possibilities for substantial storage were found in Queensland, NSW, and Victoria and agree with previous local-scale assessments including a region in South Australia where aquifer storage and recovery has been applied since the 1980s.
A simple monthly simulation model was developed using historical monthly upstream reservoir storage and monthly stream flows to determine the recharge and recovery capacity of a water bank to best match available surface water with the estimated additional storage capacity of the aquifer. This is only a single realisation of a stochastic flow record but was helpful in revealing the types of issues that can occur such as the need to have sufficient water banked before a water bank can contribute meaningfully to drought water supplies. Many more factors need consideration such as strategies to address multi-year droughts and broadening the beneficiaries of any MAR operation to a catchment-wide scale. Extending to stochastic modelling could be used to design a water bank to achieve specified reliability of supplies, as well as to address cumulative impacts of multiple water banks in a catchment.
The operation of water allocation markets in the catchments of the MDB simplified the process of identifying costs and benefits of recharge and recovery, enabling novel water banking simulations based on the price of surface water allocations. These could possibly be improved through stochastic simulations using price elasticity information for the market where water banking is being considered.
For one of the identified prospective regions in the Macquarie River catchment near Dubbo in NSW, preliminary modelling using a 55-year time series of monthly hydrological data suggests the additional storage capacity of the Lower Macquarie Alluvium could be fully accessed by infiltration systems with a combined capacity of 6 × 10⁶ m3/month. Simulations over the water trading period between July 2009 and January 2020 indicated that the value of banked water once recovered was higher than water banking and supply costs for capacities > 3 × 10⁶ m3/month and the total value of recovered water could exceed AUD 30 million for capacities of 6 × 10⁶ m3/month or more. On the basis of reported average levelised cost of managed aquifer recharge using infiltration methods, and using actual trading prices in the Macquarie River, the benefit–cost ratio of water banking near Dubbo was estimated to be up to 2, neglecting the future value of unrecovered banked water.
A site-specific benefit–cost analysis would require an assessment of infiltration rates for available land to size suitable basins and to determine costs of infrastructure for recharging and recovering water, as well as investigations to assess potential impacts of such operations. In this case, availability of water for recharge was a tighter constraint than the estimated storage capacity of surficial aquifers. It is anticipated that consultations with local communities and agencies would be required to prioritise sites for further investigation, determine operating procedures, and commence pilot operations prior to scaling up at specific locations before replication in other prospective areas. Water banking needs to be considered and managed across hydrologically connected systems and account for surface water and groundwater entitlements and allocations at the appropriate scale. A review of policy and regulatory aspects will contribute to a clearer understanding of the considerations required for effective operation of water banking in the basin.

Author Contributions

Conceptualisation, data curation, formal analysis, writing—original draft, visualisation: D.G.; conceptualisation, writing—review and editing: P.D.; writing—review and editing: D.P. and J.V. All authors have read and agreed to the published version of the manuscript.

Funding

This research received no external funding.

Acknowledgments

The authors are grateful to the following organisations for provided data used in the analysis: Water NSW, Murray Darling Basin Authority, Bureau of Meteorology, and South Australian Water Corporation. The authors also thank John Radcliffe, Graham Bonnet, Russell Wise, and David Post for their invaluable feedback during internal review and the three anonymous reviewers for “Water” whose suggestions also significantly improved the manuscript. We acknowledge the financial support of the CSIRO that enabled the production of this paper.

Conflicts of Interest

The authors declare no conflict of interest. This paper does not contain any part of an organisational plan of any Australian jurisdiction. Recommendations in this paper should not be taken to represent the position of authors’ organisations.

References

  1. Dillon, P.J. Australian progress in managed aquifer recharge and the water banking frontier. J. Aus. Water Assoc. 2015, 42, 53–57. [Google Scholar]
  2. Megdal, S.B.; Dillon, P.; Seasholes, K. Water Banks: Using Managed Aquifer Recharge to Meet Water Policy Objectives. Water 2014, 6, 1500–1514. [Google Scholar] [CrossRef] [Green Version]
  3. Craig, I.; Green, A.; Scobie, M.; Schmidt, E. Controlling Evaporation Loss from Water Storages; Publication University of Southern Queensland: Toowoomba, Australia, 2005. [Google Scholar]
  4. Helfer, F.; Lemckert, C.; Zhang, H. Impacts of climate change on temperature and evaporation from a large reservoir in Australia. J. Hydrol. 2012, 475, 365–378. [Google Scholar] [CrossRef] [Green Version]
  5. Scanlon, B.R.; Faunt, C.C.; Longuevergne, L.; Reedy, R.C.; Alley, W.M.; McGuire, V.L.; McMahon, P.B. Groundwater depletion and sustainability of irrigation in the US High Plains and Central Valley. Proc. Natl. Acad. Sci. USA 2012, 109, 9320–9325. [Google Scholar] [CrossRef] [Green Version]
  6. Scanlon, B.R.; Reedy, R.C.; Faunt, C.C.; Pool, D.; Uhlman, K. Enhancing drought resilience with conjunctive use and managed aquifer recharge in California and Arizona. Environ. Res. Lett. 2016, 11, 035013. [Google Scholar] [CrossRef] [Green Version]
  7. Megdal, S.B.; Dillon, P. Policy and Economics of Managed Aquifer Recharge and Water Banking. Water 2015, 7, 592–598. [Google Scholar] [CrossRef]
  8. Megdal, S. Arizona Groundwater Management. Ph.D. Thesis, University of Arizona, Tucson, AZ, USA, 15 October 2012. [Google Scholar]
  9. Dillon, P.; Stuyfzand, P.; Grischek, T.; Lluria, M.; Pyne, R.D.G.; Jain, R.C.; Bear, J.; Schwarz, J.; Wang, W.; Fernandez, E.; et al. Sixty years of global progress in managed aquifer recharge. Hydrogeol. J. 2018, 27, 1–30. [Google Scholar] [CrossRef] [Green Version]
  10. Gao, L.; Connor, J.D.; Dillon, P. The Economics of Groundwater Replenishment for Reliable Urban Water Supply. Water 2014, 6, 1662–1670. [Google Scholar] [CrossRef]
  11. Khan, S.J.; Anderson, R. Potable reuse: Experiences in Australia. Curr. Opin. Environ. Sci. Health 2018, 2, 55–60. [Google Scholar] [CrossRef]
  12. ABARES. Irrigated farms in the Murray-Darling Basin Australian Government Department of Agriculture, Water and the Environment, Australia. Available online: https://www.agriculture.gov.au/abares/research-topics/surveys/irrigation (accessed on 11 September 2020).
  13. Heberger, M. Australia’s Millennium Drought: Impacts and Responses; Island Press: Washington, DC, USA, 2012; pp. 97–125. [Google Scholar]
  14. CSIRO. Water availability in the Murray-Darling Basin. In A Report to the Australian Government from the CSIRO Murray-Darling Basin Sustainable Yields Project; Commonwealth Scientific and Industrial Research Organisation (CSIRO): CSIRO, Canberra, Australia, 2008; p. 67. [Google Scholar]
  15. ANZECC-ARMCANZ. Australian and New Zealand Guidelines for Fresh and Marine Water Quality; Australian New Zealand Environment Conservation Council Agriculture Resource Management Council of Australia New Zealand: Canberra, Australia, 2000.
  16. Ward, J.D.; Simmons, C.T.; Dillon, P.; Pavelic, P. Integrated assessment of lateral flow, density effects and dispersion in aquifer storage and recovery. J. Hydrol. 2009, 370, 83–99. [Google Scholar] [CrossRef]
  17. Gonzalez, D.; Page, D.; Vanderzalm, J.; Dillon, P. Setting Water Quality Trigger Levels for the Operation and Management of a MAR System in Parafield, South Australia. J. Hydrol. Eng. 2015, 20, B5014001. [Google Scholar] [CrossRef]
  18. Clark, R.; Gonzalez, D.; Dillon, P.; Charles, S.; Cresswell, D.; Naumann, B. Reliability of water supply from stormwater harvesting and managed aquifer recharge with a brackish aquifer in an urbanising catchment and changing climate. Environ. Model. Softw. 2015, 72, 117–125. [Google Scholar] [CrossRef]
  19. Rodríguez-Escales, P.; Canelles, A.; Sanchez-Vila, X.; Folch, A.; Kurtzman, D.; Rossetto, R.; Escalante, E.F.; Lobo-Ferreira, J.-P.; Sapiano, M.; San-Sebastián, J.; et al. A risk assessment methodology to evaluate the risk failure of managed aquifer recharge in the Mediterranean Basin. Hydrol. Earth Syst. Sci. 2018, 22, 3213–3227. [Google Scholar] [CrossRef] [Green Version]
  20. American Society of Civil Engineers. Standard Guidelines for Managed Aquifer Recharge. ASCE/EWRI 69-19. Am. Soc. Civil Eng. 2020, 127–130. [Google Scholar] [CrossRef]
  21. NRMMC-EPHC-NHMRC. Australian Guidelines for Water Recycling, Managing Health and Environmental Risks; Natural Resource Management Ministerial Council, Environment Protection and Heritage Council National Health and Medical Research Council: Canberra, Australia, 2009; p. 237.
  22. Dillon, P.; Pavelic, P.; Page, D.; Beringen, H.; Ward, J. Managed Aquifer Recharge: An Introduction; National Water Commission: Canberra, Australia, 2009; p. 65. [Google Scholar]
  23. Ross, A.; Hasnain, S. Factors affecting the cost of managed aquifer recharge (MAR) schemes. Sustain. Water Resour. Manag. 2018, 4, 179–190. [Google Scholar] [CrossRef]
  24. Dillon, P. Managing Aquifer Recharge in Integrated Solutions to Groundwater Challenges; Informa UK Limited: Sheepen, UK, 2016; pp. 3–16. [Google Scholar]
  25. ABS. Water and the Murray–Darling Basin—A Statistical Profile, 2000–2001 to 2005–2006; Australian Bureau of Statistics: Canberra, Australia, 2008. [Google Scholar]
  26. BOM. National Water Account 2019. Available online: http://www.bom.gov.au/water/nwa/2019/mdb/index.shtml (accessed on 30 September 2020).
  27. Potter, N.; Chiew, F.H.S.; Frost, A. An assessment of the severity of recent reductions in rainfall and runoff in the Murray–Darling Basin. J. Hydrol. 2010, 381, 52–64. [Google Scholar] [CrossRef]
  28. MDBA. Discover the Basin—Landscape. Murray-Darling Basin Authority. Available online: https://www.mdba.gov.au/discover-basin/landscape (accessed on 11 September 2020).
  29. Barron, O.V.; Crosbie, R.S.; Charles, S.P.; Dawes, W.R.; Ali, R.; Evans, W.R.; Cresswell, R.; Pollock, D.; Hodgson, G.; Currie, D.; et al. Climate Change Impact on Groundwater Resources in Australia; Waterlines Report Series; National Water Commission: Turner, Australia, 2011. [Google Scholar]
  30. Crosbie, R.S.; McCallum, J.L.; Walker, G.R.; Chiew, F.H.S. Episodic recharge and climate change in the Murray-Darling Basin, Australia. Hydrogeol. J. 2011, 20, 245–261. [Google Scholar] [CrossRef]
  31. MDBA. Statement of Expectations for Managing Groundwater. In Groundwater Management in the Murray–Darling Basin; Murray-Darling Basin Authority: Canberra, Australia, 2019. [Google Scholar]
  32. Ife, D.; Skelt, K. Murray-Darling Basin Groundwater Status 1990–2000: Summary Report; Murray-Darling Basin Commission: Canberra, Australia, 2004.
  33. Leblanc, M.; Tweed, S.; Van Dijk, A.; Timbal, B. A review of historic and future hydrological changes in the Murray-Darling Basin. Glob. Planet. Chang. 2012, 80, 226–246. [Google Scholar] [CrossRef]
  34. DAWE. Environmental Water Holdings. Department of Agriculture, Water and Environment, Australian Government. Available online: http://www.environment.gov.au/water/cewo/about/water-holdings (accessed on 30 September 2020).
  35. MDBA. Water Markets and Trade. Murray–Darling Basin Authority. Australian Government. Available online: https://www.mdba.gov.au/managing-water/water-markets-and-trade (accessed on 11 September 2020).
  36. Grafton, Q.; Colloff, M.; Marshall, V.; Williams, J. Confronting a post-truth water world in the Murray-Darling Basin, Australia. Water Altern. 2020, 13, 1–28. [Google Scholar]
  37. Malczewski, J. GIS and Multicriteria Decision Analysis; John Wiley & Sons: New York, NY, USA, 1999. [Google Scholar]
  38. Gallant, J.; Wilson, N.; Dowling, T.; Read, A.; Inskeep, C. SRTM-Derived 1 Second Digital Elevation Models Version 1.0; Geoscience Australia: Canberra, Australia, 2011.
  39. Grundy, M.J.; Rossel, R.A.V.; Searle, R.D.; Wilson, P.L.; Chen, C.; Gregory, L. Soil and Landscape Grid of Australia. Soil Res. 2015, 53, 835–844. [Google Scholar] [CrossRef]
  40. Raymond, O.L.; Liu, S.; Gallagher, R.; Zhang, W.; Highet, L.M. Surface Geology of Australia 1:1 Million Scale Dataset; Geoscience Australia: Canberra, Australia, 2012.
  41. Wilford, J.; Searle, R.; Thomas, M.; Grundy, M. Soil and Landscape Grid National Soil Attribute Maps-Depth of Regolith (3’’ resolution)—Release 2. v6. CSIRO Data Collect. 2015. Available online: https://data.csiro.au/collections/collection/CIcsiro:11393v6 (accessed on 13 October 2020). [CrossRef]
  42. MDBC. Hydrogeology of the Murray Basin (1:250,000); Murray Darling Basin Commission: Canberra, Australia, 2000.
  43. Valverde, J.P.B.; Blank, C.; Roidt, M.; Schneider, L.; Stefan, C. Application of a GIS Multi-Criteria Decision Analysis for the Identification of Intrinsic Suitable Sites in Costa Rica for the Application of Managed Aquifer Recharge (MAR) through Spreading Methods. Water 2016, 8, 391. [Google Scholar] [CrossRef]
  44. Zaidi, F.K.; Nazzal, Y.; Ahmed, I.; Naeem, M.; Jafri, M.K. Identification of potential artificial groundwater recharge zones in Northwestern Saudi Arabia using GIS and Boolean logic. J. Afr. Earth Sci. 2015, 111, 156–169. [Google Scholar] [CrossRef]
  45. Heath, R.C. Basic Ground-Water Hydrology; US Department of the Interior: Washington, DC, USA, 1998; Volume 2220.
  46. Dillon, P.; Arshad, M. Managed Aquifer Recharge. In Integrated Groundwater Management; Jakeman, A.J., Barreteau, O., Hunt, R.J., Rinaudo, J.D., Ross, A., Eds.; Springer: Cham, Switzerland, 2016; Chapter 17; pp. 435–452. [Google Scholar] [CrossRef] [Green Version]
  47. Alakayleh, Z.; Clement, T.P.; Fang, X. Understanding the Changes in Hydraulic Conductivity Values of Coarse- and Fine-Grained Porous Media Mixtures. Water 2018, 10, 313. [Google Scholar] [CrossRef] [Green Version]
  48. Morris, D.; Johnson, A. Summary of Hydrologic and Physical Properties of Rock and Soil Materials, as Analyzed by the Hydrologic Laboratory of the U.S. Geological Survey, 1948–1960; US Geological Survey: Washington, DC, USA, 1967.
  49. BOM. Australian Hydrological Geospatial Fabric; Australian Bureau of Meteorology: Canberra, Australia, 2012.
  50. ACLUMP. Catchment Scale Land Use of Australia—Update December 2018. In Australian Collaborative Land Use and Management Program (ACLUMP); Australian Government Department of Agriculture: Canberra, Australia, 2018. [Google Scholar]
  51. ATO. Consumer Price Index (CPI) Rates. Available online: https://www.ato.gov.au/Rates/Consumer-price-index/ (accessed on 11 September 2020).
  52. CSIRO; SKM. Report Cards for Groundwater Sustainable Diversion Limit Areas for the Murray-Darling Basin Plan; CSIRO, Water for a Healthy Country National Research Flagship: Canberra, Australia, 2010; p. 95. [Google Scholar]
  53. Hope, M. Greater Macquarie Catchment Irrigation Profile; NSW Agriculture: New South Wales, Australia, 2003.
  54. NSW-DPI. Salinity Tolerance in Irrigated Crops; NSW Department of Primary Industries: New South Wales, Australia, 2017.
  55. BOM. National Groundwater Information System; Australian Bureau of Meteorology: Canberra, Australia, 2020.
  56. CSIRO; SKM. Sustainable Extraction Limits Derived from the Recharge Risk Assessment Method—South Australia; CSIRO, Water for a Healthy Country National Research Flagship: Canberra, Australia, 2010; p. 51. [Google Scholar]
  57. DEW. Angas Bremer PWA Murray Group Limestone Aquifer 2018 Groundwater Level and Salinity Status Report; Government of South Australia, Department for Environment and Water: Adelaide, Australia, 2019.
  58. DEW. Water Allocation Plan, Eastern Mount Lofty Ranges; South Australian Murray-Darling Basin Natural Resources Management Board; Department for Environment and Water (DEW), Government of South Australia: Adelaide, Australia, 2019.
  59. Lawrie, K.C.; Brodie, R.S.; Tan, K.P.; Somerville, P.; Gibson, D.; Magee, J.; Clarke, J.D.A.; Gow, L.; Halas, L.; Apps, H.E.; et al. BHMAR Project: Assessment of Potential Groundwater Resources and Underground Storage Options in the Darling Floodplain; Geoscience Australia: Canberra, Australia, 2012; p. 876.
  60. NSW-DPI. Water Management Fact Sheet. In Measurement and Comparison of Evaporation in Water Storages; NSW Department of Primary Industries: New South Wales, Australia, 2019. [Google Scholar]
  61. Fuentes, I.; Vervoort, R.W. Site suitability and water availability for a managed aquifer recharge project in the Namoi basin, Australia. J. Hydrol. Reg. Stud. 2020, 27, 100657. [Google Scholar] [CrossRef]
  62. Martin, R.; Whittington, H.; Young, W.; Lush, A. Managed aquifer recharge to support environmental outcomes on the Katarapko Floodplain. In Proceedings of the 10th International Symposium on Managed Aquifer Recharge, Madrid, Spain, 20–24 May 2019. [Google Scholar]
  63. Gupta, M.; Westwood, T.; Legg, P. MDB Water Market Dataset; Australian Bureau of Agricultural and Resource Economics and Sciences: Canberra, Australia, 2020. [CrossRef]
  64. Dillon, P.J.; Liggett, J.A. An ephemeral stream-aquifer interaction model. Water Resour. Res. 1983, 19, 621–626. [Google Scholar] [CrossRef]
  65. DRC. Water Management and Supply. Dubbo Regional Council. Available online: https://www.dubbo.nsw.gov.au/Our-Region-and-Environment/Water--sewerage-and-drainage/water-management-supply (accessed on 11 September 2020).
  66. NSC. Water Supply Networks. Narromine Shire Council. Available online: https://www.narromine.nsw.gov.au/environment/water (accessed on 11 September 2020).
  67. Cai, W.; Purich, A.; Cowan, T.; Van Rensch, P.; Weller, E. Did Climate Change–Induced Rainfall Trends Contribute to the Australian Millennium Drought? J. Clim. 2014, 27, 3145–3168. [Google Scholar] [CrossRef]
  68. Ross, A. Easy to say, hard to do: Integrated surface water and groundwater management in the Murray–Darling Basin. Hydrol. Res. 2012, 14, 709–724. [Google Scholar] [CrossRef]
  69. McMahon, T.A.; Peel, M.; Lowe, L.; Srikanthan, R.; McVicar, T.R. Estimating actual, potential, reference crop and pan evaporation using standard meteorological data: A pragmatic synthesis. Hydrol. Earth Syst. Sci. 2013, 17, 1331–1363. [Google Scholar] [CrossRef] [Green Version]
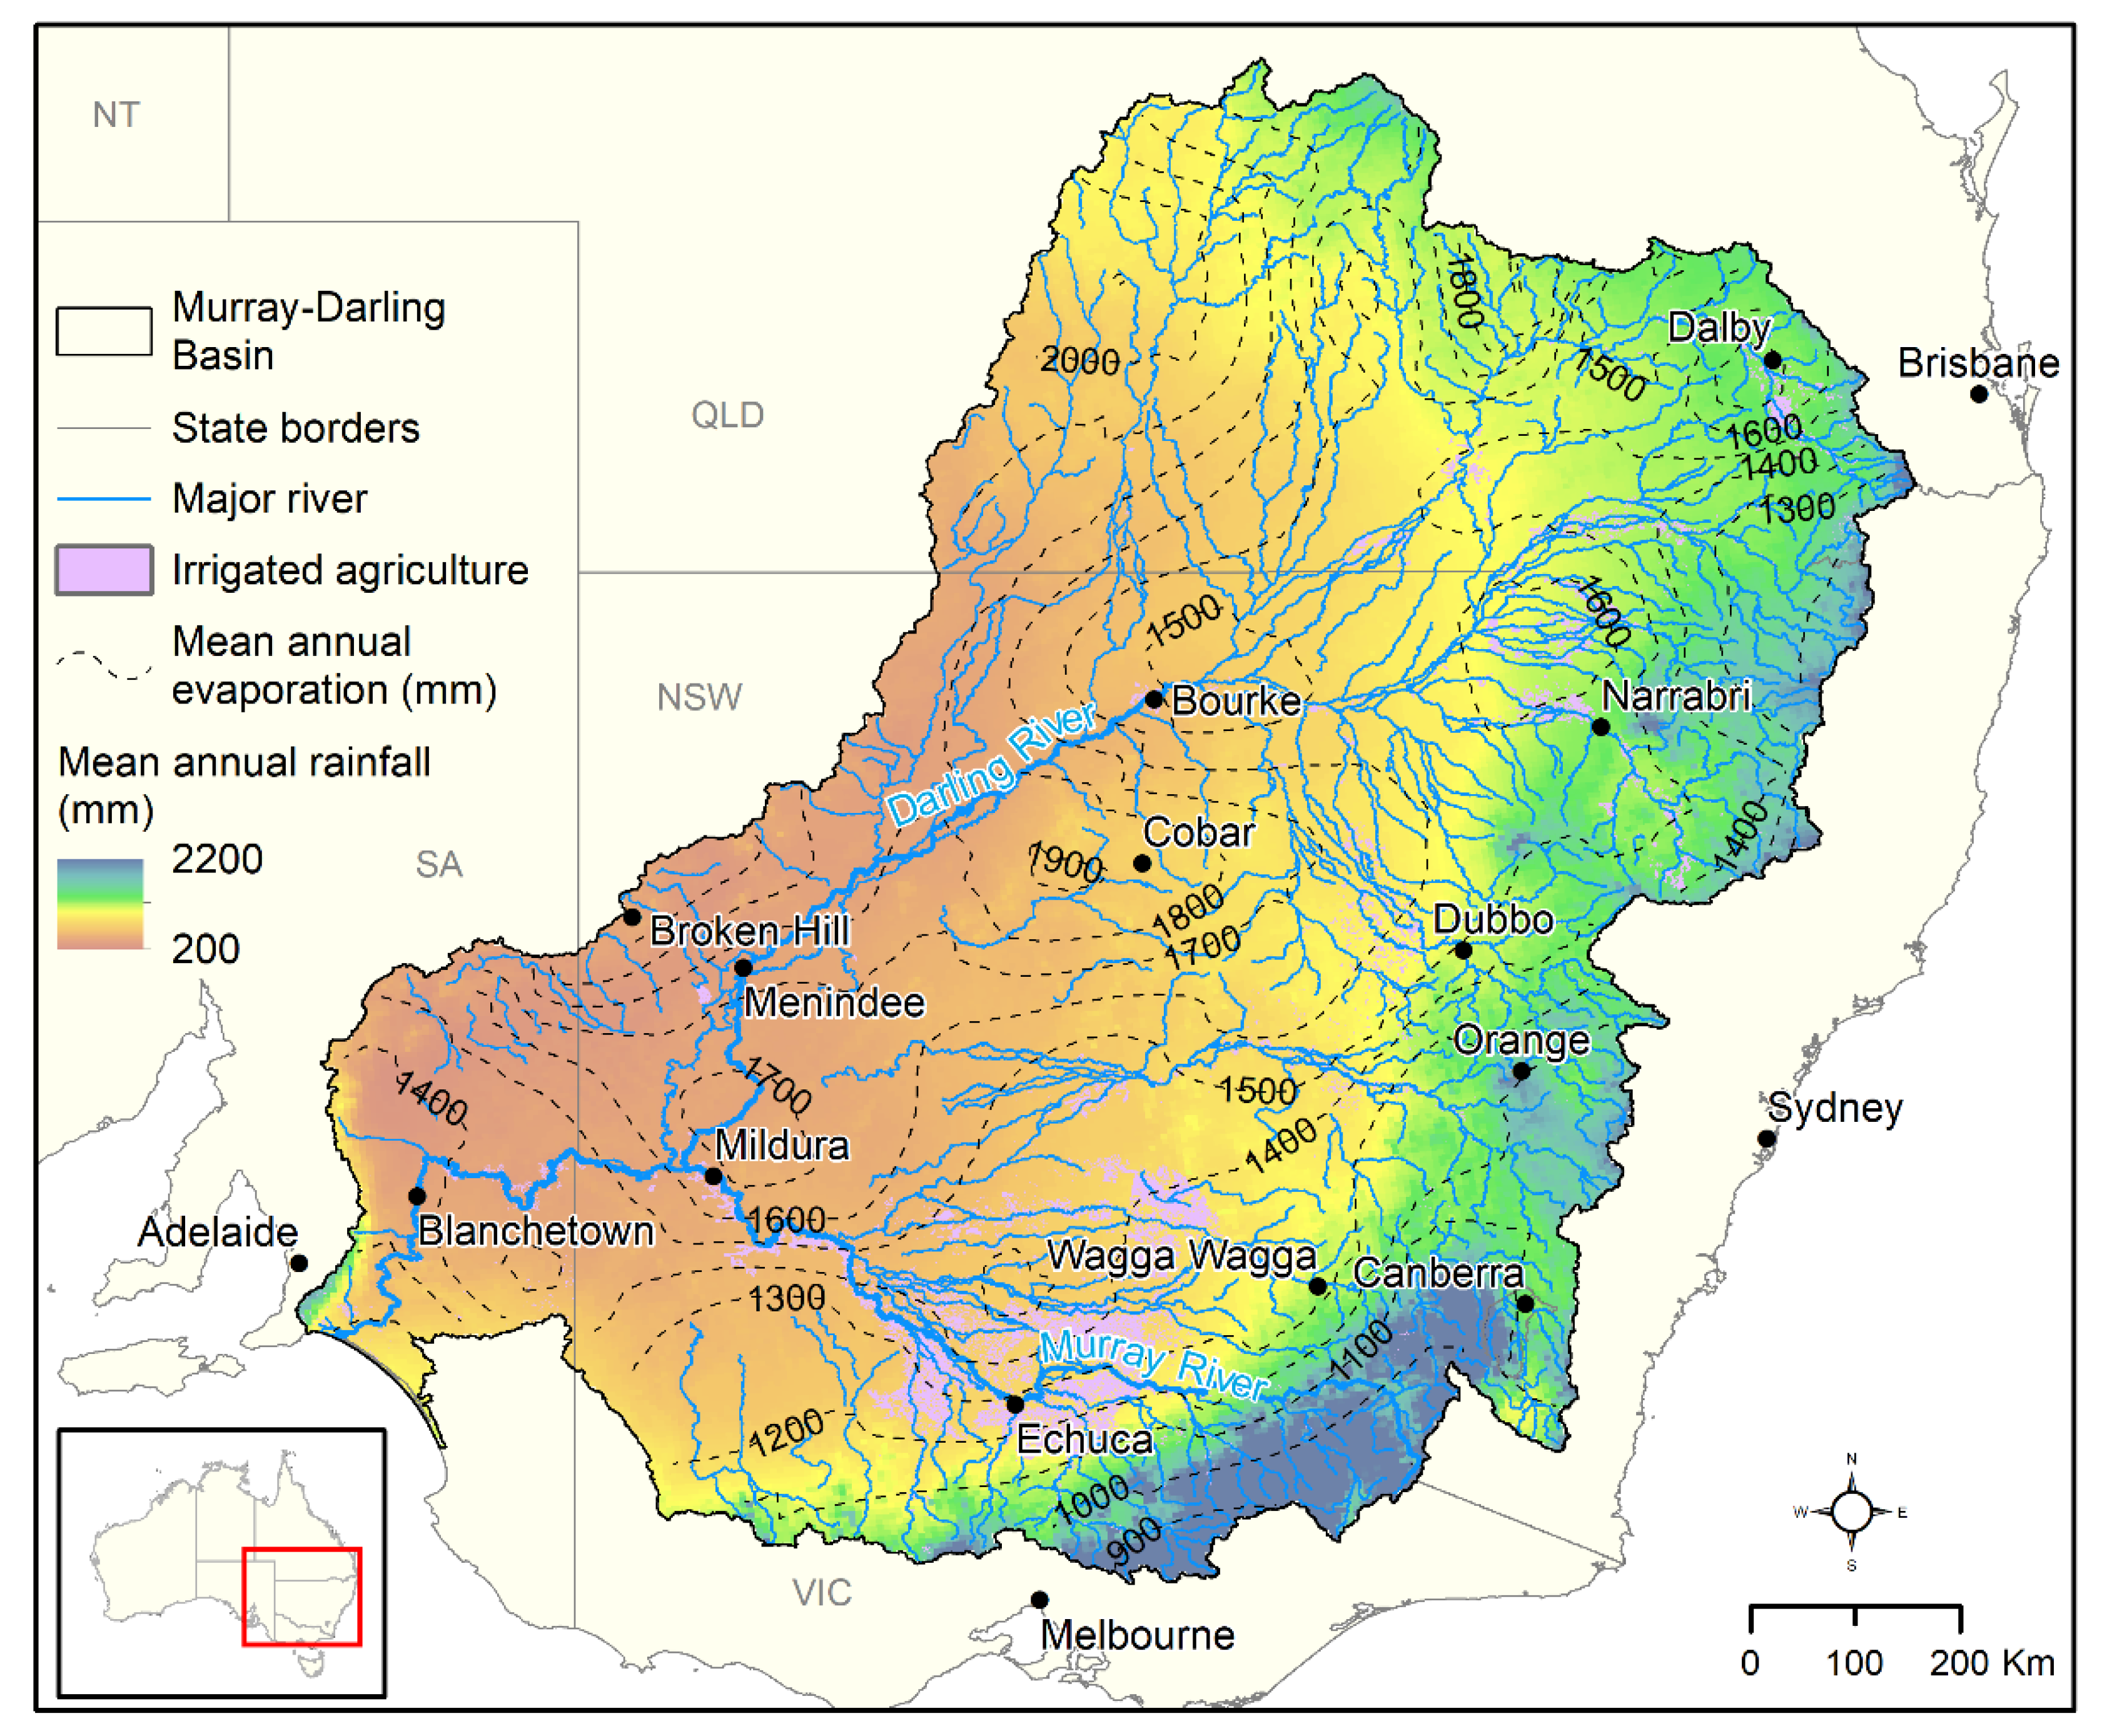
Figure 1. Murray–Darling Basin mean annual rainfall and evaporation, major rivers, and irrigated agriculture.
Water 12 02936 g001
Figure 2. Spatial input parameters for assessment of aquifer storage potential in the Murray–Darling Basin: topographic slope (a), soil clay content (b), surficial geology (c), regolith thickness (d), depth to water table (e), groundwater salinity (f).
Water 12 02936 g002
Figure 3. Mean monthly water allocation trade price in the Macquarie River region in relation to average storage level in Burrendong Dam, Jul 2009 to Jan 2020.
Water 12 02936 g003
Figure 4. Murray–Darling Basin (MDB) regional aquifer storage potential in alluvium, colluvium, and sand plain aquifers where clay content < 40%, slope < 10%, regolith thickness > 10 m, water table depth > 5 m, and groundwater salinity < 3000 mg/L, aand storage within 5 km of major watercourses, and irrigated agriculture within 5 km of storage areas.
Water 12 02936 g004
Figure 5. Examples of regions with different classes of aquifer storage to irrigated area potential: >3 m (a,b); 0.3 to 0.7 m (c,d); < 0.3 m (e,f).
Water 12 02936 g005
Figure 6. Aquifer storage potential where salinity class is < 1500 mg/L in the Macquarie River region below Lake Burrendong: (a) overlaid with median standing water levels and (b) salinity observations since January 2000.
Water 12 02936 g006
Figure 7. Water banking simulations from 1965 to 2020 for the Macquarie River near Dubbo, showing Burrendong Dam historical storage (a trigger for recharge or recovery) and the residual water in the simulated water bank for three different capacities of recharge and recovery (1 GL = 106 m3).
Water 12 02936 g007
Figure 8. Results of simulations over 1965–2020 for different water banking capacities for the Macquarie River near Dubbo, showing total accumulated recharge and peak storage in the water bank (GL = 106 m3).
Water 12 02936 g008
Figure 9. Total recharged volumes (closed circles), total recovered volumes (open circles), and ratio of levelised supply costs to recovered water value (dashed line) for the July 2009 to January 2020 simulation using historical water trading prices for a range of recharge capacities for the Macquarie River near Dubbo.
Water 12 02936 g009
Table 1. Regional aquifer storage assessment criteria, rationale, and data sources.
Exclusion CriteriaRationaleData
Topographic slope > 10%Low infiltration and/or retention potential on steep slopes1 arc-second (≈30 m) DEM [38]
Clay content > 40%Permeability limited in soils with > 40% clayAustralian Soil Landscape Grid, 90 m resolution [39]
Geological formations consisted of highly consolidated or fine-grained material, or igneous or metamorphic rocksPermeability limited in highly consolidated materialNational surface geology map at 1:1 million scale [40]
Depth of regolith < 10 mStorage limited in thin aquifersNational gridded median regolith thickness estimates, 90 m resolution [41]
Depth to water table < 5 mStorage limited in shallow water table aquifersDepth to water contours at 1:1 million scale for MDB water table aquifers [42]
Groundwater salinity (TDS) > 3000 mg/LRecovered water quality must be fit for purposeGroundwater salinity contours at 1:1 million scale for MDB water table aquifers [42]
Table 2. Potential aquifer storage volumes considering 100 mm of recharge in water table aquifers within 5 km of watercourses for river regions within the MDB, and area of irrigated agriculture within 5 km of those potential storage zones.
Potential Volume (109 m3) Where Groundwater Salinity Was
River Region <3000 mg/L<1500 mg/LIrrigated Area within 5 km of Potential Storage Zones (km2) *Storage to Irrigated Area (m) *
Warrego River (a)0.690.26797.61
Castlereagh River0.180.18919.62
Darling River (b)0.510.271483.47
Condamine–Culgoa Rivers (c)0.650.1910530.61
Macquarie–Bogan Rivers (d)0.430.2611420.37
Benanee–Willandra Creek0.050.041380.37
Namoi River (e)0.270.2711480.24
Border Rivers (f)0.180.088490.21
Murray Riverina0.130.107760.16
Moonie River0.010.00440.16
Ovens River0.010.011120.13
Gwydir River0.060.055080.12
Lachlan River0.060.055560.10
Loddon River0.020.001560.10
Broken River0.010.00620.08
Billabong–Yanco Creeks0.080.009840.08
Lower Murray River0.010.00840.08
Goulburn River0.010.00860.07
Murrumbidgee River0.060.059020.07
Campaspe River<0.01<0.01980.02
Cooper Creek–Bulloo River<0.01<0.010
Paroo River0.600.060
Wimmera River0.000.000
Total3.991.8988640.45
* Storage zones where groundwater salinity < 3000 mg/L; a–f shown in Figure 5; lines are drawn according to classes of subsurface storage to irrigated area.
Publisher’s Note: MDPI stays neutral with regard to jurisdictional claims in published maps and institutional affiliations.