Abstract
Extreme weather events will become more frequent and severe as a result of climate change, necessitating an immediate need for cities to adapt to future climate change. Therefore, the prediction of future precipitation and waterlogging is of utmost importance. Using Beijing as an example, the simulation capability of different models was evaluated, and the optimal model for the study area was screened using Taylor diagrams and interannual variability scores, along with actual monthly precipitation data from Chinese weather stations from 1994 to 2014 and historical monthly precipitation data from 10 coupled models from Coupled Model Intercomparison Project Phase 6 (CMIP6). The SWMM model was then used to simulate future rainfall and waterlogging scenarios for the study area using precipitation forecast data for 2020–2050 from the best model to investigate the impact of climate change on future rainfall and waterlogging in urban areas. CMIP6 brings together the most recent simulation data from major climate models on a global scale, providing a broader and more diverse range of model results and thereby making future predictions more accurate and dependable, and its findings provide a theoretical foundation for the emergency management of and scientific responses to urban flooding events. The following major conclusions were reached: 1. The best-performing models are EC-Earth3, GFDL-ESM4, and MPI- ESM1-2-HR. EC-Earth3 is a modular Earth system model developed collaboratively by a European consortium. MPI-ESM1-2 is a climate precipitation prediction model developed in Germany and promoted for global application, whereas the GFDL-ESM4 model was developed in the United States and is currently employed for global climate precipitation simulations. 2. Under future climate circumstances, the total annual precipitation in the example region simulated by all three models increases by a maximum of 40%. 3. Under future climatic conditions, urban surface runoff and nodal overflow in the study area will be more significant. The node overflow will become more severe with the increase in climate scenario oppression, and the potential overflow nodes will account for 1.5%, 2.7%, and 2.9% of the total number of nodes under the SSP1–2.6, SSP2–4.5, and SSP5–8.5 scenarios, respectively. 4. In the future, the effectiveness of stormwater drainage systems may diminish. To increase climate change resilience, the impacts of climate change should be considered when planning the scope of stormwater optimization and the integrated improvement of gray–green–blue facilities.
1. Introduction
Presently, waterlogging incidents occur frequently in numerous cities worldwide [1], which has attracted a great deal of attention from both domestic and international scholars. Urban waterlogging has become one of the most significant natural disasters in cities [2], which is a significant barrier to the sustainable development of cities. Increases in heavy urban rainfall and waterlogging in recent years [3] pose a serious threat to urban residents’ property and personal safety [4,5]. This is demonstrated by the impact of events such as the “721” heavy rainfall in Beijing in 2012, the “720” heavy rainfall in Zhengzhou in 2021, and the “Storm Issa” subtropical cyclone’s large-scale waterlogging events in South Africa in 2022.
A large number of waterlogging simulation studies and waterlogging scenario predictions could provide theoretical support for the emergency management and orderly response of heavy urban rainfall waterlogging disaster events [6] to combat waterlogging more effectively. Numerous academics from both China and other countries have conducted the following study to predict the outcomes of urban waterlogging disasters. The researchers simulate various urban waterlogging conditions in the study area based on PCSWMM and other software [7] for varying rainfall return periods, rainfall duration, and peak coefficients. They identify locations with a high risk of waterlogging [8] and then apply the research findings to other regions, such as Wales, United Kingdom; Wallonia, Belgium; and Fujian and Shenzhen, China [7,8,9,10,11,12,13]. Alternatively, others estimate future waterlogging scenarios using the correlation between flooding and other factors. For example, Y. Kexin et al. [14] conducted estimations based on the close relationship between the causes of waterlogging prediction changes and land cover using the LULC prediction model combined with a hydrodynamic model to predict future waterlogging trends. Y. Yue et al. [15] used topography, evaporation, infiltration, pipeline discharge, river flood level, and other factors to evaluate the correlation between rainfall and waterlogging levels and to develop a multifactor correlation model. The simulation results provide a basis for scientific research and urban planning to reduce the risk of waterlogging.
Existing research, however, focuses primarily on the simulation and disaster risk analysis of waterlogging scenarios under the existing atmospheric conditions of cities, and there are relatively few studies on the simulation and prediction of waterlogging disaster events under different future climate scenarios with climate change. Utilizing Chicago rain patterns to generate rainfall sequences, Mei Chao et al. [16] constructed a numerical model of urban waterlogging in order to simulate waterlogging in the central urban area of Shanghai. Wang Shijing et al. [17] designed rainfall patterns based on 24 h rainfall in the local rainstorm and flood atlas and simulated scenarios with various rainfall return periods. P. Chen et al. [9] determined the average rainfall intensity at any point in the rainfall process by analyzing historical rainfall data and incorporating the rainfall intensity formula into the rainfall model as a parameter input in the numerical model of waterlogging. The majority of the rainfall data used in current studies for the prediction of future waterlogging scenarios are rainfall data series generated or predicted under current climate conditions, which do not fully account for rainfall conditions under future climate change conditions and could result in inaccurate estimation results. As a significant factor influencing rainfall and waterlogging, the climate is better suited to the realities of the future when fully combined with the results of climate change scenarios for urban waterlogging. Therefore, this paper will use CMIP6 rainfall model data to provide a reasonable portrayal of precipitation changes and provide scientific support for assessing climate change risks and effectively responding to climate-change-induced waterlogging disasters.
As the most recent stage with the greatest number of models and the richest data since the inception of the CMIP program, the CMIP6 model has significantly improved the simulation effect of average precipitation and extreme precipitation events [18,19,20,21] and is widely used in climate simulation and evaluation across a variety of spatial scales. Y. Farhad et al. [22] analyzed the performance of CMIP6 on the historical operating precipitation estimation results of Iran’s climate zone. They discovered that each CMIP6 model had its own adaptive specific climate zones, such as the model that performed well in a humid zone but poorly in ultra-arid and arid zones. H. Zahra [23] examined trends in extreme precipitation in the Middle East and North Africa (MENA) during historical periods (1985–2014) and future periods (2021–2050), and the results suggest that extreme precipitation and its intensity will continue to increase despite the decrease in precipitation in the Middle East and North Africa region. J. d. M. Felipe et al. [24] estimated the changes in CMIP6’s worst-case scenario for the medium term (2046–2065) and future (2081–2100), predicting more severe, frequent, and persistent extreme precipitation events in all regions of Brazil and more pronounced changes in heavy precipitation and severe drought in north-central and southern Brazil.
In the rainfall forecast for China, Yang Yang et al. [25] estimated precipitation in Asia over the next 30 years, revealing that flooding in western China could increase, and precipitation in southwest and northern China could decrease during the warm season. Drought disasters could occur in northern South Asia and southern Central Asia during the cold season. A further evaluation by Xiang Junwen [26] and others determined that the simulation effect of CMIP6 in precipitation and temperature in northwest China was improved, particularly in the semi-arid area of the arid region, where the precipitation simulation ability was significantly enhanced compared to CMIP5 [27]. Zhao Mengxia [28] et al. simulated the spatial distribution of precipitation in the upper reaches of the Yellow River using the average data of CMIP6 multi-model collections and estimated that the annual precipitation in the upper reaches of the Yellow River would fluctuate and increase in the future. Global climate models are an important tool for studying past climate change mechanisms and predicting future climate change; however, due to the complexity of the global climate system and the stability of climate models, global climate models have certain deficiencies in East Asia’s climate simulation capabilities [29,30,31]. Therefore, before using climate models to conduct climate change mechanism studies and climate forecasts, it is necessary to test and evaluate their simulation capabilities, which not only provide a foundation for improving model performance but also aid in identifying the sources of uncertainty in model results [32].
This paper uses the most recent global climate models and datasets to predict future urban rainfall and flooding scenarios that are more closely aligned with realistic future scenarios, and it assesses the precipitation modeling capabilities of China’s major regions using the ten most recent climate models released by CMIP6. The SWMM model was used to predict future urban waterlogged scenarios based on varying climate scenarios. The CMIP6-based urban rainfall forecasts provide decision makers and planners with important information for urban planning, infrastructure design, and climate change adaptation, while the predicted flooding scenarios enable city management to better understand and assess the potential future flood risk and to take steps to mitigate the potential impact of flooding. This ensures the sustainable development of cities and the protection of residents and provides a theoretical foundation for emergency management and the scientific response to urban waterlogging events.
2. Materials and Methods
2.1. Study Area
The study area is located in Beijing. As shown in Figure 1 below, the topography of Beijing is high in the northwest and low in the southeast. Mountains surround it on three sides in the west, north, and northeast, and a plain that slopes gently towards the Bohai Sea in the southeast. Five major waterways run through the city from west to east, and the area of parkland per capita is 16.63 square meters. In the summer, the climate is a warm, temperate, semi-humid, semi-arid, monsoon climate with high temperatures and rain. It also has cold and dry winters, short springs and autumns, and an average annual precipitation of 550 mm (according to the annual rainfall statistics of typical hydrological stations in the study area from 1956 to 2017).
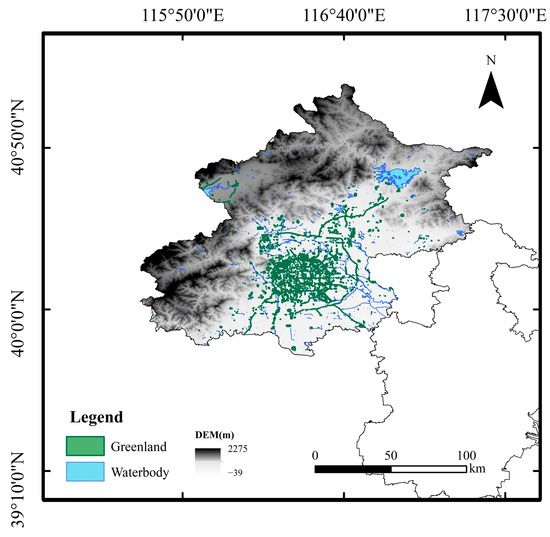
Figure 1.
Study Area Map.
The most frequent rainfall in Beijing City is light rain (daily rainfall below 10 mm), accounting for 61% of the total rainfall frequency. In contrast, the largest contributors to rainfall are moderate and heavy rainfall, each accounting for 28% of the total rainfall [33]. In the past ten years, there have been six occurrences of extremely heavy rainfall in the study area and 165 occurrences of extreme rainfall weather at the district level. Extreme rainfall in the study area occurred between June and September, with July and August being the wettest months, but July’s total rainfall was significantly higher than August’s. There are three peaks in the frequency of accumulated extreme rainfall per five-day period: early August, mid-to-late July, and late June and early July, with the highest frequency occurring in early August.
Due to the characteristic nature of Beijing’s urban climate and precipitation, Beijing’s climate and precipitation patterns can help us comprehend urban hydrological responses in similar climatic regions or cities with comparable characteristics.
2.2. Data Sources
The data involved in rainfall analysis and modeling in this study are shown in Table 1 below.

Table 1.
Data types and sources utilized for the analysis.
In addition, the study utilizes geographic information data, including land use vector data of the research region, water system vector, DEM raster data (30 m precision), and administrative border zoning vector.
The global climate model data chosen for this paper are the monthly precipitation and raster data from 1994 to 2014 that were simulated by the latest ten climate models in CMIP6. Each model has a different spatial resolution, based on https://esgf-node.llnl.gov/search/cmip6/ (accessed on 22 August 2022). In the meantime, this paper employs the CMIP6 SSP1–2.6, SSP2–4.5, and SSP5–8.5 scenarios. SSP1–2.6 is the modified RCP2.6 scenario from CMIP5 in CMIP6 exhibiting low social vulnerability, low mitigation stress, and low radiative forcing. The SSP2–4.5 scenario in CMIP6 represents a mix of moderate societal vulnerability and moderate radiative forcing. SSP5–8.5 is the upgraded CMIP5 RCP8.5 scenario in CMIP6 and the only shared socioeconomic pathway capable of achieving an anthropogenic radiative forcing of 8.5 W/m2 by 2100 [34].
The 1 km resolution monthly precipitation dataset (1901–2017) of the National Tibetan Plateau Data Center is used as the observation data to test the simulation ability of the model set to China’s precipitation process. This dataset is generated based on the global 0.5° climate dataset released by CRU and the global high-resolution climate dataset released by WorldClim, via the Delta spatial downscaling scheme in China. In addition, verification included data from 496 separate weather observation stations.
2.3. Method
2.3.1. Evaluation of CMIP6 Models
This study carried out a literature review of CMIP6 model comparisons and then selected the ten best models for rainfall simulation in China based on the degree of model adaptation to the region within China, the degree of model simulation performance improvement over CMIP5, the model simulation effect on historically observed rainfall in China, the model simulation ability on future rainfall trends, the model prediction ability on extreme rainfall, and the model resemblance to observed rainfall in China. Due to the different data resolutions, the bilinear interpolation method is used to interpolate the data of each model to 0.5° × 0.5°and then to extract the corresponding rainfall data required by meteorological stations in Beijing, with an evaluation period of 1994–2014.
The Taylor plot was then employed to assess the model’s capacity to mimic precipitation. The Taylor graph combines the three model evaluation indicators, including the correlation coefficient, centered root mean square, and standard deviation, on a polar graph based on the cosine relationship between the three. The radian axis represents the spatial coefficient, whereas the horizontal and vertical axes represent the standard deviation ratio of the model to the observation or the distance from the model point to the origin. The closer the standard deviation ratio is to 1, the closer the model simulation standard deviation is to the observation. The RMSE is the distance between the mode point and the reference point of the observations; the closer the mode point is to the Obs, the smaller the RMSE. The model performs decently well when the correlation coefficient is greater, the RMSE is smaller, and the standard deviation ratio is closer to 1.
Additionally, a quantitative metric, the Taylor Score “TS”, was developed to quantify the correlation coefficient and standard deviation between the simulated and observed fields in order to evaluate how well the model can be simulated [35]:
where R is the correlation coefficient between the simulated and observed fields; R0 is the greatest attainable correlation coefficient, i.e., the maximum of all the models; is the ratio of the standard deviation of the simulated field (STDm) to that of the observed field (STDo). The closer the TS is to 1 and the stronger a model’s simulation capacity, the closer the simulated field is to the observed field.
Next, the interannual variability score (IVS) was employed to assess the model’s capacity to simulate the interannual variability of regional precipitation in China:
where STDm and STDo are the simulation and observation interannual standard deviations, respectively. The IVS (interannual variability score) is a symmetrical variability statistic that measures the similarity between simulations and observed interannual changes. The closer the STDm and STDo are, the lower the IVS value, showing that the model replicates interannual variation more accurately.
Lastly, the Taylor chart ranking of each model and the IVS value ranking is merged to thoroughly sort all models to determine the ideal precipitation simulation mode for the research area.
2.3.2. Statistical Downscaling Method
The downscaling method may translate large-scale climate data into regional-scale climate data, thereby minimizing the simulation error of regional precipitation and enhancing the simulation effect of the model [36,37]. In this work, the cumulative probability distribution function of the two variables, the observed historical value and the simulated historical value of the model, is determined using a downscaling method based on the cumulative probability function (CDF) [38].
Future data were revised using the equidistant cumulative probability function matching method (EDCDFM) in this investigation. For a given percentile, it is assumed that the difference between the pattern and the observed values during training also applies to future periods, hence preserving the mapping connection of the corrective function [39]. Nevertheless, the contrasts between the future and historical CDFs are also considered. Therefore, the method’s mathematical expression (3) is
where x is a climate variable, F is the CDF of either the observations (o) or model (m) for a historic training period or current climate (c) or future projection period (p).
2.3.3. Method for Generating Rainfall Sequences
Based on the optimal model and the CDF downscaling method in the region described in the previous section, the 24 h daily rainfall correction factor for the study area was first determined by combining the historical rainfall observations with the simulation results of the historical rainfall from the model. Then, the anticipated outcomes of the design rainfall with a 24 h ephemeral time were adjusted according to this correction factor to produce the 24 h rainfall for the associated future design return periods (2, 5, 10, and 50 years in this paper). The 24 h rainfall was finally assigned according to the time allocation coefficients in the hydrological manual of the study region, and the 24 h rainfall series of every 5 min step was obtained as the input condition for the SWMM hydrological model in the area.
2.3.4. SWMM Model
In order to more accurately evaluate the effect of the existing urban drainage system on waterlogging prevention and control in future scenarios, an urban hydrological model based on SWMM software was developed for an area of Beijing, and a single-day rainfall scenario was simulated for each condition. There are 788 catchment zones in the model. Principal land uses include primarily residential and commercial land. There are typically three types of underlay surfaces: buildings, roads, and green spaces. Some areas include traditional urban drainage facilities such as pipelines and nullahs, as well as low-impact development source control facilities necessary for sponge city construction, such as rainwater buckets, permeable pavements, and biological retention units. In this instance, the input rain gauge data are derived from the three optimal models of 24 h rainfall sequences in 5 min increments for the three previously described scenarios for SSP1–2.6, SSP2–4.5, and SSP5–8.5, and the outputs are the model runoff conditions and node overflow conditions.
In this case, the Morris screening method was used to analyze the sensitivity of the model parameters. The Morris screening method is a widely used method for parameter sensitivity analysis that evaluates the significance of parameters by systematically varying their values in the model and observing changes in the corresponding simulation results. The method, which is based on the randomization of sampling points and cumulative effects, is better able to identify parameters that have a substantial effect on the model output [40,41,42]. The formula is as follows.
where ei is the Morris coefficient; y is the model output after a parameter change; y0 is the model output before a parameter change; and Δi is the rate of change of parameter i.
The modified Morris screening method employs a fixed parameter that is varied in fixed stages. After multiple perturbations, the average rate of change in model results is used to determine the parameter’s sensitivity. The following is the formula:
where S represents the sensitivity, Yi represents the output of the ith run of the model, Yi+1 represents the output of the ith + 1 run of the model, Y0 represents the initial value of the model, Pi is the percentage change of the parameters from the initial parameters during the ith model run, Pi+1 is the percentage change of the parameters during the ith + 1 model run, and n is the number of model runs.
3. Results and Discussion
3.1. Initial Evaluation of Precipitation Patterns
Aiming at the degree of deviation between the model historical observation rainfall value and the model simulated rainfall value, Xiang Junwen, LIN Wenqing [26,43], and others used the Taylor diagram method to evaluate the simulation performance of extreme rainfall in China and the middle and high latitudes of Asia in multiple climate models of the CMIP6 database. The results indicate that the model EC-Earth has the best simulation performance. Zhou Tianjun and Wang Yu et al. [27,44] evaluated the simulation capability of multiple CMIP6 models on China’s historical extreme precipitation and discovered that GFDL-ESM4 and other models performed better. Hu Yiyang and Li Xiaolei et al. [45,46] compared the historical measured values of precipitation from multiple models with the model simulation values and discovered that the errors and precision of MPI-ESM1-2 models in China were relatively small and high. Only the high-resolution model of MPI-ESM1 maintains a good rainfall simulation effect as the resolution increases.
In conclusion, the pertinent literature was compiled, and the selection was based on various parameters, including the simulation of extreme precipitation, applicability to the study area, precipitation patterns, and enhanced performance relative to CMIP5, as indicated in Table 2 below.
Table 2.
Evaluation of the estimated effect of the models in China.
As the first large sample dataset of GCMs (global climate models) in China, the FGOALS-g3 model exhibits a high degree of adaptability to the region. The models ACCESS-CM2, IPSL-CM6A-LR, MPI-ESM1-2-LR, and MPI-ESM1-2-HR have low error rates when simulating historical precipitation in several regions of China. The simulation performance of the models GFDL-ESM4 and GFDL-CM4 is superior to that of the comparable model in CMIP5. EC-Earth3, EC-Earth3-Veg, GFDL-ESM4, GFDL-CM4, and MRI-ESM2-0 have better simulation capability for extreme rainfall. In conclusion, the pertinent literature was compiled to acquire the preliminary screening findings of the CMIP6 rainfall model in the Chinese context, and the model-specific information is presented in Table 3 below.
Table 3.
A description of the 10 CMIP6 precipitation patterns selected for this study.
3.2. Comparison of Models
Initially, each model’s historical monthly precipitation data was evaluated using box plots. Figure 2 below shows the results of the box plot analysis.
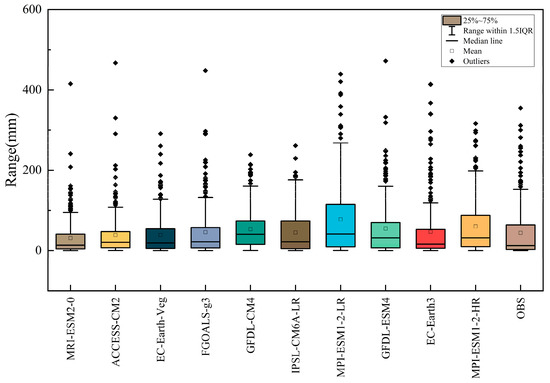
Figure 2.
Box plots of simulated and measured historical monthly rainfall values for each model.
In the historical monthly rainfall data, there were large anomalies in both the measured and predicted values of each model, indicating that extreme rainfall events were frequent. In the simulation of the anomalies, i.e., extreme rainfall, the simulated values of GFDL-ESM4, EC-Earth3, and MPI-ESM1-2-HR were the best. The fluctuation range of the simulated values of GFDL-CM4 and GFDL-ESM4 is in good agreement with the measured fluctuation range. With the exception of MPI-ESM1-2-LR, the mean values of the simulated values and measured values for each model are near to 35 mm, with GFDL- ESM4, EC-Earth3, and GFDL-CM4 being the closest models. Except for models MPI-ESM1-2-LR and MPI-ESM1-2-HR, the mean values of the simulated historical rainfall values are lower than the mean values of the measured values, indicating that the simulated rainfall data of the models are generally lower than the measured data.
Using the simulated and observed monthly precipitation data for each model from 1994 to 2014, a Taylor diagram depicting the link between multi-year monthly precipitation and the observed values for each model was then generated, As shown in Figure 3 below.
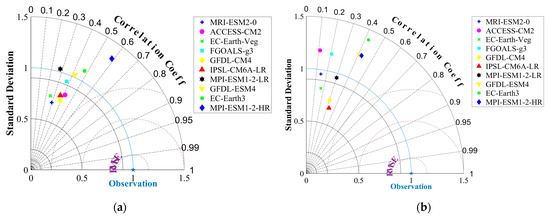
Figure 3.
Taylor plot comparing monthly (a) and rainy season (b) precipitation with observed data in Beijing simulated by ten CMIP6 models.
The results of the Taylor diagram indicate that the simulation results of the CMIP6 model for monthly rainfall are superior to those of the wet and dry seasons. For monthly rainfall, the RMSEs of simulation versus observation are all within 1, indicating that the simulation results are in some agreement with the observation results, but there are still errors. The ratio of standard deviation between most models and observations is close to 1, revealing that the amplitude of the rainfall variation simulated by the models is comparable to that observed and that the discrepancies across the models are minimal. Additionally, the pattern distribution on the Taylor diagram is more concentrated, indicating a degree of pattern constancy. The correlation coefficients of the models ranged from 0.25 to 0.6, with MPI-ESM1-2-HR achieving the highest value of 0.6, indicating that the model has a strong ability to simulate rainfall. Taking into account the three indicators of correlation coefficient, standard deviation, and root mean square error, MPI-ESM1-2-HR, EC-Earth3, and GFDL-ESM4 performed the best, and these three models have the greatest ability to simulate rainfall. The outcomes of these three models’ simulations are closer to the observed results, and their simulation capacities are greater.
Finally, the Taylor score (TS) and the interannual variability score (IVS) were determined for each model according to the necessary equations, and the best-performing rainfall model was synthesized by rating them independently.
According to Table 4 above, the top-performing models in terms of interannual variability score are FGOALS-g3, GFDL-ESM4, and MPI-ESM1-2-HR, while the top-ranked models in terms of the Taylor score are EC-Earth3, GFDL-ESM4, and MPI-ESM1-2-HR. GFDL-ESM4, MPI-ESM1-2-HR, and EC-Earth3 are the final selection of the best-performing models overall in the research area when the two comparators are combined.
Table 4.
Overall ranking for each model.
3.3. SWMM Model Validation and Sensitivity Analysis
There are both deterministic and uncertain parameters in the SWMM model. Deterministic parameters are primarily physical parameters. They can be derived via field measurements or by utilizing the spatial processing function of ArcGIS. Accurate values for uncertainty parameters are often not available due to a variety of conditions, such as the manning coefficient of impervious area and the manning coefficient of pervious area, the depth of depression storage on the impervious area and the depth of depression storage on pervious area, the maximum infiltration rate, the minimum infiltration rate, and the decay constant. When determining the initial values of the uncertainty parameters, reference can be made to the SWMM model application manual, outdoor drainage design standards, and recommendations from the relevant literature. Table 5 details the SWMM model uncertainty parameters for this investigation.
Table 5.
Model hydrological parameter setting.
The SWMM model incorporates continuity errors for surface runoff and flow rate. In general, if these errors fall within a range of less than 10%, the results of the model simulation can be considered reasonable, indicating the model’s validity. Using the Chicago Rainfall Model calibration parameters, the SWMM calculations are acceptable if the calculated precipitation export flows are within 20% of the design flows and the relative deviations are less than 20%.
In this investigation, the SWMM model’s continuity error was evaluated. The results indicate that the surface runoff error is −0.01% and that the flow rate error is −0.94%, both of which are less than 10%, indicating that the model is accurate. Moreover, the model’s relative deviation is within 20%, indicating that the calculated results are reasonable. As a result, the model can be applied to the analysis of urban storm extreme weather scenarios in order to provide accurate information regarding the performance of urban drainage systems.
Next, the total runoff sensitivity of each parameter in the SWMM hydrological module was calculated using a sensitivity formula based on a modified Morris screening method to obtain the sensitivity of each parameter (Table 6).
Table 6.
Sensitivity analysis results of hydrology and hydraulic parameters.
As demonstrated by the simulation results, the parameters that are most sensitive to runoff are destore-imperv, conduit roughness, and %zero-imperv, in that order.
3.4. Rainfall Forecasts under Future Scenarios
3.4.1. Annual Rainfall
Under different scenarios, the predicted results of each model have certain differences, so it is necessary to analyze under the uncertain conditions of the forecast. This is essential for setting standards for climate-resilient rainwater drainage systems in the future context of climate change. This study examines the interannual variance of Beijing’s total yearly precipitation and creates a map of this variation.
In terms of total annual precipitation for the period 2020–2050, the three future precipitation models are inconsistent. However, they are not below their historical averages. This suggests that there may be more rainy days or an increase in the average daily precipitation. The annual total rainfall that approaches or exceeds the historical maximum (about 800 mm) happens most frequently in the SSP1–2.6 scenario, and two, three, and four times in the forecast findings of GFDL-ESM4, MPI-ESM1–2-HR, and EC-Earth3, respectively.
As shown in Figure 4, the uncertainty in the predicted future annual total rainfall increases, and the variability in the characteristics with historical rainfall is reflected in the significant increase in interannual extremes, with the highest annual rainfall of more than 1200 mm and the lowest annual rainfall of less than 200 mm predicted by EC-Earth3 under the SSP2–4.5 scenario for the future period.
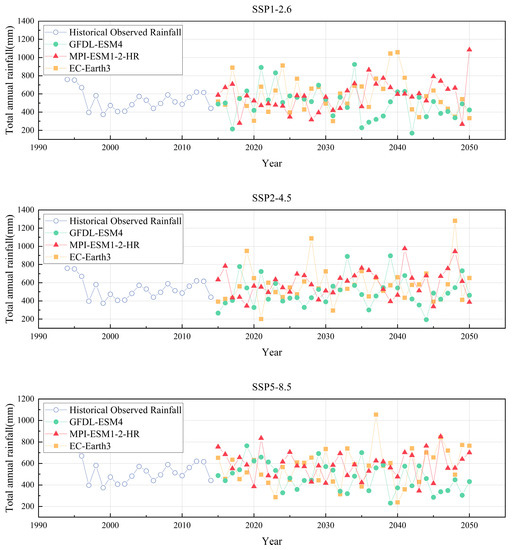
Figure 4.
Interannual rainfall fluctuation of total annual precipitation line graph for the three scenarios.
Figure 5 below shows the future simulated rainfall compared to the historical measured maximum daily rainfall:
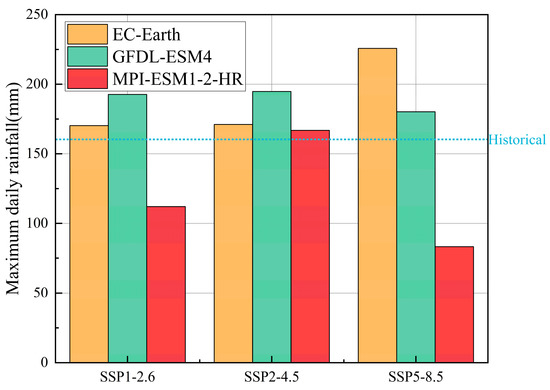
Figure 5.
Maximum Daily Rainfall Map.
During the historical period of 1994–2014, the maximum daily precipitation observed was 160.274 mm. However, in all three models, it is predicted that future precipitation events exceeding the historical maximum daily precipitation will occur by the year 2050. Specifically, the EC-Earth3 model predicts the occurrence of the largest daily precipitation event under the SSP5–8.5 scenario, with a 24 h precipitation amount of 225.77 mm.
Figure 6 demonstrates the number of events that exceeded the historical maximum daily precipitation:
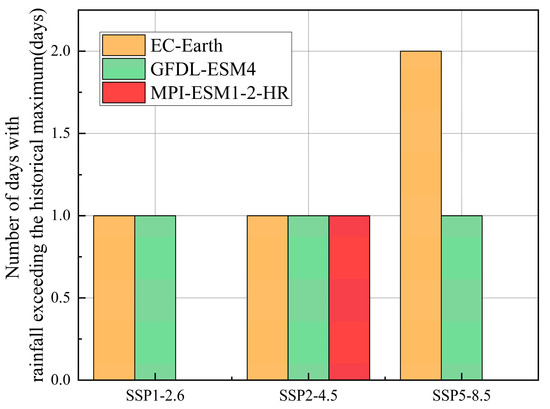
Figure 6.
Statistical map of the number of events exceeding the maximum historical daily rainfall.
In the statistical analysis of the number of extreme rainfall events exceeding the maximum historical daily rainfall in three scenarios for each model, it was found that the EC-Earth3 model simulated the most extreme rainfall events, reaching up to two events in the SSP5–8.5 scenario. Meanwhile, the MPI-ESM1-2-HR model simulated the fewest extreme rainfall events, with only one event in the SSP2–4.5 scenario. Overall, it is predicted that one to two extreme rainfall events will exceed the maximum historical daily rainfall in the next 30 years.
The statistics for the quantity of future rainstorm events are depicted in Figure 7:
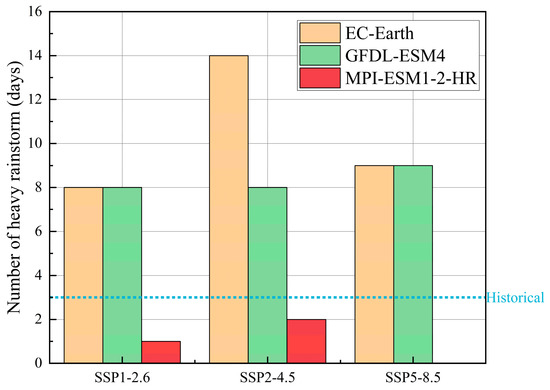
Figure 7.
Map of the number of heavy rainstorm events.
According to the classification of rainfall levels, rainfall exceeding 100 mm per day is considered heavy rain. Historical rainfall data shows that there were three heavy rainfall events during the period of 1994–2014. However, future simulation data indicate a significant increase in heavy rainfall events in both the EC-Earth3 and GFDL-ESM4 models, particularly the EC-Earth3 model, which predicts 14 heavy rainfall events in the SSP2–4.5 scenario. The simulation results of the MPI-ESM1-2-HR model also indicate that heavy rainfall events will continue to occur in the future but with a lower frequency than historical rainfall. These differences suggest that the prediction of future rainfall may be subject to many uncertainties.
This prediction indicates that there may be more extreme rainfall events in the future, which could negatively impact the ecological environment, urban infrastructure, and human society. Therefore, measures should be taken to address climate change, including reducing greenhouse gas emissions, strengthening natural disaster prevention and adaptation, etc.
3.4.2. Daily Rainfall
On the basis of the results of the three climate models selected in the previous section and the revised results of the downscaling under the three emission scenarios, nine different sets of 24 h rainfall series were generated in Beijing urban areas using the distribution coefficients of the rainfall time series as input conditions for the hydrological model of the region. As illustrated in Figure 8 below.
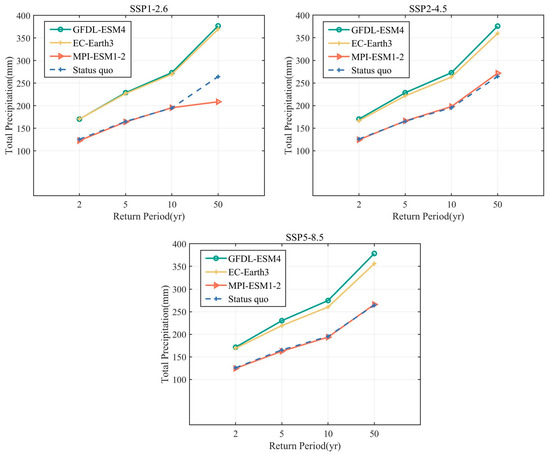
Figure 8.
Total 24 h rainfall for the three models under different scenarios and return periods.
Compared to the total daily rainfall of the status quo, the three predicted results of future models for a 2-year rainfall of 24 h duration have a total rainfall of approximately 125–170 mm, while the uncertainty is greater for a 50-year rainfall with a total rainfall of approximately 270–380 mm. Consequently, rainfall uncertainty grows as the return period increases. In contrast, the effect of emission scenarios on total precipitation is less than the return period.
The models GFDL-ESM4 and EC-Earth3 both predict higher future rainfall than the status quo total daily rainfall, with the amount of growth being approximately 40%. The model MPI-ESM1-2-HR predicts a lower trend for total future daily rainfall than GFDL-ESM4 and EC-Earth3. Nonetheless, the predicted values for the SSP2–4.5 and SSP5–8.5 scenarios are still close to the status quo and slightly lower. However, the predicted values for the SSP2–4.5 and SSP5–8.5 scenarios are still close to and slightly higher than the status quo values, indicating that the predicted total daily precipitation under future climate change conditions is generally higher than the status quo; i.e., there will be more precipitation in the future.
In general, the results of the experiments on future rainfall fit well with previous studies. For instance, Wu Jian et al. [47] predicted future precipitation in the Yangtze River basin in China and determined that future precipitation and temperature in the Yangtze River basin will be higher than in historical periods under all scenarios. Xiang Junwen et al. [26] modeled future precipitation in major regions of China and demonstrated that annual and extreme precipitation in future periods in China will increase significantly. The rate of annual and extreme precipitation increases progressively as the scenario evolves.
3.5. Estimation of Waterlogging Situation under Future Scenarios
3.5.1. Simulation of Surface Runoff under Future Scenarios
Three scenarios with varied discharges of SSP126, SSP245, and SSP585 result in runoff quantities that are distinct among the three models for the same return period. As shown in Figure 9, GFDL-ESM4 generates more runoff with an increasing discharge without significant changes in total rainfall, with an increase of approximately 1%. Model EC-Earth3 generates approximately 1% less runoff with increasing discharge in sequence for the SSP126, SSP245, and SSP585. Finally, MPI-ESM1-2-HR generates approximately 1% less runoff with increasing discharge in sequence from scenario SSP126 to SSP245.
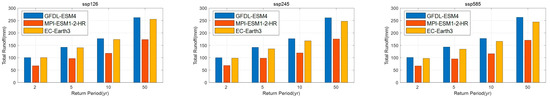
Figure 9.
Total precipitation for the three models under the three conditions.
Figure 10 depicts the peak runoff for each catchment sub-area at various return periods and under various scenarios. It can be seen that the areas of high peak runoff in the region are concentrated in a few catchment sub-areas, whereas peak runoff is negligible for the majority of catchment sub-areas. In general, the peak runoff increases dramatically with the return period, with the 50-year return period in the highest peak catchment areas being around twice as high as the 2-year return period. In certain regions with low peaks, the multipliers are greater. This means that in future climate scenarios, runoff volumes from heavy and even extreme rainfall will have much higher peaks, and economic and safety costs resulting from waterlogging will increase exponentially.
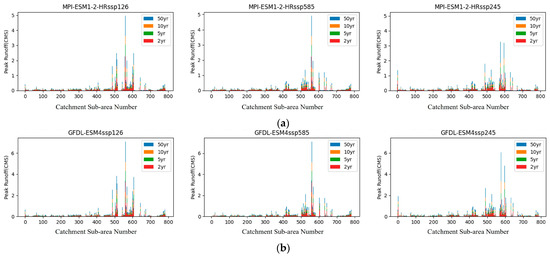
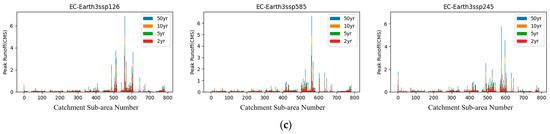
Figure 10.
Peak flood runoff for the three models under the three scenarios. (a) MPI-ESM1-2-HR, (b) GFDL-ESM4, (c) EC-Earth3.
Those catchment sub-areas with low peak flows may be more vulnerable to severe and intense rainfall because they cannot handle significant volumes of runoff in a relatively short period of time. Thus, urban planning and construction should take into account the peak and return periods of runoff from these various places, and steps should be taken to decrease the risk of flooding. Green infrastructure, for instance, can be utilized to increase the infiltration capacity of surface water and lower the rate of runoff, and approaches such as green roofs on buildings and rainwater collecting systems can be employed to reduce runoff generation. In addition, plans for disaster prevention and control, as well as contingency plans, can be prepared in order to respond swiftly and minimize damage in the event of flooding. Future climate scenarios will raise the risk of internal flooding, necessitating a variety of preventative measures to maintain the safe and sustainable development of metropolitan areas.
3.5.2. Simulation of Node Overflows in Future Scenarios
Using the SSP2–4.5 scenario as an example, the historical measured data under the four return periods of 50 years, 10 years, 5 years, and 2 years were calculated and analyzed to produce a line graph of the rainfall trend. The line graphs, Figure 11, show that the rainfall trends for the four return periods are similar, with a tiny peak of around 5 mm 4–5 h following the beginning of the rainfall, followed by a high of approximately 20 mm after 1020 min.
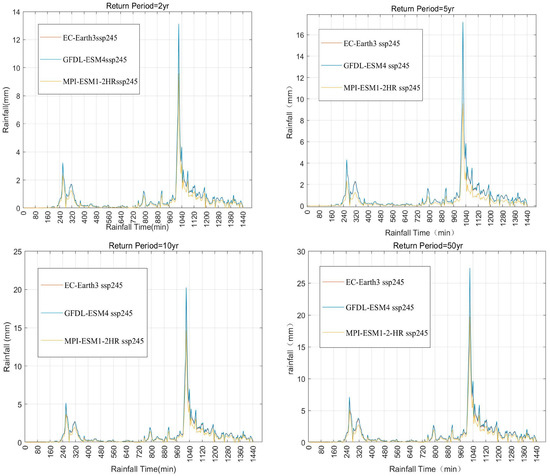
Figure 11.
Folding line of one rainfall event trends for three models with various return periods at SSP2–4.5.
At 2 yr and 5 yr return periods, the simulated data of all three models are lower than the measured historical data, with significant variances at higher precipitation levels, when the model GFDL-ESM4 is closest to the historical data. When the return period is raised to 50 years, the simulated precipitation values of MPI-ESM1-2-HR are most similar to actual values.
According to the “Outdoor Drainage Design Standard” (GB 50014-2021), the standard design return period for rainwater drains in large urban areas is between three and five years. In this study, the 24 h rainfall process is simulated with a 5-year return period, and it is known from the analysis of a single rainfall event that the peak rainfall occurs at 17:00 and the overflow occurs at 17:05, which is when the most severe overflow is observed at the single-day node. Figure 12 below illustrates the node overflows for each scenario.
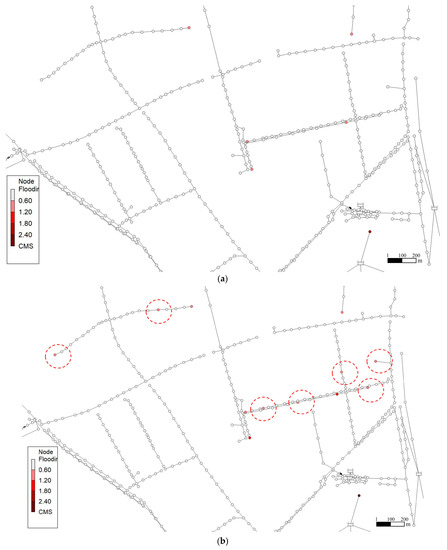
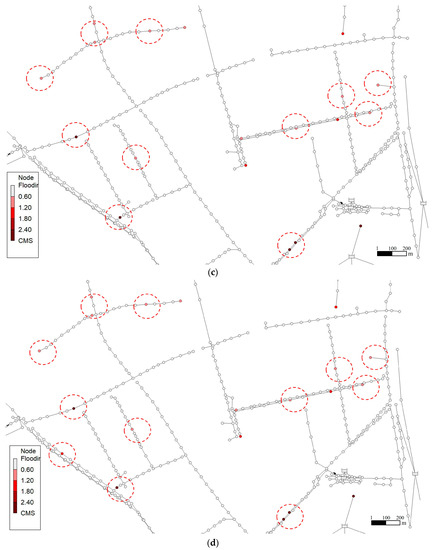
Figure 12.
Nodal overflow at 17:05 for the 5-year return period: status quo (a), SSP1–2.6 scenario (b), SSP2–4.5 scenario (c), SSP5–8.5 scenario (d).
The interface of the SWMM model for nodal overflows at 17:05 is depicted in Figure 12a, with white nodes indicating no overflows and red nodes showing overflows for which severity increases as the color intensity increases. Thirteen nodes overflow under the future emission scenarios of SSP1–2.6 compared to the status quo, of which seven nodes overflow due to future climate change, which would not overflow under the status quo, and are therefore referred to as potential overflow points (red circles in Figure 12b), representing approximately 1.5% of all nodes in the study area.
Figure 12c,d illustrate that the SSP2–4.5 and SSP5–8.5 scenarios generate 13 and 14 potential overflow sites, with a probability of 2.7% and 2.9% of potential overflow points, respectively. As the climate scenario worsens, it is evident that nodal overflows will become increasingly severe. This condition can have severe effects on the urban environment, such as generating flooding, polluting water sources, and disrupting traffic operations. Consequently, appropriate efforts must be made to improve the management and maintenance of urban drainage systems to increase their ability to withstand extreme climate scenarios.
The overall examination of the three models demonstrates that the effect of increasing scenario emissions on nodal overflows is less than that of the return period. The effect of scenario emissions on overflow start time, overflow duration, and overflow volume is more stable for both GFDL-ESM4 and EC-Earth3. For GFDL-ESM4, an increase in scenario emissions worsens the degree of node overflow, i.e., earlier overflow start times, increased overflow duration, and increased overflow volume, whereas, for EC-Earth3, the effect slows down. The MPI-ESM1-2-HR model is unstable in relation to overflows caused by higher scenario emissions, exhibiting a tendency to increase and subsequently drop.
The simulation findings for the three modes indicate that GFDL-ESM4 and EC-Earth3 are relatively similar, with an overflow volume difference of less than 1 × 10⁵ ltr for the same scenario and return period. MPI-ESM1-2-HR exhibits a lower amount of overflow in the case region than GFDL-ESM4 and EC-Earth3, and there are instances in which GFDL-ESM4 and EC-Earth3 exhibit overflow but MPI-ESM1-2-HR does not for the identical return period and emission scenario.
In general, node overflows are greater in future scenarios than in present ones, and the more severe the scenario emissions, the greater the node overflows will be. This suggests that urban rainfall under future climate change conditions will result in more nodal overflows and that the corresponding level of urban waterlogging will also increase. This is consistent with the findings of previous researchers, such as K. X. Yang [14], who predicted that flooding in Haining, China, would be worse than the status quo over the next decade using the LULC prediction model, and X. T. Wang [48], who discovered that the depth of flooding in Shanghai is anticipated to increase as the return period increases. In addition, the growth in node overflows suggests that the present gray stormwater infrastructure is unable to battle future climate change rainfall scenarios and that design standards must be upgraded to some extent, such as by increasing the diameter and depth of stormwater pipes or by the introduction of green infrastructures.
4. Conclusions
This paper evaluates the performance of ten CMIP6 models in reproducing observed rainfall in Beijing from 1994 to 2014, including total annual rainfall and rainfall in the wet season, in order to determine the model with the best performance. Under the SSP1–2.6, SSP2–4.5, and SSP5–8.5 scenarios, the GFDL-ESM4, MPI-ESM1-2-HR, and EC-Earth3 models were used to estimate precipitation for the next 50 years in the research area, as well as generate predictions for the accompanying waterlogging scenarios. The key findings are as follows:
- (1)
- In the model rainfall prediction findings for an urban region in Beijing, compared to historical observations, the CMIP6 models fared better for monthly rainfall predictions than for wet rainfall projections, showing that wet season rainfall predictions are uncertain. EC-Earth3, GFDL-ESM4, and MPI-ESM1-2-HR perform best in the study area for the combined 1994–2014 monthly and wet season rainfall projections. Regarding future precipitation forecasts, all three models indicate that greater precipitation will be produced under various future climate scenarios (SSP1–2.6, SSP2–4.5, and SSP5–8.5).
- (2)
- Among the three screened models, EC-Earth3 and GFDL-ESM4 have higher predictions of total annual and daily rainfall than MPI-ESM1-2-HR, while EC-Earth3 also predicts more runoff and overflow nodes. This shows that MPI-ESM1-2-HR may underestimate precipitation indicators such as runoff and overflow when predicting future precipitation.
- (3)
- Regarding the prediction of future waterlogging situations, all three models forecast higher runoff and larger runoff peaks in the future, along with an increase in rainfall unpredictability. Future climate change will also result in the emergence of potential overflow nodes, which will account for 1.5%, 2.7%, and 2.9% of the total nodes in the case area under the three groups of scenarios with a 5-year return period, SSP1–2.6, SSP2–4.5, and SSP5–8.5, respectively, indicating that future precipitation under current climatic conditions could lead to the formation of undetected waterlogging points in the city, resulting in more severe waterlogging.
- (4)
- The results of future rainfall predictions differ somewhat from the characteristics of historical rainfall. Due to this discrepancy, the effectiveness of stormwater drainage systems may be diminished in the future. To be able to improve climate change resilience, city management should strengthen the review and improvement of stormwater drainage systems, such as increasing drainage capacity, optimizing drainage networks, and improving flow control measures; promote the planning and development of gray–green–blue infrastructure, integrating gray infrastructure (e.g., drainage pipes and treatment facilities), green infrastructure (e.g., rain gardens and wetlands), and blue infrastructure (e.g., reservoirs and cisterns) in planning and development; and develop climate change adaptation strategies, including establishing sustainable water management plans, promoting low-impact development and rainwater harvesting, and promoting ecological restoration and nature conservation. By taking these measures, the city’s climate change resilience will be improved, and the future effectiveness of the stormwater drainage system will be ensured.
Author Contributions
Conceptualization, Y.W. (Yiwen Wang) and Z.Z. (Zhiming Zhang); methodology, Y.W. (Yiwen Wang) and Z.Z. (Zhiming Zhang); software, Y.W. (Yiwen Wang) and Z.Z. (Zhiming Zhang); validation, Y.W. (Yiwen Wang); resources, Z.Z. (Zhiyong Zhao) and T.S.; writing—original draft preparation, Y.W. (Yiwen Wang); writing—review and editing, Z.Z. (Zhiming Zhang), Z.Z. (Zhiyong Zhao), Y.W. (Yang Wang), and T.S.; project administration, Z.Z. (Zhiming Zhang); funding acquisition, Z.Z. (Zhiyong Zhao) and T.S. All authors have read and agreed to the published version of the manuscript.
Funding
This research was funded by the National Key R & D Program of China (Grand No. 2022YFC3800500) and Arup.
Data Availability Statement
Chinese monthly precipitation data with a 1 km resolution from the National Tibetan Plateau Scientific Data Centre (Observed Rainfall data) are available at https://data.tpdc.ac.cn/ (accessed on 3 September 2022). Monthly precipitation data from 1994 to 2014 simulated by the latest ten climate models in CMIP6 are available on https://esgf-node.llnl.gov/search/cmip6/ (accessed on 22 August 2022).
Conflicts of Interest
The authors declare no conflict of interest.
References
- Wu, X.; Xiao, Y.; Li, L.; Wang, G. Review and prospect of the emergency management of urban rainstorm waterlogging based on big data fusion. Chin. Sci. Bull. 2017, 62, 920–927. [Google Scholar] [CrossRef]
- Zhang, J.Y.; Wang, Y.T.; He, R.M.; Hu, Q.F.; Song, X.M. Discussion on the urban flood and waterlogging and causes analysis in China. Adv. Water Sci. 2016, 27, 485–491. [Google Scholar] [CrossRef]
- Song, X.M.; Zhang, J.Y.; He, R.M.; Zou, X.J.; Zhang, C.H. Urban flood and waterlogging and causes analysis in Beijing. Adv. Water Sci. 2019, 30, 153–165. [Google Scholar] [CrossRef]
- Chen, P.; Zhang, J.; Sun, Y.; Liu, X. Wargame Simulation Theory and Evaluation Method for Emergency Evacuation of Residents from Urban Waterlogging Disaster Area. Int. J. Environ. Res. Public Health 2016, 13, 1260. [Google Scholar] [CrossRef] [PubMed]
- Hu, S.-L.; Han, C.-F.; Meng, L.-P. A scenario planning approach for propositioning rescue centers for urban waterlog disasters. Comput. Ind. Eng. 2015, 87, 425–435. [Google Scholar] [CrossRef]
- Li, W.; Jiang, R.G.; Xie, J.C.; Zhu, J.W.; Zhao, Y.; Yang, S.Y. Scenario analysis of urban waterlogging disaster based on PSR and Bayesian network. Water Wastewater Eng. 2022, 58, 125–131. [Google Scholar] [CrossRef]
- Pan, W.B.; Ke, J.Y.; Zheng, P.; Zhan, X.P. Flood control effects of low-impact development on urban waterlogging node under different rainfall characteristics. China Environ. Sci. 2018, 38, 2555–2563. [Google Scholar] [CrossRef]
- Mustafa, A.; Bruwier, M.; Archambeau, P.; Erpicum, S.; Pirotton, M.; Dewals, B.; Teller, J. Effects of spatial planning on future flood risks in urban environments. J. Environ. Manag. 2018, 225, 193–204. [Google Scholar] [CrossRef]
- Chen, P.; Zhang, J.; Zhang, L.; Sun, Y. Research of City Rainstorm Waterlogging Scene Simulation -- in Daoli District of Harbin City as an Example. J. Risk Anal. Crisis Response 2015, 5, 66–72. [Google Scholar] [CrossRef]
- Hall, J.W.; Sayers, P.B.; Dawson, R.J. National-scale Assessment of Current and Future Flood Risk in England and Wales. Nat. Hazards 2005, 36, 147–164. [Google Scholar] [CrossRef]
- Shi, Y. Population vulnerability assessment based on scenario simulation of rainstorm-induced waterlogging: A case study of Xuhui District, Shanghai City. Nat. Hazards 2013, 66, 1189–1203. [Google Scholar] [CrossRef]
- Yae, S.J.; Min, L.S.; Hoon, K.J.; Woong, K.T. Analysis of Urban Flood Damage Characteristics Using Inland Flood Scenarios and Flood Damage Curve. J. Korean Soc. Hazard Mitig. 2014, 14, 291–301. [Google Scholar]
- Yun, Q.; Han, W.; Jiansheng, W. Protecting Existing Urban Green Space versus Cultivating More Green Infrastructures: Strategies Choices to Alleviate Urban Waterlogging Risks in Shenzhen. Remote Sens. 2021, 13, 4433. [Google Scholar]
- Yang, K.; Hou, H.; Li, Y.; Chen, Y.; Wang, L.; Wang, P.; Hu, T. Future urban waterlogging simulation based on LULC forecast model: A case study in Haining City, China. Sustain. Cities Soc. 2022, 87, 104167. [Google Scholar] [CrossRef]
- Yue, Y.; Cuilin, P.; Guangwei, F.; Maochun, T.; Junshu, W. A New Urban Waterlogging Simulation Method Based on Multi-Factor Correlation. Water 2022, 14, 1915–1938. [Google Scholar]
- Mei, C.; CHen, Y.F.; Liu, J.H.; Wang, H.; Wang, D.; Shao, W.W. Impact assessment of urban waterlogging on road traffic based on scenario simulation. Water Resour. Prot. 2022, 38, 31–38. [Google Scholar]
- Wang, S.J. Waterlogging Risk Assessment and Analysis of Urban Drainage System Based on Rainfall Scenario Simulation. China Water Wastewater 2020, 36, 112–116. [Google Scholar] [CrossRef]
- Chen, H.; Sun, J.; Lin, W.; Xu, H. Comparison of CMIP6 and CMIP5 models in simulating climate extremes. Sci. Bull. 2020, 65, 1415–1418. [Google Scholar] [CrossRef]
- Ha, K.; Moon, S.; Timmermann, A.; Kim, D. Future Changes of Summer Monsoon Characteristics and Evaporative Demand Over Asia in CMIP6 Simulations. Geophys. Res. Lett. 2020, 47, e87492. [Google Scholar] [CrossRef]
- Jiang, D.; Hu, D.; Tian, Z.; Lang, X. Differences between CMIP6 and CMIP5 Models in Simulating Climate over China and the East Asian Monsoon. Adv. Atmos. Sci. 2020, 37, 1102–1118. [Google Scholar] [CrossRef]
- Xin, X.; Wu, T.; Zhang, J.; Yao, J.; Fang, Y. Comparison of CMIP6 and CMIP5 simulations of precipitation in China and the East Asian summer monsoon. Int. J. Clim. 2020, 40, 6423–6440. [Google Scholar] [CrossRef]
- Farhad, Y.; Sogol, M.; Ardalan, I.; Amir, A. Evaluation of CMIP6 precipitation simulations across different climatic zones: Uncertainty and model intercomparison. Atmos. Res. 2020, 250, 105369. [Google Scholar]
- Zahra, H.; Asaad, H.S.; Alireza, K.; Poorkarim, B.R.; Mohammad, M.S. Spatiotemporal variations in precipitation extremes based on CMIP6 models and Shared Socioeconomic Pathway (SSP) scenarios over MENA. Arab. J. Geosci. 2022, 15, 1601. [Google Scholar]
- Felipe, J.d.M.; Cristiano, P.d.O.; Alvaro, A.-D. Evaluation of extreme precipitation climate indices and their projected changes for Brazil: From CMIP3 to CMIP6. Weather. Clim. Extrem. 2022, 38, 100511. [Google Scholar]
- Yang, Y.; Dai, X.G.; Wang, p. Projection of Asian Precipitation for the Coming 30 Years and Its Bias Correction. Chin. J. Atmos. Sci. 2022, 46, 40–54. [Google Scholar]
- Xiang, J.W.; Zhang, L.P.; Deng, Y.; She, D.X.; Zhang, Q. Projection and evaluation of extreme temperature and precipitation in major regions of China by CMIP6 models. Eng. J. Wuhan Univ. 2021, 54, 46–57+81. [Google Scholar] [CrossRef]
- Wang, Y.; Li, H.X.; Wang, H.J.; Sun, B.; Chen, H.P. Evaluation of CMIP6 model simulations of extreme precipitation in China and comparison with CMIP5. Acta Meteorol. Sin. 2021, 79, 369–386. [Google Scholar]
- Zhao, M.X.; Su, B.D.; Jiang, T.; Wang, A.Q.; Tao, H. Simulation and Projection of Precipitation in the Upper Yellow River Basin by CMIP6 Multi-Model Ensemble. Plateau Meteorol. 2021, 40, 547–558. [Google Scholar]
- Masson, D.; Knutti, R. Spatial-Scale Dependence of Climate Model Performance in the CMIP3 Ensemble. J. Clim. 2011, 24, 2680–2692. [Google Scholar] [CrossRef]
- Song, F.; Zhou, T. The Climatology and Interannual Variability of East Asian Summer Monsoon in CMIP5 Coupled Models: Does Air–Sea Coupling Improve the Simulations? J. Clim. 2014, 27, 8761–8777. [Google Scholar] [CrossRef]
- Sperber, K.R.; Annamalai, H.; Kang, I.-S.; Kitoh, A.; Moise, A.; Turner, A.; Wang, B.; Zhou, T. The Asian summer monsoon: An intercomparison of CMIP5 vs. CMIP3 simulations of the late 20th century. Clim. Dyn. 2013, 41, 2711–2744. [Google Scholar] [CrossRef]
- Zhao, D.; Zhang, L.X.; Zhou, T.J. Performance Assessment of CMIP6 Model in Simulating the Water Cycle over East China. Chin. J. Atmos. Sci. 2022, 46, 557–572. [Google Scholar]
- Li, B.; Yu, L.; Pan, X.Y.; Ju, Q.; Zhang, Y.H.; Zhao, L.J.; Yang, M.Y. Temporal and spatial characteristics of precipitation in Tongzhou District, Beijing. J. Beijing Norm. Univ. (Nat. Sci.) 2020, 56, 566–572. [Google Scholar]
- Buda, S.; Jinlong, H.; Kumar, M.S.; Jianqing, Z.; Yanjun, W.; Shanshan, W.; Miaoni, G.; Yanran, L.; Shan, J.; Tong, J.; et al. Insight from CMIP6 SSP-RCP scenarios for future drought characteristics in China. Atmos. Res. 2020, 250, 105375. [Google Scholar]
- Chen, W.; Jiang, Z.; Li, L. Probabilistic Projections of Climate Change over China under the SRES A1B Scenario Using 28 AOGCMs. J. Clim. 2011, 24, 4741–4756. [Google Scholar] [CrossRef]
- Wu, W.; Liang, Z.R.; Liu, X.C. Projection of the Daily Precipitation Using CDF-T Method at Meteorological Observation Site Scale. Plateau Meteorol. 2018, 37, 796–805. [Google Scholar]
- Zhou, L.; Lan, M.C.; Cai, R.H.; Huang, J.; Jiang, Z.H. The Simulation of Extreme Precipitation over Hunan Province based on the Statistical Downscaling Method of Transform Cumulative Distribution Function (CDF-t). Plateau Meteorol. 2019, 38, 734–743. [Google Scholar]
- Zhou, L.; Jiang, Z.H. Future changes in precipitation over Hunan Province based on CMIP5 simulations using the statistical downscaling method of transform cumulative distribution function. Acta Meteorol. Sin. 2017, 75, 223–235. [Google Scholar]
- Li, H.; Sheffield, J.; Wood, E.F. Bias correction of monthly precipitation and temperature fields from Intergovernmental Panel on Climate Change AR4 models using equidistant quantile matching. J. Geophys. Res. Atmos. 2010, 115, D10101. [Google Scholar] [CrossRef]
- Li, C.L.; Hu, Y.M.; Liu, M.; Xu, Y.Y.; Sun, F.Y.; Chen, T. Local sensitivity analysis of parameters in Storm Water Management Model. Chin. J. Ecol. 2014, 33, 1076–1081. [Google Scholar] [CrossRef]
- Sharifan, R.; Roshan, A.; Aflatoni, M.; Jahedi, A.; Zolghadr, M. Uncertainty and Sensitivity Analysis of SWMM Model in Computation of Manhole Water Depth and Subcatchment Peak Flood. Procedia Soc. Behav. Sci. 2010, 2, 7739–7740. [Google Scholar] [CrossRef]
- Morris, M.D. Factorial Sampling Plans for Preliminary Computational Experiments. Technometrics 2012, 33, 161–174. [Google Scholar] [CrossRef]
- Lin, W.; Chen, H. Assessment of model performance of precipitation extremes over the mid-high latitude areas of Northern Hemisphere: From CMIP5 to CMIP6. Atmos. Ocean. Sci. Lett. 2020, 13, 598–603. [Google Scholar] [CrossRef]
- Zhou, T.; Ren, L.; Zhang, W. Anthropogenic influence on extreme Meiyu rainfall in 2020 and its future risk. Sci. China Earth Sci. 2021, 51, 1637–1649. [Google Scholar] [CrossRef]
- Hu, Y.Y.; Xu, Y.; Li, J.J.; Han, Z.Y. Evaluation on the performance of CMIP6 global climate models with different horizontal resolution in simulating the precipitation over China. Clim. Chang. Res. 2021, 17, 730–743. [Google Scholar]
- Li, X.L.; Wang, W.G.; Zhang, S.L. A Trend Analysis of Future Precipitation in the Yangtze River Basin Based on CMIP6 Multi-Model. China Rural. Water Hydropower 2022, 473, 1–7+12. [Google Scholar]
- Wu, J.; Xia, J.; Zeng, S.D.; Liu, X.; Fan, D. Evaluation of the Performance of CMIP6 Models and Future Changes Over the Yangtze River Basin. Resour. Environ. Yangze Basin 2023, 32, 137–150. [Google Scholar]
- Wang, X.; Yin, Z.; Wang, X.; Tian, P.; Huang, Y. A study on flooding scenario simulation of future extreme precipitation in Shanghai. Front. Earth Sci. 2018, 12, 834–845. [Google Scholar] [CrossRef]


Disclaimer/Publisher’s Note: The statements, opinions and data contained in all publications are solely those of the individual author(s) and contributor(s) and not of MDPI and/or the editor(s). MDPI and/or the editor(s) disclaim responsibility for any injury to people or property resulting from any ideas, methods, instructions or products referred to in the content. |
© 2023 by the authors. Licensee MDPI, Basel, Switzerland. This article is an open access article distributed under the terms and conditions of the Creative Commons Attribution (CC BY) license (https://creativecommons.org/licenses/by/4.0/).