Abstract
Debris flow, driven by natural events like heavy rainfall and snowmelt, involves sediment, rocks, and water, posing destructive threats to life and infrastructure. The accurate prediction of its activity range is crucial for prevention and mitigation efforts. Cellular automata circumvent is the cumbersome process of solving partial differential equations, thereby efficiently simulating complex dynamic systems. Given the anisotropic characteristics of square cells in the simulation of dynamic systems, this paper proposes a novel approach, utilizing a hexagonal cellular automaton for the numerical simulation of debris flows, where the direction judgment efficiency increased by 25%. Employing cubic interpolation, the model thereby determines the central elevation of each hexagonal cell. By modifying the flow direction function and stopping conditions, it achieves more accurate predictions of the debris flow run-out extent. This method was applied to the 2010 Yohutagawa debris flow event and the flume test. To evaluate the simulation’s accuracy, the value and score were used. The value is a comprehensive evaluation factor that takes into account missed or misjudgment areas. On this basis, the score emphasizes that the missed identification of debris flow areas will bring greater harm. Research indicates that the value showed improvements of 6.47% and 3.96%, respectively, while the score improved by 3.10% and 4.61%.
1. Introduction
The onset of a debris flow requires large amounts of loose solid material and steep terrain [1,2]. Rain or snowfall acts as a trigger, pushing water, sand, and stones forward [3]. Mountainous areas offer ideal conditions for debris flow formation [4]. Around 66% of China’s landmass consists of mountainous landscapes, especially in the transition zone between the second and third topographic levels [5,6]. Active geological processes significantly contribute to the accumulation of loose materials, facilitating the formation of debris flows [7]. Moreover, China’s predominantly monsoon climate, with heavy rainfall in the wet season, fosters favorable conditions for debris flow initiation. Debris flows cause severe damage to residences, agricultural land, and transportation infrastructure, leading to casualties and extensive property damage. The urgency of enhancing debris flow mitigation and reducing their impacts is increasingly prompting scholars to focus on predicting their impact range [8,9]. Precisely predicting the path and scale of debris flows allows for the rational design and planning of transportation infrastructure like roads and railways, preventing the development of vital transport hubs in debris flow-prone areas [10,11,12].
In the field of debris flow disaster mitigation, numerical technologies play a crucial role in disaster prevention [13,14]. Many studies focus on numerically solving the Navier–Stokes (N–S) equation. These studies encompass approaches such as the shallow water equations (SWEs) and the smoothed particle hydrodynamics (SPH) method. The shallow water equations are implemented within a grid-based numerical framework specifically designed to simulate hydrodynamic flows under the assumption of hydrostatic pressure distribution. This methodology simplifies the Navier–Stokes equations by averaging vertical field variables, thereby efficiently modeling the flow over complex terrain with reduced computational demand [15,16,17,18]. On the other hand, the smoothed particle hydrodynamics method employs a particle-based Lagrangian framework, eschewing traditional grid constraints for a more flexible representation of fluid dynamics [19,20,21,22]. Through the use of kernel interpolation and particle discretization, the smoothed particle hydrodynamics method possesses the capability to handle physical processes such as large deformations and free-debris flow characteristics such as velocity, depth, and spatial positioning. Nonetheless, they consistently require significant computational resources [23,24]. Additionally, acquiring parameters related to rheological properties, such as viscosity, presents notable costs [25]. The above issues make physical-based methods still problematic for field-scale applications [26,27].
The cellular automaton (CA) model represents a numerical framework that partitions the entire area into discrete units, known as cells, each characterized by specific variables [28,29,30]. Since the 1980s, CA models have been widely used in the simulation of a variety of natural disasters, including debris flows, landslides, avalanches, and rockslides [31,32]. These applications underscore the efficacy of the CA model in simulating the dynamic processes of natural disasters and highlight its potential in disaster risk assessment and management strategies [33,34,35]. Within the CA framework, the transition function incorporated with the probabilistic iterative algorithm is the key to controlling the dynamic evolution of the debris flow. Gamma [36] initially designed this framework, which is based on the Monte Carlo iterations, to advance the integration of the flow path through a topography-based model. Subsequently, other refinement mechanisms, including friction models [37], bedload transfer [38,39], and stopping conditions [40,41], have been continuously integrated into the paradigm to better constrain the flow dynamics of the debris flow. Han [42] revised the persistence weight parameters based on the flume experiments and quantified the inertial effect based on the persistence functions. Ma [43] further introduced a roughness function to depict the impact of bed roughness on the flow direction.
Historically, research applications of the CA models have predominantly utilized square cells. However, this architecture encounters challenges related to inconsistent neighbor relationships and directional biases, ultimately leading to anisotropic issues [44]. Therefore, introducing a lattice structure that aligns more consistently and compatibly with the motion of debris flows is imperative to accurately characterize the evolution of the flow direction. Sousa [45] found that hexagonal digital elevation model data provide a higher spatial resolution compared to a square-cell structure. To simulate the movement of debris flows, Frisch [46] discrete the Navier–Stokes equation in the context of a hexagonal lattice. Ambrosio [47] and Avolio [48] developed a hexagonal-based CA model named SCIDDICA and applied it to real-world cases. Additionally, the hexagonal CA has fewer neighbors than the square-cell structure, which includes only six neighbors and leads to a 25% efficiency improvement in efficiency when determining the flow direction [49].
This study integrates the persistence function, previously validated in square cellular automaton (SCA) models, into the hexagonal cellular automaton (HCA) scheme. This modification aims to refine the model’s ability to accurately simulate the flow state of debris flows. The integration of the persistence function into this novel context is expected to enhance both the robustness and simulation accuracy. Furthermore, the stopping conditions, a cornerstone of this framework, primarily address the conditions under which debris flows halt based on the maximal reach of debris accumulation. By accounting for both the “sink-filling” [36] and “maximum path length” considerations, the proposed method controls the dynamic evolution of the debris flow.
In general, this paper presents the HCA model for the numerical simulation of debris flow, which involves dividing the terrain into a network resembling a hexagonal honeycomb. This approach focuses on investigating the dynamics of the debris flow direction and the stopping conditions applicable to this cellular structure. Finally, the run-out extent of the debris flow is determined through Monte Carlo iterations, integrating all flow paths to effectively address the anisotropic challenges that SCA encounters in simulating debris flow dynamics.
2. Methods
2.1. Model Introduction
A standard CA model comprises several core components as follows: cells, lattice, neighborhoods, and transition functions.
- Cell and Lattice
The cell is the most fundamental unit of a CA model, serving as the system’s basic building block. The lattice describes how cells are spatially arranged, including the type, size, structure, and boundary conditions of the cellular network.
In past research, square cells were more popular due to their inherent advantages in data representation. Initially, it is crucial to acknowledge that original terrain data frequently take the form of digital elevation model (DEM) raster data. In the DEM, the map is partitioned into a matrix of pixels, each pixel delineating a square shape and encoding specific values to represent the features or attributes of the corresponding location on the map. The alignment of the raster data’s square pixels with the square-cell data highlights the inherent compatibility between DEM formats and the structure framework of CA models, thereby facilitating straightforward data utilization without requiring extensive processing. Horton [37] and Ma [43]’s research shows that the run-out extent of the debris flow can be accurately simulated using a cell size of 2.5 m.
We adopted hexagonal cells as the lattice format, which requires additional processing of the cells and lattices before discussing the transition functions. Firstly, there is the selection of cell orientation, which can be either flat-topped or pointy-topped, as seen in Figure 1a. Next, is the choice of the lattice offsetting method. For the flat-topped cells in Figure 1c, the options include odd-column-down offsetting or odd-column-up offsetting. (If using pointy-topped cells, one must choose between odd-row-left offsetting or odd-row-right offsetting). The above processing flow will affect the matrix–coordinate mapping relationship. It is important to note that the coordinate mapping relationship varies for different cell and lattice forms. Equations (1) and (2) depict the scenario of “flat-topped cells” and “odd-column-up offsetting”. The coordinates of the lattice with index in a two-dimensional matrix are given by:
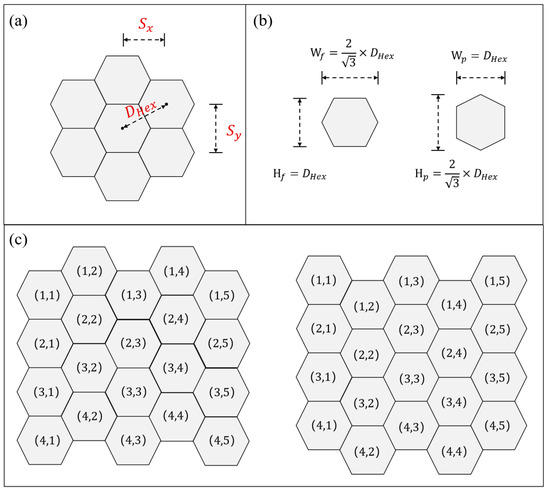
Figure 1.
Hexagonal cells, lattice form: (a) cell neighbor relations and distance, (b) cell orientation and size, and (c) lattice form in offset coordinate system.
When is an odd number,
While is an even number,
In the formula, and refer to the distance in the x and y directions between the centers of the hexagonal grid cells, respectively. The relationship between , and the cell size of the neighboring unit center is shown in Figure 1b and Equations (3) and (4):
After completing the coordinate mapping, obtaining the elevation of the cells became an urgent issue. Considering both interpolation accuracy and efficiency, we opted for cubic interpolation. This aspect will be further elaborated in Section 4.
- Neighborhood:
The concept of neighborhood refers to the range of cells in which the center of a cell is affected by surrounding cells, usually defined by its radius. Figure 2 illustrates the cell arrangement and neighborhood relationship of the SCA models and HCA models in (a) and (b), respectively. In Figure 2a, the distance between the adjacent edge grids is , while the distance between the adjacent corner grids is .
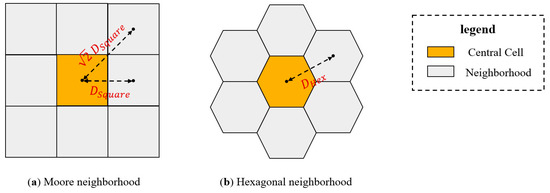
Figure 2.
Neighbor distance in different situations: (a) SCA model using the Moore neighborhood, (b) HCA model using the hexagonal neighborhood.
- Transition Functions:
The CA model cell states transition to another state through transition functions, which serve to employ rule-based simulation processes rather than traditional mathematical functions for simulation. The CA method derives the development of complex phenomena with simple transition functions and a massive iteration. Instead of solving the complex PDEs, this approach employs interaction relations among neighboring cells [36,42,43]. These transition functions are not only simpler and more straightforward to express and compute than the physical solutions required in dynamic models, but they also facilitate a more accessible understanding of the system’s processes. Refer to Section 2.2, Section 2.3 and Section 2.4 for detailed information.
2.2. Flow Direction Function
2.2.1. Terrain Probability
In the dynamics of debris flow, there is a strong tendency for the flow to follow the path of maximum slope descent. In SCA models, the D8 algorithm [50] is a common method for determining the flow direction. It primarily identifies and utilizes the steepest slope direction of each unit flow path as the debris flow direction. However, the D8 algorithm, with its single flow direction approach, does not adequately handle the divergent nature of the debris flows observed in real-world scenarios, especially in areas with gentle slopes where divergence is pronounced, resulting in significant inaccuracies.
To overcome these limitations, our terrain function calculates slopes in all directions within a hexagonal honeycomb network, considering the divergence phenomenon inherent to debris flows. We propose that cells with a positive slope gradient have a probability of directing the flow. Since a debris flow is unlikely in directions with a negative longitudinal slope, these cells are assigned a flow direction probability of zero.
The probability of the flow direction, denoted as , is calculated using Equation (5).
As shown in Figure 3c, and represent the longitudinal slope descent in directions and respectively. They are set to zero when the longitudinal slope in those directions is negative. At a positive slope, the Equation (6) calculation formula is as follows:
represents the vertical slope in the direction relative to the central cell.
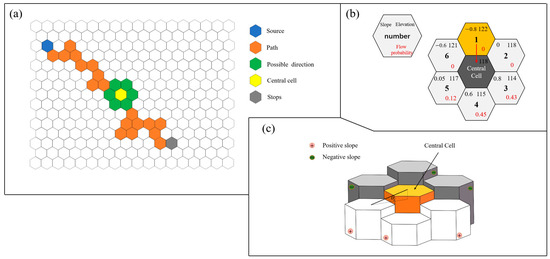
Figure 3.
Transition function diagram: (a) pathfinding process, (b) Monte Carlo flow selection, and (c) terrain slope calculation.
2.2.2. Persistence Probability
When debris flows on flat terrain, the movement is mainly forward, aligned with the velocity direction. However, as the average flow velocity decreases, the debris flow not only continues to advance but also begins to spread. To describe this behavior, we introduce the concept of “persistence probability,” which captures this phenomenon.
In Section 2.2.1, our analysis of the flow direction function predominantly focuses on the static properties of the terrain. Moving forward, this section delves into the dynamic attributes of debris flow. By integrating these dynamic aspects, we aim to enhance the precision of our debris flow modeling. In Figure 4a, the debris flow enters the central cell along a trajectory shown by a red arrow. The persistence probability suggests that in the next time step, the debris flow could transition into the cell pointed by a black arrow. We assign persistence weights to each neighboring cell, reflecting the dynamic characteristics and momentum of the debris flow.

Figure 4.
Relationship between persistence probability and inflow direction: (a) the HCA model, (b) edge neighbor inflow in the SCA model, and (c) corner neighbor inflow in the SCA model.
The concept of persistence weight, denoted as plays a crucial role in the debris flow simulations by considering the position of the inflow cell. For a given incoming cell, we derive the forward and oblique direction numbers from Table 1 and then obtain their persistence probability from Equation (7). Specifically, persistence probabilities such as and represent the likelihood of the debris flow continuing in the forward direction (0°) and in an oblique direction (60°) relative to the inflow trajectory, respectively. This framework provides a nuanced understanding of how the debris flow momentum affects its trajectory. Furthermore, persistence probabilities at angles of 120° and 180° from the inflow direction ( and ) are practically assigned a persistence probability of zero. This decision is based on the observation that debris flows are unlikely to disperse in the reverse speed direction due to the momentum and physical characteristics of the flow.

Table 1.
Forward and oblique directions under different incoming cells.
Figure 4b,c depict scenarios where the inflow cells of a SCA model are edge neighbors and corner neighbors, respectively. In our previous research on SCA models [42], we suggested the values , , and , which yielded optimal results in the inversion scenario. Building on this successful value scheme, we computed the unit angle weight for each region and implemented it in the HCA models. This resulted in a persistence weight scheme applicable to HCA models, which is , .
2.2.3. Probability Combination
In Section 2.2.1 and Section 2.2.2, this study introduced terrain probability and persistence probability into the HCA model to further determine the flow direction function of the debris flow. There are two mainstream coupling methods, which are the multiplication method [37] in Equation (8) and the addition method [42] in Equation (9).
Using the multiplication method of Equation (8), when the terrain and flow inertia are combined probabilistically—when any factor produces a probability of 0—the comprehensive flow probability of the cell unit will also be zero. Under the complex interaction of speed and topography, reverse slope flow and reverse velocity flow will occur in debris flows under realistic physical systems. However, this probabilistic combination method considers it impossible to flow in these directions, resulting in the excessive concentration of flow directions and deviating from the behavioral characteristics of a real-world debris flow.
The addition method of Equation (9) overcomes the above problems. Han [42] discussed the impact of different combination methods on model accuracy, and the experimental results showed that the additive method is better than the multiplicative method in model accuracy.
2.3. The Sink-Filling Approach
The sink-filling approach, utilized to simulate the traversal of troughs or dams, was first introduced by Gamma [36] and later refined by Wichmann [51]. It aims to tackle the challenge posed by negative slopes that inherently impede debris flow movement. Primarily employed in geographic information systems (GIS) and terrain analysis, the sink-filling approach improves the simulation accuracy of debris flow characteristics. In natural settings, the debris flow typically flows towards the lowest points in the terrain. However, encountering a groove characterized by surrounding cells at elevations higher than that of the current cell creates a negative slope scenario that impedes debris flow movement. The sink-filling models are designed to overcome these barriers by “filling” grooves.
When the debris flow reaches a particular cell, and all neighboring cells are found to have negative slopes, the sink-filling model is activated. Debris flows cease movement and deposit sediment here, altering the elevation of the cell. The sedimentation-filling effect within the “groove” enables it to overcome the obstacle after numerous Monte Carlo iterations. This approach is primarily viewed as a computational estimate, employed in scene modeling and aiding further model iterations, thereby facilitating the debris flow to enact the over-dam accumulation process ahead of the sediment dam and enabling the exploration of debris flow pathways.
2.4. Maximum Length Function
As the debris flow transitions from steep slopes to gentle alluvial flats, its velocity progressively diminishes. Upon the velocity reaching zero, the movement of the debris flow ceases. The maximum length of debris flow accumulation is an important parameter for predicting the range of debris flow. Wang [52]’s debris flow accumulation experiment showed that when the debris flow concentration () and the downstream flow path slope () remain unchanged, the maximum length of the debris flow () is related to the impact of the debris flow. It is proportional to the total runoff (), and the empirical formula form of the maximum length of debris flow is given, as shown in Equation (10).
where and are the parameters related to the concentration of the debris flow. The recommended values for the regression results of the debris flow experiments are = 0.42 and = 0.935.
When the debris flow concentration changes, this formula does not describe the maximum length accurately enough. For this purpose, he conducted a series of flume tests. For different debris flow concentrations and the debris flow outflow volume , the maximum length formula considering the concentration factor is obtained through Equation (11). When the debris flow concentration is known, it is recommended to use Equation (11), otherwise, Equation (10) can be used.
In the realm of HCA models, the stopping of debris flows emerges from a nuanced interplay between static terrain factors and dynamic momentum indicators. The terrain aspect scrutinizes each potential flow direction for the presence of a ‘sink-filling’ scenario, which triggers the stopping conditions and subsequent deposition of debris flows. Dynamically, the focus shifts to the length of the debris flow’s path, particularly whether it has reached its predefined maximum. Achieving this milestone prompts the halt of the debris flow. The number of iterations of the debris flow direction function, which is denoted as , is determined by the maximum length. Based on the maximal length of the debris flow, the maximum number of iterations of the debris flow direction function for the CA models is determined according to Equation (12).
The coefficient serves as a crucial correction factor for the maximum length , as delineated in Equations (10) and (11), compensating for the empirical derivation of . Our findings suggest that the integration of , particularly set at 1.2, significantly enhances the simulation’s accuracy. Additionally, denotes the dimension of each hexagonal cell in the model. The simulation of the debris flow path is designed to cease once the iteration count reaches or exceeds the predefined maximum number of steps, , thereby delineating a comprehensive and plausible debris flow trajectory.
2.5. Path Simulation Function Based on Monte Carlo Iterative
The Monte Carlo iteration method stands as a pivotal computational technique that leverages random sampling to approximate solutions for intricate problems. At its core, this method employs a random number generator to produce an extensive series of random samples. These samples serve as a basis for inferring the potential outcomes of complex phenomena. Following the generation of a substantial dataset of random numbers, the derived potential outcomes are subjected to rigorous statistical analysis.
Using the flow direction function, we determined the probability of the debris flow to each neighboring cell through Equation (13), along with the random range of the neighbor cell through Equation (14):
where denotes the maximum probability of the flow direction for the neighboring cell , represents the interval of the flow direction probabilities for the neighboring cell . When , it follows that ; under these conditions, for the neighboring cell becomes an empty set, indicating that the debris flow will not enter this cell. Utilizing the Monte Carlo iterative algorithm principle, a random number is generated. Should lie within ’s interval, the subsequent flow direction of the debris is designated to neighbor cell .
Figure 3b illustrates the debris flow moving from cell No. 1 into the central cell. Known cell elevations enable the determination of the slope and terrain probability for each neighboring cell via the terrain probability function. The inflow is identified as originating from cell No. 1. The persistence probability function reveals that . Subsequently, the aggregate flow direction probability for each cell is calculated through the additive method.
During the simulation, Figure 3b demonstrates the calculation of the comprehensive flow probabilities for each neighboring cell of the central cell as follows: . Applying the random range method, the probability intervals are determined as , . The magnitude of the random number dictates the subsequent direction of the debris flow. Integrating the debris flow stopping conditions in Section 2.3 and Section 2.4 to ascertain the termination point of the debris flow, a complete path of the debris flow was delineated. Figure 3a describes the start, generation, and end process of such a path. Based on the Monte Carlo iterative algorithm, all possible paths of the debris flow are obtained, and the spatial set of all paths is the flow range of the debris flow.
3. Case Study
3.1. Yohutagawa Debris Flow
Yohutagawa is located on Amami Oshima in the southern part of Kyushu Island, Japan, at the coordinates 28°24′ N, 129°32′ E. It covers an area of approximately 0.24 km2, with elevations ranging from 20 to 250 m. The region is predominantly forested. On 20 October 2010, the area was struck by a torrential rainstorm, reaching a peak rainfall intensity of 131 mm/h. The heavy rainfall triggered a rockslide at the highest point of the area, with a volume of 5843 m3. A notable characteristic of this debris flow was the relatively narrow flow channel compared to the initial collapse area, with a clear demarcation between the erosion and deposition zones. The average slope of the incised river channel in Yohutagawa is about 16°. The total length of the debris flow was approximately 750 m. Figure 5 illustrates the different zones of the debris flow in Yohutagawa.
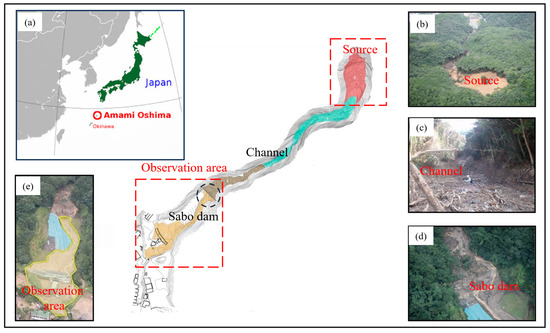
Figure 5.
Yohutagawa debris flow: (a) Amami Oshima location, (b) debris flow source area, (c) channel of the Yohutagawa debris flow, (d) dam downstream of the channel, and (e) observation area.
The CA model is based on the DEM data of the debris flow watershed, the location of the material source points, and the total amount of debris flow collapse. It rapidly predicts the potential covered area of the debris flow. The size of the cells in a SCA model is determined by the side length in the x and y directions, whereas for a hexagonal cell automaton, the cell size is defined by the center-to-center distance between adjacent units. In this study, is set at 2.5 m based on the recommended values [37,43]. Additionally, this paper uses to conduct a comparative analysis between the HCA and SCA models. Based on the DEM data of the Yohutagawa event (1425 m × 1138 m), this paper performed interpolation processing on the terrain data of 455 rows and 570 columns under the square grid to obtain the hexagonal grid terrain data of 455 rows and 658 columns.
The simulation validation of the Yohutagawa debris flow extent was conducted using both the HCA and SCA models. The parameters for these models are shown in Table 2. The predicted extents of the debris flow from both models are illustrated in Figure 6 and Figure 7. Both models performed well in simulating the upper and middle reaches of the channel, with the primary differences observed in the downstream deposition area.

Table 2.
The parameters for CA models.
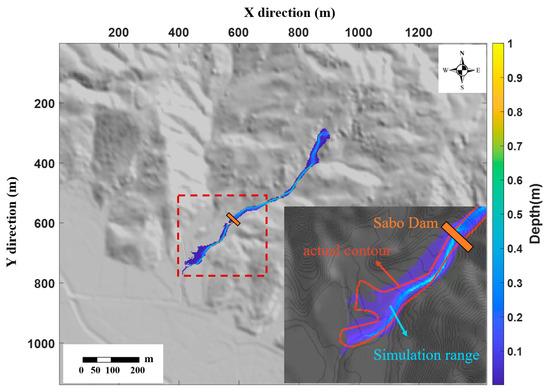
Figure 6.
SCA model run-out extent result.
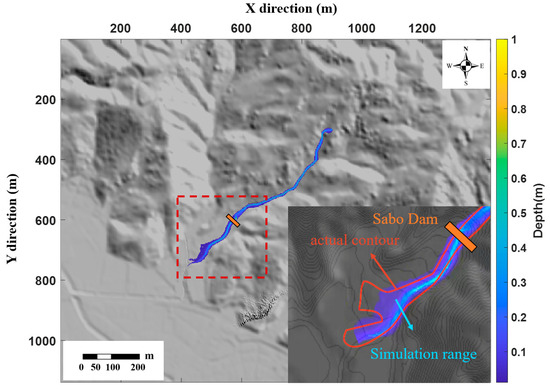
Figure 7.
HCA model run-out extent result.
3.2. Flume Test
The objective of the debris flow flume test is to explore the initiation, flow dynamics, and erosion-deposition processes related to debris flows. By simulating variables such as diverse terrain configurations, soil-water mixture ratios, and flow velocities, we can gain insights into the dynamic behavior and impacts of debris flows, providing a scientific basis for predicting, mitigating, and managing them. Figure 8a represent the test equipment used by Liu et al. [53]. And Figure 8b depicts the simulation result of debris flow. A detailed analysis will be provided in the following section.
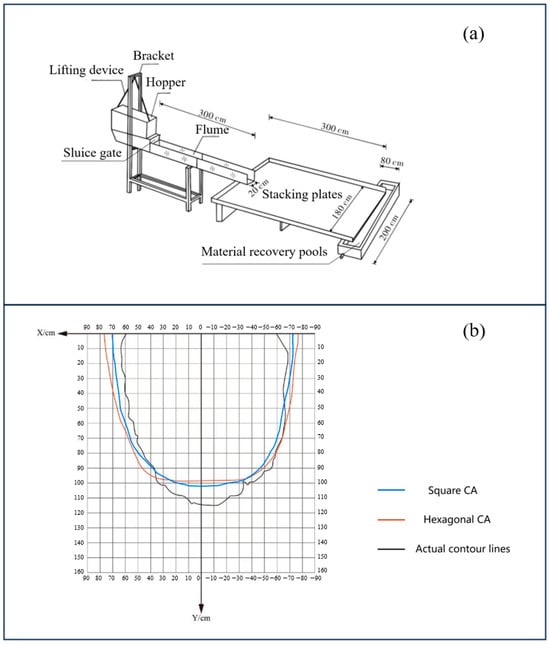
Figure 8.
(a) the test equipment used by Liu et al., (b) Comparison of the simulated area with the real area in flume test.
3.3. Result Analysis
Precision is defined as the ratio of the true-positive samples to the total number of samples identified as positive by the model by the model as Equation (15). Recall is quantified as the ratio of the true-positive samples to the entire set of samples that are genuinely positive as Equation (16).
(true positives): The regions that are accurately identified as being subject to debris flows are termed ‘overlap areas’. (false positives): Areas erroneously predicted as debris flow zones are designated as ‘misjudgment areas’. (false negatives): Areas inaccurately classified as non-debris flow zones are referred to as ‘missed judgment areas. Table 3 details the calculation results of the ,, and ranges for the two cases.

Table 3.
Areas of each area in the Yohutagawa debris flow and flume test.
An evaluation factor, represented by in Equation (17), was employed to comprehensively evaluate the model’s performance, taking into account both misjudgment and missed judgment [43].
The evaluation metric systematically integrates the overlapping area, misjudgment area, and missed judgment area within the debris flow range prediction, providing a well-structured quantification approach. However, this metric assumes a linear influence of the three parameters , and on the assessment of predictive accuracy for debris flow ranges, thereby neglecting the differing impacts of misjudgments and missed judgments on the detrimental outcomes associated with debris flow range predictions.
Zhang [54] employs the F1 score, as depicted in Equation (18), to evaluate model simulation accuracy, defined as the harmonic mean of precision and recall. To account for the heightened adverse impact of the missed judgments over misjudgments, this study adopts the F-beta score. The F-beta score, presented in Equation (19), serves as a performance evaluation metric that reflects the model’s precision and recall rates. It adjusts the recall rate via a parameter , thus modulating the significance of recall relative to precision. For debris flows, is selected to emphasize the importance of recall. Table 4 shows the run-out extent evaluation index in the Yohutagawa debris flow and flume test.

Table 4.
Evaluation index in the Yohutagawa debris flow and flume test.
Compared to the SCA model, the evaluation factors and of the HCA model have improved. In the Yohutagawa debris flow, and increased from 0.5424 and 0.8304 to 0.5642 and 0.8687, respectively, resulting in an increase in the simulation accuracy by 4.02% and 4.61%. In the flume test, and increased from 0.5054 and 0.8191 to 0.5381 and 0.8488, respectively, leading to a simulation accuracy improvement of 6.47% and 3.63%. However, it is noteworthy that the evaluation factor has not shown significant improvement, and in some cases, the effect in the Yohutagawa debris flow was not as favorable as the original SCA model. The reason for this occurrence lies in the inherent conservative nature of the HCA model. To minimize missed judgments, it tends to prioritize overestimating the debris flow extent, which inadvertently results in an increase in misjudgments.
4. Discussion
4.1. Interpolation Accuracy
In executing the slope computations within the flow direction function delineated in Section 2.2, acquiring elevation data for each cell is imperative. This study employs DEM raster data to discretely depict the Earth’s topography, furnishing elevation data for a finite set of known points. Within the HCA framework of the network, the position information of all cells is ascertainable via the lattice division method; however, the elevation for these cells remains undetermined. To deduce the elevation values of these indeterminate points, selecting a suitable interpolation method becomes essential.
Based on the first law of geography, widely employed terrain interpolation techniques encompass inverse distance weighting (IDW), bilinear interpolation, and cubic interpolation. This study evaluates the interpolation accuracy of the aforementioned terrain interpolation methods, with the objective of identifying the most appropriate technique for mountainous terrain for future research and application.
The “peaks” function in MATLAB exemplifies a tool for mountain terrain simulations, generating landscapes with notable peaks and valleys. By adjusting the parameters, researchers can customize the terrain features to align with their study’s topographic criteria, obtaining DEM raster data, which includes elevation values at the grid points. We compared terrain generated by the bilinear, cubic, and IDW interpolation methods. The bilinear and cubic interpolations produced smoother terrains, whereas IDW appeared to have jagged features. DEM accuracy is assessed using the root mean squared error (). The calculation method of is shown in Equation (20).
where is the true value of the terrain, is the observed value or calculated value, is the error, and is the number of errors.
Better smoothness can be obtained by interpolating the terrain using the bilinear interpolation method or the cubic interpolation method. When mainly considering the interpolation accuracy, it is recommended to use the cubic interpolation method. This conclusion is based on a MATLAB terrain interpolation experiment, which compared the computational efficiency and accuracy of different interpolation methods. The cubic interpolation method proved superior to the bilinear interpolation method in terms of interpolation accuracy, as reflected in Table 5. The in the cubic interpolation was an order of magnitude lower, but the results of both methods were within acceptable limits. The inverse distance weighting interpolation method was excluded first due to its low accuracy. The bilinear interpolation method has an efficiency advantage over the cubic interpolation method, especially when high accuracy in terrain interpolation is required. The efficiency analysis of the interpolation methods in this paper is based on the terrain conditions of the Yohutagawa debris flow event, which covered a small area. Even with high-precision interpolation, the increase in computation time was only about two minutes. This is acceptable for an order of magnitude improvement in precision, so the cubic interpolation method was chosen.

Table 5.
of different interpolation methods.
4.2. Interpolation Efficiency
Interpolation calculations were conducted on the Yohutagawa DEM data, with the calculation durations for each of the two interpolation methods recorded. A comparative analysis revealed that across varying lattice sizes, the bilinear interpolation method consistently necessitates less time than the cubic interpolation method. Specifically, with a cell size of 3 m, the efficiency of bilinear interpolation significantly surpasses that of cubic interpolation. The interpolation duration decreased from 345.85 s to 245.69 s, marking a reduction of 100.16 s and an enhancement in computational efficiency by 28.96%. However, at a cell size of 5 m, the computational efficiency advantage of the bilinear interpolation method diminishes, with the reduction in interpolation time amounting to merely about 10 s. For cell sizes of 7 m and 10 m, the time savings achieved through interpolation are even more marginal, amounting to only 1–2 s. In scenarios with fine interpolation grids and extensive computational demands, the bilinear interpolation method markedly enhances the calculation speed. Consequently, the bilinear interpolation method is advisable. Nevertheless, considering the relatively short overall interpolation duration and the minimal time differences between commonly utilized lattice sizes (5 m, 10 m), cubic interpolation, which offers superior accuracy, is recommended. This approach is also employed in the method presented in this study for interpolating cell elevations.
4.3. Dam-Crossing Test
In Section 2.3 and Section 2.4, we introduced the sink-filling model and the maximum length function, respectively. This section conducts a series of model tests to verify the performance of these two models in the HCA, including their advantages and necessity. The tests simulate debris flows of various sizes in the Yohutagawa terrain, originating from the collapse point and flowing downstream to the dam. Figure 9a displays the results when the simulated flushing volume is 1000 m3. At this point, the debris flow fails to cross the dam. In Figure 9b, with an overflow volume of 2000 m3, the debris flow begins to cross the dam body, posing risks to human habitation areas. Figure 9c depicts the scenario where the flushing volume is set at 3000 m3. The simulation results show that the debris flow successfully traverses the dam body. As the outflow reaches 5000 m3, shown in Figure 9d, more debris accumulates on the alluvial fan.
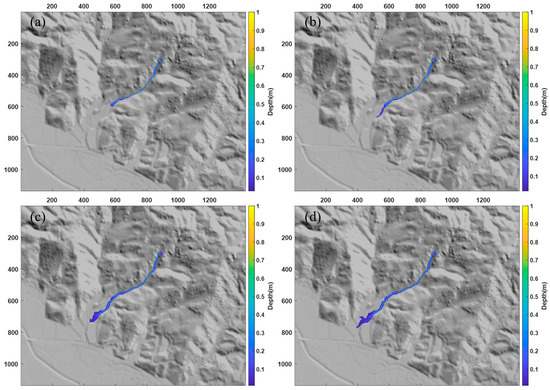
Figure 9.
Model results for debris flows of different scales: (a) Sedimentation in front of the dam, (b) debris flow over the dam, (c) a large number of debris flows rushed out and reached their maximum length, and (d) more outbursts strengthen the lateral expansion of debris flows.
This experiment corresponds to the stopping conditions following debris flows of varying scales. When the debris flow scale falls within the dam’s capacity, it is entirely obstructed, posing no threat to the human habitation facilities downstream. In our HCA model, such scenarios trigger a sink-filling model, where all debris flow sediments accumulate at the site, raising the terrain elevation to facilitate the potential overtopping of the dam by subsequent debris flows. Once the debris flow scale surpasses the dam’s threshold capacity, in the HCA, this is depicted as a breach volume adequate for complete “dam-front filling”, with the surplus flow overflowing the “leveled” dam. Subsequently, the maximum length function determines the debris flow’s deposition pattern and extent of the flow. At this juncture, as the debris flow scale increases, so does its maximum length (Equation (10)), signifying its impact on more distant areas. However, a notable aspect is the triggered lateral expansion. With the escalation in breach volume, compared to Figure 9c, Figure 9d exhibits an elongation in breach length, and the debris flow’s “width” becomes more pronounced.
The experimental findings illustrate that the HCA model offers an appropriate depiction of this phenomenon and even conservatively predicts it to some degree.
5. Conclusions
This study presents a HCA numerical model specifically designed for simulating debris flows. In this framework, digital elevation model data are used to divide the terrain into hexagonal cell spaces and perform elevation interpolation. After debris flow simulations, the case inversion analysis confirms the model’s suitability.
- The hexagonal honeycomb network configuration closely resembles a circular shape compared to quadrilateral grid structures and demonstrates isotropy, guaranteeing uniform properties in all directions. This feature is beneficial for maintaining the model’s geometric and physical coherence during the simulation of complex terrain and flow dynamics.
- We compared the accuracy and efficiency of the IDW, bilinear, and cubic interpolation methods. The results show that cubic interpolation has the highest interpolation accuracy, and IDW interpolation accuracy is poor. When the lattice is finely divided, bilinear interpolation has obvious efficiency advantages over cubic interpolation. We recommend using bilinear or cubic interpolation methods as appropriate in the specific case.
- Building upon cellular automaton theory, transition rules define the process of debris flow. These transition rules focus on interactions among neighboring cells, avoiding the necessity of solving complex partial differential equations. The model utilizes the flow direction function, the sink-filling approach, the maximum length function, and the Monte Carlo iterative method to simulate the debris flow run-out extent, highlighting the model’s usefulness.
- The model has been applied to both simulate a water tank and replicate the Yohutagawa debris flow incident. In the -based evaluation framework, the values for the flume test simulation and the Yohutagawa debris flow incident are 0.5381 and 0.5642, respectively. These values represent improvements over the previous CA model’s values of 0.5054 and 0.5424. The score evaluation framework considers the varying impacts of missed judgments and misclassifications. The scores for the HCA model, 0.8488 and 0.8687, respectively, surpass those of the SCA model (0.8191 and 0. 8304) by 3.63% and 4.41%, respectively.
Author Contributions
Z.H. led the research program. Y.L. and N.J. designed the simulation. Q.F. and X.Z. wrote the manuscript. Z.H. and Y.M. reviewed and edited the manuscript. All authors have read and agreed to the published version of the manuscript.
Funding
This study was financially supported by the National Natural Science Foundation of China (Grant No. 52078493), the Natural Science Foundation of Hunan Province (Grant No. 2022JJ30700), the Natural Science Foundation for Excellent Young Scholars of Hunan (Grant No. 2021JJ20057), the Science and Technology Plan Project of Changsha (Grant No. kq2305006), and the Innovation Driven Program of Central South University (Grant No. 2023CXQD033). These financial supports are gratefully acknowledged.
Data Availability Statement
The raw data supporting the conclusions of this article will be made available by the authors upon request.
Conflicts of Interest
The authors declare no conflicts of interest.
References
- Froehlich, D.C. Peak flood discharge from a landslide dam outburst. Nat. Hazards Rev. 2022, 23, 04022001. [Google Scholar] [CrossRef]
- Barrocu, G.; Eslamian, S. Geomorphology and Flooding. In Flood Handbook; CRC Press: Boca Raton, FL, USA, 2022; pp. 23–54. [Google Scholar]
- Alagumalai, A.; Anvari, S.; Awad, M.M. Water: A global grand challenge and a path forward. In Solar-Driven Water Treatment; Academic Press: Cambridge, MA, USA, 2022; pp. 1–35. [Google Scholar]
- Zou, Q.; Cui, P.; Zhou, G.G.; Li, S.; Tang, J.; Li, S. A new approach to assessing vulnerability of mountain highways subject to debris flows in China. Prog. Phys. Geogr. Earth Environ. 2018, 42, 305–329. [Google Scholar] [CrossRef]
- Liu, L.; Chen, H. Research Status and Trend about Dynamics of Debris Flow. J. Chongqing Jiaotong Univ. (Nat. Sci.) 2010, 29, 233–239. (In Chinese) [Google Scholar]
- Cui, P.; Wei, F.; Xie, H.; Yang, K.; He, Y.; Ma, D. Debris Flow and Disaster Reduction Strategies in Western China. Quat. Sci. 2003, 02, 142–151. (In Chinese) [Google Scholar]
- Thouret, J.-C.; Antoine, S.; Magill, C.; Ollier, C. Lahars and debris flows: Characteristics and impacts. Earth-Sci. Rev. 2020, 201, 103003. [Google Scholar] [CrossRef]
- Song, D.; Zhou, G.G.; Xu, M.; Choi, C.E.; Li, S.; Zheng, Y. Quantitative analysis of debris-flow flexible barrier capacity from momentum and energy perspectives. Eng. Geol. 2019, 251, 81–92. [Google Scholar] [CrossRef]
- Adedeji, O.H.; Odufuwa, B.O.; Adebayo, O.H. Building capabilities for flood disaster and hazard preparedness and risk reduction in Nigeria: Need for spatial planning and land management. J. Sustain. Dev. Afr. 2012, 14, 45–58. [Google Scholar]
- Iverson, R.M.; George, D.L. A depth-averaged debris-flow model that includes the effects of evolving dilatancy. I. Physical basis. In Proceedings of the Royal Society a Mathematical, Physical and Engineering Sciences; Royal Society: London, UK, 2014; Volume 470, 17p. [Google Scholar]
- Jakob, M. Debris-flow hazard assessments: A practitioner’s view. Environ. Eng. Geosci. 2021, 27, 153–166. [Google Scholar] [CrossRef]
- Pastor, M.; Tayyebi, S.M.; Stickle, M.M.; Yagüe, Á.; Molinos, M.; Navas, P.; Manzanal, D. A depth integrated, coupled, two-phase model for debris flow propagation. Acta Geotech. 2021, 16, 2409–2433. [Google Scholar] [CrossRef]
- Du, J.; Fan, Z.-J.; Xu, W.-T.; Dong, L.-Y. Research progress of initial mechanism on debris flow and related discrimination methods: A review. Front. Earth Sci. 2021, 9, 629567. [Google Scholar] [CrossRef]
- Khan, S.M.; Shafi, I.; Butt, W.H.; Diez, I.D.L.T.; Flores, M.A.L.; Galán, J.C.; Ashraf, I. A systematic review of disaster management systems: Approaches, challenges, and future directions. Land 2023, 12, 1514. [Google Scholar] [CrossRef]
- Kim, S.D.; Ahn, K.; Lee, H. Mathematical modeling of soil mixture flow surge and its application to coastal area. Mar. Georesources Geotechnol. 2017, 35, 610–620. [Google Scholar] [CrossRef]
- Ouyang, C.; He, S.; Tang, C. Numerical analysis of dynamics of debris flow over erodible beds in Wenchuan earthquake-induced area. Eng. Geol. 2015, 194, 62–72. [Google Scholar] [CrossRef]
- Kefayati, G.; Tolooiyan, A.; Dyson, A.P. Finite difference lattice Boltzmann method for modeling dam break debris flows. Phys. Fluids 2023, 35, 013102. [Google Scholar] [CrossRef]
- Han, Z.; Li, M.; Li, Y.; Zhao, M.; Li, C.; Xie, W.; Ding, H.; Ma, Y. An Integrated Approach for Simulating Debris-Flow Dynamic Process Embedded with Physically Based Initiation and Entrainment Models. Water 2023, 15, 1592. [Google Scholar] [CrossRef]
- Dai, Z.; Huang, Y.; Cheng, H.; Xu, Q. SPH model for fluid–structure interaction and its application to debris flow impact estimation. Landslides 2017, 14, 917–928. [Google Scholar] [CrossRef]
- Han, Z.; Su, B.; Li, Y.; Wang, W.; Wang, W.; Huang, J.; Chen, G. Numerical simulation of debris-flow behavior based on the SPH method incorporating the Herschel-Bulkley-Papanastasiou rheology model. Eng. Geol. 2019, 255, 26–36. [Google Scholar] [CrossRef]
- Liu, C.; Liang, L. A coupled SPH–DEM–FEM approach for modeling of debris flow impacts on flexible barriers. Arab. J. Geosci. 2022, 15, 420. [Google Scholar] [CrossRef]
- Choi, S.-K.; Park, J.-Y.; Lee, D.-H.; Lee, S.-R.; Kim, Y.-T.; Kwon, T.-H. Assessment of barrier location effect on debris flow based on smoothed particle hydrodynamics (SPH) simulation on 3D terrains. Landslides 2021, 18, 217–234. [Google Scholar] [CrossRef]
- Kafle, J. Dynamic Interaction between a Two-Phase Submarine Landslide and a Fluid Reservoir. Ph.D. Thesis, Kathmandu University, Dhulikhel, Nepal, 2014. [Google Scholar]
- Overton, D.E.; Meadows, M.E. Stormwater Modeling; Elsevier: Amsterdam, The Netherlands, 2013. [Google Scholar]
- Pitilakis, K.; Crowley, H.; Kaynia, A.M. SYNER-G: Typology definition and fragility functions for physical elements at seismic risk. Geotech. Geol. Earthq. Eng. 2014, 27, 1–28. [Google Scholar]
- Carrara, A.; Crosta, G.; Frattini, P. Comparing models of debris-flow susceptibility in the alpine environment. Geomorphology 2008, 94, 353–378. [Google Scholar] [CrossRef]
- Liu, X.; Lei, J. A method for assessing regional debris flow risk: An application in Zhaotong of Yunnan province (SW China). Geomorphology 2003, 52, 181–191. [Google Scholar] [CrossRef]
- Wolfram, S. Statistical mechanics of cellular automata. Rev. Mod. Phys. 1983, 55, 601. [Google Scholar] [CrossRef]
- Chopard, B.; Droz, M. Cellular automata. Model. Phys. 1998, 1, 11–20. [Google Scholar]
- Vichniac, G.Y. Simulating physics with cellular automata. Phys. D Nonlinear Phenom. 1984, 10, 96–116. [Google Scholar] [CrossRef]
- Avolio, M.V.; Errera, A.; Lupiano, V.; Mazzanti, P.; Di Gregorio, S. VALANCA: A Cellular Automata Model for Simulating Snow Avalanches. J. Cell. Autom. 2017, 12, 309–330. [Google Scholar]
- Liucci, L.; Melelli, L.; Suteanu, C.; Ponziani, F. The role of topography in the scaling distribution of landslide areas: A cellular automata modeling approach. Geomorphology 2017, 290, 236–249. [Google Scholar] [CrossRef]
- Zhong, G.; Zhai, G.; Chen, W. Evacuation simulation of multi-story buildings during earthquakes based on improved cellular automata model. J. Asian Archit. Build. Eng. 2023, 22, 1007–1027. [Google Scholar] [CrossRef]
- Xie, J.; Zhang, L. Application of cellular automata with improved dynamic analysis in evacuation management of sports events. J. Sens. 2022, 2022, 8782865. [Google Scholar] [CrossRef]
- Byun, G.; No, W.; Park, C.; Lee, H.-K.; Kim, Y. Predicting the Potential of Rainfall Disaster Risk using Cellular Automata in Small Urban Declining Areas. KIEAE J. 2022, 22, 29–35. [Google Scholar] [CrossRef]
- Gamma, P. Dwalk-Ein Murgang-Simulationsprogramm zur Gefahrenzonierung; Geographisches Institut der Universität Bern: Bern, Switzerland, 2000. [Google Scholar]
- Horton, P.; Jaboyedoff, M.; Rudaz, B.E.A.; Zimmermann, M. Flow-R, a model for susceptibility mapping of debris flows and other gravitational hazards at a regional scale. Nat. Hazards Earth Syst. Sci. 2013, 13, 869–885. [Google Scholar] [CrossRef]
- Chiari, M.; Scheidl, C. Application of a new cellular model for bedload transporting extreme events at steep slopes. Geomorphology 2015, 246, 413–419. [Google Scholar] [CrossRef]
- Gregoretti, C.; Degetto, M.; Boreggio, M. GIS-based cell model for simulating debris flow runout on a fan. J. Hydrol. 2016, 534, 326–340. [Google Scholar] [CrossRef]
- Prochaska, A.B.; Santi, P.M.; Higgins, J.D.; Cannon, S.H. Debris-flow runout predictions based on the average channel slope (ACS). Eng. Geol. 2008, 98, 29–40. [Google Scholar] [CrossRef]
- Scheidl, C.; Rickenmann, D. Empirical prediction of debris-flow mobility and deposition on fans. Earth Surf. Process. Landf. J. Br. Geomorphol. Res. Group 2010, 35, 157–173. [Google Scholar] [CrossRef]
- Han, Z.; Li, Y.; Huang, J.; Chen, G.; Xu, L.; Tang, C.; Zhang, H.; Shang, Y. Numerical simulation for run-out extent of debris flows using an improved cellular automaton model. Bull. Eng. Geol. Environ. 2017, 76, 961–974. [Google Scholar] [CrossRef]
- Ma, Y.; Han, Z.; Li, Y.; Chen, G.; Wang, W.; Chen, N.; Hu, G.; Zhao, L.; Dou, J. Robustness evaluation of the probability-based HTCA model for simulating debris-flow run-out extent: Case study of the 2010 Hongchun event, China. Eng. Geol. 2023, 312, 106918. [Google Scholar] [CrossRef]
- Wolfram, S. Cellular automaton fluids 1: Basic theory. In Lattice Gas Methods for Partial Differential Equations; CRC Press: Boca Raton, FL, USA, 2019; pp. 19–74. [Google Scholar]
- de Sousa, L.; Nery, F.; Sousa, R.; Matos, J. Assessing the accuracy of hexagonal versus square tilled grids in preserving DEM surface flow directions. In Proceedings of the 7th International Symposium on Spatial Accuracy Assessment in Natural Resources and Environmental Sciences, Lisbon, Portugal, 5–7 July 2006. [Google Scholar]
- Frisch, U.; Hasslacher, B.; Pomeau, Y. Lattice-gas automata for the Navier-Stokes equation. In Lattice Gas Methods for Partial Differential Equations; CRC Press: Boca Raton, FL, USA, 2019; pp. 11–18. [Google Scholar]
- D’Ambrosio, D.; Di Gregorio, S.; Iovine, G. Simulating debris flows through a hexagonal cellular automata model: Sciddica s 3–hex. Nat. Hazards Earth Syst. Sci. 2003, 3, 545–559. [Google Scholar] [CrossRef]
- Avolio, M.V.; Di Gregorio, S.; Lupiano, V.; Mazzanti, P. SCIDDICA-SS 3: A new version of cellular automata model for simulating fast moving landslides. J. Supercomput. 2013, 65, 682–696. [Google Scholar] [CrossRef]
- Mersereau, R.M. The processing of hexagonally sampled two-dimensional signals. Proc. IEEE 1979, 67, 930–949. [Google Scholar] [CrossRef]
- Gallant, J.C.; Wilson, J.P. TAPES-G: A grid-based terrain analysis program for the environmental sciences. Comput. Geosci. 1996, 22, 713–722. [Google Scholar] [CrossRef]
- Wichmann, V. The Gravitational Process Path (GPP) model (v1.0)—A GIS-based simulation framework for gravitational processes. Geosci. Model Dev. 2017, 10, 3309–3327. [Google Scholar] [CrossRef]
- Wang, Y. Rheological properties and migration characteristics of debris fluids. Mt. Res. 2015, 04, 472. (In Chinese) [Google Scholar]
- Liu, J.; Ou, G.; You, Y. Experimental Study of Fan Development Process of Viscous Debris Flow. J. Catastrophology 2012, 02, 13–18. (In Chinese) [Google Scholar]
- Zhang, Y.; Ge, T.; Tian, W.; Liou, Y.-A. Debris flow susceptibility mapping using machine-learning techniques in Shigatse area, China. Remote Sens. 2019, 11, 2801. [Google Scholar] [CrossRef]
Disclaimer/Publisher’s Note: The statements, opinions and data contained in all publications are solely those of the individual author(s) and contributor(s) and not of MDPI and/or the editor(s). MDPI and/or the editor(s) disclaim responsibility for any injury to people or property resulting from any ideas, methods, instructions or products referred to in the content. |
© 2024 by the authors. Licensee MDPI, Basel, Switzerland. This article is an open access article distributed under the terms and conditions of the Creative Commons Attribution (CC BY) license (https://creativecommons.org/licenses/by/4.0/).