Abstract
Coal mining has a certain influence on and causes disturbances in groundwater. To investigate the variation trend of groundwater around the open-pit mine in grassland area, taking Shengli No. 1 open-pit mine as an example, the impact and variation trend of groundwater level in Quaternary aquifer around the mine area was studied by using the data of hydrological monitoring wells. The results show that the water level around the mining area varies from one year to the next. Since 2008, the water level has experienced a process of reduction, stability and increase. Compared with the background water level value, the current water level of each monitoring well is lower than the background water level. The influence radius calculated by Kusakin formula ranges from 94.15 m to 906.80 m, and the aquifer is heterogeneous. On the basis of the correlations between changes in waterline in monitoring wells and the stope distance, the disturbance radius of open-pit mining on surrounding diving water in grassland area is less than 2000 m. Based on the comprehensive analysis of the alteration of diving waterline and its influencing factors, the main factors affecting the variation in the phreatic water level are atmospheric precipitation, evaporation, groundwater usage and dewatering water. All factors act on the diversification of diving water level synthetically. The internal waste dump of an open-pit mine has a positive effect on the surrounding groundwater recovery. The aim of this study is to reveal the impact of open-pit mining on surrounding groundwater and providing scientific basis for future mining in other open-pit mines.
1. Introduction
The three major themes of coal mining are safety, efficiency and greenness. Coal safety and high-efficiency mining in some mining areas in China have reached the world-leading level, but there are still deficiencies in green mining [1,2]. The impression of coal mining on underground water resources is one of the current problems [3]; whether it is in the form of standard mining or open-pit coal mining, it will affect and disturb the surrounding groundwater [4]. In learning the links between coal mining and groundwater changes, previous studies on the changes in groundwater flow field [5,6,7,8], groundwater loss paths [9,10], groundwater environmental impacts and evaluations [11,12,13,14,15,16], degradation of groundwater quality [17,18,19], the hydrochemical evolution of underground water [20,21], damage mechanisms [22] and other aspects have been studied in depth. Using the research methods, researchers have mainly analyzed hydrogeological conditions, hydrological hole observation, pumping tests, numerical simulation, etc. [23,24,25,26,27]. Underground coal mining will form a groundwater funnel [28,29], which will have a certain impact on the surrounding groundwater level. In recent years, machine learning models such as nonlinear autoregressive neural networks, random forests, and xgboost have provided new ideas related to the study of groundwater level dynamics [30,31]. The effect range of open-pit mining on the surrounding groundwater, and the recovery law of groundwater before, during and after mining are in need of further study [32].
This paper, which focuses on the Quaternary diving aquifer around the Nortel Shengli Open-pit Coal Mine, comprehensively utilizes years of hydrological monitoring well data, atmospheric precipitation data, and other data to explore the relationship and impact of open-pit mining and the surrounding groundwater changes. Based on previous hydrological data, a comparison of the waterline background of the eastern part of the mine in 1988 is established. In addition, using the data of hydrological monitoring wells for 10 years, the trend of diving water levels around the mining area is analyzed and studied. A comprehensive analysis of a variety of influencing factors, including the change in the surrounding groundwater during the operation of the open-pit mine and the radius of influence on underground water, is obtained.
2. Materials and Methods
2.1. Study Area
Nortel Shengli Open-pit Mine is in Xilingol League, Inner Mongolia. The region has a subarid prairie climate, with severely cold winters and hot summers. According to meteorological data from 1952 to the present, the annual precipitation has been far lower than the annual evaporation. The sources of Quaternary diving replenishment around the mining area are composed of atmospheric precipitation, lateral recharge of Xilin River water, melting ice and snow, atmospheric condensate, and groundwater runoff. The main drainage methods are completed by diving evaporation, plant transpiration, groundwater runoff, and artificial drainage (draining water from open-pit mines).
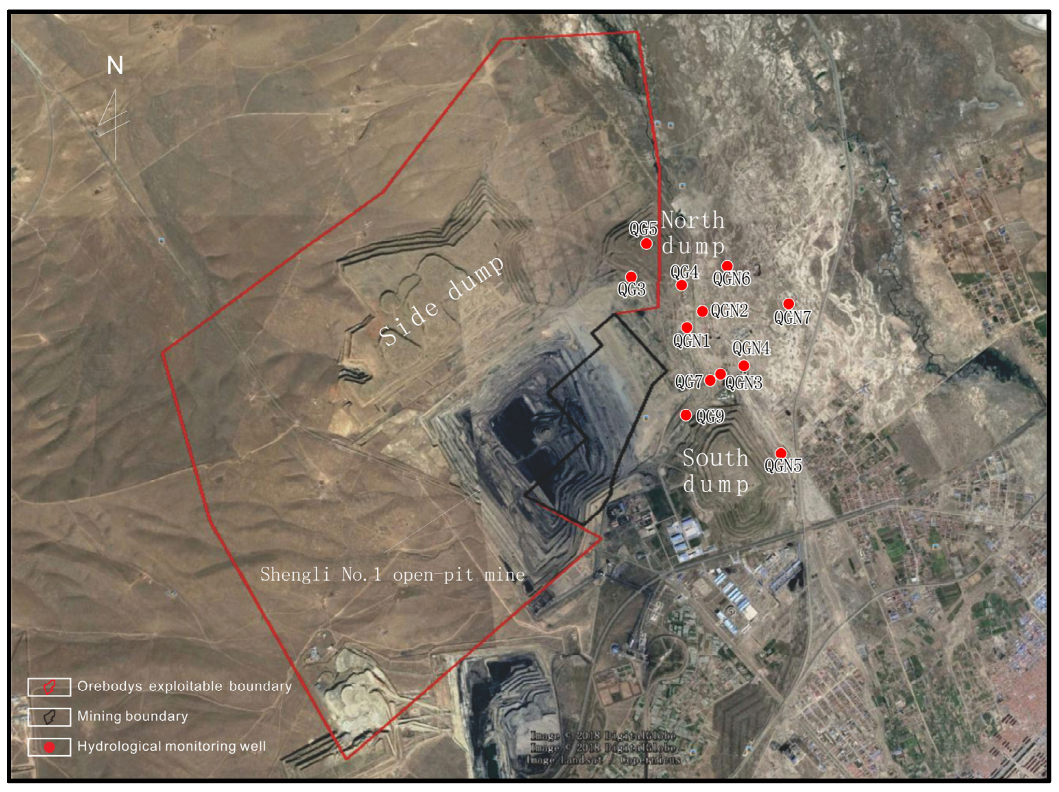
The Shengli No. 1 open-pit mine is situated 6 km north of Xilinhot, with an average length of 6.84 km from east to west and an average width of 5.43 km from north to south (Figure 1). This open-pit mine was built in 1974 and was put into production in December 1979. When it was put into production, the production capacity was 0.15 Mt/a, and in 1992 it reached a design capacity of 0.3 Mt/a. In 2004, the mining pit was 1.2 km long, with an average width of 0.3 km and an annual production capacity of 0.3 Mt/a. In 2005, Shenhua Nortel Shengli Energy Co., Ltd. took over and began large-scale development. In 2006, the National Development and Reform Commission approved the construction of a large-scale open-pit coal mine with a size of 20 Mt/a and began mass open-pit coal mining.

Figure 1.
Location map of the study area.
The coal-bearing stratum of Shengli No. 1 Open-pit Mine is the Cretaceous Shengli Formation, and the main recoverable coal seams are 5 coal seams and 6 coal seams. The 5 coal seams are 0.10–36.52 m thick throughout the area, and the average thickness is 16.27 m. No. 6 coal is the first main retractable coal seam, with a layer thickness of 0.40–95.47 m and an average thickness of 33.42 m. At present, the open-pit mine is about 2.35 km long from east to west and 2.65 km wide from north to south. There are two dumping sites in the east and south, in addition to the dumping sites located in the north. On behalf of monitoring the influence of open-pit mining on groundwater, 12 hydrological monitoring wells have been deployed in the east since 2008 to continuously monitor the underground waterline (Figure 1).
2.2. Hydrogeological Features
There are four aquifers in Shengli No. 1 open-pit mining area, namely the Quaternary pore diving unconfined aquifer; the fractured pore confined aquifer in the upper 5 coal conglomerate sections [33]; the 5 coal fractured confined aquifers; the 6 coal fractured artesian confined aquifers (Table 1). The key lithology of the Quaternary unconfined aquifer is fine sandstone, conglomerate, mudstone, clay, etc. The aquifer’s thickness is normally 2–16 m, and the maximum thickness is 63.27 m. The aquifer gradually thickens from west to east and from north to south. It becomes thicker: the permeability coefficient is 1.145–27.31 m/d, the unit water afflux is 0.3462–1.8954 L/m*s, and the water richness decreases from east to west.

Table 1.
Stratigraphic column of the hydrogeology in the study area.
The aquifer lithology in the rock section is mainly gray-green, gray-brown, and gray conglomerate [34], with coarse sandstone, fine quar, and mudstone interposed. The thickness of the aquifer varies greatly: the average thickness is 14.99 m and the maximum thickness is 58.65 m. The unit gushing water volume is 0.0085–0.056 L/m*s, the infiltration coefficient is 0.1982–0.902 m/d, and the water richness is average. The 5 coal seams mainly exhibit aqueous lithology, with a mixed thin layer of fine sand, sandy shale and the like, and the average thickness is 16.27 m. The coal seam has joints and cracks, and the local coal seam is lumpy and fragmentary. The unit gushing water is 0.0823–0.6068 L/m*s, the infiltration coefficient is 0.15–3.874 m/d, and the water richness is weak–medium.
The 6 coal seam mainly exhibits aqueous lithology, with a mixed thin layer of fine sand, shale, sandy shale and the like. Coal seam cracks are unevenly developed in the plane and vertical direction [35], and local coal seams leak. The unit water inrush is 0.00015–0.3434 L/m*s and the permeability coefficient is 0.00031–1.617 m/d. There is uneven water richness: the water is generally richer in the northwest but poorly aqueous in the east.
A stable aquifer is basically developed between the four aquifers. The lithology is mainly mudstone, sandy mudstone and siltstone. Groundwater recharge, runoff, and drainage conditions in the study area were observed. Quaternary unconfined aquifer recharge consists of atmospheric precipitation, lateral recharge of the Xilin River water, ice and snow melting water, atmospheric condensate water, and groundwater runoff, of which atmospheric precipitation is the main source. The aquifer, 5 coal and 6 coal aquifers in the conglomerate section are mainly recharged by atmospheric rainfall through the infiltration of the aquifer’s hidden outcrops and the weak sections of the aquifer.
2.3. Methods
The target layer of this study is the Quaternary submerged aquifer, which has the most direct impact on the ecology around the mining area due to the changes in the groundwater of this aquifer. The adopted research methodology uses past hydrological data to establish the water level background value on the one hand, and Kusakin’s formula to calculate the radius of influence on the other.
For the opencast mining rock above each peeling seam, after excavating soil and rock formations, the original water stored in the aquifer will be lost in the thinning process of drying. The influence radius can be calculated using the Kusakin formula [36]. The calculation formula is as follows:
where R is a radius of influence (m); S is the water level drop value (m); H is the aquifer’s average thickness; there is an aquifer permeability coefficient of K (m/d).
In addition, the data obtained from a hydrological monitoring well over a period of 10 years were used to analyze and study the changing law of diving water level in the quaternary aquifer around the mine area. The water level of the hydrological borehole was monitored using OTT water level monitor, via a probe submerged to the level of the liquid surface, which was 20 m, and remote transmission was used for monitoring. The principle of borehole deployment is mainly to monitor the inner discharge site (QG7), the periphery of the outer discharge site (QG3, 4, 5, 9, QGN5), the original stratum around the mine (QGN1, 2, 3, 4, 6) and the periphery of the river channel (QGN7). The dredging water in the production process of the open-pit mine has a certain influence on the surrounding groundwater. Combined with the production of the open-pit mine, we analyze the relationship between the amount of dredging water in the open-pit mine over the years and the change in the water level of the Quaternary aquifer. There are more factors affecting the change in groundwater level, and atmospheric precipitation is the main recharge source of the Quaternary aquifer, in addition to the expansion and development of the city, the increase in the scale of animal husbandry, and the irrigation of agricultural and pastoral industries, all of which will affect the water content of the groundwater. In this study, a variety of factors were considered simultaneously, and the intrinsic connection between the temporal changes of each factor and the changes in the groundwater level was comprehensively analyzed.
3. Results
3.1. Influence Radius
Pumping tests were carried out on several hydrological holes in the eastern mine. The permeability coefficient K and the water level drop value S are shown in Table 2. According to multiple borehole data, the average thickness of the Quaternary aquifer in the eastern mine is about 20 m. The influence radius R (m) calculated by the Kusakin formula is shown in Table 2. The distribution range of the influence radius value is 94.15 m to 906.80 m. Calculated from the radius of influence of different data look drilling, there is a certain heterogeneity Quaternary aquifer; the calculated radius of influence also differs greatly.
Table 2.
The data table of radius of influence.
During the open-pit mining process, the aquifers around the stope are continuously drained to form a groundwater funnel centered on the stope. The influence radius calculated by the Kusakin formula cannot fully reflect the disturbance radius of the open-pit mining to the surrounding groundwater. Theoretically, the smaller the distance from the stope boundary is, the lower the monitoring well waterline is, and the greater influence of the dredging water is. Affected by the heterogeneity of the aquifer, some monitoring wells may not conform to this law. Taking the change in the waterline of a single well as an indicator, comparing the change in the waterline of a single well with different distances from the stope under certain conditions can reflect the radius of disturbance of groundwater under this condition.
3.2. Comparison of Background Water Level and Current Water Level
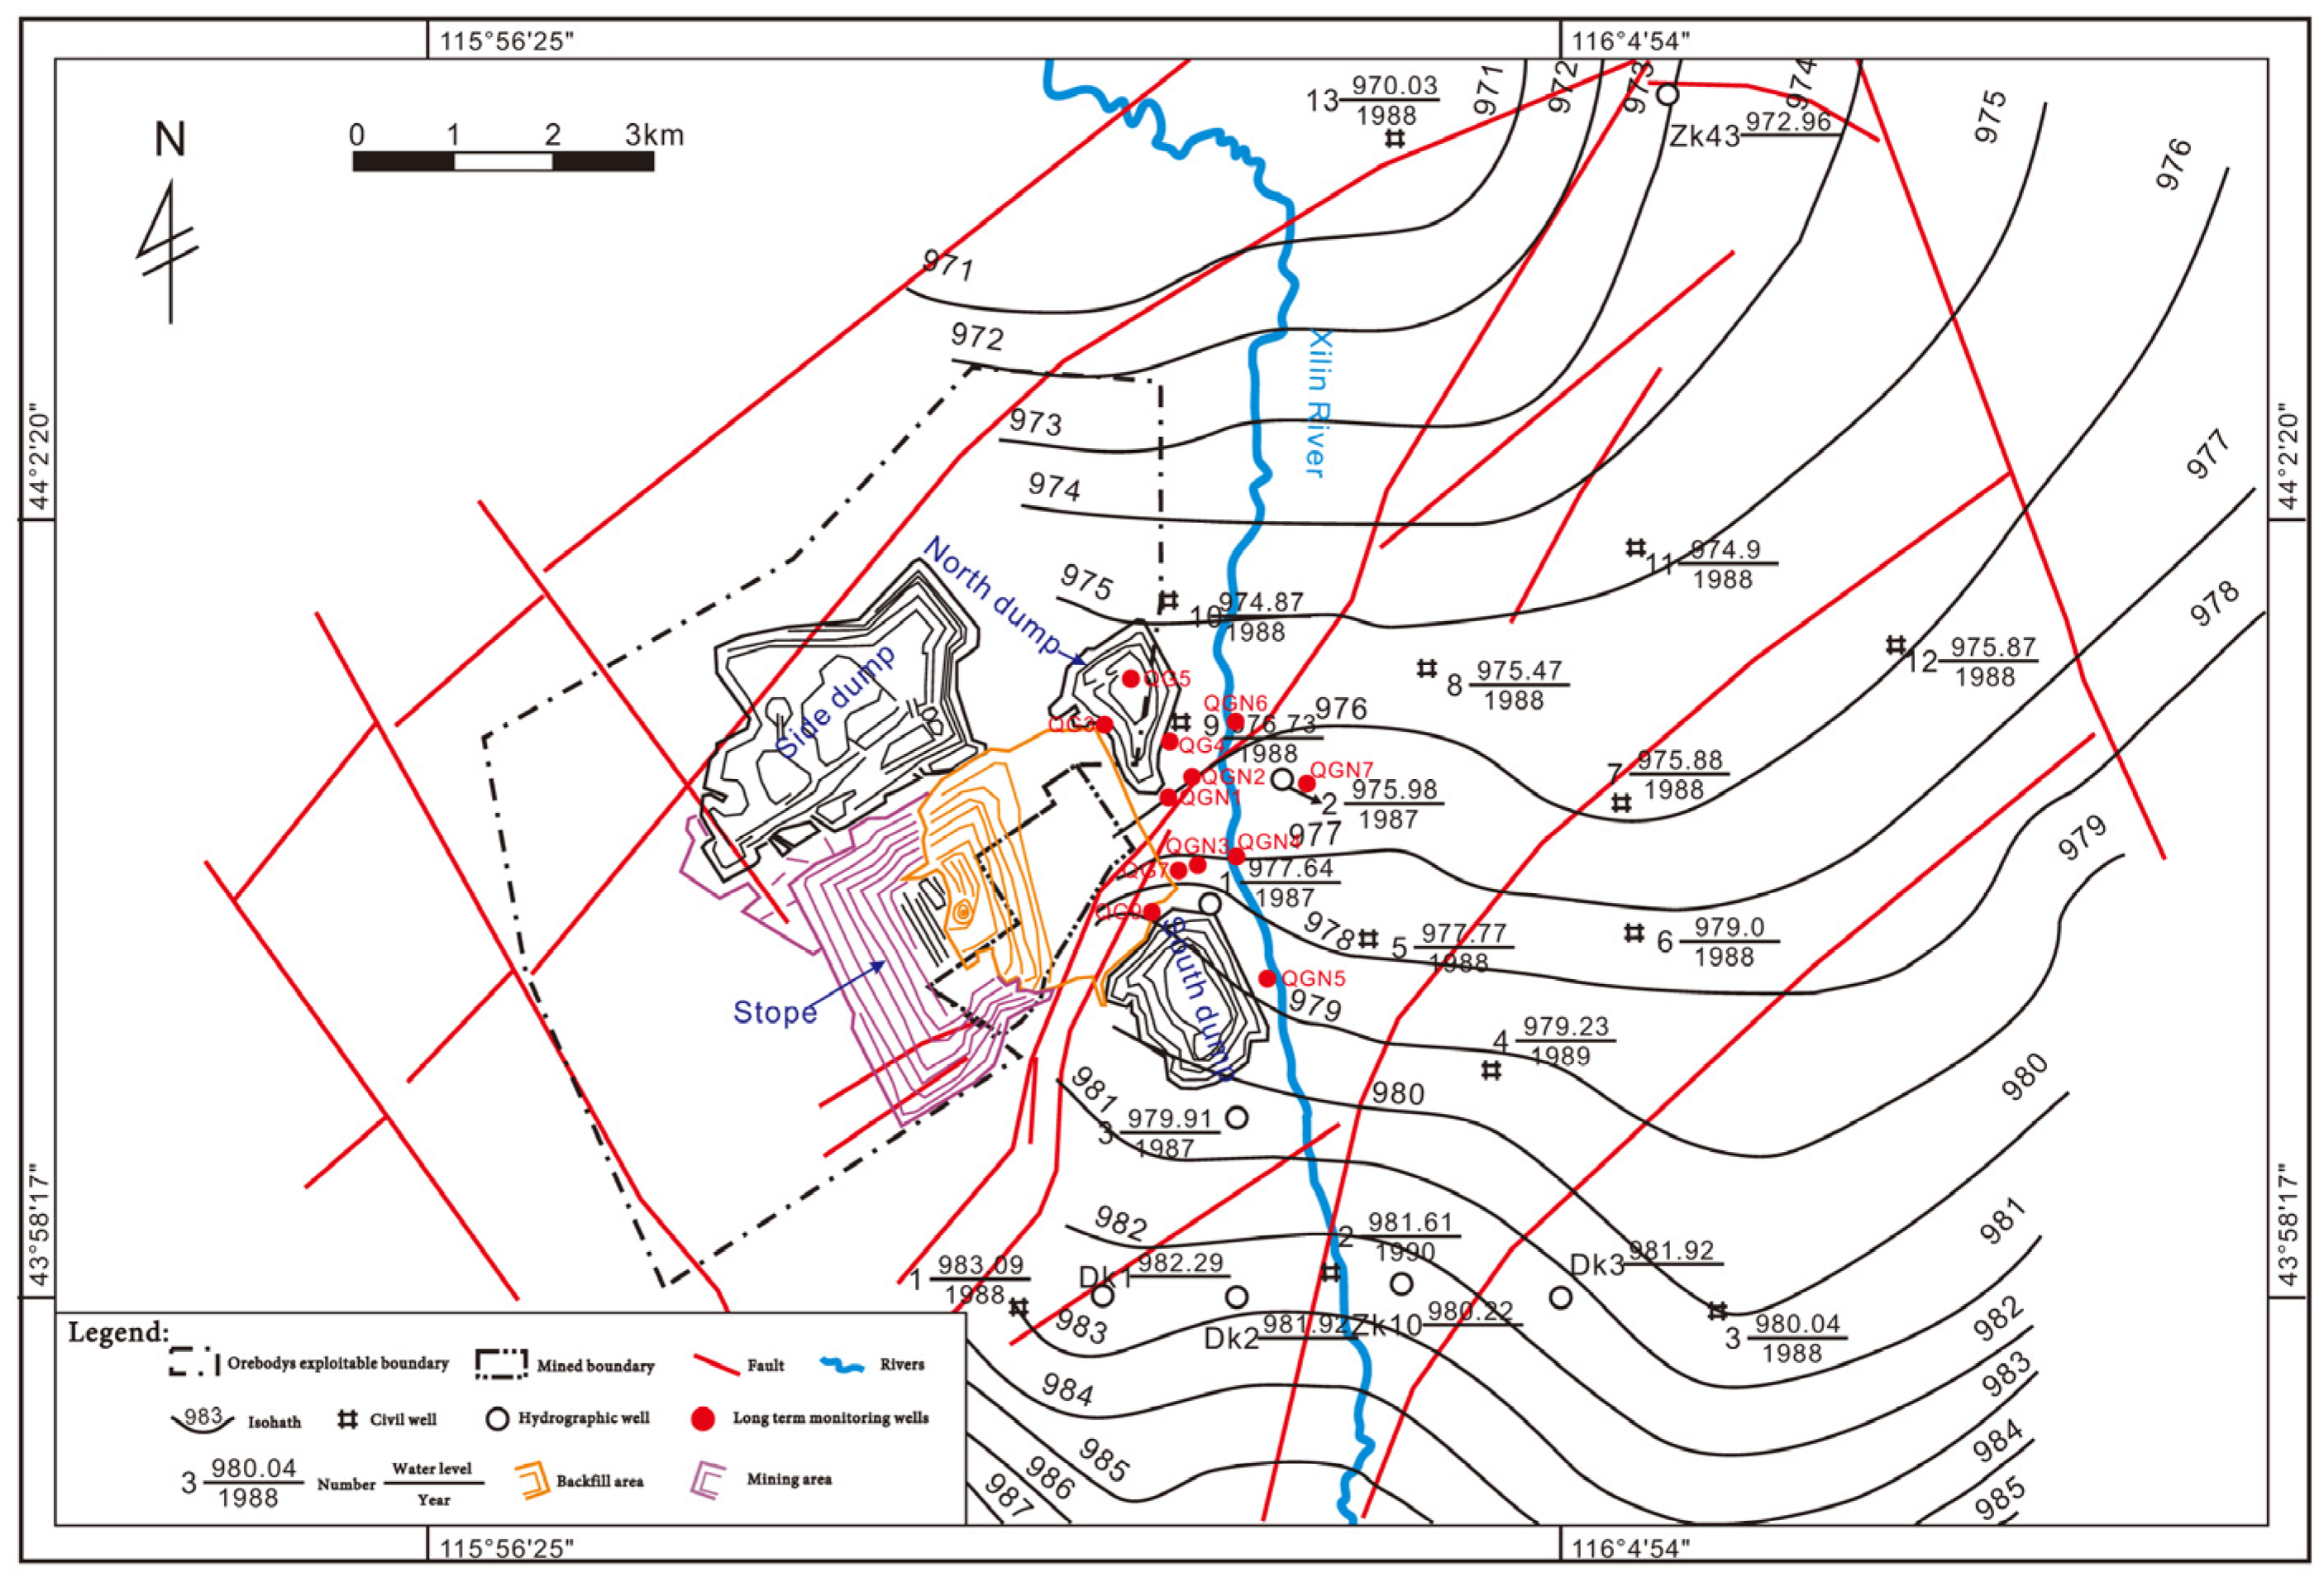
The predecessor of Shengli’s No. 1 open-pit mine is the Hongqi open-pit mine. The open-pit mine was built in 1974 and put into production in December 1979. When it was put into production, the production capacity was 0.15 Mt/a, and in 1992 it reached a design capacity of 0.3 Mt/a. Based on the groundwater level data in the eastern mine surveyed from 1987 to 1990, a quaternary aquifer and other water-level map was drawn. The water level in this map represents the background value before the large-scale mining of Shengli’s No. 1 open-pit mine (Figure 2). Most of the water level data are from the well data obtained in 1988 and 1989. The groundwater level in the eastern part of the open-pit mine gradually decreased from south to north, the water level elevation dropped from 987 m to about 971 m, and the groundwater level around the stope was between 981 m and 975 m. The runoff direction of the Quaternary aquifer is from south to north, which is basically the same as that of the Xilin River.

Figure 2.
The waterline map of dive in the Quaternary System around the coal mine in 1988.
At present, the general trend of the groundwater level in the east of the open-pit mine is gradually decreasing from south to north, and the water level elevation has dropped from 975 m to about 970 m. Compared with the background value, the waterline of the quaternary aquifer has decreased. Compared with the background value, the current water level near the stope has decreased by about 4–6 m, and the water level in the northern mine has decreased slightly.
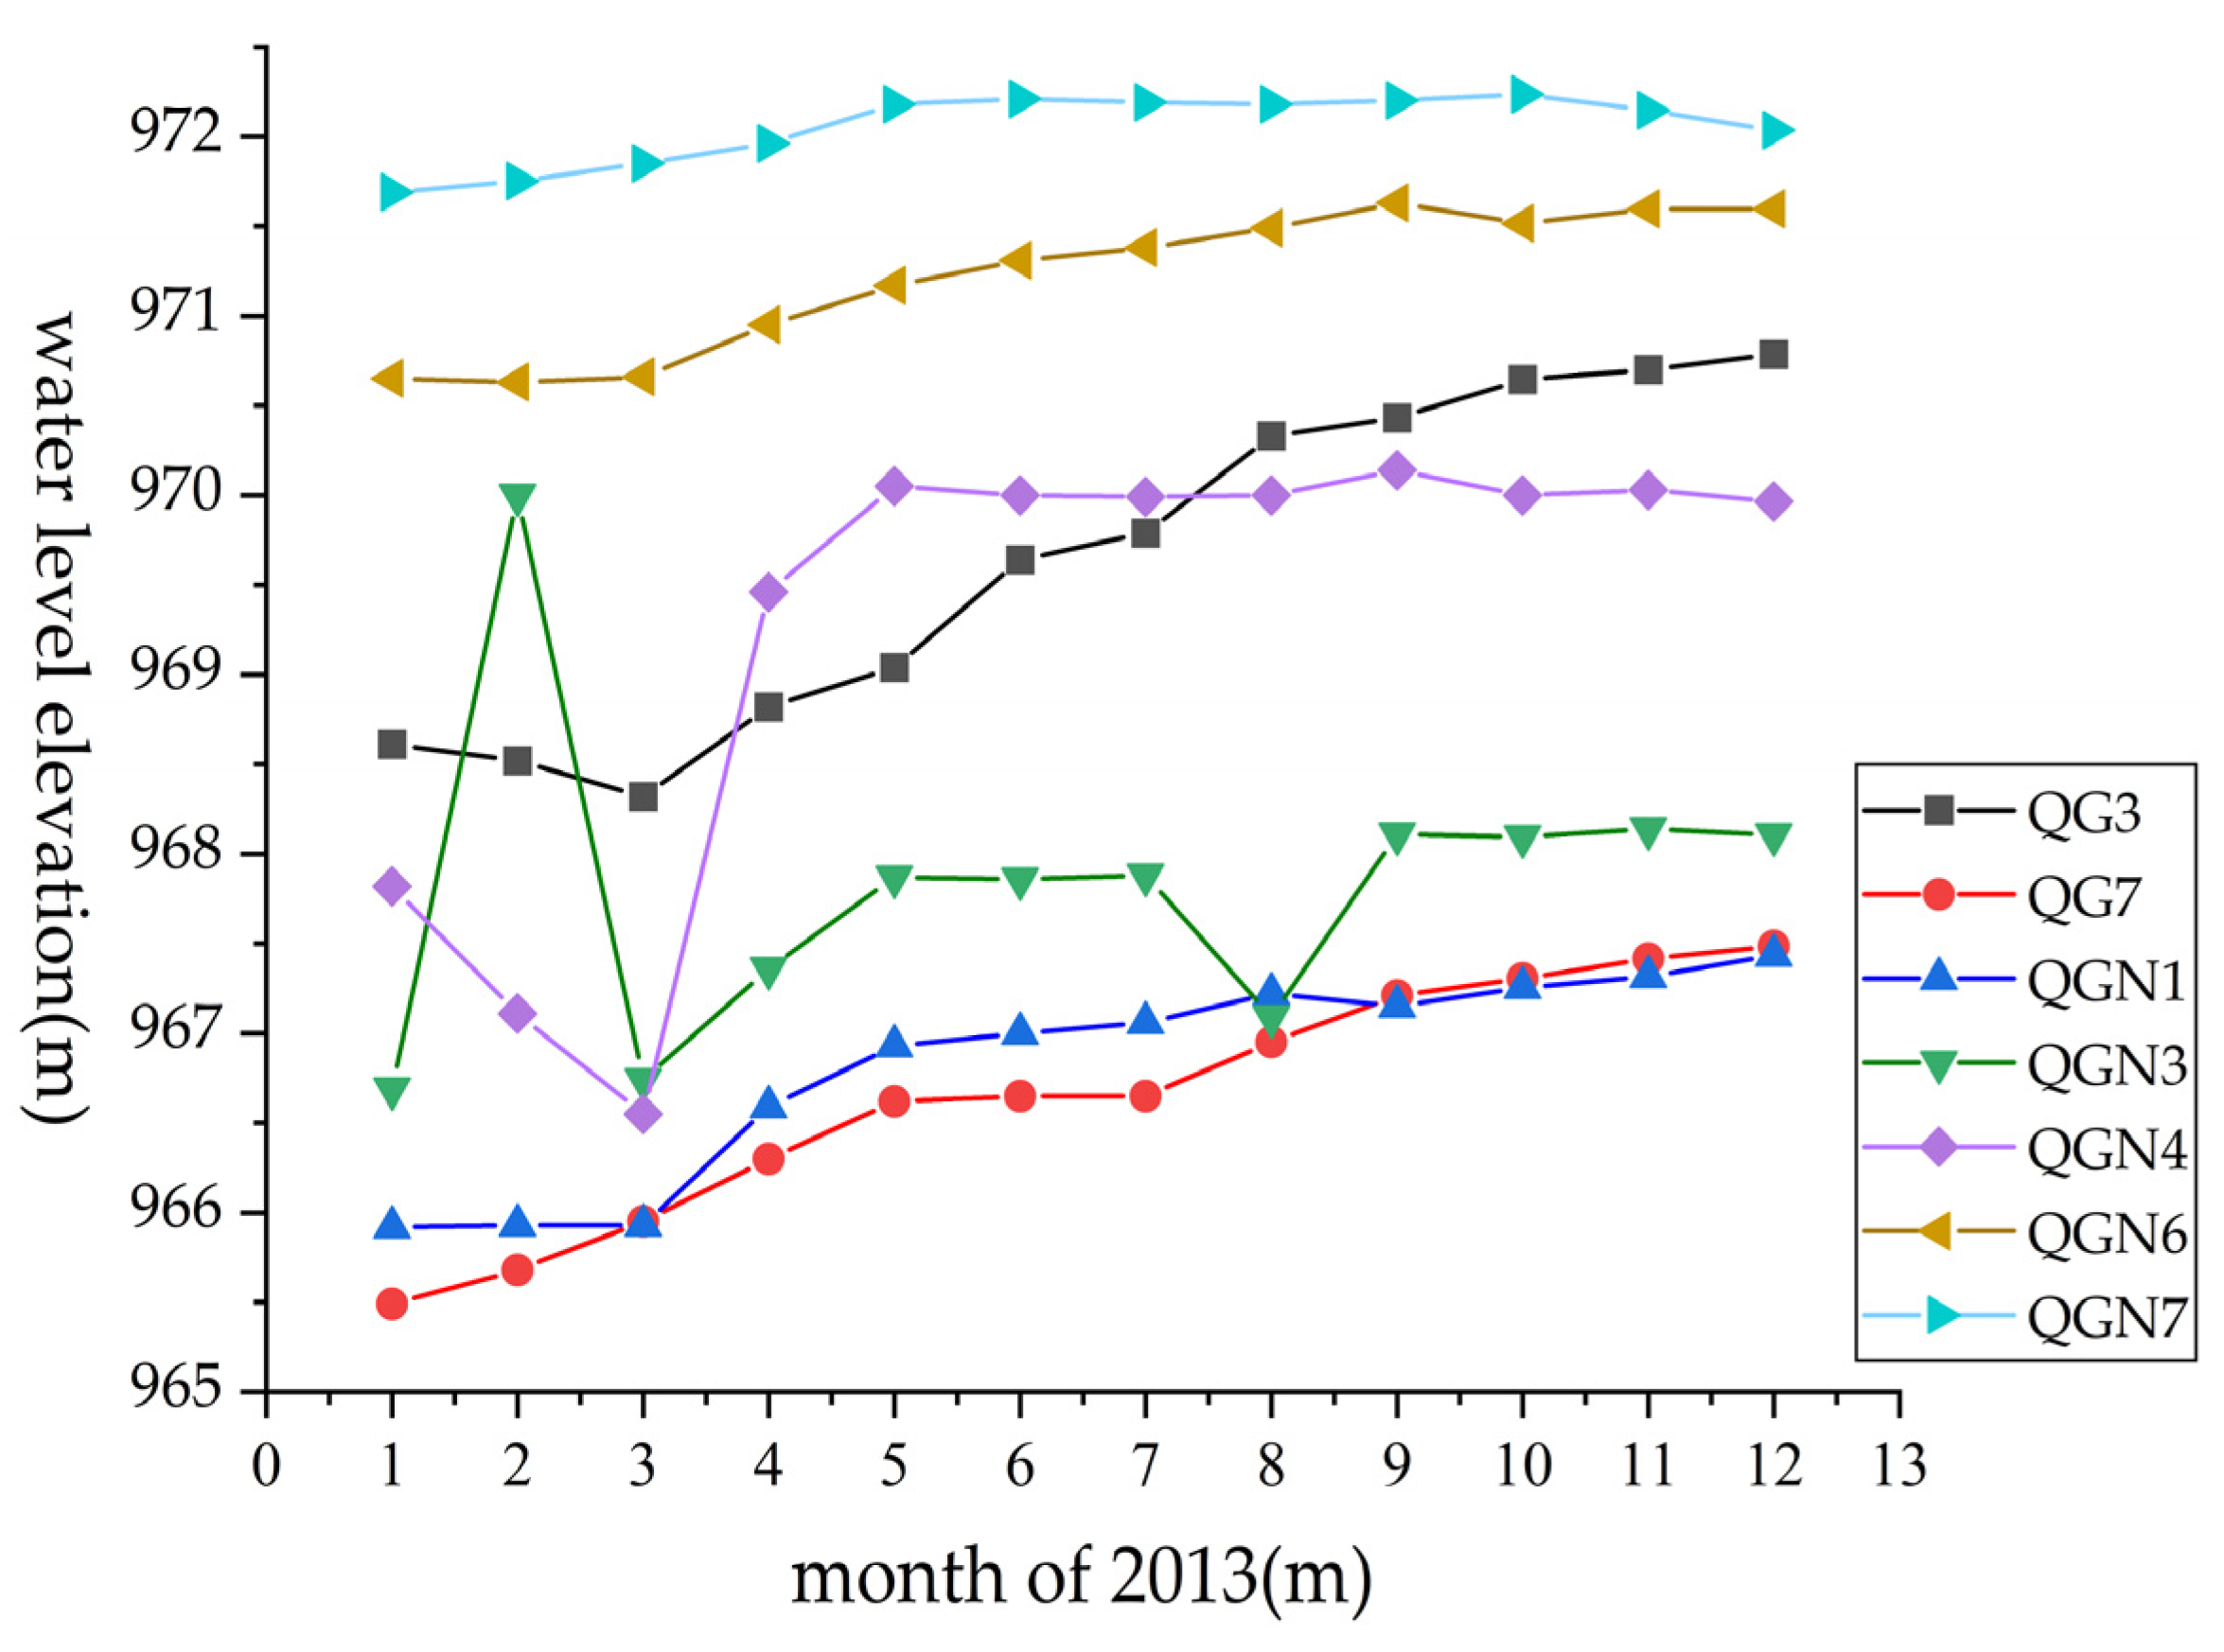
For each year, the magnitude of the change of water level monitoring wells shows some differences. The smallest change in amplitude is 0.54 m, while the maximum change in the magnitude is 3.59 m, and there is an average water level fluctuation amplitude of 2.06 m. The maximum water level of the dive appears about 3 months after the maximum rainfall, with a certain lag (Figure 3).
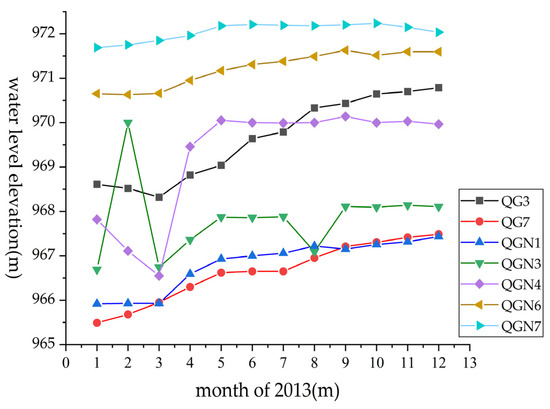
Figure 3.
The waterline change of monitoring wells in 2013.
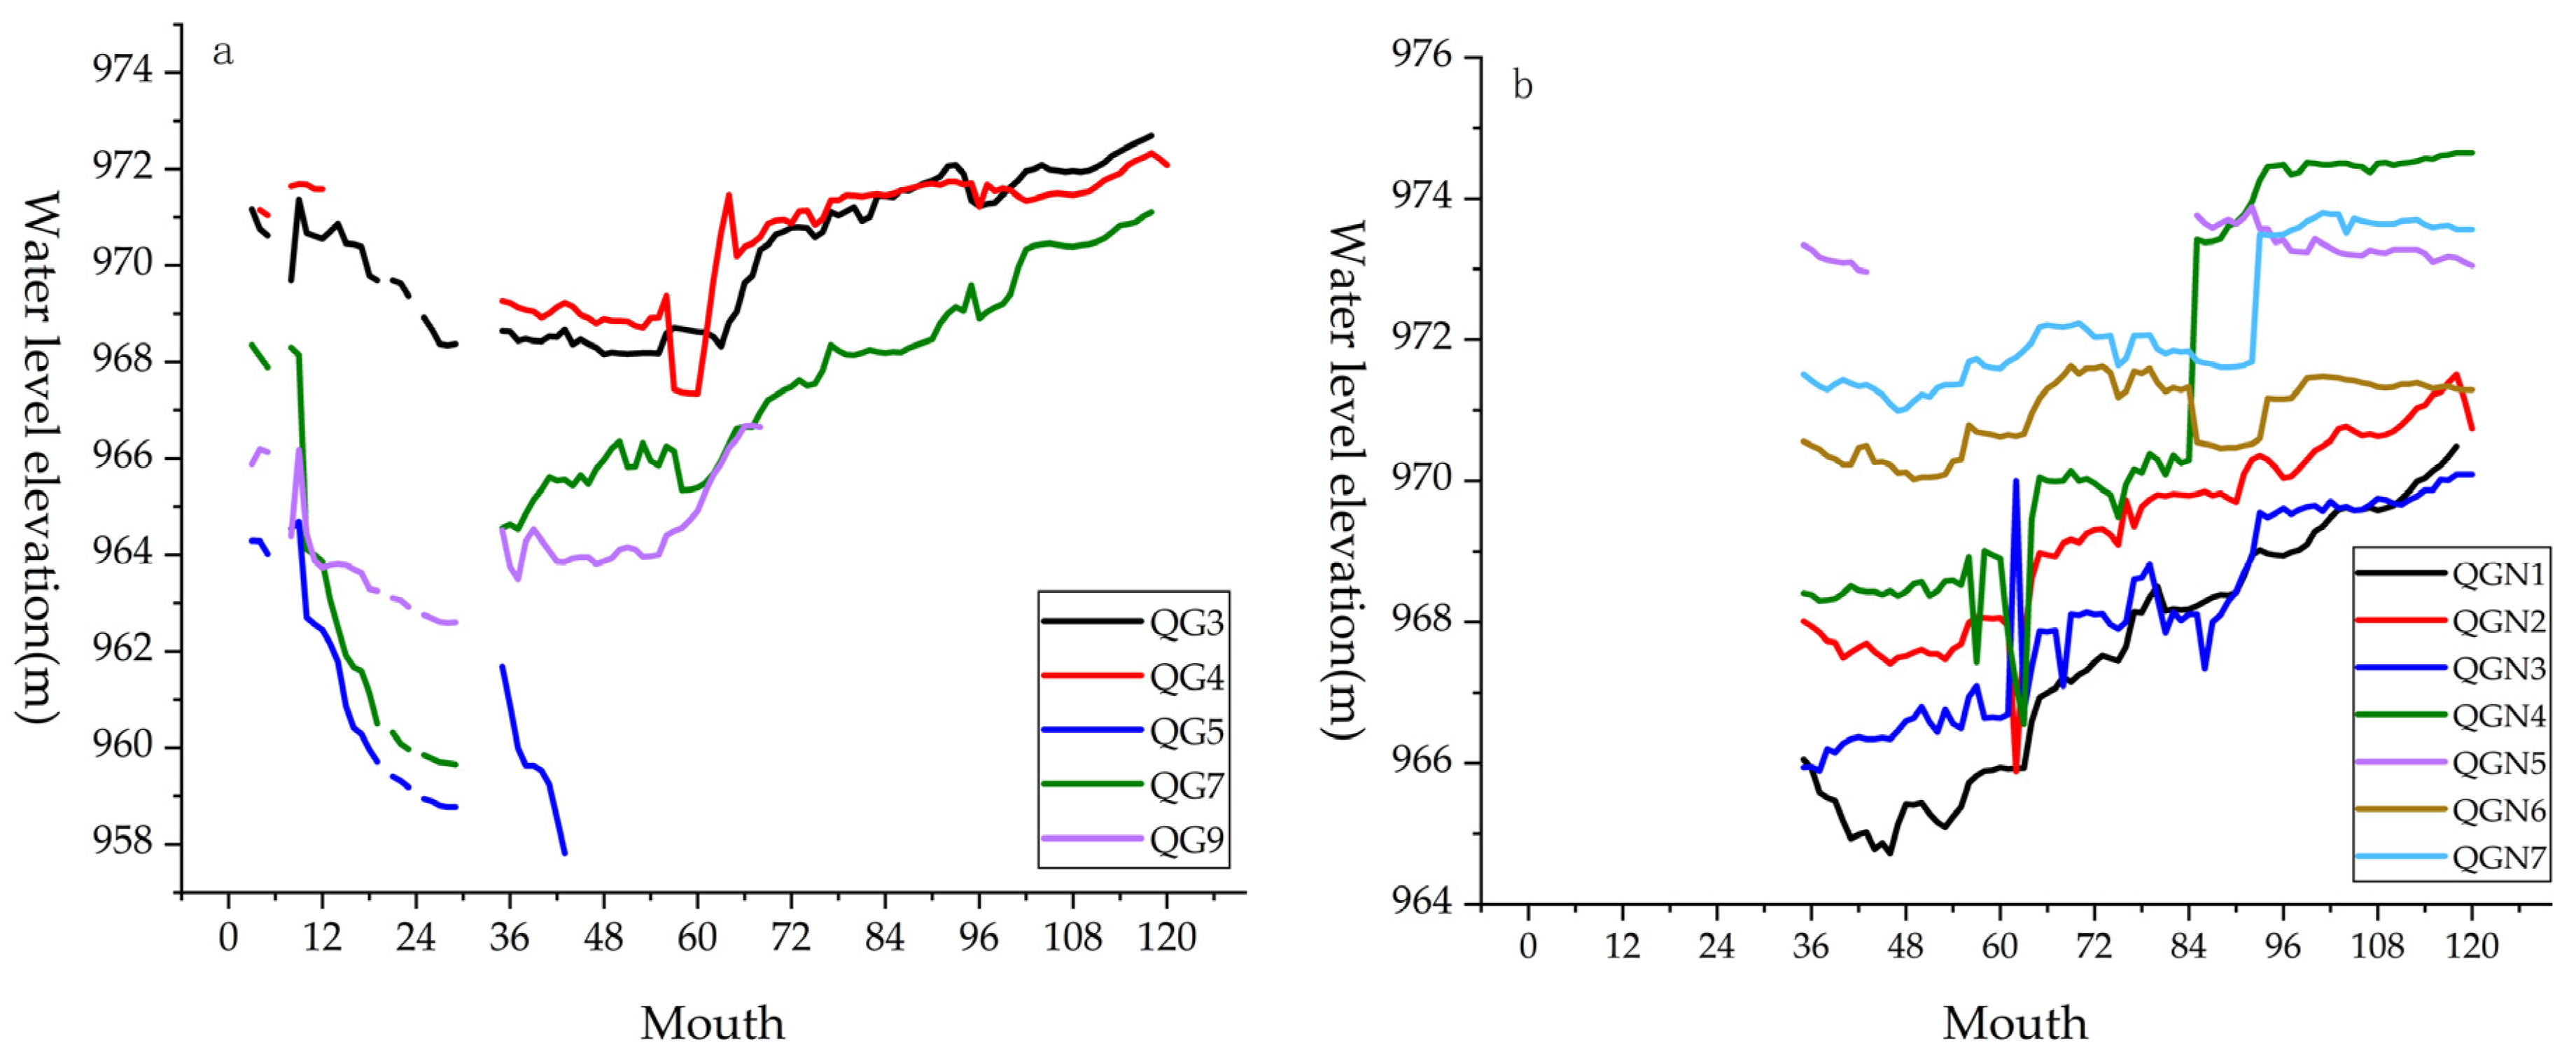
During the mining process of Shengli No. 1 open-pit mine, continuous monitoring wells have been deployed since 2008. Among them, five hydrological wells started being monitored in 2008 (Figure 4a) and seven hydrological wells started being monitored in November 2010 (Figure 4b). The monitoring data were collected once a month, and the monitoring time totaled 120 months. As can be seen from Figure 4, since 2008, the eastern mining area of Quaternary aquifer groundwater level has experienced a slower, stable and increasing process of change, mainly in the lower level of the years 2010 to 2012, and the water level has gradually changed overall. Compared with the water level data initially monitored, the water level of most monitoring wells is higher than the water level during initial monitoring, and the groundwater level in the eastern mine is gradually rising.
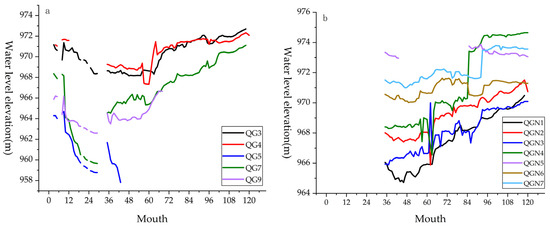
Figure 4.
The trend map of the waterline change of monitoring wells.(a) Hydrological wells monitored since 2008 (5 wells); (b) Hydrological wells monitored since 2010 (7 wells).
The current water level elevation of the hydrological monitoring wells is compared with the background value before the large-scale mining took place in 1988. The water level has decreased. The monitoring well with the highest water level decline is QGN3, with a depth of 7.31 m, and the smallest decline is 2.35 m for QGN4. The average descent depth is 4.78 m (Figure 2). The current level of the monitoring wells is compared with the background value. There is a definite link between a decreased distance between the boundary and monitoring wells stope, and when the distance from the water level monitoring well stope is shorter, the decrease in the water level is relatively large.
4. Discussion
4.1. Influencing Factors
There are many factors, both human and natural, that lead to changes in the groundwater level. Each of the influencing factors that affect groundwater resources provide protection or cause damage that is easy to judge, but the factors affecting the groundwater itself are difficult to quantify. Open-pit mining-dredged water has a certain impact on groundwater, which will cause the water level around the stope to drop and form a groundwater funnel. At the same time, the decline in the water level is also affected by other factors. This paper compares and analyzes several factors that affect the change in water levels, namely precipitation, evaporation, dredged water and groundwater used for human activities [37,38] (Table 3). The precipitation and evaporation data come from the Xilingol League Meteorological Bureau, the annual dry water data come from the Shengli No. 1 open-pit mine production data and the groundwater usage data come from the Xilingol League statistics of the total groundwater used for agriculture, animal husbandry and living.
Table 3.
The data table of influence factors.
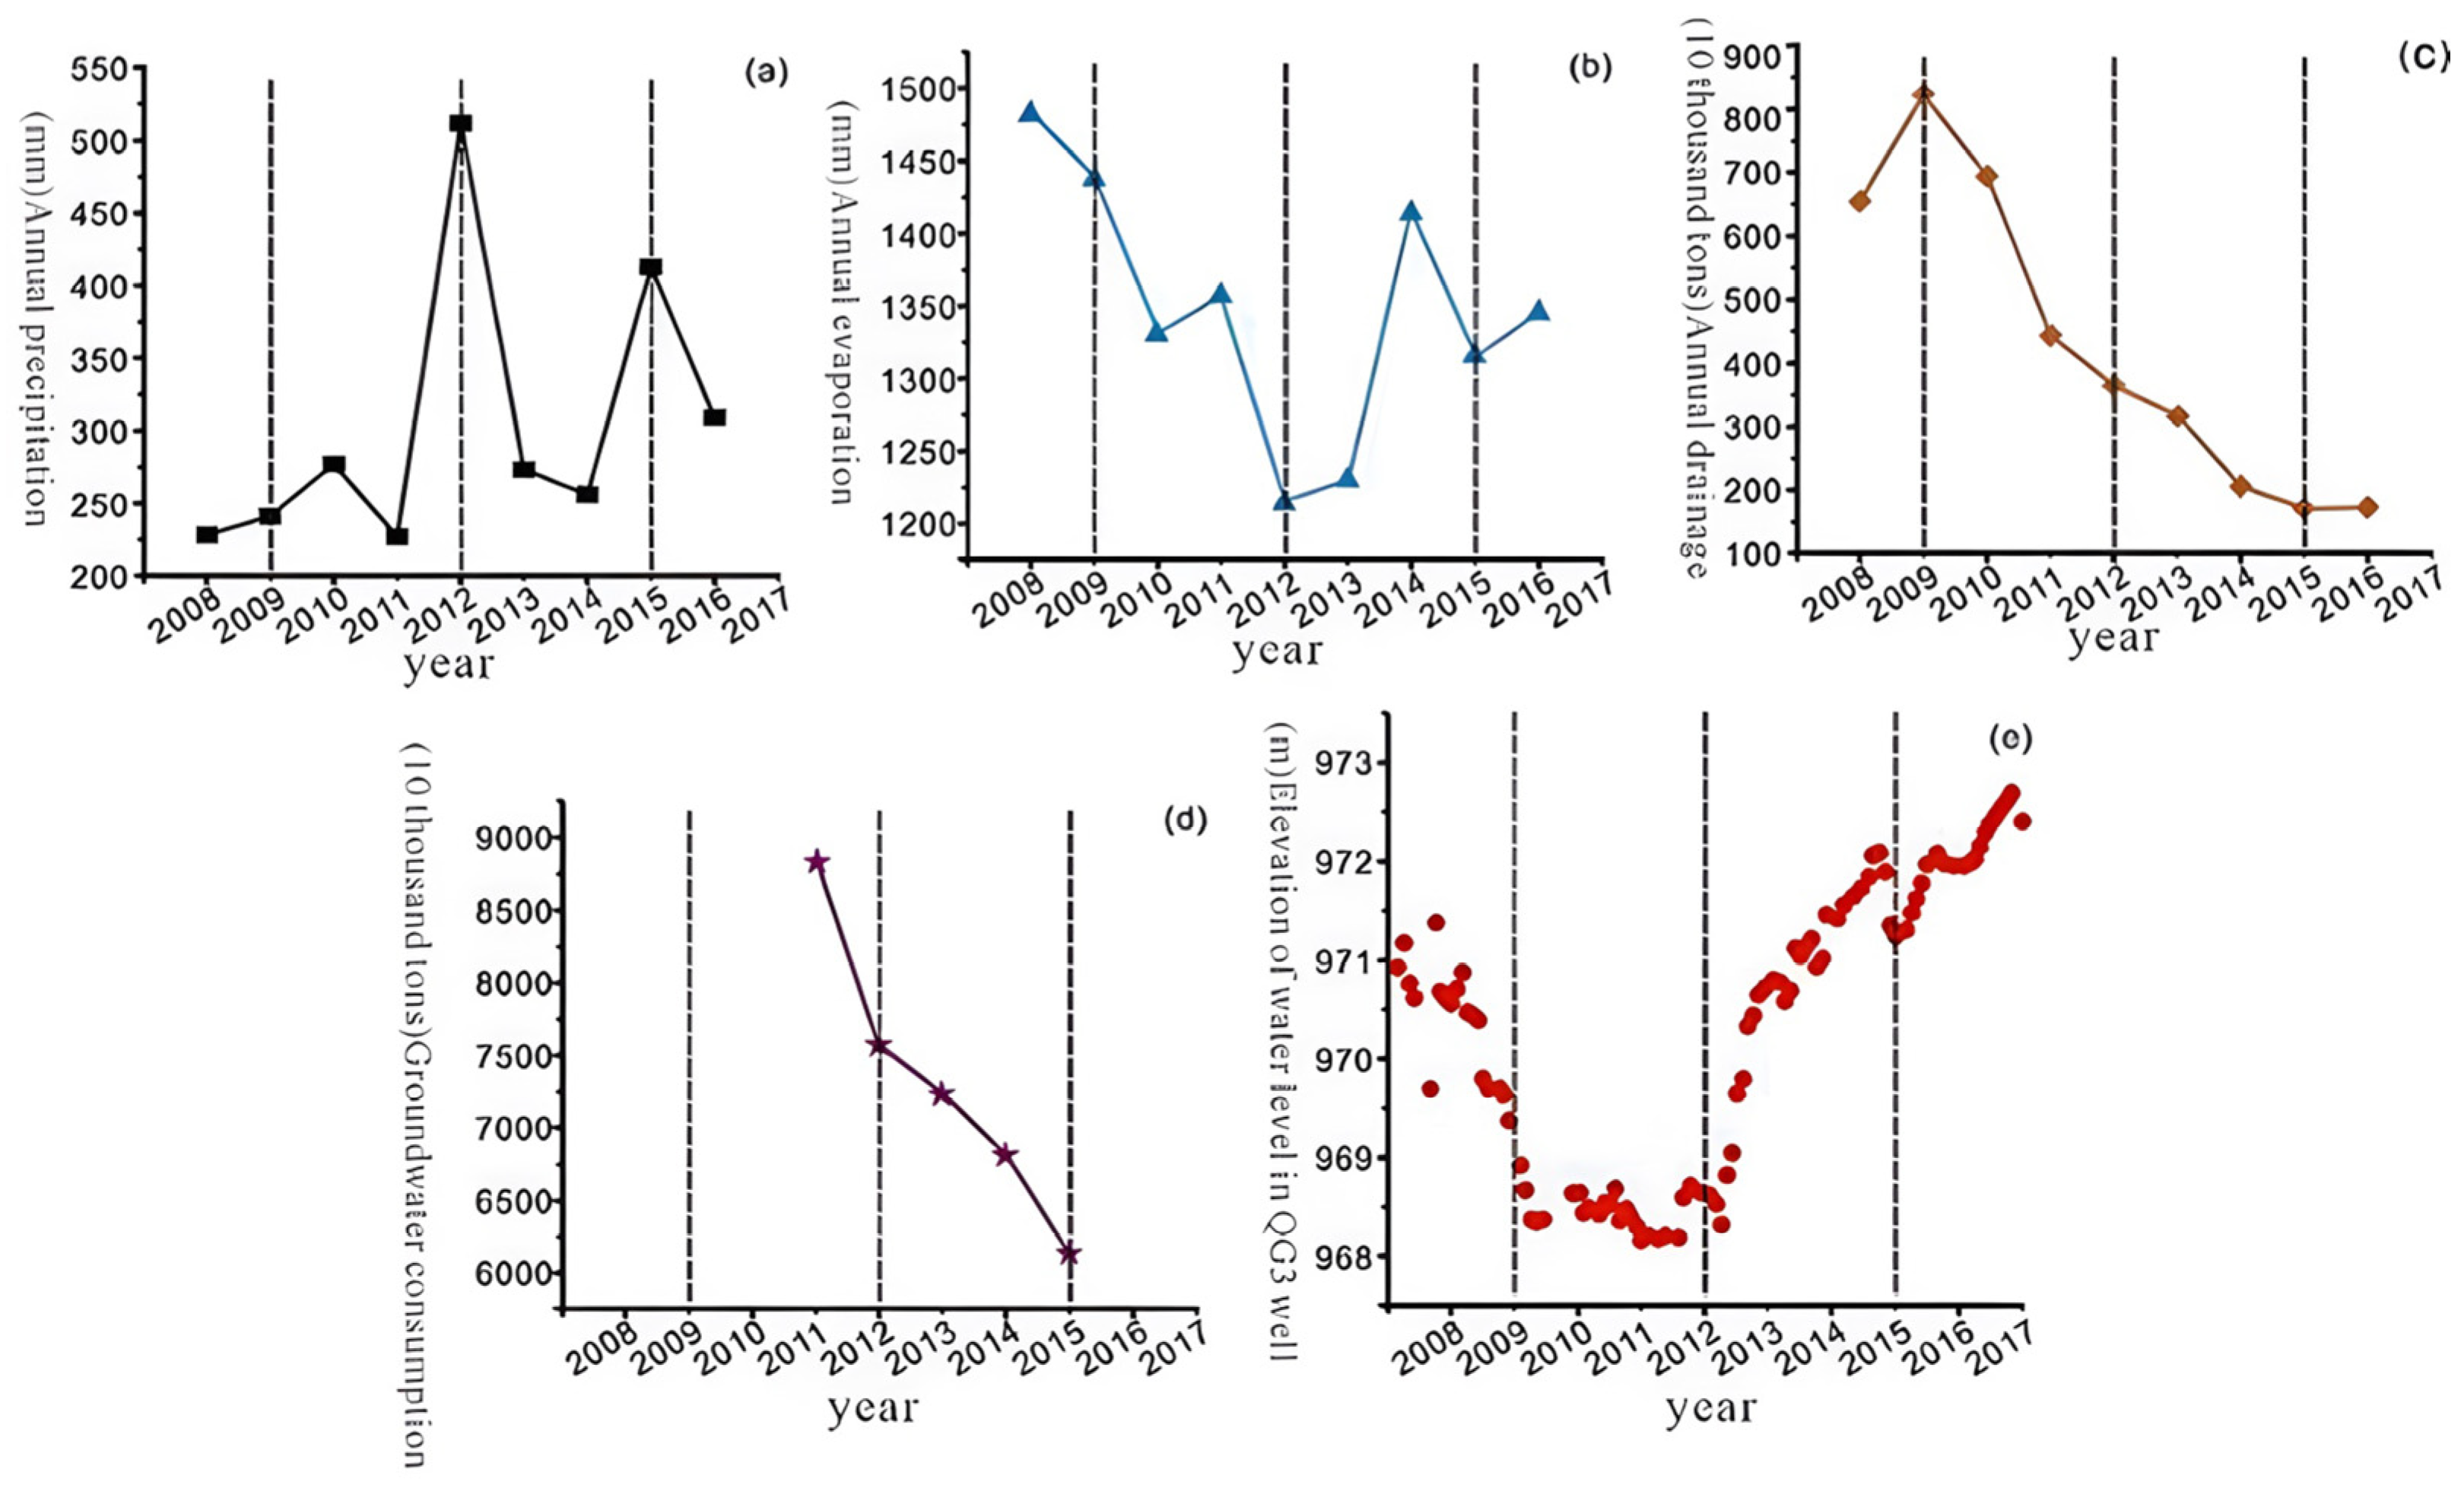
According to the influencing factors for many years, the changes that have occurred in the diving waterline of the Quaternary aquifer since 2008 are shown in Figure 5. Since 2008, the Quaternary aquifer groundwater level has gone through reducing, smooth and elevated process, in which the maximum rate of decline was observed in 2009, 2010 and 2012, occurring at a relatively low value compared to the steady, rapid rise that began in 2013, which thus far has continued to rise (Figure 5e). Comparing the change in the water level and the change trend of influencing factors, there is no single matching factor curve that has a good matching connection with the change in the waterline, which indicates that the variation in the diving waterline in the Quaternary aquifer is controlled by multiple factors.
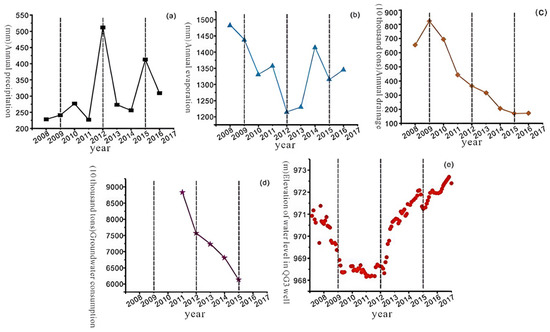
Figure 5.
The waterline change and influencing factors. (a) Annual precipitation since 2008; (b) Annual Evaporation since 2008; (c) Annual dredging since 2008; (d) Groundwater use since 2008; (e) QG3 well water level elevation since 2008.
The area of Xilinhaote belongs to a semi-arid steppe climate, with annual evaporation greater than precipitation. Precipitation in 2008 and 2009 was low and evaporation was high (Figure 5a,b). The dredged water volume is the total trunk volume of the Quaternary, top conglomerate and five coal aquifers in the mining area. Although it does not represent the actual dredged water volume of the Quaternary, the trend of the dredged water volume is the same. Judging from the amount of dredged water extracted, the amount of dredged water in the past two years has been relatively large, resulting in a drop in water levels (Figure 5c). From 2010 to 2012, the amount of dredged water dropped drastically, from 8.23 million tons to 3.65 million tons, and the amount of precipitation in the atmosphere increased significantly. In 2012, the amount of precipitation reached a high of 511.7 mm. In addition, the use of groundwater was controlled, and the use of groundwater was also reduced (Figure 5d). At the same time, the eastern part of the mining area began to drain in 2012. On the one hand, the internal dumping site has a certain blocking effect on the drainage of the Quaternary aquifer in the eastern mine, and on the other hand, the distance between the monitoring well and the mining boundary gradually increases. The water level has risen rapidly since 2013, which is consistent with the continuous decline in the amount of dredged water and the continuous decline in the use of groundwater.
According to a comprehensive analysis of the water level changes and influencing factors of the Quaternary aquifer in the east of Shengli’s No. 1 open-pit mine, atmospheric precipitation, evaporation, dredged water, and groundwater use all affect water-level changes. The eastern mine has a positive effect on groundwater level recovery. Water-level changes are controlled by the combined effects of multiple factors, and it is difficult to distinguish the weight or quantitative characterization of each factor.
4.2. Influence Radius
The quaternary aquifer diving water level is affected by atmospheric precipitation recharge, evaporation, runoff and drainage, and the water level also changes to some extent throughout the year [39]. During the year, the atmospheric precipitation is mainly concentrated from June to August, accounting for about 71% of the annual precipitation. The groundwater level is affected by it. From January to April, the water level for the whole year is relatively low. It gradually increases in May, and the water level in some wells remains unchanged or increases slightly from September to December.
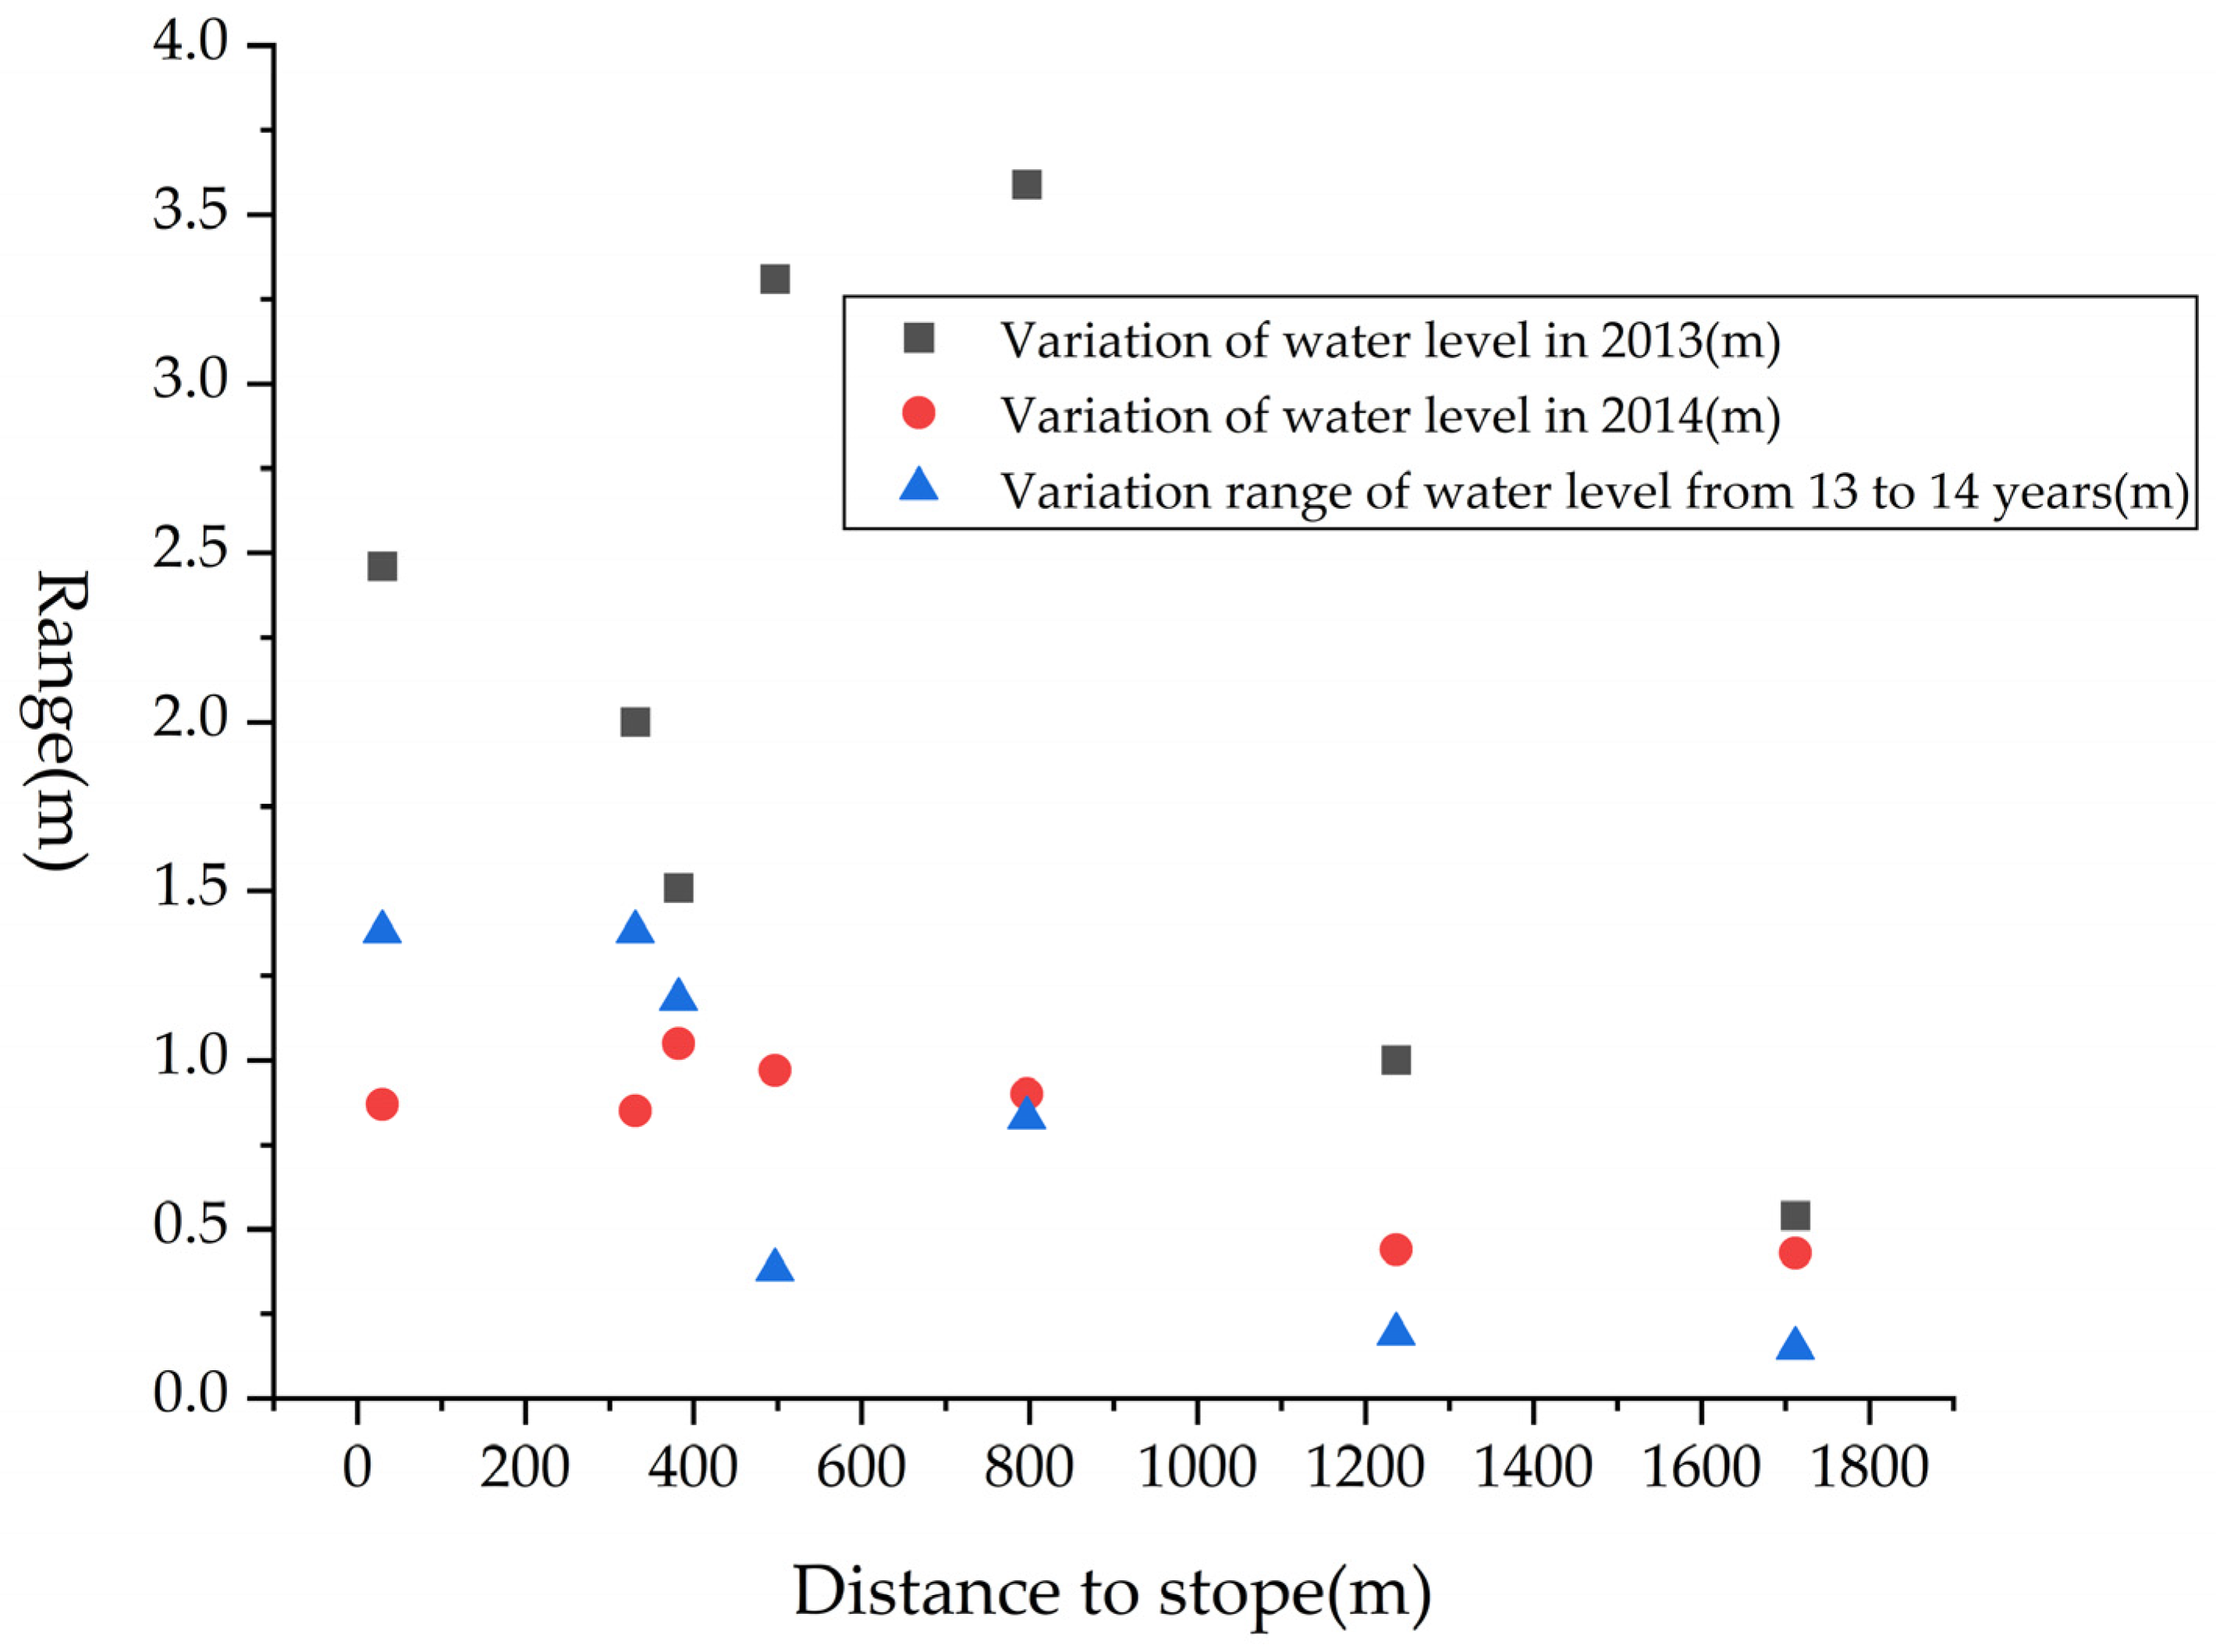
Table 4 shows the water-level data of different hydrological monitoring wells in 2013 and 2014. The nearest monitoring well is about 30 m from the stope, and the farthest monitoring well is about 1700 m from the stope. Comparing the changes in the water level of each monitoring well during the year, in addition to QGN3 and QGN4, the water levels of other wells in 2013 and 2014 had the characteristic of decreasing water level changes with increasing distance from the stope. In the same year, the same amount of atmospheric precipitation and evaporation is accepted at each drilling location. The amount of dredged water in open-pit mining is constant. The alteration in the waterline of monitoring wells at different distances is affected by the formation permeability and water richness of the monitoring wells on the one hand, and by the mining dredging on the other. The effect of dry action dredging was added to the influencing factors and compared to conventional groundwater level monitoring methods [40,41,42]. The effect of dredging on surrounding formation water is gradual, and the effect gradually decreases from the dredging wells surrounding the stope to the outside.
Table 4.
The data table of change range of waterline.
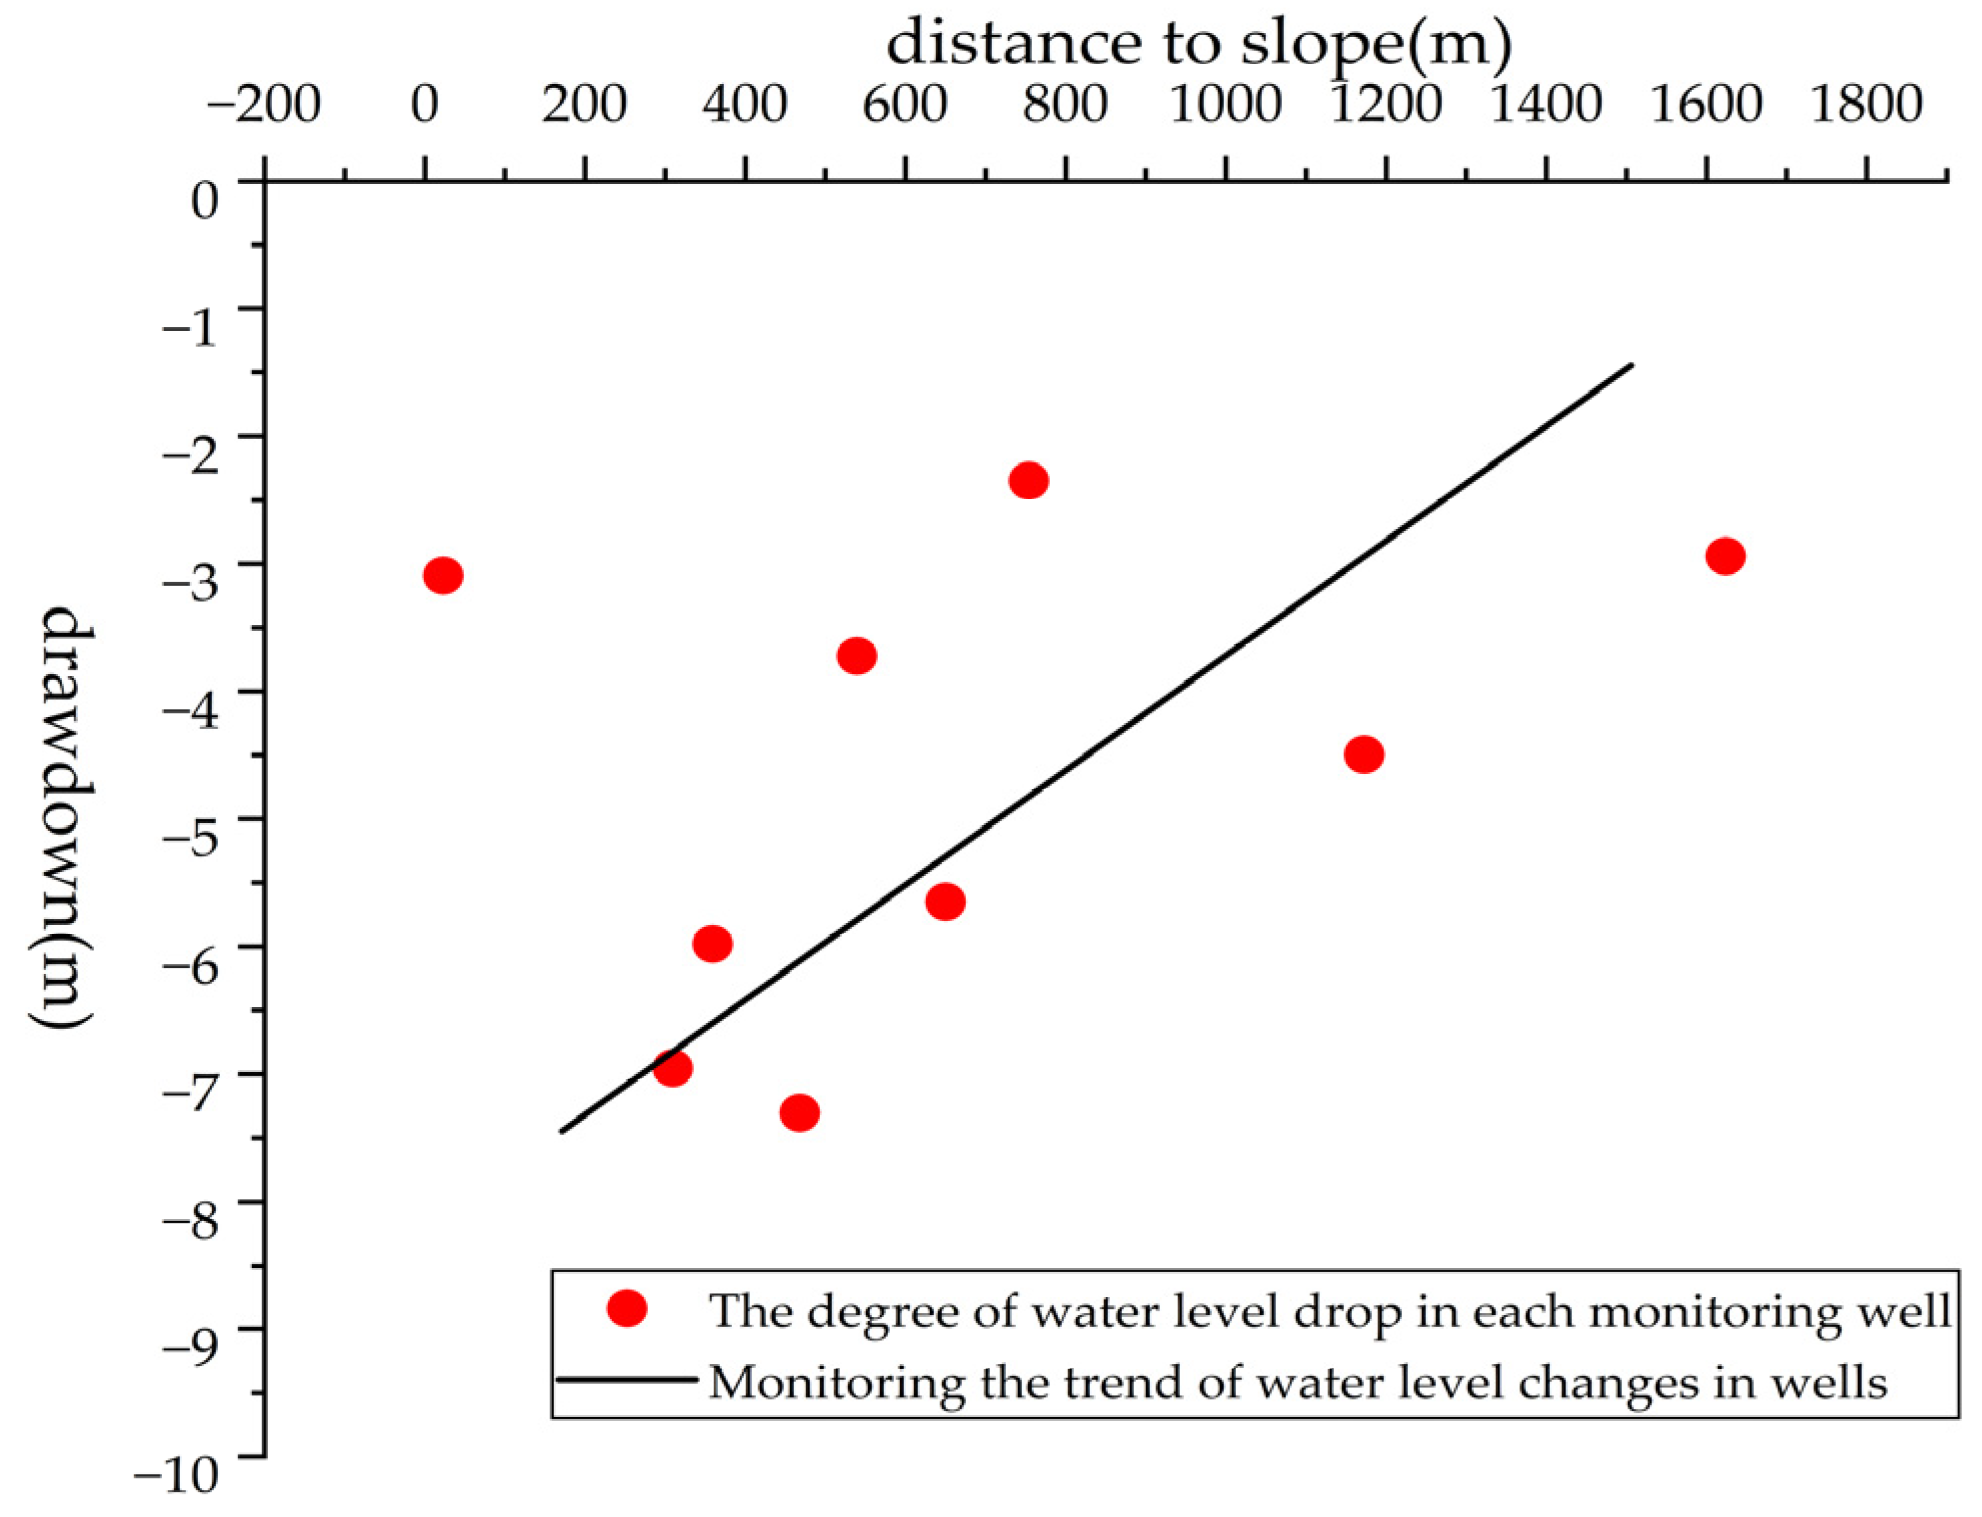
In order to identify the disturbance range of dredging to the surrounding groundwater, the average water level of monitoring wells in 2013 and 2014 was compared. The two years of annual precipitation were comparable, and the annual evaporation was slightly higher in 2014 than in 2013. However, the total amount of drained water was 3.17 million tons in 2013, compared to a total of 206 tons in 2014, which is a large difference. In contrast with the quantity of precipitation and evaporation, which was approximately the same, there was a large change in the amount of dredged water. From the annual water level change of the monitoring well, we can identify the disturbance range of the dredged water. Compared to 2013, the water levels of all monitoring wells have increased, except for that of QGN7. From the annual change of the water levels of each monitoring well in Figure 6 the overall annual water level of monitoring wells near the stope has changed significantly. The annual water level change of the farthest QGN7 well was only 0.15 m, which is far less than the value of the waterline change within a year of a unitary well. According to the comparison law, the disturbance radius of the dredged water to the surrounding quaternary aquifer during the mining process of Shengli No. 1 open-pit mine is less than 2000 m (Figure 7).
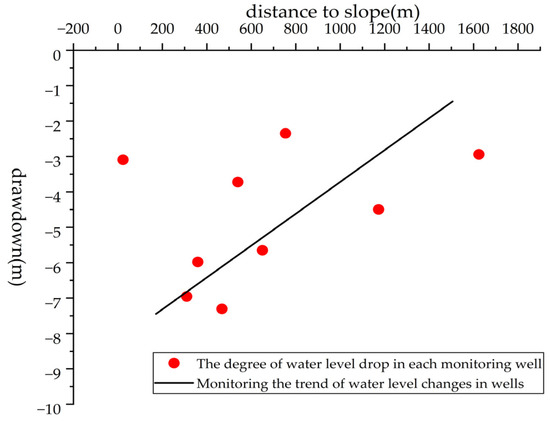
Figure 6.
The relation graph between waterline change and distance of monitoring wells to coal mine.
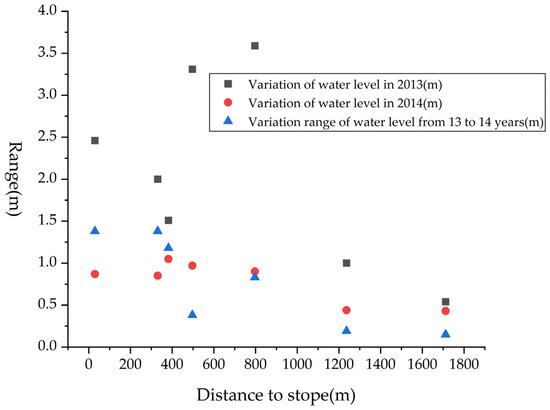
Figure 7.
The waterline change of different monitoring wells.
5. Conclusions
In accordance with the investigation on the trend of the diving waterline in the quaternary aquifer around Shengli’s No. 1 open-pit mine, the water level around the mining area changed in one year and across different years. The variation trend of surrounding groundwater and the influence radius of groundwater were also obtained. Combined with analysis of various influencing factors, the following conclusions are drawn:
The water level in the eastern mine experienced a process of lowering in 2008 and then beginning to rise in 2013. The current water level is higher than the level at which monitoring started. Compared with the background value, the current water level of each monitoring well is lower than the water level background value, and the descending depth is about 4–6 m.
The influence radius of the diving layer calculated by Kusakin’s empirical formula cannot fully reflect the disturbance radius of the open-pit mining to the surrounding groundwater. According to the connection between the waterline of the monitoring well and the distance to the stope, the disturbance radius of open-pit mining to the surrounding diving is less than 2000 m.
Comprehensive analysis of changes in diving water levels and influencing factors. Atmospheric precipitation, evaporation, groundwater use, and dredged water are the main factors affecting water level changes. Open-pit mine drainage has a positive effect on surrounding groundwater restoration.
The hydrological monitoring method in this study has the advantages of being able to monitor the underground submerged water level around the open-pit mine for a long period of time, with remote monitoring and continuity. However, it also has some limitations and should be considered for groundwater monitoring in many situations before, during and after coal mining. This research method can be considered in other newly developed surface mines to better monitor the groundwater in these areas and further summarize the influence of surface coal mining on the surrounding groundwater.
Author Contributions
Conceptualization, Y.H. and S.P.; methodology, Y.H., S.P. and L.F.; software, X.W. and K.L.; validation, Y.H., C.C. and Z.L.; formal analysis, K.L. and C.C.; investigation, Y.H. and X.W.; resources, S.P. and Y.Y.; data curation, Y.H., L.F. and Z.L.; writing—original draft preparation, Y.H.; writing—review and editing, Y.H. and L.F; visualization, Y.H. and L.F; supervision, Y.H. and S.P.; project administration, Y.H. and S.P.; funding acquisition, S.P. All authors have read and agreed to the published version of the manuscript.
Funding
This research was funded by the Fundamental Research Funds for the National Natural Science Foundation of China (No.42272286); Open Fund of Key Laboratory of Industrial Safety Accident Analysis, Monitoring and Early Warning, Ministry of Emergency Management, North China Institute of Science and Technology (No.OF2301).
Data Availability Statement
Data are contained within the article.
Acknowledgments
The authors wish to acknowledge the Fundamental Research Funds for the National Natural Science Foundation of China; Open Fund of Key Laboratory of Industrial Safety Accident Analysis, Monitoring and Early Warning, Ministry of Emergency Management, North China Institute of Science and Technology, for their financial contribution to this work.
Conflicts of Interest
The authors declare no conflict of interest.
References
- Cao, Z.G.; Li, Q.S.; Dong, B.Q. Water resource protection and utilization technology and application of caol mining in Shendong mining area. Coal Eng. 2014, 46, 162–164+168, (In Chinese with abstract in English). [Google Scholar] [CrossRef]
- Gu, D.Z. Theory framework and technological system of coal mine underground reservoir. J. China Coal Soc. 2015, 40, 239–246, (In Chinese with abstract in English). [Google Scholar] [CrossRef]
- Xie, H.; Wang, J. China Coal Science Capacity; Coal Industry Press: Beijing, China, 2014. [Google Scholar]
- Shi, L.; Xu, D.; Wang, Y.; Qiu, M.; Hao, J. A novel conceptual model of fracture evolution patterns in the overlying strata during horizontal coal seam mining. Arab. J. Geosci. 2019, 12, 326. [Google Scholar] [CrossRef]
- Chen, G.; Xu, Z.; Rudakov, D.; Sun, Y.; Li, X. Deep Groundwater Flow Patterns Induced by Mine Water Injection Activity. Int. J. Environ. Res. Public Health 2022, 19, 15438. [Google Scholar] [CrossRef] [PubMed]
- Chen, L.; Wang, X.; Liang, G.; Zhang, H. Evaluation of Groundwater Flow Changes Associated with Drainage within Multilayer Aquifers in a Semiarid Area. Water 2022, 14, 2679. [Google Scholar] [CrossRef]
- Du, W.; Chen, L.; He, Y.; Wang, Q.; Gao, P.; Li, Q. Spatial and Temporal Distribution of Groundwater in Open-Pit Coal Mining: A Case Study from Baorixile Coal Mine, Hailaer Basin, China. Geofluids 2022, 2022, 8753217. [Google Scholar] [CrossRef]
- Gu, D.Z.; Zhang, J.M.; Wang, Z.R.; Cao, Z.G.; Zhang, K. Observations and analysis of groundwater change in Shendong mining area. Coal Geol. Explor. 2013, 41, 35–39, (In Chinese with abstract in English). [Google Scholar] [CrossRef]
- Li, Q.S.; Ju, J.F.; Cao, Z.G.; Gao, F.; Li, J.H. Suitability evaluation of underground reservoir technology based on the discriminant of the height of water conduction fracture zone. J. China Coal Soc. 2017, 42, 2116–2124, (In Chinese with abstract in English). [Google Scholar] [CrossRef]
- Luan, J.; Zhang, Y.; Tian, J.; Meresa, H.; Liu, D. Coal mining impacts on catchment runoff. J. Hydrol. 2020, 589, 125101. [Google Scholar] [CrossRef]
- Chen, X.; Zheng, L.; Dong, X.; Jiang, C.; Wei, X. Sources and mixing of sulfate contamination in the water environment of a typical coal mining city, China: Evidence from stable isotope characteristics. Environ. Geochem. Health 2020, 42, 2865–2879. [Google Scholar] [CrossRef]
- Feng, H.; Zhou, J.; Chai, B.; Zhou, A.; Li, J.; Zhu, H.; Chen, H.; Su, D. Groundwater environmental risk assessment of abandoned coal mine in each phase of the mine life cycle: A case study of Hongshan coal mine, North China. Environ. Sci. Poll. Res. 2020, 27, 42001–42021. [Google Scholar] [CrossRef] [PubMed]
- Karan, S.K.; Samadder, S.R.; Singh, V. Groundwater vulnerability assessment in degraded coal mining areas using the AHP-Modified DRASTIC model. Land Degrad. Dev. 2018, 29, 2351–2365. [Google Scholar] [CrossRef]
- Tao, W. Impact analysis and quality evaluation of groundwater environment in Open-pit Coal Mine. Opencast Min. Technol. 2016, 31, 68–71, (In Chinese with abstract in English). [Google Scholar] [CrossRef]
- Xu, D.; Shi, L.; Qu, X.; Tian, J.; Wang, K.; Liu, J. Leaching behavior of heavy metals from the coal gangue under the impact of site ordovician limestone karst water from closed Shandong coal mines, North China. Energy Fuels 2019, 33, 10016–10028. [Google Scholar] [CrossRef]
- Lyu, Z.; Chai, J.; Xu, Z.; Qin, Y. Environmental impact assessment of mining activities on groundwater: Case study of copper mine in Jiangxi Province, China. J. Hydrol. Eng. 2019, 24, 5018027. [Google Scholar] [CrossRef]
- Akhtar, N.; Syakir Ishak, M.I.; Bhawani, S.A.; Umar, K. Various natural and anthropogenic factors responsible for water quality degradation: A review. Water 2021, 13, 2660. [Google Scholar] [CrossRef]
- Jiang, C.; Zhao, Q.; Zheng, L.; Chen, X.; Li, C.; Ren, M. Distribution, source and health risk assessment based on the Monte Carlo method of heavy metals in shallow groundwater in an area affected by mining activities, China. Ecotoxicol. Environ. Saf. 2021, 224, 112679. [Google Scholar] [CrossRef]
- Santana, C.S.; Olivares, D.M.M.; Silva, V.H.C.; Luzardo, F.H.M.; Velasco, F.G.; De Jesus, R.M. Assessment of water resources pollution associated with mining activity in a semi-arid region. J. Environ. Manag. 2020, 273, 111148. [Google Scholar] [CrossRef]
- Qu, S.; Liao, F.; Wang, G.; Wang, X.; Shi, Z.; Liang, X.; Duan, L.; Liu, T. Hydrochemical evolution of groundwater in overburden aquifers under the influence of mining activity: Combining hydrochemistry and groundwater dynamics analysis. Environ. Earth Sci. 2023, 82, 135. [Google Scholar] [CrossRef]
- Zheng, L.; Chen, X.; Dong, X.; Wei, X.; Jiang, C.; Tang, Q. Using δ34S–SO4 and δ18O–SO4 to trace the sources of sulfate in different types of surface water from the Linhuan coal-mining subsidence area of Huaibei, China. Ecotoxicol. Environ. Saf. 2019, 181, 231–240. [Google Scholar] [CrossRef]
- Zhang, Z.X.; Zhang, Y.B.; Fu, X.T.; Wang, K.; Shi, Y.L. Study of destruction mechanism of coal mining on groundwater and its influencing factors. Coal Technol. 2016, 35, 211–213, (In Chinese with abstract in English). [Google Scholar] [CrossRef]
- Deng, Q.W.; Zhang, Y.B. Influence of mining exploration on groundwater drainage in Daheng coal mine. Bull. Soil Water Conserv. 2014, 34, 123–125, (In Chinese with abstract in English). [Google Scholar] [CrossRef]
- Fang, Z.; Xiao, C.L.; Yao, S.R.; Ma, Z.; Xu, B.; Ren, Y.R. Groundwater numerical simulation of muti-aquifers in the first exploiting region of Baoqing open-cast coal in Heilongjiang Province. J. Jilin Univ. (Earth Sci. Ed.) 2010, 40, 610–616, (In Chinese with abstract in English). [Google Scholar] [CrossRef]
- Sun, D.Q.; Lu, M.S.; Zhang, Z.M. The numerical simulation of groundwater resources in burnt zone of the first mining area Ⅲ in Dananhu northern surface mine of Xinjiang. Coal Geol. Explor. 2014, 42, 64–68, (In Chinese with abstract in English). [Google Scholar] [CrossRef]
- Szczepiński, J. The significance of groundwater flow modeling study for simulation of opencast mine dewatering, flooding, and the environmental impact. Water 2019, 11, 848. [Google Scholar] [CrossRef]
- Wang, T.; Li, J.; Jun, S.; Dong, S.G. The study for groundwater post-project evaluation of Open-pit coal mine-taking Shengli west No1 open-pit coal mine for example. North Environ. Mag. 2012, 28, 43–46, (In Chinese with abstract in English). [Google Scholar] [CrossRef]
- Sun, W.; Wu, Q.; Liu, H.; Jiao, J. Prediction and assessment of the disturbances of the coal mining in Kailuan to karst groundwater system. Phys. Chem. Earth Parts A/B/C 2015, 89, 136–144. [Google Scholar] [CrossRef]
- Xing, Z.; Du, W.; He, Y.; She, C. Theoretical understanding and practical significance of groundwater depression cone in Open-pit mine. Coal Technol. 2017, 36, 144–146, (In Chinese with abstract in English). [Google Scholar] [CrossRef]
- Guo, M.L.; Liu, T.H.; Bi, E.P.; Hu, X.B.; Xiao, Y.; Hu, Y.H.; Liu, C.S. Comparison of three machine learning models in dynamisimulation of groundwater level. Chin. J. Environ. Eng. 2024, 18, 1406–1414, (In Chinese with abstract in English). [Google Scholar] [CrossRef]
- Zhu, Q.; Zhao, H.Y.; Wang, J.Y.; Liu, T.W. Analysis of dynamic changes and influencing factors of groundwater level in Beijing. Beijing Water 2024, (In Chinese with abstract in English). [CrossRef]
- Chen, S.H.; Wei, H.X.; Du, H.; Lin, C.M. Multi-parameter safety criterion for structure subjected to blasting vibration. Disaster Adv. 2013, 6, 9–13. [Google Scholar]
- Ni, G.; Lin, B.; Zhai, C. Impact of the geological structure on pulsating hydraulic fracturing. Arab. J. Geosci. 2015, 8, 10381–10388. [Google Scholar] [CrossRef]
- Chen, J.; Han, Z.; Zhang, X.; Fan, A.; Yang, R. Early diagenetic deformation structures of the Furongian ribbon rocks in Shandong Province of China—A new perspective of the genesis of limestone conglomerates. Sci. China Earth Sci. 2010, 53, 241–252. [Google Scholar] [CrossRef]
- Tan, Y.; Zhao, T.; Xiao, Y. Researches on floor stratum fracturing induced by antiprocedure mining underneath close-distance goaf. J. Min. Sci. 2010, 46, 250–259. [Google Scholar] [CrossRef]
- Soni, A.K.; Sahoo, L.K.; Ghosh, U.K.; Khond, M.V. Importance of radius of influence and its estimation in a limestone quarry. J. Inst. Eng. India Ser. D 2015, 96, 77–83. [Google Scholar] [CrossRef]
- Ling, H.; Guo, B.; Xu, H.; Fu, J. Configuration of water resources for a typical river basin in an arid region of China based on the ecological water requirements (EWRs) of desert riparian vegetation. Global Planet. Chang. 2014, 122, 292–304. [Google Scholar] [CrossRef]
- Liu, R.; Yu, L.; Jiang, Y. Quantitative estimates of normalized transmissivity and the onset of nonlinear fluid flow through rough rock fractures. Rock Mech. Rock Eng. 2017, 50, 1063–1071. [Google Scholar] [CrossRef]
- Liu, N.; Lin, L.; Kong, B.; Wang, Y.; Zhang, Z.; Chen, H. Association between Arctic autumn sea ice concentration and early winter precipitation in China. Acta Oceanol. Sin. 2016, 35, 73–78. [Google Scholar] [CrossRef]
- Shu, L.C.; Luan, J.W.; Gong, R.; Lu, C.P.; Ding, F.; Tao, Y.Z.; Gong, J.S. Optimal Design of Monitoring Section for Groundwater Level Beside the River. J. Jilin Univ. Earth Sci. Ed. 2023, 53, 555–565, (In Chinese with abstract in English). [Google Scholar] [CrossRef]
- Wang, Y.W.; Wang, Z.M.; Wang, Y.W.; Chu, S.Y. Optimal Analysis on the Groundwater Level Monitoring Network in Guiyang City. J. Guizhou Univ. Nat. Sci. 2019, 36, 29–32, (In Chinese with abstract in English). [Google Scholar] [CrossRef]
- Zhang, Y.H.; Liu, Q.; Gao, X.M.; Ding, C.D.; Luo, R.; Hu, W. Analysis and utilization of groundwater level monitoring data of underground water-sealed caverns. Hazard Control Tunn. Undergr. Eng. 2024, 6, 24–35, (In Chinese with abstract in English). [Google Scholar] [CrossRef]
Disclaimer/Publisher’s Note: The statements, opinions and data contained in all publications are solely those of the individual author(s) and contributor(s) and not of MDPI and/or the editor(s). MDPI and/or the editor(s) disclaim responsibility for any injury to people or property resulting from any ideas, methods, instructions or products referred to in the content. |
© 2024 by the authors. Licensee MDPI, Basel, Switzerland. This article is an open access article distributed under the terms and conditions of the Creative Commons Attribution (CC BY) license (https://creativecommons.org/licenses/by/4.0/).