Abstract
Water quality problems are a major challenge that humans encounter in the 21st Century. Water security presents a pressing concern in South Africa due to persistent difficulties in ensuring water availability, accessibility, and quality. Given the numerous activities that are taking place adjacent to riverbanks, there has been a decline in water quality. This study determined the state of the Crocodile River’s intermediate water quality and assessed the effects of various human-induced activities. Water samples were collected during 2016–2023 in different sites within the Crocodile River, and physicochemical parameters were analysed in an accredited laboratory. The Python package Seaborn was used for statistical analysis of the data to provide visualizations and data variations. Overall, the results show that elevated concentrations of electrical conductivity (EC) and sulphate (SO42−) were recorded in the Crocodile River. The presence of elevated EC levels in R571 Bridge exceeded 133.90 µs/cm between 2020 and 2021, whilst the highest concentration levels (114 mg/L) for SO42− were recorded in Malelane in the year 2020. The elevated concentrations of concern were recorded during the dry season (winter) and the wet season (spring). Overall, the comparisons of the spatiotemporal concentration indicate that the water quality parameters fluctuate over time. Moreover, the monitoring practice of detecting the water quality change over time is also fundamental for providing valuable information necessary for the management of integrated water resources.
1. Introduction
The management of water is complicated by the irregular distribution of water across the globe, with some regions having an abundance of water and others being arid to semi-arid. The degradation and contamination of water resources at an accelerated rate have resulted in a reduction in both potable water and ecological integrity [1]. Rivers serve as the principal water source for agricultural discharge, municipal and industrial wastewater, and irrigation. However, their vulnerability to pollution is heightened by their critical function in transporting such pollutants [2,3]. Agricultural runoff, extensive coal mining activities, industrial activities, and a general decline in the operation and management of wastewater treatment infrastructure, especially sewage treatment, are major contributors to the deterioration of South Africa’s water quality [4,5]. For example, the settlements of communities adjacent to riverbanks have had implications for water quality, as postulated by Gqomfa et al. [6,7,8]. Consequently, the long-term development of society and the economy is contingent upon the sustainable utilisation of water resources [9]. Moreover, urbanisation, population growth, and climate change-induced extreme weather events are among the significant global change agents that are adversely affecting the quantity and quality of this scarce water resource [10].
The primary cause of alterations in the water quality of rivers is the substantial influx of pollutants and nutrients, which endanger aquatic life and the ecosystem’s ecological integrity [11,12,13]. Water quality is a comprehensive indicator that encompasses the physical, chemical, and biological attributes of water [14]. Human activities have consistently had a substantial impact on water quality systems, resulting in deteriorating water quality, reduced availability and usability of water, and modifications to the aquatic ecosystem [15]. Water pollution is the most significant environmental issue the world confronts today. A comprehensive analysis of this issue is imperative in light of the worldwide water scarcity and inadequate access to potable water [16]. In support of this claim, Schwarzenbach et al. [17] confirm that the most significant challenge confronting the current generation in the twenty-first century is water availability and quality.
Thus, the constant monitoring and assessment of water quality are fundamental for water resource management and sustainability, especially since adequate quantities of high-quality water are required for economic development and ecological integrity [18]. However, in recent times, climate change has compromised the quality as well as the quantity of water resources [19,20]. This has subsequently initiated serious water quality management efforts in many countries, including, for example, implementing and enforcing minimum stream flow water quality requirements to safeguard the integrity and well-being of aquatic ecosystems [21]. However, as posited by Faruk [22], most of the management efforts are difficult to execute without careful modelling, prediction, and analysis of river water quality. It is for this reason that it is necessary to analyse water pollution incidents to describe and evaluate a country’s water quality conditions [23]. According to Luo et al. [24], when the spatial and temporal trends are considered, the analysis of water contamination produces useful results. Hence, in recent times, there has been an upsurge in interest in spatiotemporal trend analysis due to its capacity to produce important water quality data for both researchers and policymakers [24]. The spatial and temporal water quality trend analysis presents changes that have occurred over a specific period, utilizing existing data. This approach is fundamental for the anticipation and estimation of future water quality [25]. Hashim et al. [26] posit that the spatiotemporal monitoring of water quality is necessary to indicate the increase and decrease of water contaminants over the monitored period. Therefore, the analysis of water quality trends can offer decision-makers valuable information regarding the linkages between land use and water quality indicators. This information can assist decision-makers in effectively managing the process of water pollution. These could help to mitigate the pollution of water resources, especially within semi-arid to arid countries. To this end, the monitoring practices of inland water resources in arid environments are an essential element due to their fragility [27,28,29].
Moreover, Molekoa et al. [10] emphasize that it helps evaluate the mechanisms that control the hydrochemistry evolution of water resources, especially since the results of real-time monitoring of water quality can indicate the impact of influencing elements on the water environment system. Thus, water quality monitoring and forecasting have become crucial [1]. To this end, Maphanga et al. [21] highlight that “water quality assessment is critical for identifying the major role of players and contributors to spatial and temporal variations in quality, which can be useful for integrated water resource management”. Monitoring is therefore required to ensure that the quality and quantity of water resources remain within acceptable limits for long-term use. Hence, in light of the considerable importance attributed to water quality monitoring, it is critical to establish the parameters and variables that will be utilised to assess the quality of an aquatic environment [30].
The rationale for long-term and intermediate monitoring is to maintain the ecological integrity of the rivers, especially for the Crocodile River, which is considered to have poor water quality due to agricultural runoff and mining activities [21]. Researchers have mentioned that the assessment and monitoring must be combined with spatiotemporal pattern analysis of the water quality of a river [31]. Historic trends or variations and a holistic view of spatial extent are therefore important to understand a baseline of water quality and evaluate the effects of natural and anthropogenic-induced changes in water resources [32]. It is possible to identify and interpret water trends using multivariate analysis, as well as identify potential drivers of water quality [33]. An index of water quality assigns a unitless qualitative value to a collection of measured variables according to a set of scientific criteria [31,33]. The primary objectives of this study were to determine the state of the Crocodile River’s long-term water quality from 2016 to 2023 and to assess the spatiotemporal distribution of physiochemical parameters across the river. The exploration of the spatial and temporal variation presents a comprehensive understanding of the dynamics of water quality across the Crocodile River. It is important to understand how the water quality parameters vary at different locations along the river and how these parameters change over time, as this leads to discovering new insights into the complex interplay between anthropogenic activities, natural processes, and seasonal variations.
2. Materials and Methods
2.1. Study Area Description
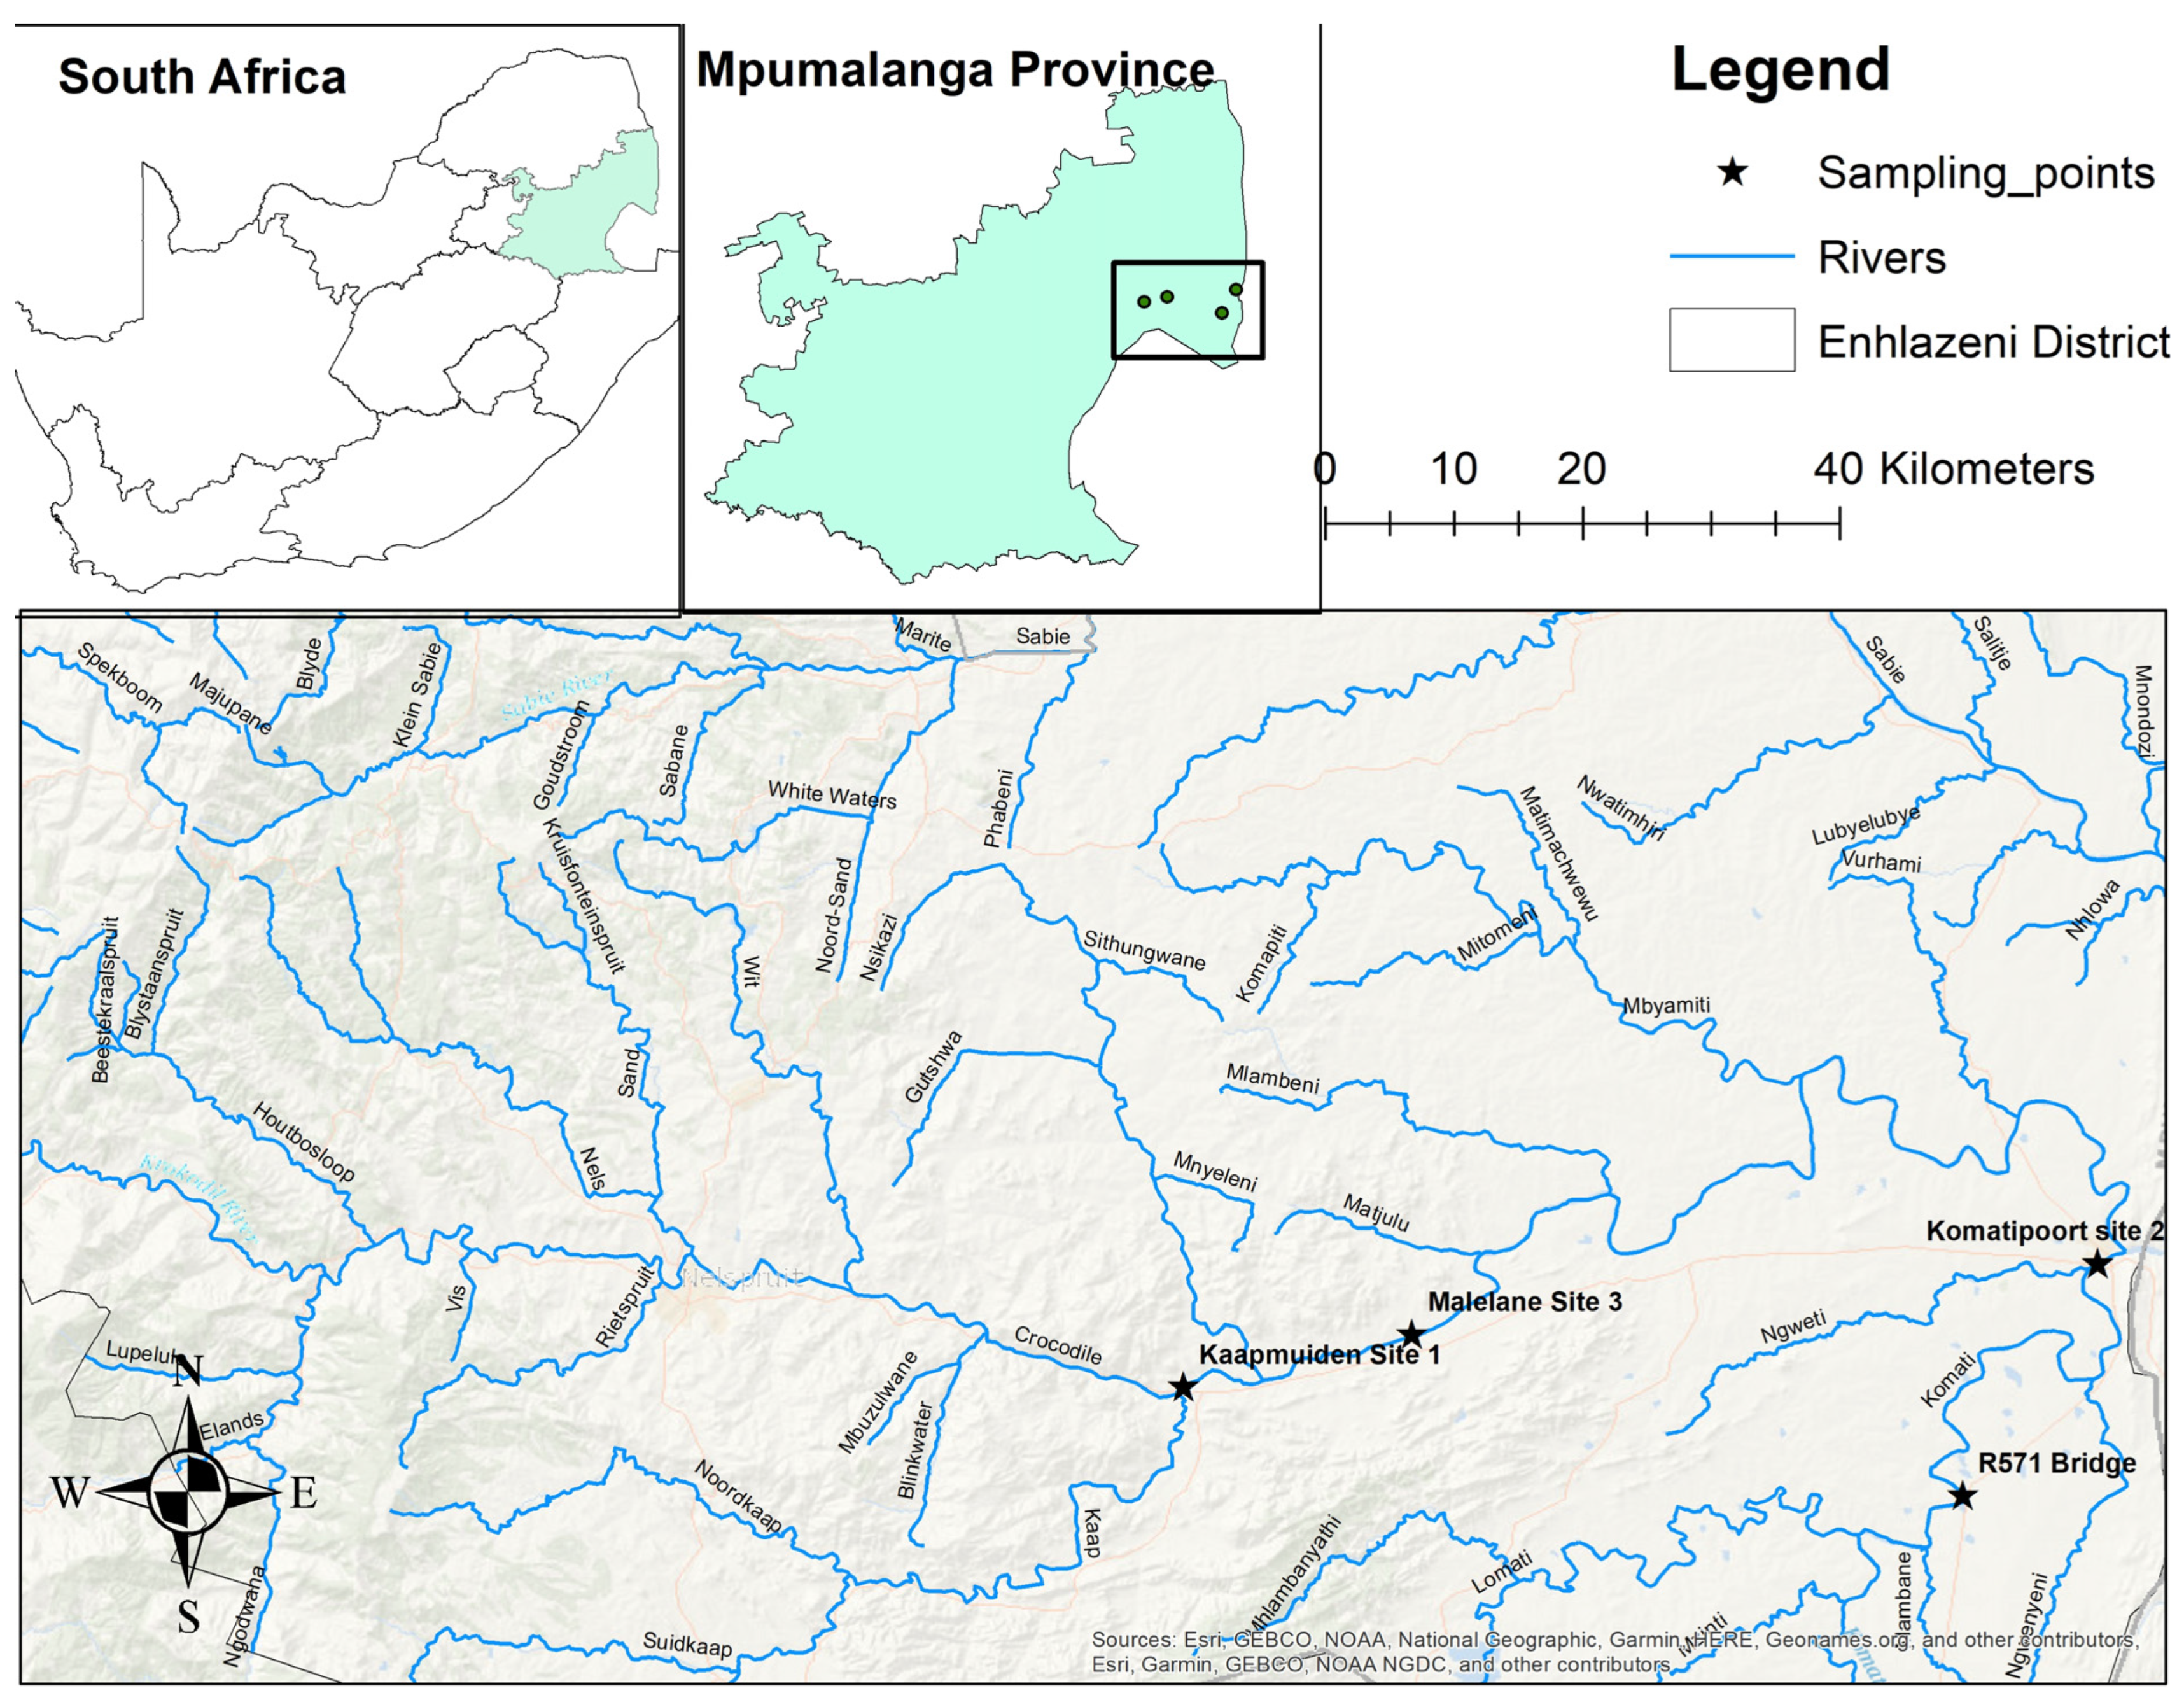
The study was conducted in the Crocodile River catchment area of Mpumalanga Province, as shown in Figure 1. Crocodile River is the Komati River’s main tributary, which it joins right before the Mozambique border. The Crocodile River basin includes the Elands River, Upper Crocodile, Kaap, Middle Crocodile, and Lower Crocodile Rivers. The southern portion of the Kruger National Park covers approximately 20% of the watershed (a northeastern component). The Crocodile River is a slow-flowing river with basic bedrock and sandy pools. It is 45 m wide on average. The agricultural activity in the Lowveld region has increased dramatically. As a result of these activities, large amounts of water are pumped out of the river, resulting in a decrease in flow, particularly during dry seasons. Reeds cover the majority of the river’s riparian zone. Moreover, the Crocodile River flows through the major towns of Nelspruit, Malelane, and Kaapmuiden. The middle region of the river has experienced a rapid increase in urbanization in the past decade. Other major activities occurring within the catchment include mining and paper milling in the Kaap and Elands River sub-catchment.
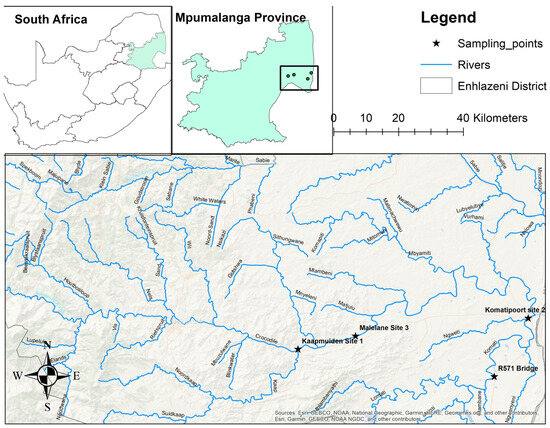
Figure 1.
Locality map of the study area.
- Characterization of sampling sites
- Kaapmuiden (site 1)
Kaapmuiden is a small farming town situated in the Lowveld region, approximately 40 km east of Mbombela (previously known as Nelspruit), at the confluence of the Kaap River and the Crocodile River in Mpumalanga, South Africa. The area is characterised by sub-tropical climate conditions and fertile farmlands used for cultivating sugarcane and other subtropical fruits and vegetables. Kaap River is one of the largest tributaries of the Crocodile River system, with a catchment of a total surface area of 1640 km2, flowing and draining past areas dominated by mining activities (active mines, defunct mines, and decanting mines) and agricultural activities before joining the Crocodile River at Kaapmuiden. After its confluence with the Kaap River, the Crocodile River water quality is generally characterised by high metal contamination, specifically manganese and arsenic, as well as high sulphates arising from mining activities in the Kaap River sub-catchment. The sub-catchment plays a pivotal role in the region, mainly because it fosters socioeconomic development and forms part of water resources of international importance, flowing into Mozambique.
- Komatipoort (site 2)
In the vicinity of the point where the Crocodile River and the Komati River merge is where the town of Komatipoort is situated. In the neighbourhood of Komatipoort, there is a weir that may be found right next to the Crocodile River. This is upstream of its confluence with the Komati River. The water quality around this study area indicates the effects of intensive sugar cane farming in the lower reaches of the Crocodile River as well as the sum of all the development within the Crocodile River catchment upstream.
- Malelane (site 3)
Malelane is a small farming town located near the Kruger National Park in the Kruger Lowveld region of Mpumalanga in South Africa on the N4 national highway. Over the years, Malelane has developed rapidly, and agricultural activities have greatly increased. Because of this, stormwater runoff from urban areas and agricultural runoff is the main cause of river pollution in the vicinity. Thus, the lowest reaches of the Crocodile River in Malelane are considered to have poor water quality due to agricultural run-off, additional mining activities, as well as the poorly treated effluent from the wastewater treatment plants.
- R571 Bridge (Site 4)
The R571 bridge study site is situated in the boundaries of the Kruger National Park, approximately 15 Km from the Komatipoort town, within the Crocodile River. There are no anthropogenic activities taking place within the site since it is within a protected conservation area; however, prevalent activities noted outside the border of the national park include sugarcane farming and private nature reserves. The site is mostly used by authorities to monitor upstream potential pollution that could have a detrimental effect on the overall functioning of the conservation area.
2.2. Water Sampling and Analysis Procedure
The water quality was assessed between 2016 and 2023 at four strategic sites that cover the spatial distribution along the river. The grab sample method was used for collecting the samples, as detailed in Diwan et al. [34]. All the necessary samples were collected at the respective points highlighted in Figure 1. To undertake a time series analysis of physicochemical parameters, the water quality sample bottles were marked with the site code, date, and time of sample collection using a permanent marker. One (1) litre chemical sample collecting bottles were rinsed three times before they were filled. Water quality samples were stored in two separate cooler boxes and preserved with ice packs or ice cubes. The samples were then submitted to a SANAS-accredited laboratory for analysis, and microbiological samples were delivered within 12 h to the laboratory. The samples were delivered to a laboratory that is accredited in terms of the South African National Accreditation System (SANAS), where the physiochemical parameters of the samples were processed within 12 h of collection. The pH and electrical conductivity (µs/cm) were measured using a Hach multi-probe meter, which was calibrated using buffers before use. The potentiometric analytical method was followed for analysing both parameters.
Sulphate (SO42−) was analysed using the spectrophotometric method, whereby a standard solution of sulphate was prepared using an anhydrous sodium sulphate solution, and a reagent was prepared using glycol, hydrochloric acid, 95% isopropyl alcohol, and sodium chloride. The spectrophotometer was calibrated using the sample water, hydrochloric acid, and the reagent. The analysis was undertaken at a wavelength of 420 nm, and the calibration curve was prepared by using a standard sulphate solution (10 ppm to 50 ppm) and a blank solution. Phosphate (PO43−) in the water samples was analysed using the Hach ascorbic acid method 10,209. Reagents such as sulphuric acid, ammonium molybdate solution, and ascorbic acid were used during the determination of phosphate. The determination of phosphate using the ascorbic method is a colorimetric method; hence, a spectrophotometer with an infrared phototube at 880 nm was used. The nitrate and nitrate concentration of the water samples was determined using the cadmium reduction method, as described in the Hach water analysis handbook. Reagents such as copper cadmium, ammonium chloride, EDTA, hydrochloric acid, and copper sulphate solution were used in the determination of nitrate. A spectrophotometer at a wavelength of 543 nm was used since it is a colorimetric method. Ammonia was determined using a UV spectrophotometer following the Nessler method. Reagents such as potassium sodium tartrate, ammonia standard solution, and the Nessler reagent were used. A spectrophotometer at a wavelength of 430 nm was used.
2.3. Statistical Data Analysis
Dealing with large amounts of data column by column is an arduous task, so data visualization is an ideal alternative. Seaborn is a Python library used for data visualization based on matplotlib. It provides a format for presenting data in the form of a statistical graph, which is an informative and visually appealing way to convey information. Seaborn is a library used in data visualizations to predict outcomes and analyse data variations based on models built over the dataset. In a continuous data point format, Seaborn line plots depict the relationship between continuous and categorical values. Along with the parameter palette, the hue was used to determine the data variable’s colour encoding scheme. The Python package Seaborn was used to generate the required heat maps for improved data visualization. The seaborn line plot command was used to illustrate the relationship between time and concentrations of elements (time-series plots). On a single grid, the command can use distinct subsets of the data based on the hue, size, and style parameters.
2.4. Prescribed Physicochemical Parameters
The General Authorization guidelines (general and special limits) of the South African Department of Water and Sanitation (DWS) were used as benchmarks to assess compliance with the prescribed legal limit for the physicochemical parameters. As stipulated by the resource quality objective, Table 1 outlines the various water quality prescribed limits for the Crocodile River.

Table 1.
Prescribed limits for water quality parameters.
3. Results
3.1. Spatiotemporal Distribution of Physiochemical Parameters in Four Sites
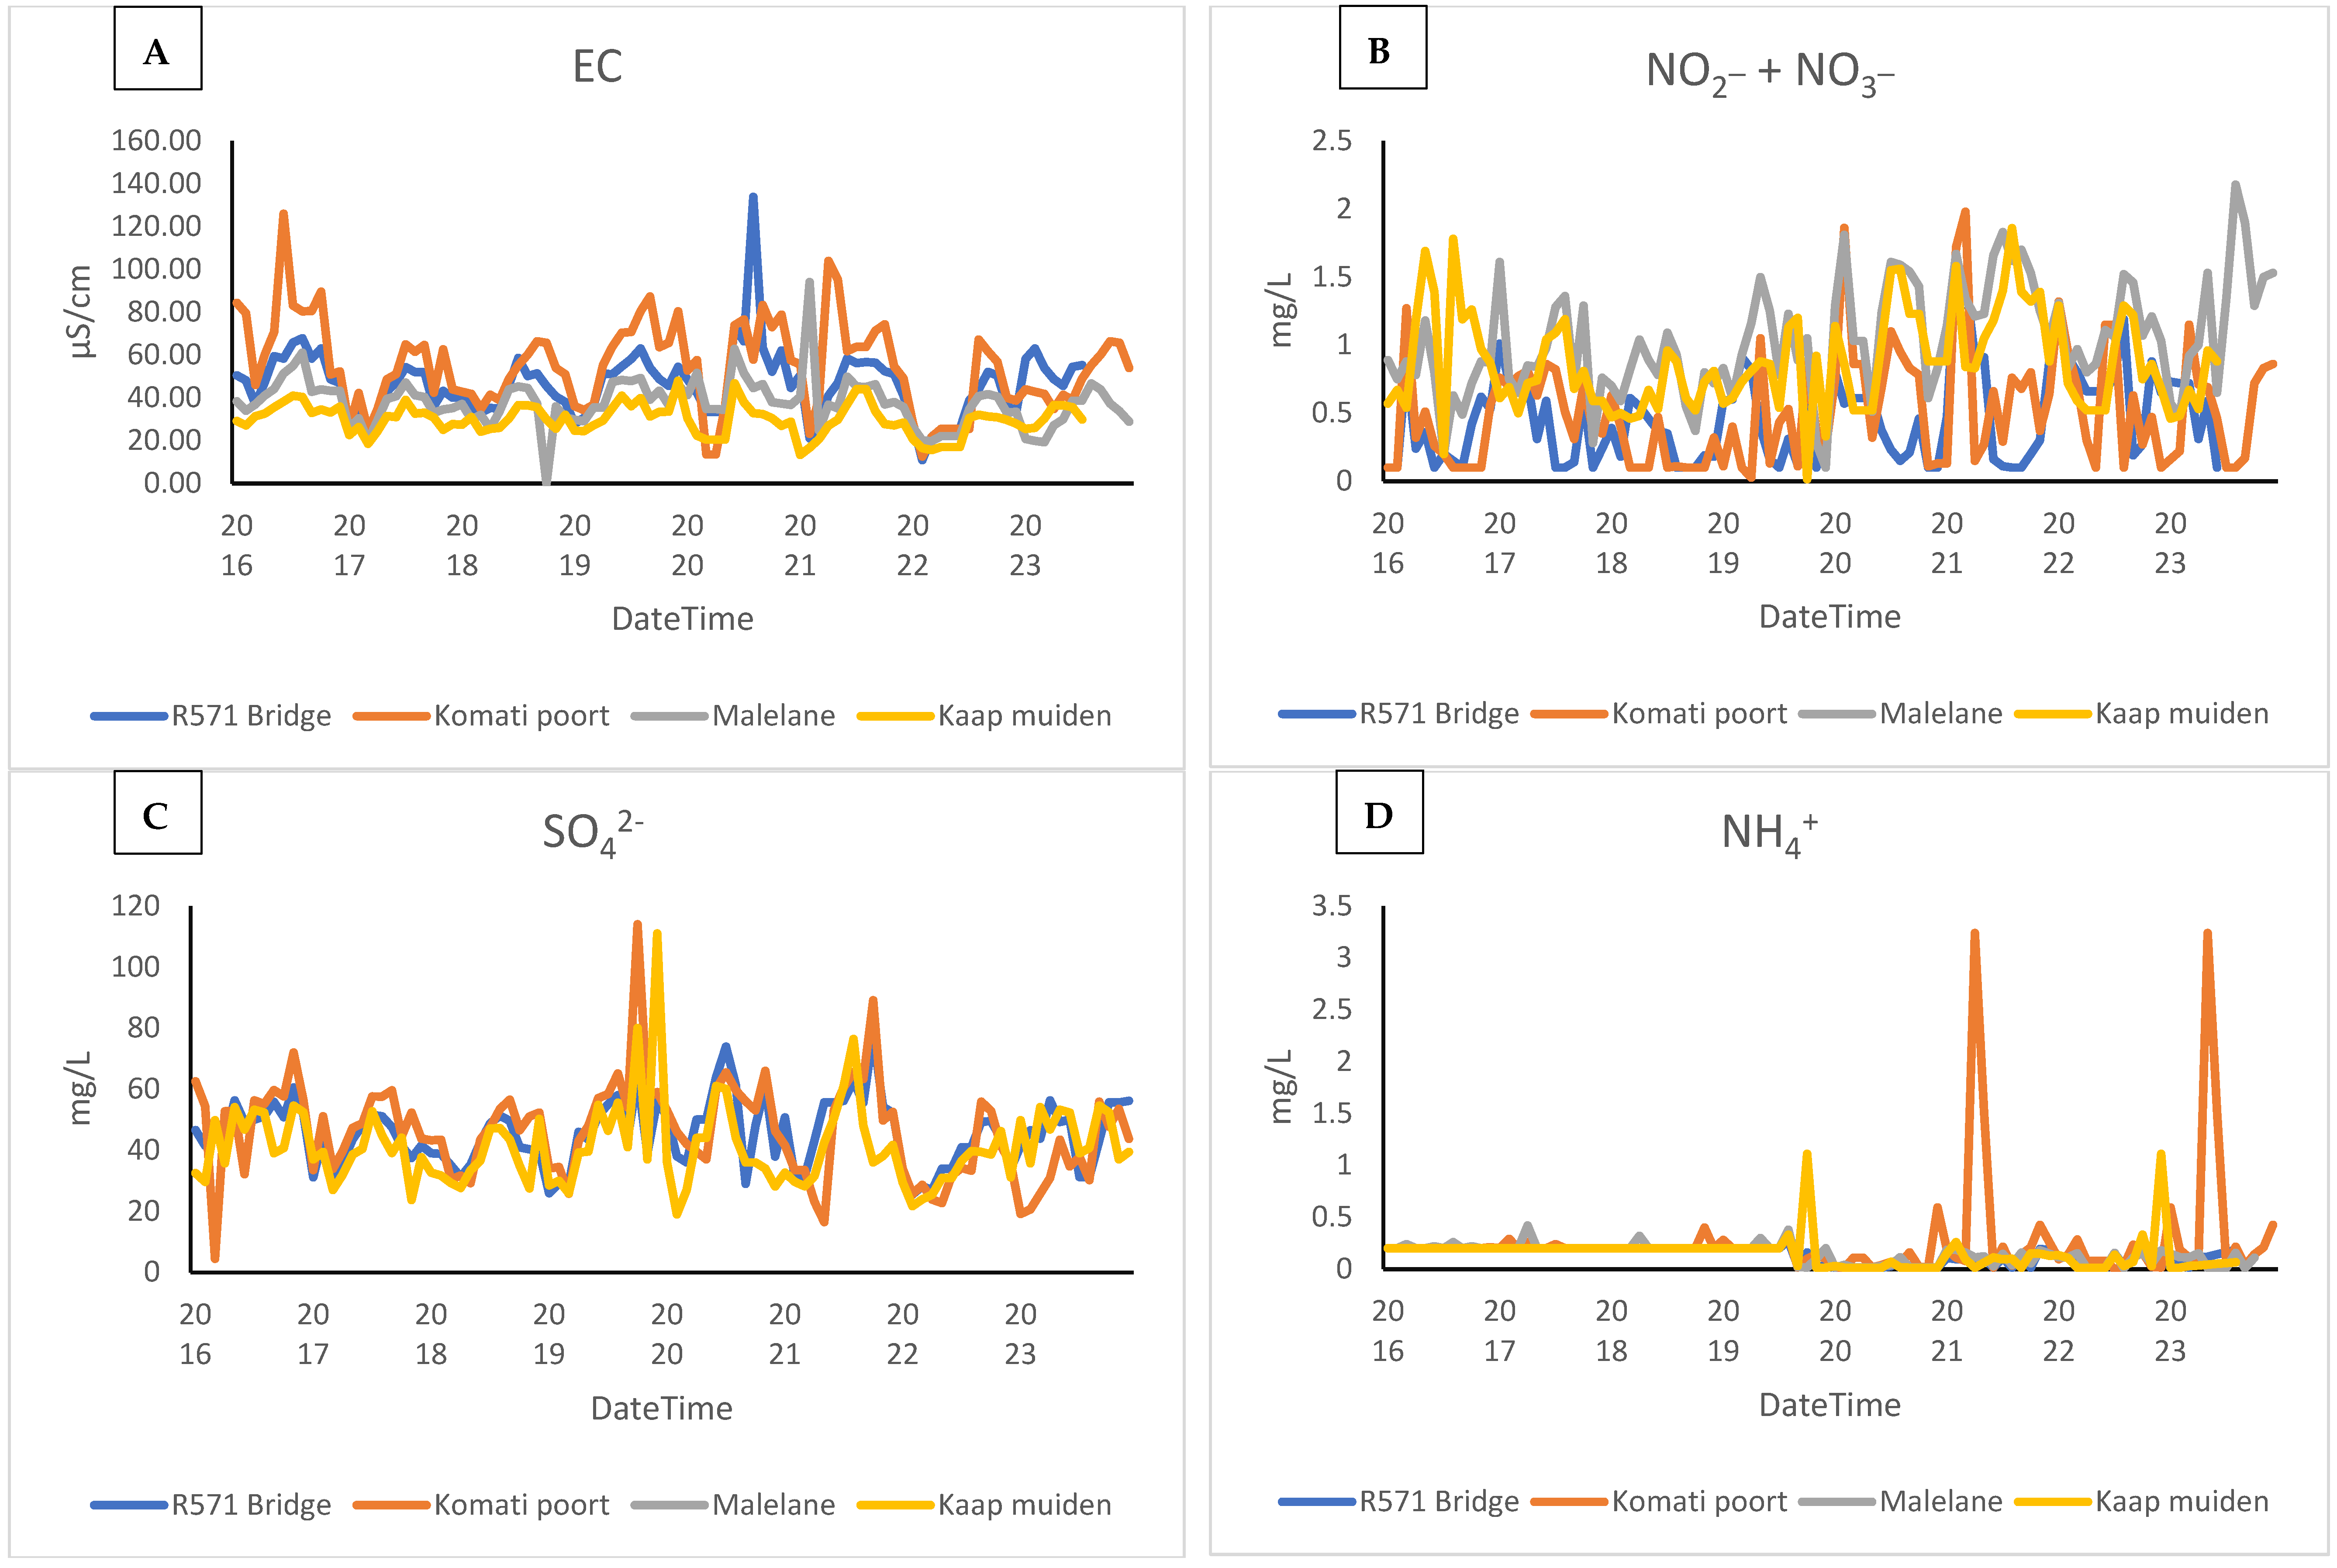
Figure 2A illustrates the results of electrical conductivity (EC) across all four different sites that were sampled as detailed in the methodology section. The concentration levels of EC generally exceeded the prescribed legal limit of 30 µs/cm in South Africa’s water guideline (shown in Table 1). The analysis of the spatiotemporal distribution of EC indicates that the Malelane and Kaapmuiden sampling sites had the lowest average concentration of EC. In these regions, the mean average concentration was found to be 39.72 µs/cm and 30.34 µs/cm, respectively. R571 Bridge (mean = 46.71) and Komatipoort (mean = 58.67) had the highest mean average concentrations of EC during 2016–2023 and 2016–2019, respectively. The high level of EC can be attributed to the anthropogenic agricultural activities taking place in these two locations. Furthermore, the result from this study shows that there is a significant variation (p ≤ 0.001) of EC at the four sites, and it was also noted that EC exceeds the limits set by DWS (Table 1). The spatiotemporal distribution trend of EC in Komatipoort proved to be relatively compliant over time, except for 2016, whereby the concentration levels were slightly above South Africa’s water guideline (Table 1), as observed in Figure 2A. Pollution runoff caused by sugarcane farming and private nature reserves outside the national park’s boundary is the primary cause of elevated EC concentrations in this bridge (R571). Furthermore, the R571 Bridge study site exceeded the prescribed freshwater water quality guidelines. Most spatiotemporal concentrations exceeded the water quality limits. It should be noted that there were exceptions, such as Kaapmuiden and Malelane in 2017, 2018, and 2019 (Figure 2A), which were compliant with the guidelines. The spatiotemporal distribution of EC was statistically significant at p = 0.001 and therefore validated this observation.
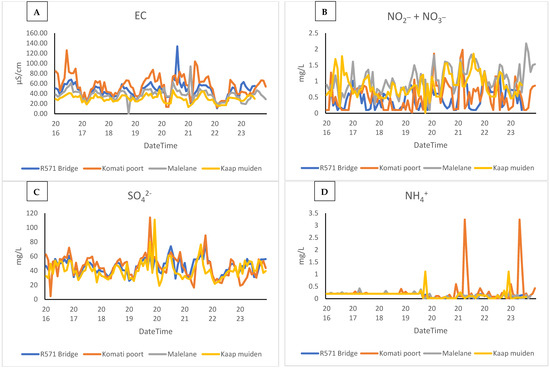
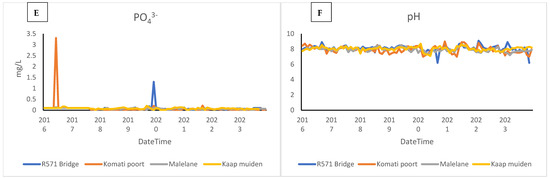
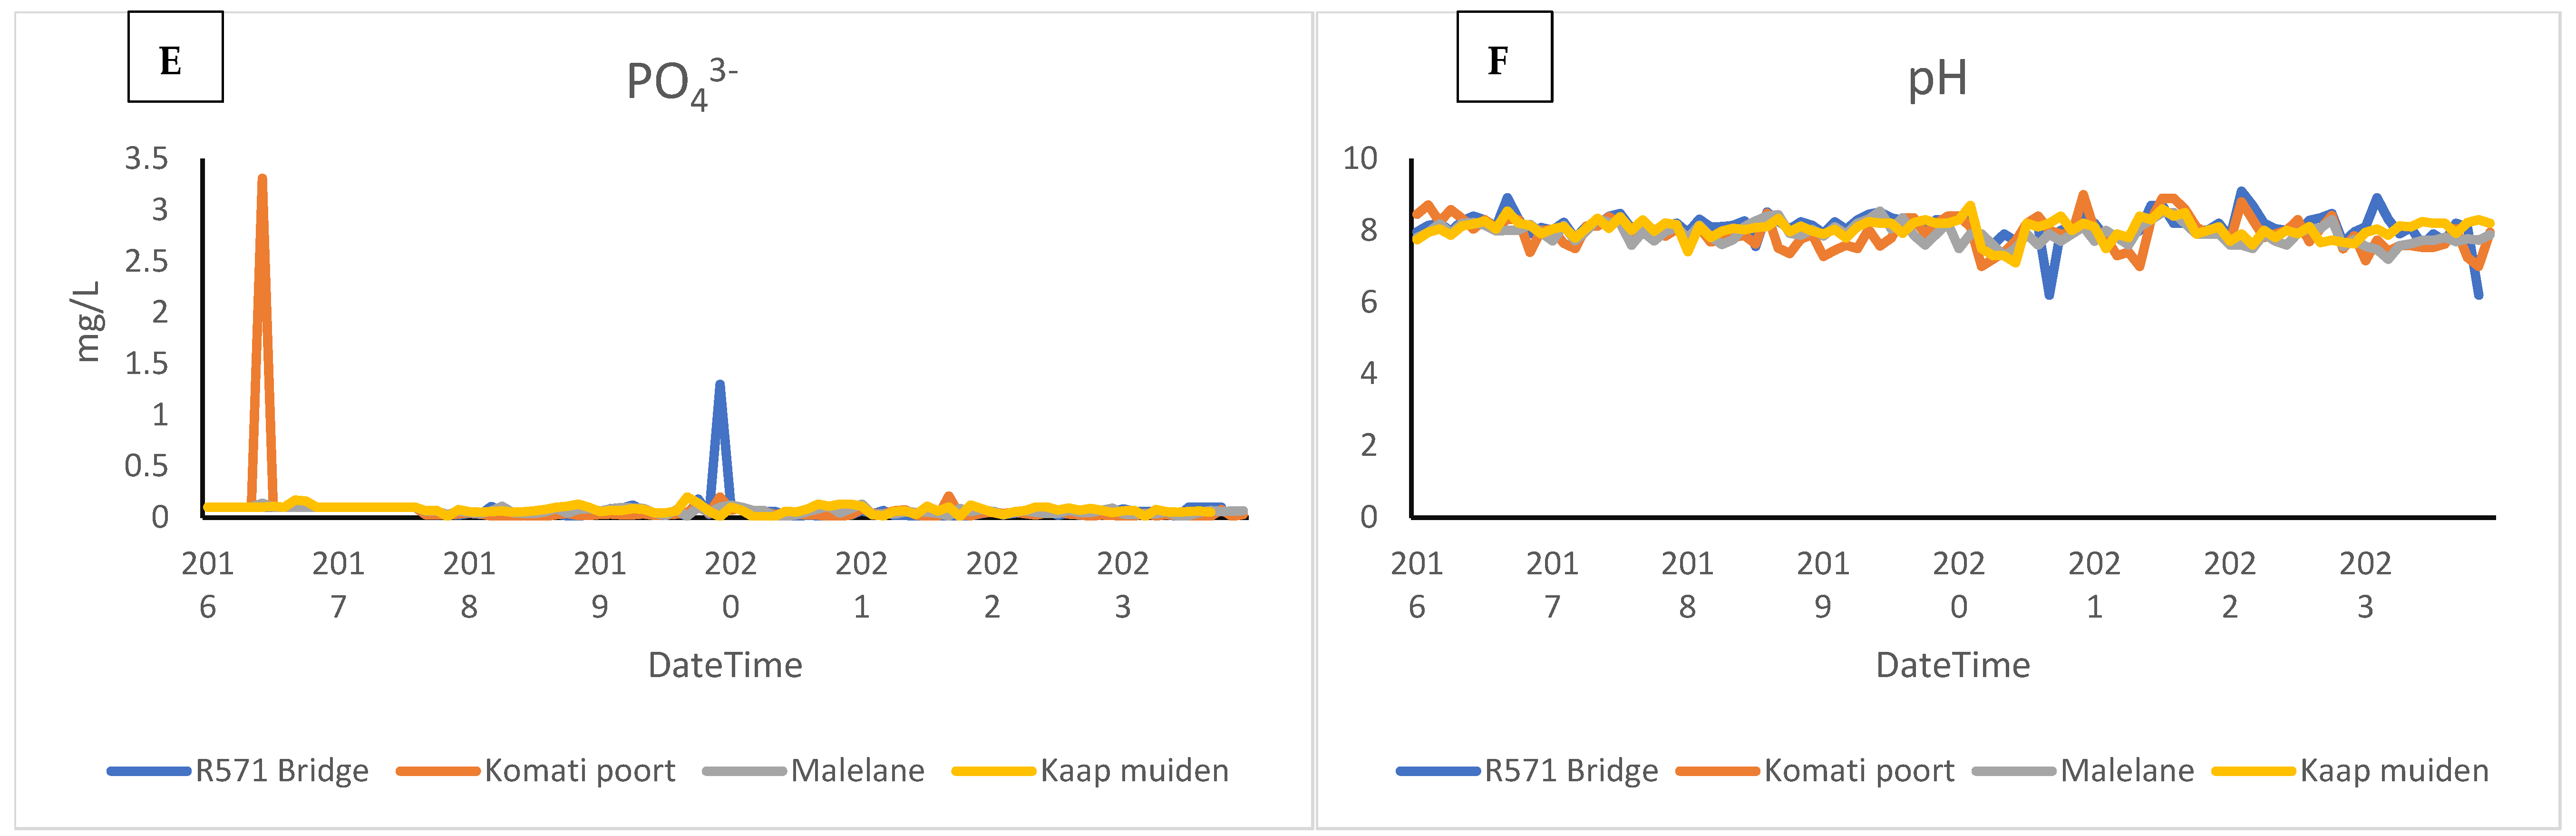
Figure 2.
The hydrographs of observed parameters in the four sites in the Crocodile River: (A) electrical conductivity, (B) nitrate and nitrite, (C) sulphate; (D) ammonia-nitrogen, (E) phosphate, (F) pH.
Furthermore, Figure 2B indicates the spatiotemporal variation of nitrite and nitrate concentration in the Crocodile River. As a result, Figure 2B shows that the fluctuations of nitrogen were, in some instances, well below the normal levels of 1 mg/L, whilst in some study sites, it was observed to be high but not exceeding the prescribed levels. Accordingly, Figure 2B shows that the highest nitrite and nitrate concentrations were observed across Malelane in 2020 (1.76 mg/L). Between 2021 and 2022, 1.77 mg/L was recorded in Kaapmuiden. As shown in Figure 2B, Kaapmuiden and Malelane generally recorded the highest concentrations of nitrite and nitrate at the beginning of the year between 2016 and 2017. This observation provides context for the spatial and temporal variation of nitrogen compounds in the Crocodile River as a result of land use. Due to the dispersed nature of the system characterized by the unpredictable occurrence of discharges and intricate transport processes, which provide challenges to water resource management, agricultural water pollution has received inadequate attention. Subsequently, these two regions (sites) possess a strong agricultural sector with a highly developed business sector, as well as a rural sector that caters to subsistence farming. However, agriculture has a significant impact on the quality of surface water and groundwater, both directly and indirectly. It is a major contributor to the deterioration of water quality in many regions, largely owing to the presence of high levels of nitrates.
The spatiotemporal investigation indicates that the elevated concentrations above 100 mg/L of SO42− were observed to be highly concentrated across Kaapmuiden and Komatipoort in the year 2020. As shown in Figure 2C, it is intriguing that, in the same year, the concentrations in these two study areas were comparable. Komatipoort measured concentrations of sulphate slightly higher than 110 mg/L, while Kaapmuiden measured 108 mg/L. Even the spatiotemporal distribution of SO42− indicates that, across the board, the mean averages in R571 (mean = 45.48), Komatipoort (mean = 48.10), and Kaapmuiden (mean = 40.71) were excessively high. These concentrations far exceed the prescribed legal limit of 30 mg/L in the Crocodile River. Even though the elevated concentrations of sulphate found in the R571 Bridge may be attributable to the washout of pollutants from mining operations in the surrounding areas of Kaapmuiden and Komatipoort, which then flow into the R571 Bridge, it is important to note that this is only one of several possible explanations. However, in the same study sites, Figure 2D demonstrates that the ammonia concentration levels were constantly stable below the prescribed limit of 1 mg/L in 2016–2019 before an exponential increase of ammonia concentration levels was recorded in 2020, reaching levels above 1.0 mg/L. Other than that, the concentrations of ammonia were lower than the mean average of 0.18 mg/L across the four study sites in the Crocodile River (Figure 2D), proving to be lower than the prescribed legal limit of 1 mg/L. The variation showed no significant difference (p > 0.950) between the study areas.
Conversely, it can be shown that the levels of phosphate concentrations in the sampling points, as depicted in Figure 2E, were generally low from 2016 to 2023. Be as it may, it is worth noting that, in contrast, the concentration in Komatipoort exceeded 3.0 mg/L during the years 2016 and 2017. In the year 2020, a similar trend was observed at R571 Bridge, where the concentration of phosphate exceeded 1.0 mg/L. During these years, both Komatipoort and R571 Bridge had elevated concentrations in their water resources that exceeded the 0.125 mg/L limit prescribed for these study areas (Figure 2E). While the spatiotemporal distribution concentration levels of Komatipoort were relatively above the prescribed limit with a mean average of 0.13 mg/L, the mean average of R571 Bridge fell below the prescribed limit, which is 0.125 mg/L. In general, the spatial and temporal concentration distribution levels of R571 Bridge were within the prescribed limit. The statistical inferences, which indicated that the results were not significant (p = 0.668), validated the observed spatiotemporal variation and concluded that the results were not significant.
The levels of pH in the Crocodile River were, on average, clustered across 8.0, except for R571 Bridge, which recorded acidic pH levels below 6.5 between 2020 and 2021. This was before the levels increased in the following year 2022 to slightly exceed the alkaline levels of 9.0, as shown in Figure 2F. Be that as it may, the majority of the pH levels in the Crocodile River were well within the prescribed legal limit, which ranged between 6.5–8.0, during 2016–2023. Individuals’ intentional or unintentional dumping of chemicals into a body of water is another factor that can affect the pH. This chemical contamination can be caused by improper disposal of packaging material (e.g., bags) into streams, allowing pollutants to enter the water directly. Additionally, the acidity of the surrounding environment can impact the pH of water. This is most noticeable in mining regions, but it can also occur naturally. Acid runoff depletes the water’s alkalinity and decreases its pH below the optimal range.
3.2. Seasonal Variation Water Quality Parameters across Different Sites in the Crocodile River
The heatmaps demonstrate the behaviour of the water quality parameters concerning the year and the season. The spatiotemporal investigation indicates that during the spring and winter seasons, there was an increase in the concentration levels of EC in the 2016 and 2020 time periods. These high values of electrical conductivity demonstrated in the heat map (Figure 3A) were both recorded in 2016 during the winter and spring seasons. A similar trend was noticed in the 2020 winter as well as the 2020 spring seasons in Komatipoort and R571 Bridge. These results displayed a similar pattern observed from the results in Figure 2. The high values of EC during these respective seasons are attributed to prevailing planting activities. Moreover, the results from this study showed that there is no significant variation (p = 0.0947) in season across the four sites. In this instance, the levels of EC were within the range of 50–60 µs/cm as shown in Figure 3A. A comparable pattern of EC was noted in the year 2019 within the identical seasons (winter and spring) and locations (Komatipoort and R571 Bridge). During this tenure, the concentrations of EC ranged between 50–55 µs/cm, indicating a slight decrease in contrast to the 2016 and 2020 observations (Figure 3A). The simultaneous contrasts of Figure 2A and Figure 3A suggest that notable higher concentrations in these specific years and seasons were recorded in the R571 Bridge and Komatipoort study areas. In these sites, the highest levels of concern for electrical conductivity were 60µs/cm for R571 and approximately 80 µs/cm in Komatipoort during the winter season (Figure 3A). Thus, there was no significant difference (p = 0.947) in the seasonal variation between spring and winter concentrations of EC in Komatipoort and R571 Bridge as highlighted in Table S1. Moreover, the present study observed a decrease in electrical conductivity concentrations during the summer and autumn seasons of 2016, as compared to the other seasons within the same year. The aforementioned observations occurred in Kaapmuiden and Malelane. However, high concentrations persisted at these study sites during the winter and spring seasons of 2016, 2019, and 2020.
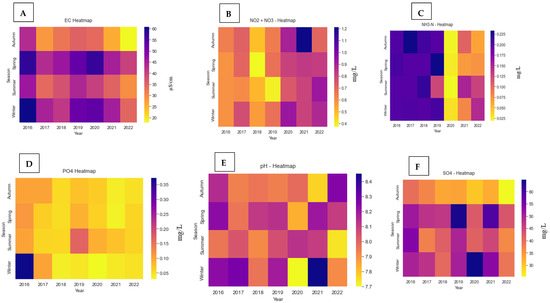
Figure 3.
Heatmaps of the seasonal variation of the following parameters: (A) electrical conductivity, (B) nitrate and nitrite, (C) phosphorus, (D) ammonium, (E) pH, (F) sulphate.
The seasonal spatiotemporal comparisons of nitrite and nitrate (Figure 3B) indicates no particular differences in the form of the observed trend during 2016–2022 (summer, autumn, winter, and spring). That is, the concentration levels were relatively comparable in most cases across the 2016–2022 period. This observation is validated by the statistical inferences in Table S1, which indicate that across the seasons, there was no significant variation (p > 0.05) of nitrate and nitrate levels. However, there were observed occurrences of elevated levels of nitrite and nitrate concentrations during the autumn season at Malelane and R571 Bridge (2021), as well as during the winter season at Kaapmuiden and Malelane, in the year 2020. This finding is not surprising, considering that earlier observations also revealed elevated levels of EC in the same regions during the same year. Therefore, the results of the elevated concentration of nitrite and nitrate in all the sites can be attributed to the fact that a high level of EC is influenced by the presence of high nitrate ion concentrations.
Furthermore, the seasonal time graphs depicting ammonia levels (Figure 3C) showed that higher amounts of ammonia were detected across the study regions (Malelane, Kaapmuiden, R571 Bridge, and Komatipport) for the 2016–2019 period, encompassing all four seasons (summer, autumn, winter, and spring), although the detected levels were below the DWS prescribed limits as stipulated in Table 1. This observation is not startling as the Crocodile River is characterised by human-induced agricultural practices that use ammonia-based fertilizers to enhance crop growth. Moreover, it was interesting to observe that the findings in Figure 3C were generally comparable across all four geographical locations during 2016–2019. This is corroborated by the statistical inferences in Table S1, which shows that seasonal variation was not statistically significant at p = 0.950. Notwithstanding the consistency in the spatiotemporal behaviour of ammonia the was an observed increase in concentration levels from 2016 to 2019, to some extent, both spatially and temporally, in contrast to the subsequent period of 2020 to 2023.
During this specific period (2016–2019), the seasons exhibited the highest recorded levels of ammonia concentration, except for the summer season in 2019. Interestingly, during 2020–2022, there was no substantial conspicuous seasonal spatiotemporal variation, as concentration levels of ammonia were lower than 0.050 mg/L across all seasons. That is, as of 2020–2023, ammonia seasonal levels were comparable in Kaapmuiden, Komatipoort, R571 Bridge, and Malelane. Furthermore, this is an indication that there was improvement in the water quality of the Crocodile River. The observed phenomenon can be attributed to the strategic timing of ammonia usage in the region of the Crocodile River, which is determined by the unique requirements of the cultivated plant species and the employed cropping strategy.
The heatmap for phosphate results indicates that both spatially and temporally high levels of phosphate were only detected during the summer and winter seasons as depicted in Figure 3D. These elevated levels were detected in R571 Bridge and Komatipoort in the respective years of 2016 and 2019. In this instance, the concentration levels of phosphate were above 0.3 and 1 mg/L, respectively. The excessive application of fertilizers containing phosphates in the Komatipoort agricultural farming practices, as well as the discharge of surplus phosphates into adjacent water bodies washing out into R571 Bridge, in this period has the potential to result in elevated levels. Nevertheless, during the 2017–2022 period, phosphate concentrations exhibited a consistently low spatiotemporal seasonal pattern across all seasons.
According to the results in Figure 3E, summer, autumn, winter, and spring seasons recorded low pH levels, which were within the limit of 8 across Kaapmuiden, Malelane, Komatipoort, and R571 Bridge. However, excessive values of pH above 8 were recorded in the winter season during 2021 in R571 Bridge. Moreover, the statistical inferences showed a significant spatiotemporal variation of concentrations (p = 0.023). These results observed a similar pattern to those shown in Figure 2F. That is, the spatiotemporal variation had little to no influence on the pH levels of the Crocodile River. Furthermore, spring recorded high levels of sulphate in all seasons during the study period of 2019 (above 60 mg/L) and 2021 (above 60 mg/L) in Komatipoort and at the R571 Bridge. During this tenure, these comparable elevated concentrations of sulphate were consistently observed. They were further comparable to the 2020 high sulphate levels (above 50 mg/L), which were recorded during the winter season. This was evidence that in these particular years and seasons, sulphate had exceeded the prescribed levels by more than fifty-fold in Komatipoort and at the R571 Bridge. The mining and agriculture human-induced activities are the main culprits for the observed high levels of sulphate in these areas. This is an indication that during these seasonal periods, the water quality of the Crocodile River deteriorated, thus placing the ecosystem integrity of the Crocodile River at risk.
4. Discussion
The current study determined the water status of the Crocodile River and the effects of geographical locations, as well as time periods, on its water quality. The period 2016–2023 shows a fluctuation in the spatiotemporal water quality. There was an indication of high variability in the water quality over different time periods and sites of the Crocodile River. The findings of the current study discovered that the 2016–2023 period shows a fluctuation in the seasonal spatiotemporal water quality. That is, there was an indication of high variability in the water quality over different time periods and sites of the Crocodile River. The variability of the water quality could have been influenced by spatiotemporal land use as well as human activities. For instance, electrical conductivity is an important parameter used to assess the overall quality of water, as it detects any changes in the water resource [35]. This seasonal spatiotemporal fluctuation of EC concentration contrasts with the seasonal spatiotemporal observations reported by De Klerk et al. [36]. De Klerk et al. [36] indicated that the seasonal spatiotemporal variation of EC remained relatively the same in Mpumalanga Highveld, South Africa. In general, the water resource recorded elevated levels of electrical conductivity in the Crocodile River. The electrical conductivity of water resources is primarily impacted by the activities of the area through which they flow, as some of the elevated risky concentrations were recorded during the dry season in winter in the Crocodile River. However, the elevated concentration observed in spring could be associated with the rainy season, which accounts for the washout of contaminants from polluting sources into water resources during heavy summer rainfall. A similar trend that demonstrates elevated concentrations of EC in the summer season has been documented by Manyatshe et al. [37]. Hence, in some of the study sites, the results show that the concentration levels exceeded the prescribed legal limit of South Africa’s water guidelines [38,39]. These concentrations were significantly higher than the EC levels reported in the surface water of the South African Highveld [40]. They were, however, not higher than the concentration levels recorded in the Middle Vaal River [41]. The spatiotemporal variability in the Crocodile River is motivated by the anthropogenic activities within the vicinity of the water resource, as postulated by Mainali and Chang [42]. This is an indication that there might be pollution discharges within the vicinity of the water resource that contravene the water use license limits.
This stance corroborates that urbanization and industrialization in the vicinity of the Crocodile River indeed have detrimental effects on the conductivity of the water, as previously posited by Haarhoff et al. [43]. In this case, it is likely that agricultural practices add fertilizers that may contain soluble salts that, when absorbed into the water, enhance the EC of the water resource [44]. Furthermore, the occasional trend in the exponential increase of phosphate concentrations in freshwater is a concern, given that it is responsible for increasing the nutrient loads in water resources. However, the occasional trend in the seasonal spatiotemporal increase of the concentration is consistent with discoveries documented by Shabalala et al. [45] in Kwazulu-Natal, South Africa.
For instance, “phosphate tends to show little seasonal variation, with concentrations increasing slightly during periods of low run-off and during the dry season”. Moreover, the prescribed legal limit for phosphate in the Crocodile River, to minimize the increase of the proliferation of alien aquatic plants in freshwater systems, of 0.125mg/L was exceeded. This observation is not startling, considering that Malelane and R571 are sites that are characterized by intensive anthropogenic activities centred on agriculture. That is, the application of fertilizers containing phosphates in the agricultural practice could contribute phosphates to the water resource, subsequently leading to the presence of the current recorded elevated concentrations of phosphates in the study sites. According to Schilling and Wolter [46], agricultural activities have the potential to contaminate water bodies, and the accumulation of these impacts might result in a gradual deterioration of water quality. This observation is not startling, especially since the Crocodile River is bordered by agricultural activities [47,48]. Consequently, there is a significant likelihood of eutrophic processes occurring in the Crocodile River. Hence, in the present investigation, decreasing the levels of phosphate concentration effectively results in the reduction of nutrient enrichment and the likelihood of eutrophication in the Crocodile River. This discovery reflects the previously published results in the Crocodile River within the Komati-Lomati River basin [49]. Similar to the Crocodile River, van der Laan et al. [49] cited the agricultural activities within the vicinity as the sources for elevated concentrations of phosphates observed across the water resource. Given the phosphate concentration, the presence of elevated ammonia levels in some instances in the Crocodile River is not startling.
On the other hand, the Crocodile River phosphate concentrations were often lower than that recorded in Nuwejaars River reported by Khungwayo [50]. In other comparisons, Masindi et al. [51], observed phosphate and ammonia behaviour patterns, similar to that observed in the Crocodile River, in the Sand River basin in Mpumalanga, South Africa. It is important to note that ammonia is an important parameter in water quality assessment as it can indicate contamination and potential risks to aquatic life. As a result, the environmental limitations for ammonia in surface water in South Africa’s Crocodile River are curbed as low as possible at 1 mg/L. However, the spatiotemporal concentration levels of ammonia in the Crocodile River, if continued unabated, presents the risk of highly toxic effects. In general, the ammonia behaviour in the Crocodile River is similar to the long-term water quality evaluation detection recorded by Mararakanye et al. [52] in a large semi-arid catchment in South Africa under comparable land use.
Mining operations and agricultural activities contribute significantly to Crocodile River water resource concentrations within the radius of Kaapmuiden and Malelane. The contribution of previous mine workings, which drain into the Kaapriver in Kaapmuiden, is evident in the concentration levels of sulphate within the water resource. However, this observation does not invalidate the fact that sulphates are inherently found in almost all natural water resources. Although, where elevated concentrations are observed, it is probably exacerbated by anthropogenic activities such as agriculture and mining [12]. Hence, it is not startling that in the Crocodile River, the highest concentrations of sulphate were observed within Kaapmuiden and Komatipoort. To be exact, Komatipoort recorded concentrations of sulphate slightly above 110 mg/L, whilst Kaapmuiden only recorded 108 mg/L. These concentrations far exceed the prescribed legal limit of 30 mg/L in the Crocodile River. Additionally, they are comparable to sulphate concentrations reported in the Middle Vaal River encompassed by goldmines [41].
5. Conclusions
Water pollution is a global issue, and safeguarding water resources from pollutants is crucial for achieving sustainable development. Results from the current study provide insight into the status of the spatiotemporal water quality in the Crocodile River. The period 2016–2023 shows the fluctuations of the spatiotemporal water quality parameters. Across the board, there was an indication of high variability in water quality parameters across different time periods and sites of the Crocodile River. This was characterised by non-compliance in some instances, thus violating the conditions of license use. This was mostly corroborated by the spatiotemporal investigations of the electrical conductivity as well as sulphate concentration fluctuations that exceeded prescribed limits over time in the Crocodile River. That is, electrical conductivity and phosphate concentrations were high at different geographical locations during different months. In essence, the spatiotemporal investigation indicates that Kaapmuiden, Malelane, R571 Bridge, and Komatipoort all exceeded the prescribed limits of sulphate and EC in the Crocodile River. Elevated concentrations of concern were recorded during the winter and spring seasons, as demonstrated in Figure 3. This is an indication that, generally, the water quality of the Crocodile River deteriorates over time due to these parameters of concern. It is important to monitor these parameters as, for example, the addition of even a small amount of phosphate to surface water can have negative consequences for water quality. Hence, long-term compliance with DWS-prescribed limits is of utmost importance to safeguard aquatic systems. In conclusion, the overall impact of contamination, indicated by exceeding the prescribed legal limit, on the water quality of the Crocodile River could pose significant risks to the environment but also provides valuable information for the management of integrated water resources moving forward.
6. Recommendations
Given the fluctuations observed in the spatiotemporal water quality parameters, it is fundamental to establish comprehensive, long-term monitoring programs. These programs should include continuous data collection across multiple seasons and at various sites along the river. This will assist in identifying patterns, trends, and potential differences in water quality, particularly in relation to electrical conductivity and sulphate concentrations. Moreover, to effectively mitigate pollution, future research studies should focus on identifying and quantifying the specific sources of contaminants, such as sulphates and phosphates, entering the Crocodile River. This could involve detailed studies on land use patterns, industrial discharges, agricultural runoff, and other anthropogenic activities within the catchment area.
Supplementary Materials
The following supporting information can be downloaded at: https://www.mdpi.com/article/10.3390/w16172457/s1, Table S1: ANOVA multivariate analysis for water quality parameters.
Author Contributions
Conceptualization, B.S.M., T.T.P., X.S.G. and B.G.; Methodology, K.C.M., X.S.G. and T.G.N.; Validation, T.M.; Formal analysis, K.C.M., B.G. and S.S.N.; Investigation, B.S.M., T.M., B.G., B.S.C. and S.S.N.; Resources, T.T.P.; Data curation, T.M., B.S.C. and S.S.N.; Writing–original draft, B.S.M.; Writing–review & editing, K.C.M., T.M., T.T.P., X.S.G., B.G., B.S.C., S.S.N. and T.G.N.; Visualization, T.T.P.; Project administration, X.S.G. and B.S.C. All authors have read and agreed to the published version of the manuscript.
Funding
This research received no external funding.
Data Availability Statement
Data available on request from the authors. The data that support the findings of this study are available from the corresponding author, [Madonsela B.S.], upon reasonable request.
Acknowledgments
The authors would like to acknowledge the anonymous reviewers for taking their time and reviewing this work. Gratitude is also extended to the department of water and sanitation in Mpumalanga province.
Conflicts of Interest
The authors affirm that they have no known financial or interpersonal conflicts that might have appeared to have influenced the research presented in this paper.
References
- Monteiro, M.; Costa, M. A time series model comparison for monitoring and forecasting water quality variables. Hydrology 2018, 5, 37. [Google Scholar] [CrossRef]
- Mustafa, A.S.; Sulaiman, S.O.; Shahooth, S.H. Application of QUAL2K for Water Quality Modeling and Management in the lower reach of the Diyala river. Iraqi J. Civ. Eng. 2017, 11, 66–80. [Google Scholar] [CrossRef]
- Tung, T.M.; Yaseen, Z.M. A survey on river water quality modelling using artificial intelligence models: 2000–2020. J. Hydrol. 2020, 585, 124670. [Google Scholar]
- Parmar, K.S.; Bhardwaj, R. Statistical, time series, and fractal analysis of full stretch of river Yamuna (India) for water quality management. Environ. Sci. Pollut. Res. 2015, 22, 397–414. [Google Scholar] [CrossRef]
- Mbanga, J.; Abia, A.L.; Amoako, D.G.; Essack, S.Y. Quantitative microbial risk assessment for waterborne pathogens in a wastewater treatment plant and its receiving surface water body. BMC Microbiol. 2020, 20, 346. [Google Scholar] [CrossRef]
- Gqomfa, B.; Maphanga, T.; Shale, K. The impact of informal settlement on water quality of Diep River in Dunoon. Sustain. Water Resour. Manag. 2022, 8, 27. [Google Scholar]
- Gqomfa, B.; Maphanga, T.; Phungela, T.T.; Madonsela, B.; Malakane, K.; Lekata, S. El Niño southern oscillation (ENSO) implication towards crocodile river water quality in South Africa. Sustainability 2023, 15, 11125. [Google Scholar] [CrossRef]
- Phungela, T.A.; Gqomfa, B.A.; Maphanga, T.H.; Shale, K.A. The impact of wastewater treatment effluent on water resources: A South African perspective. Water Law 2021, 27, 140–148. [Google Scholar]
- Sun, G.H.; Shen, Y.; Xu, Y.M.; Shi, G.L.; Hu, J. Time series analysis and forecast model for water quality of yellow river based on Box-Jenkins method. J. Agro Environ. Sci. 2011, 30, 1888–1895. [Google Scholar]
- Molekoa, M.D.; Avtar, R.; Kumar, P.; Thu Minh, H.V.; Dasgupta, R.; Johnson, B.A.; Sahu, N.; Verma, R.L.; Yunus, A.P. Spatio-temporal analysis of surface water quality in Mokopane area, Limpopo, South Africa. Water 2021, 13, 220. [Google Scholar] [CrossRef]
- Malakane, K.C.; Maphanga, T.; Madonsela, B.S. Assessing the Spatio-temporal variation of water quality over time at Malelane area in the lower catchment of the Crocodile River, Mpumalanga, South Africa. Anthropog. Pollut. 2024, 8, 1–11. [Google Scholar]
- Maphanga, T.; Chidi, B.; Phungela, T.T.; Gqomfa, B.; Madonsela, B.S.; Malakane, K.C.; Lekata, S.; Shale, K. The interplay between temporal and seasonal distribution of heavy metals and physiochemical properties in Kaap River. Int. J. Environ. Sci. Technol. 2024, 21, 6053–6064. [Google Scholar] [CrossRef]
- Zeinalzadeh, K.; Rezaei, E. Determining spatial and temporal changes of surface water quality using principal component analysis. J. Hydrol. Reg. Stud. 2017, 13, 1–10. [Google Scholar] [CrossRef]
- Kwong, I.H.; Wong, F.K.; Fung, T. Automatic mapping and monitoring of marine water quality parameters in Hong Kong using Sentinel-2 image time-series and Google Earth Engine cloud computing. Front. Mar. Sci. 2022, 9, 871470. [Google Scholar] [CrossRef]
- de Andrade Costa, D.; Soares de Azevedo, J.P.; Dos Santos, M.A.; Vinhaes Assumpção, R. Water quality assessment based on multivariate statistics and water quality index of a strategic river in the Brazilian Atlantic Forest. Sci. Rep. 2020, 10, 22038. [Google Scholar] [CrossRef]
- Taheri Tizro, A.; Ghashghaie, M.; Georgiou, P.; Voudouris, K. Time series analysis of water quality parameters. J. Appl. Res. Water Wastewater 2014, 1, 40–50. [Google Scholar]
- Schwarzenbach, R.P.; Egli, T.; Hofstetter, T.B.; Von Gunten, U.; Wehrli, B. Global water pollution and human health. Annu. Rev. Environ. Resour. 2010, 35, 109–136. [Google Scholar] [CrossRef]
- Wu, Z.; Wang, X.; Chen, Y.; Cai, Y.; Deng, J. Assessing river water quality using water quality index in Lake Taihu Basin, China. Sci. Total Environ. 2018, 612, 914–922. [Google Scholar] [CrossRef]
- Benvenuti, T.; Kieling-Rubio, M.A.; Klauck, C.; Rodrigues, M.A. Evaluation of water quality at the source of streams of the Sinos River Basin, southern Brazil. Braz. J. Biol. 2015, 75, 98–104. [Google Scholar] [CrossRef]
- Gqomfa, B.; Maphanga, T.; Madonsela, B.S. An Analysis of the Effects that South Africa’s Informal Settlements have had on the Country’s River Systems. Nat. Environ. Pollut. Technol. 2023, 22, 1833–1843. [Google Scholar] [CrossRef]
- Maphanga, T.; Madonsela, B.S.; Chidi, B.S.; Shale, K.; Munjonji, L.; Lekata, S. The effect of rainfall on Escherichia coli and chemical oxygen demand in the effluent discharge from the Crocodile River wastewater treatment; South Africa. Water 2022, 14, 2802. [Google Scholar] [CrossRef]
- Faruk, D.Ö. A hybrid neural network and ARIMA model for water quality time series prediction. Eng. Appl. Artif. Intell. 2010, 23, 586–594. [Google Scholar] [CrossRef]
- Duan, W.; He, B.; Takara, K.; Luo, P.; Nover, D.; Sahu, N.; Yamashiki, Y. Spatiotemporal evaluation of water quality incidents in Japan between 1996 and 2007. Chemosphere 2013, 93, 946–953. [Google Scholar] [CrossRef]
- Luo, P.; He, B.; Takara, K.; Razafindrabe, B.H.; Nover, D.; Yamashiki, Y. Spatiotemporal trend analysis of recent river water quality conditions in Japan. J. Environ. Monit. 2011, 13, 2819–2829. [Google Scholar] [CrossRef]
- Mahmoodi, N.; Osati, K.; Salajegheh, A.; Saravi, M.M. Trend in river water quality: Tracking the overall impacts of climate change and human activities on water quality in the Dez River Basin. J. Water Health 2021, 19, 159–173. [Google Scholar] [CrossRef]
- Hashim, M.; Nayan, N.; Setyowati, D.L.; Said, Z.M.; Mahat, H.; Saleh, Y. Analysis of water quality trends using the Mann-Kendall test and Sen’s Estimator of Slope in a tropical river basin. Pollution 2021, 7, 933–942. [Google Scholar]
- Elhag, M.; Gitas, I.; Othman, A.; Bahrawi, J.; Psilovikos, A.; Al-Amri, N. Time series analysis of remotely sensed water quality parameters in arid environments, Saudi Arabia. Environ. Dev. Sustain. 2021, 23, 1392–1410. [Google Scholar] [CrossRef]
- Kumar, P. Numerical quantification of current status quo and future prediction of water quality in eight Asian megacities: Challenges and opportunities for sustainable water management. Environ. Monit. Assess. 2019, 191, 319. [Google Scholar] [CrossRef]
- Kazi, T.G.; Arain, M.B.; Jamali, M.K.; Jalbani, N.; Afridi, H.I.; Sarfraz, R.A.; Baig, J.A.; Shah, A.Q. Assessment of water quality of polluted lake using multivariate statistical techniques: A case study. Ecotoxicol. Environ. Saf. 2009, 72, 301–309. [Google Scholar] [CrossRef]
- Bedim Godoy, R.F.; Crisiogiovanni, E.L.; Trevisan, E.; Dias Radomski, F.A. Spatial and temporal variation of water quality in a watershed in center-west Paraná, Brazil. Water Supply 2021, 21, 1718–1734. [Google Scholar] [CrossRef]
- De Necker, L.; Neswiswi, T.; Greenfield, R.; van Vuren, J.; Brendonck, L.; Wepener, V.; Smit, N. Long-term water quality patterns of a flow regulated tropical lowland river. Water 2019, 12, 37. [Google Scholar] [CrossRef]
- Amatya, D.M.; Skaggs, R.W. Long-term hydrology and water quality of a drained pine plantation in North Carolina. Trans. ASABE 2011, 54, 2087–2098. [Google Scholar] [CrossRef]
- Tomas, D.; Čurlin, M.; Marić, A.S. Assessing the surface water status in Pannonian ecoregion by the water quality index model. Ecol. Indic. 2017, 79, 182–190. [Google Scholar] [CrossRef]
- Diwan, V.; Stålsby Lundborg, C.; Tamhankar, A.J. Seasonal and temporal variation in release of antibiotics in hospital wastewater: Estimation using continuous and grab sampling. PLoS ONE 2013, 8, e68715. [Google Scholar] [CrossRef]
- Meride, Y.; Ayenew, B. Drinking water quality assessment and its effects on residents health in Wondo genet campus, Ethiopia. Environ. Syst. Res. 2016, 5, 1. [Google Scholar] [CrossRef]
- De Klerk, A.R.; De Klerk, L.P.; Chamier, J.; Wepener, V. Seasonal variations of water and sediment quality parameters in endorheic reed pans on the Mpumalanga Highveld. Water SA 2012, 38, 663–672. [Google Scholar] [CrossRef]
- Manyatshe, A.; Fosso-Kankeu, E.; van der Berg, D.; Lemmer, D.; Waanders, F.; Hlanganani, T. Assessment of Seasonal Variation in Surface Water Quality of the Mooi and Vaal Rivers Network, South Africa. 2016. Available online: https://www.researchgate.net/publication/311516799_Assessment_of_Seasonal_Variation_in_Surface_Water_Quality_of_the_Mooi_and_Vaal_Rivers_Network_South_Africa (accessed on 25 June 2023).
- Department of Water and Sanitation. Level Review of Water Quality in South Africa; Department of Water and Sanitation: Pretoria, South Africa, 2015. Available online: https://www.dws.gov.za/iwrp/iwqms/Documents/Report%201.1_Inception%20Report.pdf (accessed on 5 June 2022).
- Malakane, K.C.; Maphanga, T. An assessment of the quality of effluent discharged from several wastewater treatment plants into the Crocodile River of Mpumalanga, South Africa. J. Appl. Res. Water Wastewater 2024, 11, 15–23. [Google Scholar]
- Loock, M.M.; Beukes, J.P.; Van Zyl, P.G. Conductivity as an indicator of surface water quality in the proximity of ferrochrome smelters in South Africa. Water SA 2015, 41, 705–711. [Google Scholar] [CrossRef]
- van Rensburg, S.J.; Barnard, S. Evaluation and impact of a polluted stream on the integrated management of a drinking water resource: A case study of the Middle Vaal River, South Africa. J. Water Resour. Prot. 2019, 11, 148. [Google Scholar] [CrossRef]
- Mainali, J.; Chang, H. Environmental and spatial factors affecting surface water quality in a Himalayan watershed, Central Nepal. Environ. Sustain. Indic. 2021, 9, 100096. [Google Scholar] [CrossRef]
- Haarhoff, S.J.; Kotzé, T.; Swanepoel, P.A. A prospectus for sustainability of rainfed maize production systems in South Africa. Crop Sci. 2020, 60, 14–28. [Google Scholar] [CrossRef]
- Singh, J.; Yadav, P.; Pal, A.K.; Mishra, V. Water pollutants: Origin and status. In Sensors in Water Pollutants Monitoring: Role of Material; Pooja, D., Kumar, P., Singh, P., Patil, S., Eds.; Springer: Singapore, 2020; pp. 5–20. [Google Scholar]
- Shabalala, A.N.; Combrinck, L.; McCrindle, R. Effect of farming activities on seasonal variation of water quality of Bonsma Dam, KwaZulu-Natal. South Afr. J. Sci. 2013, 109, 1–7. [Google Scholar] [CrossRef]
- Schilling, K.E.; Wolter, C.F. Contribution of base flow to nonpoint source pollution loads in an agricultural watershed. Groundwater 2001, 39, 49–58. [Google Scholar] [CrossRef]
- Soko, M.I.; Gyedu-Ababio, T. The spatial and temporal variations of Ichythyofauna and water quality in the Crocodile River (East), Mpumalanga, South Africa. J. Water Resour. Prot. 2015, 7, 152–170. [Google Scholar] [CrossRef]
- Wang, X.; Li, J.; Chen, J.; Cui, L.; Li, W.; Gao, X.; Liu, Z. Water quality criteria of total ammonia nitrogen (TAN) and un-ionized ammonia (NH3-N) and their ecological risk in the Liao River, China. Chemosphere 2020, 243, 125328. [Google Scholar] [CrossRef] [PubMed]
- Van der Laan, M.; Van Antwerpen, R.; Bristow, K.L. River water quality in the northern sugarcane-producing regions of South Africa and implications for irrigation: A scoping study. Water SA 2012, 38, 87–96. [Google Scholar] [CrossRef]
- Khungwayo, A.N. Investigating the Effects of Nutrients and Chlorophyll Concentrations on the Water Quality of the Nuwejaars River, Cape Agulhas, Western Cape. Master’s Thesis, University of Western Cape, Cape Town, South Africa, 2022. [Google Scholar]
- Masindi, T.K.; Gyedu-Ababio, T.; Mpenyana-Monyatsi, L. Pollution of Sand River by Wastewater Treatment Works in the Bushbuckridge Local Municipality, South Africa. Pollutants 2022, 2, 510–530. [Google Scholar] [CrossRef]
- Mararakanye, N.; Le Roux, J.; Franke, A.C. Long-term water quality assessments under changing land use in a large semi-arid catchment in South Africa. Sci. Total Environ. 2022, 818, 151670. [Google Scholar] [CrossRef]

Disclaimer/Publisher’s Note: The statements, opinions and data contained in all publications are solely those of the individual author(s) and contributor(s) and not of MDPI and/or the editor(s). MDPI and/or the editor(s) disclaim responsibility for any injury to people or property resulting from any ideas, methods, instructions or products referred to in the content. |
© 2024 by the authors. Licensee MDPI, Basel, Switzerland. This article is an open access article distributed under the terms and conditions of the Creative Commons Attribution (CC BY) license (https://creativecommons.org/licenses/by/4.0/).