Abstract
This study evaluates the storm surge inundation risk in three anthropogenically infilled estuaries—Xichong, Renshan, and Kaozhouyang—located in the Guangdong–Macao–Hong Kong Great Bay Area, China. By integrating GIS spatial analysis with storm surge modeling, we conducted 204 numerical experiments to simulate storm surge inundation under varying typhoon intensities and astronomical tide conditions. Results revealed that coastal terrain plays a crucial role in influencing storm surge levels and inundation extents. Specifically, the pocket-shaped terrain in the Renshan and Kaozhouyang estuaries amplified storm surges, resulting in higher inundation levels compared to the relatively open terrain of Xichong. Furthermore, anthropogenically reclaimed land in these estuaries appear to be particularly vulnerable to storm-induced inundation. Overall, this study underscores the importance of considering coastline morphology and the anthropogenic modifications of coastal terrain in storm surge risk assessments, offering valuable insights for disaster prevention and mitigation strategies. The use of ArcGIS spatial analysis coupled with storm surge modeling, facilitated by high-resolution DEMs, provides a statistical risk assessment of inundation. However, more complex flooding dynamics models need to be developed, particularly when terrestrial bottom friction information, which is heavily modified by human activities, can be accurately incorporated.
Keywords:
GIS; storm surge; typhoon; inundation; anthropogenic infilling; estuaries; risk assessment 1. Introduction
The high incidence period of tropical cyclones in the South China Sea is from June to October every year. The typhoon brings huge waves, heavy rains, and storm surge disasters. The Guangdong–Hong Kong–Macao Great Bay Area is one of the areas vulnerable to tropical cyclones. After the superposition of storm surge and astronomical high tide level, the coastal water level exploded in a short time, and even overbanked, causing casualties and property losses.
Research on storm surge flooding is important for coastal communities because it provides valuable insights into the potential risks and impacts associated with these natural disasters. By studying storm surge patterns, scientists can better understand the factors that contribute to their formation and intensity, enabling them to develop more accurate forecasting models. Furthermore, knowledge gained from studying storm surge flooding contributes to improving emergency response plans as it allows emergency management agencies to effectively allocate resources during disaster situations by identifying high-risk areas prone to inundation. This information also assists in coordinating rescue operations and providing prompt aid after a storm event.
With the maturity of GIS technology, many researchers have focused on a new research field by integrating GIS spatial analysis technology with hydrological analysis models. The Indian National Center for Mesoscale Forecasting combines its mesoscale forecast model with GIS. Leveraging the visualization and spatial analysis capabilities of GIS, they have created analysis maps of waterlogging disasters [1]. In the United States, some scholars have integrated a detailed DEM (digital elevation model) model with GIS (geographic information system) to establish the PRISM climate classification system, which is simultaneously utilized to analyze hydrological disasters such as urban waterlogging [2].
The research on storm surge flooding models commenced in the late 1960s. Compared to the traditional fixed grid model, this type of model permits the boundary position to vary in accordance with the fluctuations of the water level. Currently, substantial research has been conducted on storm surge floodplains in China. Wu and Sun [3] employed the Flather–Heaps method to simulate storm surge inundation in the Bohai Sea. Sarina et al. [4] utilized an improved POM (Princeton ocean model) to simulate storm surge inundation in Tianjin during a typhoon, yielding notable results. Zhu and Yu [5] established a storm surge model for Hangzhou Bay and the Qiantang Estuary, exploring the calculation method for storm surge overflow and effectively simulating the process of storm surge overflow in Hangzhou Bay. Wu et al. [6] developed a storm surge model for the Wenzhou coastline using ADCIRC (the ADvanced CIRCulation model) and assessed the flooding threat to Wenzhou under various typhoon trajectories. Building on the FVCOM (finite-volume coastal ocean model), Cao et al. [7] devised a high-resolution 3D storm surge model for Jiaozhou Bay. Additionally, numerous scholars have investigated storm surge floodplains during typhoons of varying intensities [8,9,10,11].
GIS technology was introduced into the study of typhoon storm surge due to its powerful capabilities in spatial analysis and graphic expression. The inundation analysis map and risk zoning map effectively enhance the intuitiveness of model calculation results. Mu et al. [12] andGao et al. [13] have applied GIS to storm surge risk assessment. Liang et al. [14] focused on a small area and analyzed the submerged area using GIS software (Qgis), accurately calculating the loss rates for different sectors. Tang et al. [15] incorporated geographic information technology into typhoon storm surge research, proposing a simulation method for typhoon storm surge inundation. Wang et al. [16] presented a monitoring and early warning method based on GIS to assess the impact of storm surge disasters, illustrating it with the case of Typhoon Nida in 1604. Wang et al. [17] conducted a risk assessment and zoning in Huizhou using a combination of numerical modeling and GIS.
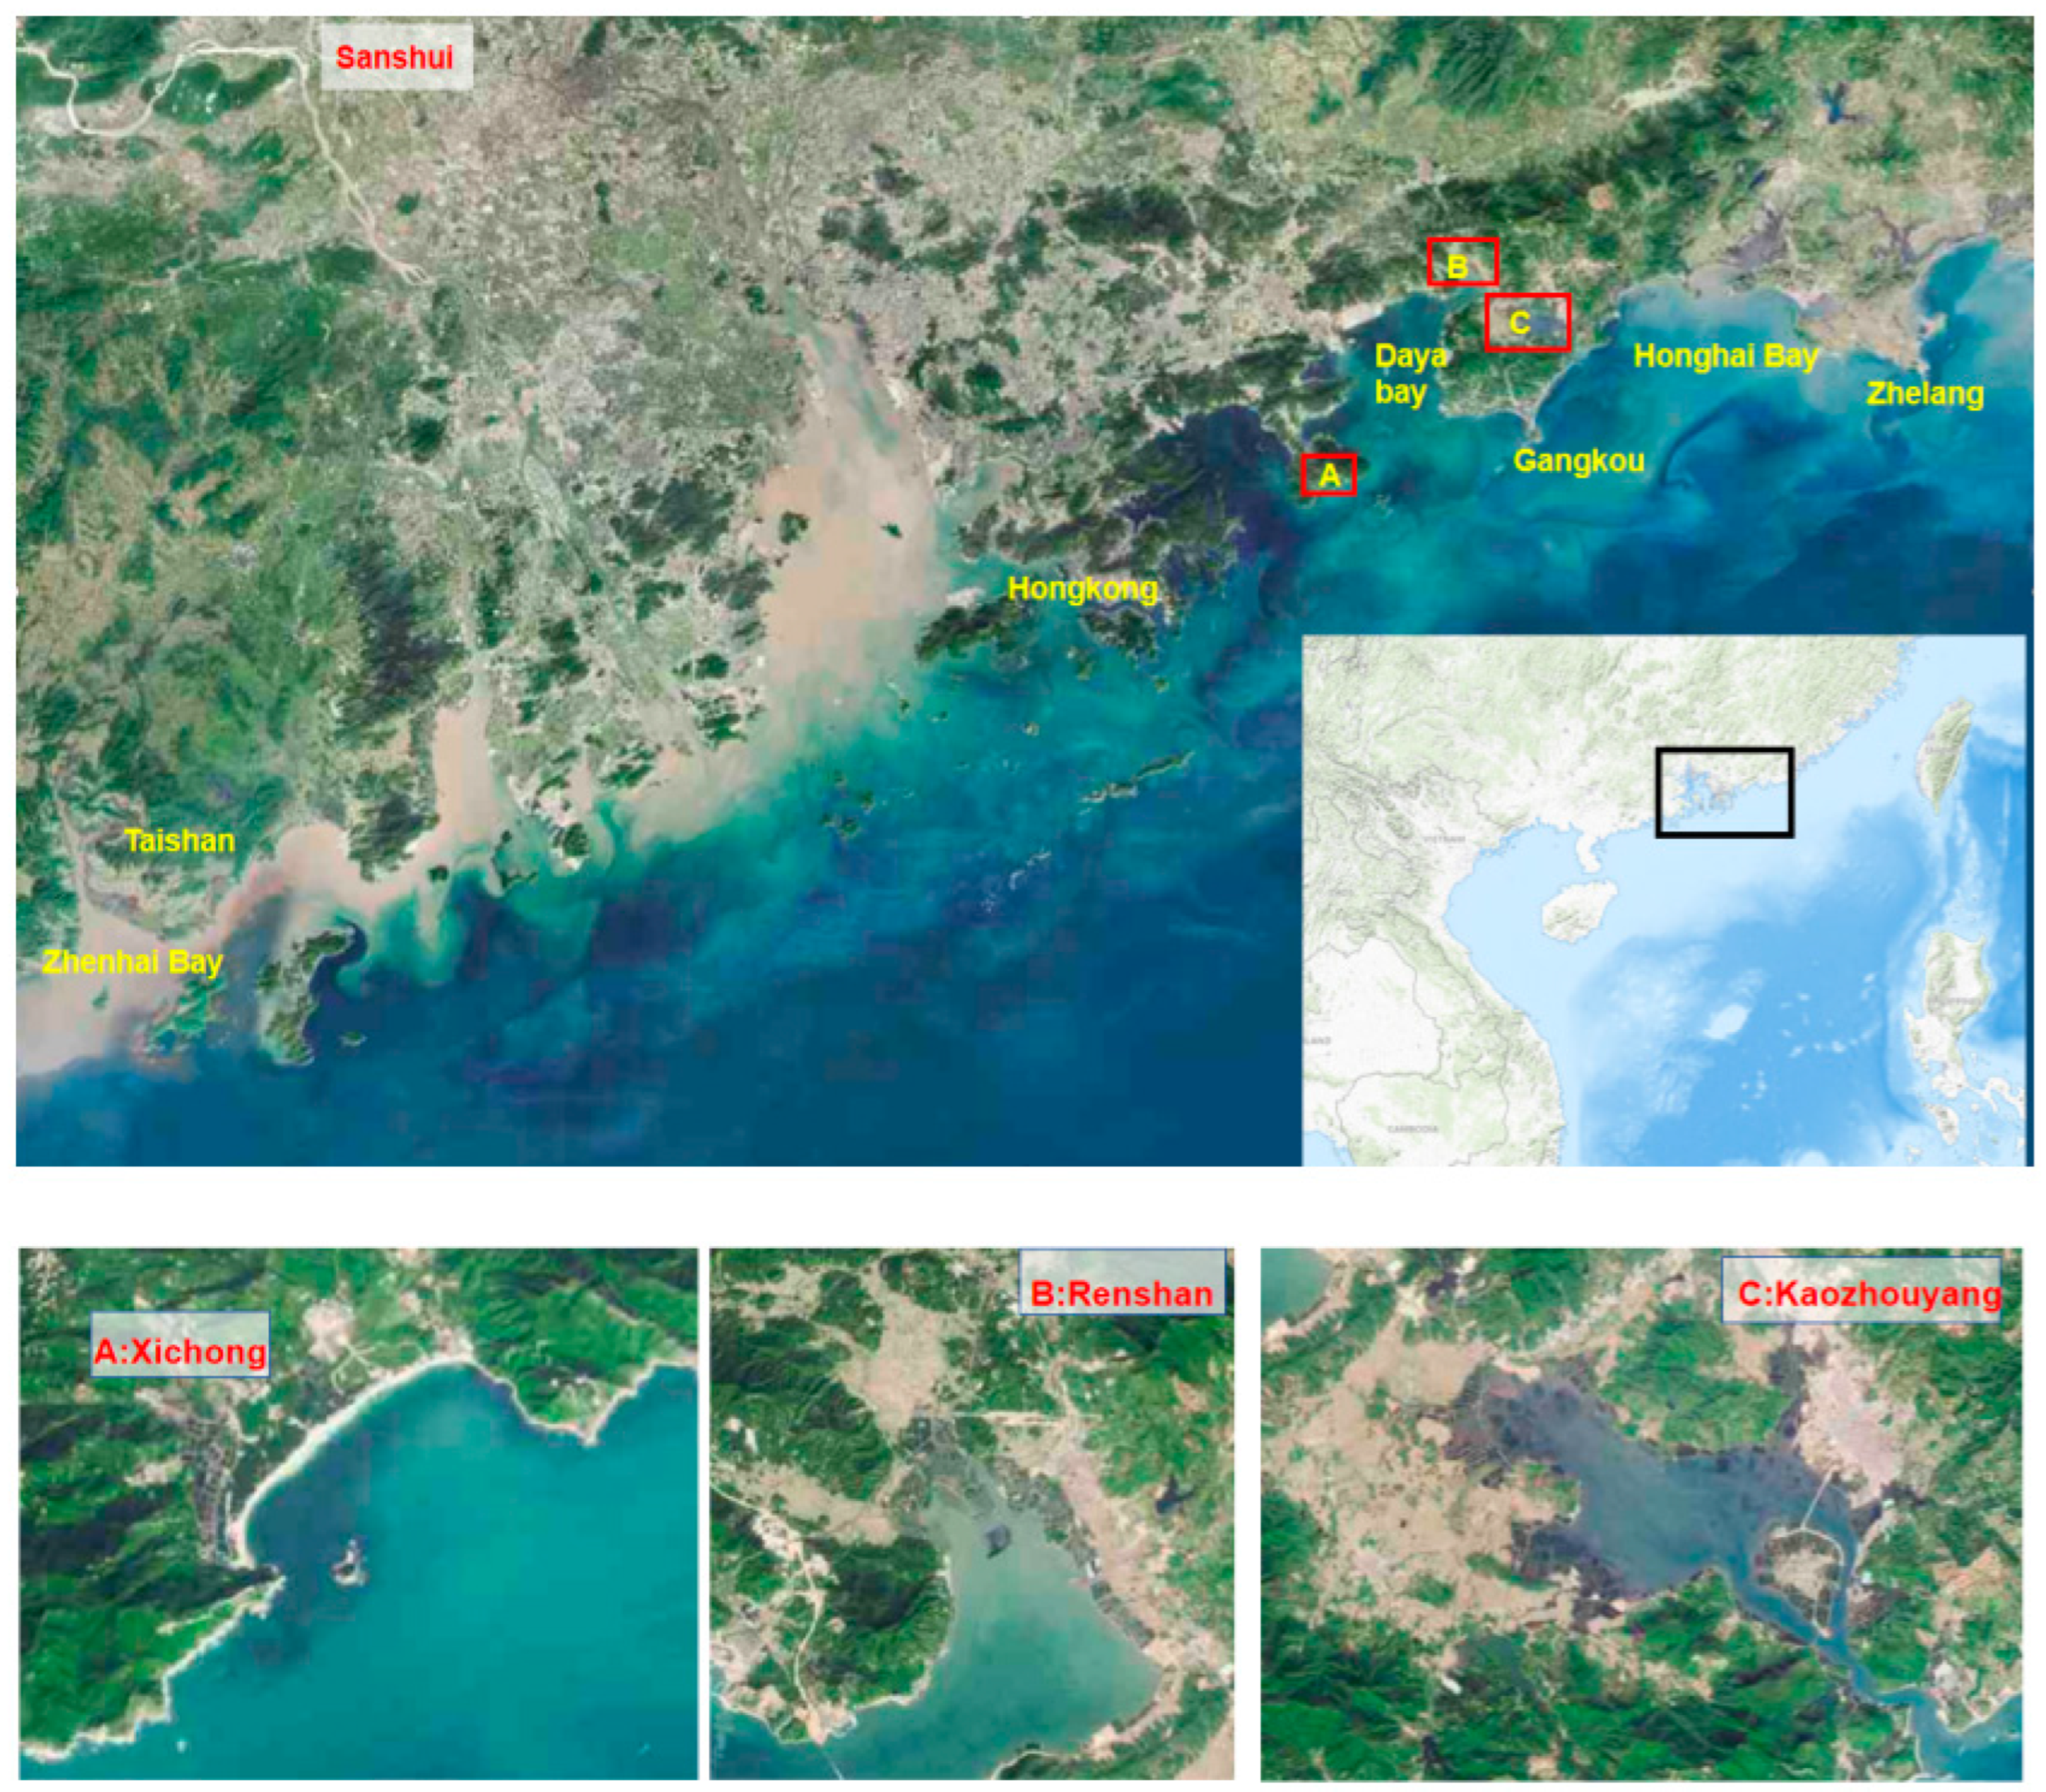
Regarding the impact of human activities, such as sea reclamation, on the flooding extent of coastal estuaries, current research remains relatively scarce. Human activities have significantly altered the evolution of coastlines within China [18,19,20], even leading to the artificial disappearance of natural estuarine water bodies and unnatural filling. One such consequence is that land reclamation is primarily utilized for agricultural and aquaculture purposes [21], such as the construction of ponds, in regions where elevation data is often unknown. Therefore, this paper employed high-precision digital elevation models (DEMs), in conjunction with storm surge simulations, to investigate the inundated areas under different intensities of storm surges in the Shenzhen Xichong, Shenzhen Renshan, and Huizhou Kaozhouyang regions (Figure 1).

Figure 1.
Remote sensing images of study areas at the south east of the Guangdong–Macao–Hong Kong Great Bay Area.
Terrain and geographical location are crucial factors influencing the magnitude of storm surge. Using the examples of Xichong in Shenzhen City and Renshan and Kaozhouyang in Huizhou City, this paper comprehensively employed GIS technology and numerical simulation methods to conduct storm surge inundation calculations and analysis. Xichong, situated at the southern extremity of the Nanao Peninsula, serves as a significant tourist hub in the eastern region of Shenzhen. Renshan is perched atop Fanhe Harbor, at the northern end of Daya Bay, while Kaozhouyang is located in the south of the Renping Peninsula, Huidong County, within a drowned valley extending inland from the Red Sea Bay. These three research areas are abundant in tidal flat resources, primarily utilized for pond aquaculture, and are minimally impacted by rivers. However, it should be noted that Xichong is positioned at the mouth of a bay, Renshan sits at the head of a bay, and Kaozhouyang, being a drowned valley bay, extends inland from the Red Bay.
2. Storm Surge Calculation Method
2.1. Storm Surge Model
The ADCIRC, a parallel advanced circulation model for oceanic, coastal, and estuarine waters, Kolar, R.L. [22] was developed by Dr. Luettich and J.J. Westerink at the University of North Carolina at Chapel Hill. The hydrodynamic numerical model created by Dr. Westerink can solve two- and three-dimensional surface flow and mass transport problems in the open sea, simulating water levels and flow fields in the ocean, nearshore regions, and estuaries. It is based on the finite element method and employs unstructured meshes that can be flexibly refined locally.
In order to avoid numerical problems such as oscillation and nonconservation, which arise during the discretization of the Galerkin finite element method, the ADCIRC model employs a so-called generalized wave continuity equation (GWCE) to replace the standard continuity equation. The GWCE, being a time derivative of the original continuity equation, introduces a numerical weighted parameter based on the spatial variable, and subsequently substitutes the momentum equation with this modified continuity equation:
Among them
The time derivative term of Ax, Ay is obtained by using the chain rule, and substituting it into the momentum equation means we obtain:
The final form of GWCE is obtained by substituting Equations (4) and (5) into Equation (1). In the GWCE equation, the finite element method is used in space to adapt the complex boundary conditions, the finite difference method is used in time to improve the calculation speed, and the semi-implicit method is used to solve the wave continuity equation, the mass matrix is constant and needs only one inversion. The physical meaning of each variable is given below:
- t—time (s);
- —horizontal cartesian coordinate system (m);
- —longitude and latitude;
- —latitude and longitude of the central point of the area calculated on a grid;
- —total water depth of the water column (m);
- —free surface height from mean sea level (m);
- —undisturbed ocean depth, i.e., the distance from mean sea level to the seabed (m);
- —the radius of the Earth (m), taking 6,378,135 m;
- —depth-averaged seawater horizontal velocity (ms−1);
- —Coriolis parameter (s−1), which is the angular velocity of the Earth’s rotation;
- —gravity acceleration (ms−2);
- —seawater density, the default is 1025 kg m−3;
- —atmospheric pressure on the free surface of seawater (Nm−2);
- —Newton tidal potential (m);
- — and components (N) of sea surface stress, which may include wind stress and wave radiation stress;
- — and components of sea bed friction force (N);
- —horizontal diffusion term of momentum equation.
2.2. Typhoon Model
In the calculation of storm surge, the computation of the typhoon’s wind field and pressure field is an important part. The wind field within the typhoon domain is a combination of two vector fields. One is the wind field that is symmetrical to the typhoon center. The wind vector traverses the isobaric line and points to the left, forming a deflection angle (inflow angle) of 20°, and the wind speed is proportional to the gradient wind. The second is the basic wind field, assuming its speed is dependent on the typhoon’s moving speed. There are several commonly used basic methods to represent the wind field. In this work, the Jelesnianski model [23] which describes the wind field and pressure field and has been utilized by our center in operational forecasts for a long time, was selected. The calculation formula is as follows:
In the equation:
- is the radius of maximum wind speed;
- is the distance from the calculation point to the typhoon center;
- is the typhoon moving speed;
- is the maximum wind speed of the typhoon;
- and (, ) represent the coordinates of the calculation points and the typhoon center respectively.
- is the center pressure of the typhoon, and is the atmospheric pressure at infinity.
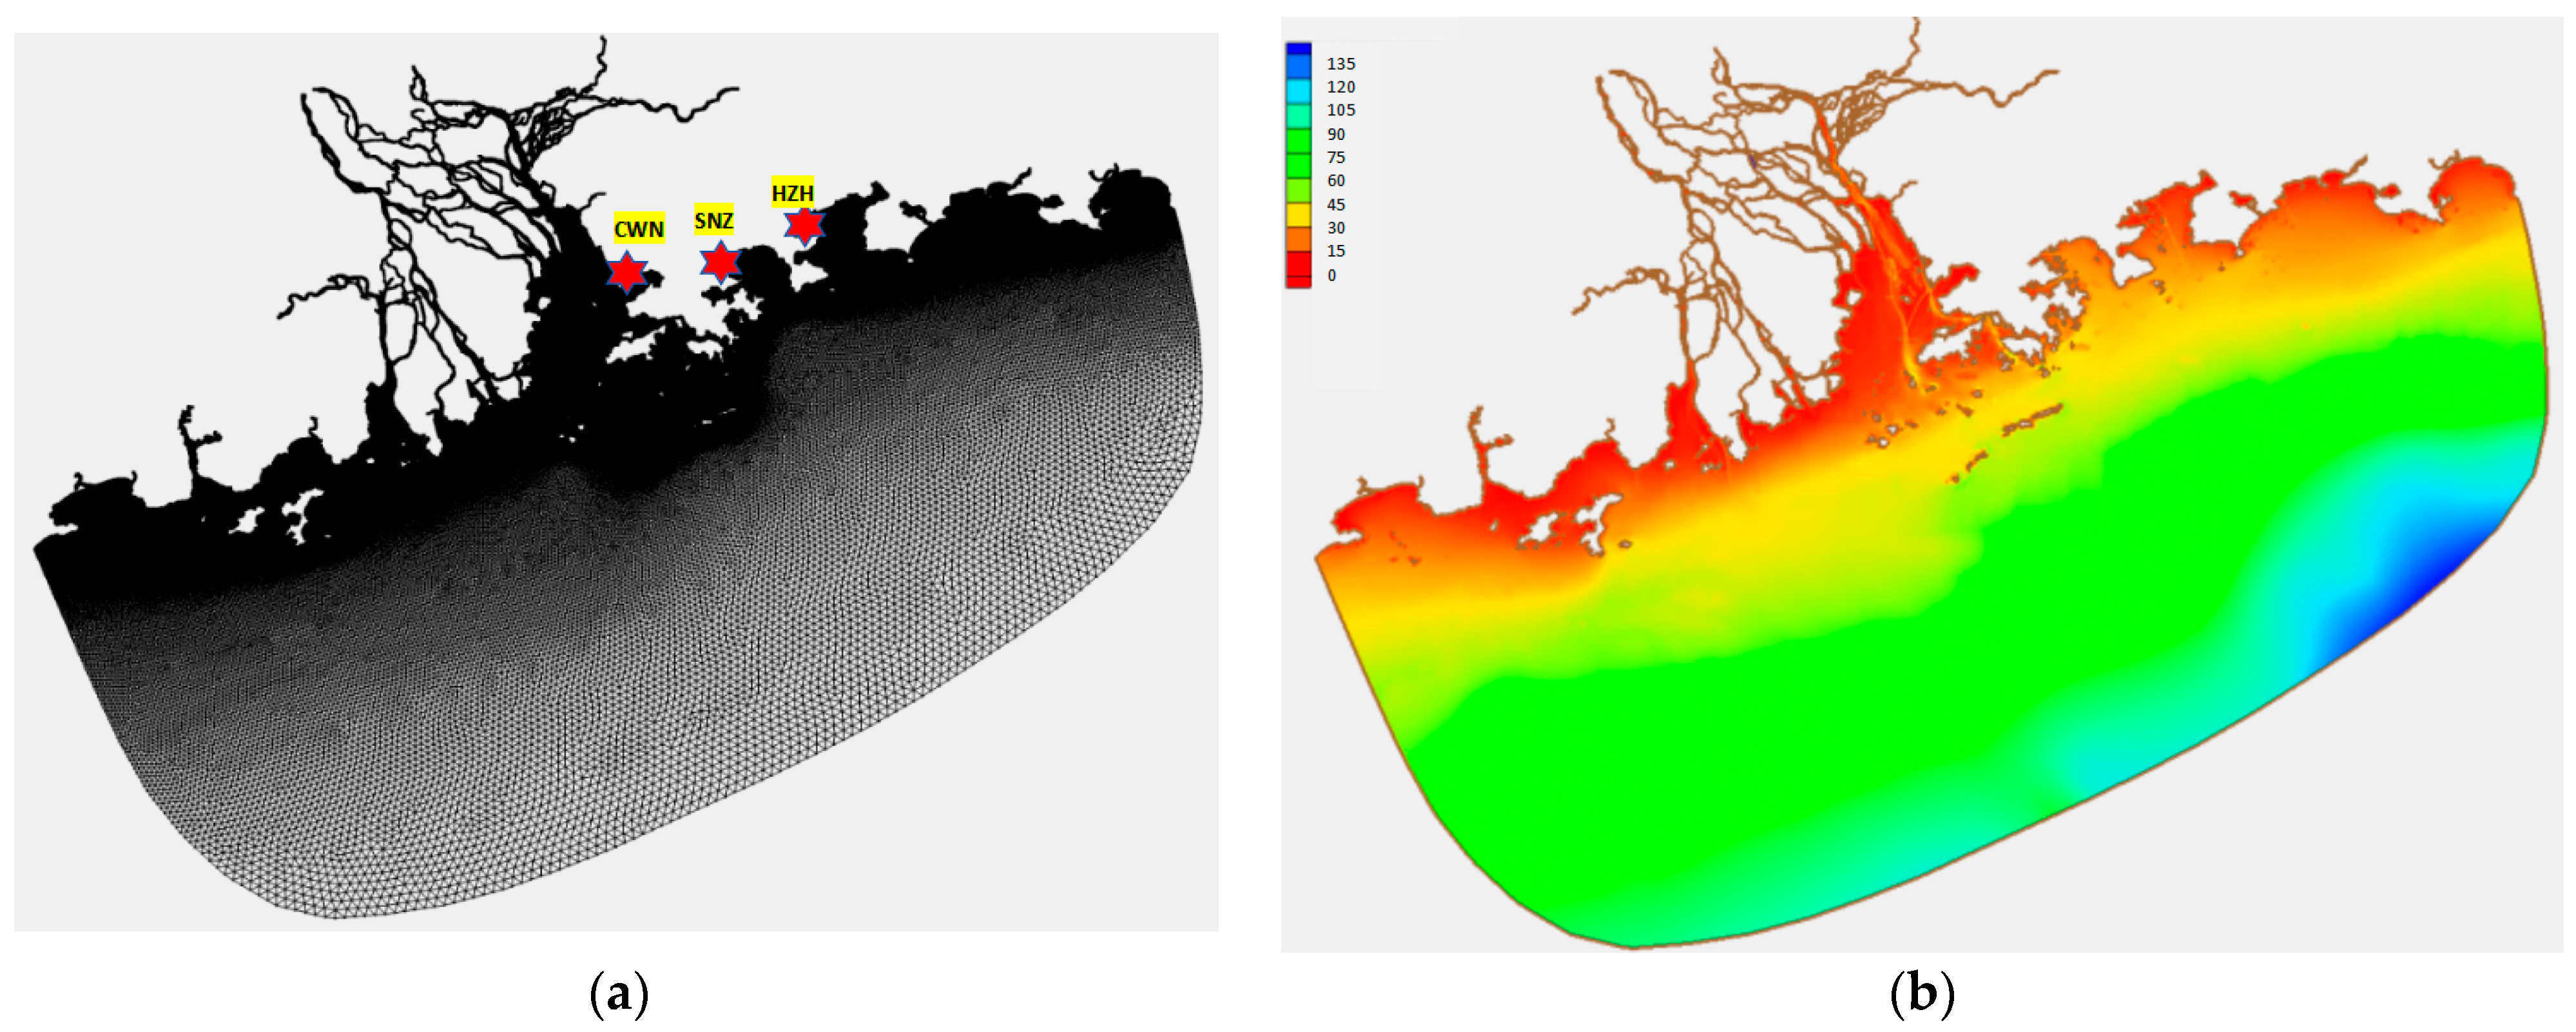
2.3. Model Domain and Mesh Generation
The model area encompasses the region from north of 21° N to Sanshui, including Honghai Bay–Zhenhai Bay, and the model’s domain (Figure 2a). A triangular mesh was employed to divide the calculation area. The grid resolution within the model’s domain was 300 m, and it gradually refined towards Xichong, reaching finer than 100 m (Figure 2b). There were 209,712 computing nodes and 408,276 computing elements.
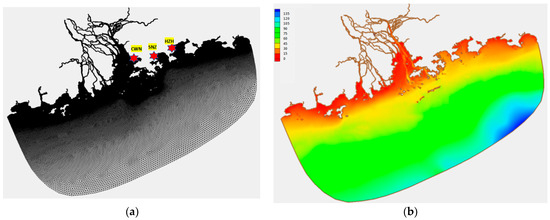
Figure 2.
(a) Mesh generation of the area and locations of tidal gauge stations; (b) water depths in model domain.
The bathymetric topography within the simulation range was compiled from nautical maps. These maps were primarily sourced from the Navigation Guarantee Department of the Navy Command of the People’s Liberation Army and the Maritime Safety Administration of the People’s Republic of China. After these bathymetric data were transformed to a uniform base surface (the mean sea level), they were interpolated to grid points to obtain the water depths of the computation area (Figure 2b).
2.4. Water Levels at the Open Boundary
The open boundary for water levels adopts either the total water level or the increase in water level attributed to storm surge. The total water level boundary was formulated by integrating the storm surge boundary and the astronomical tide boundary. Among these, the storm surge increase boundary was provided by the operational storm surge model at the South China Sea Forecast Center. The astronomical tide primarily encompasses the effects of 11 pivotal tidal constituents, specifically M2, N2, S2, K2, K1, O1, P1, Q1, MS4, M4, and M6. The operational storm surge model at the South China Sea Forecast Center is based on the ELCIRC (Eulerian–Lagrangian CIRCulation) model, encompassing the entire South China Sea. A triangular mesh was employed for bathymetric interpolation within the computational domain. The grid resolution gradually enhances from the open sea towards the nearshore, with the nearshore resolution approximately 1000 m.
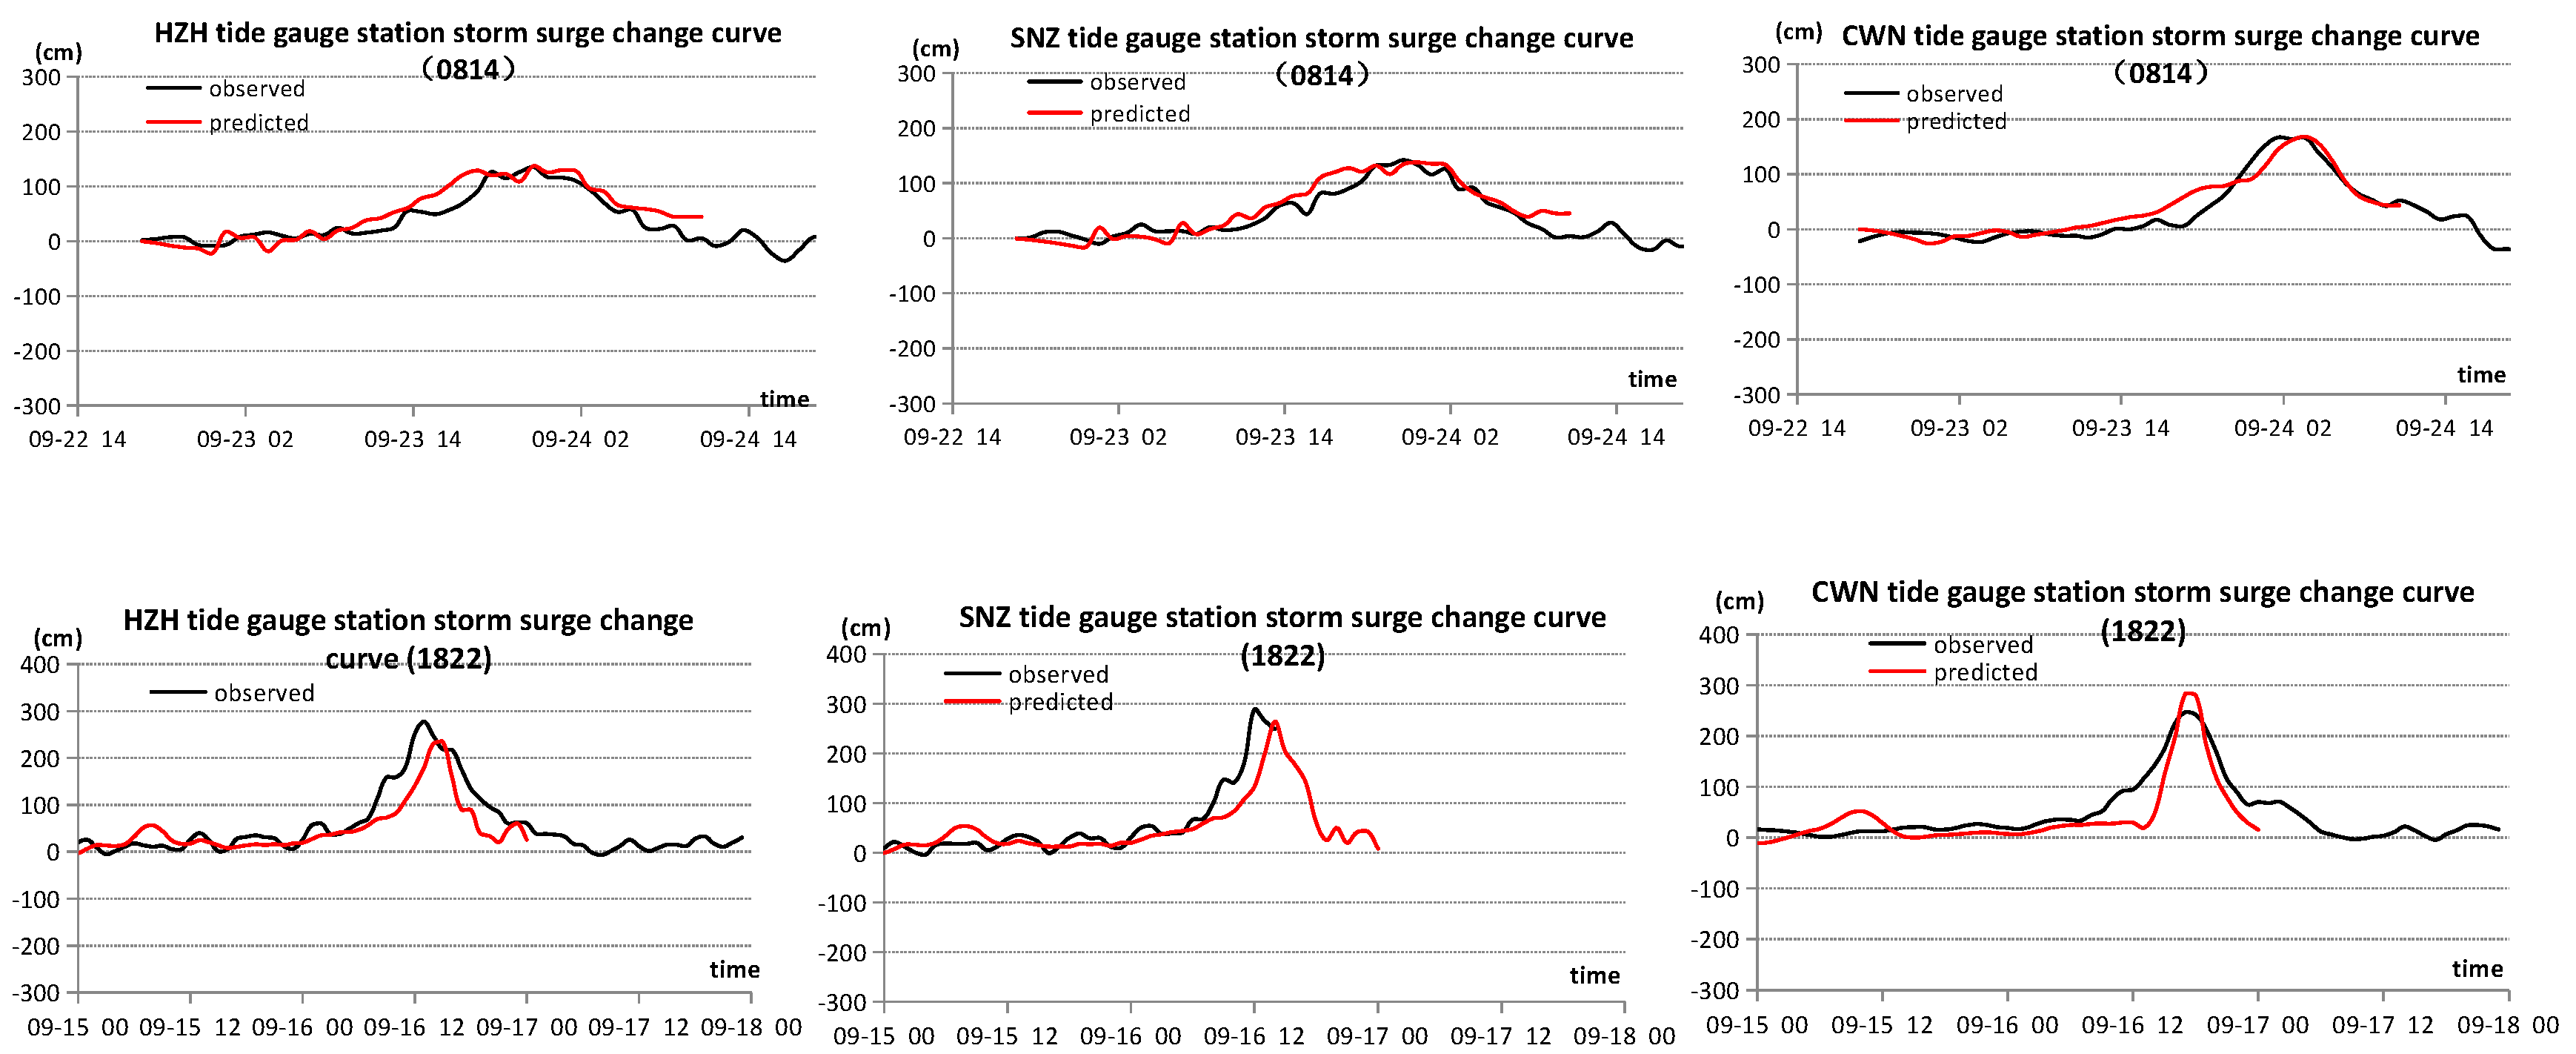
2.5. Model Validation
Typhoons ‘Hagupit’ (International No. 0814, the 14th named typhoon of the 2008 Pacific typhoon season) and ‘Mangkhut’ (International No. 1822, the 14th named typhoon of the 2018 Pacific typhoon season) were strong typhoons that made landfall in the west Guangdong province causing severe storm surge disasters due to their high speed and intensity. Many stations along the Guangdong–Macao–Hong Kong Great Bay Area experienced over-record high tides. This paper tested the rationality and reliability of the storm surge model by using measured tide level data during the storm surges caused by typhoons 0814 ‘Hagupit’ and 1822 ‘Mangkhut’ (typhoon track Figure 3).
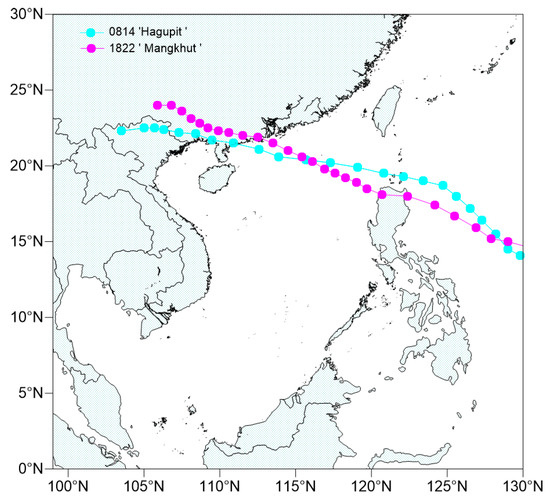
Figure 3.
The typhoon track of 0814 ‘Hagupit’ and 1822 ‘Mangkhut’.
The strong typhoon ‘Hagupit’ made landfall near Chencun Town, Dianbai County, Maoming City, Guangdong Province at 06:45 on 24 September 2008. The maximum wind speed near the typhoon center was 48 m/s and the minimum pressure was 940 hPa. Due to the impact of the strong typhoon ‘Hagupit,’ storm surges exceeding 100 cm occurred in Shenzhen and Huizhou Cities.
Around 17:00 on 16 September 2018, 1822 ‘Mangkhut’ made landfall in Haiyan Town, Taishan City, Guangdong Province. The maximum wind speed near the typhoon center was recorded at 45 m/s with a minimum pressure of 955 hPa. As a result of Super Typhoon ‘Mangkhut,’ a storm surge affected the coast of Guangdong Province with HZH Station (locations of tidal gauge stations Figure 2a) experiencing a maximum surge height of 278 cm.
Based on the validation curve (Figure 4), the simulation surge levels of these two typhoons align with the observed trend, and the relative error in maximum water increase was less than 15%.
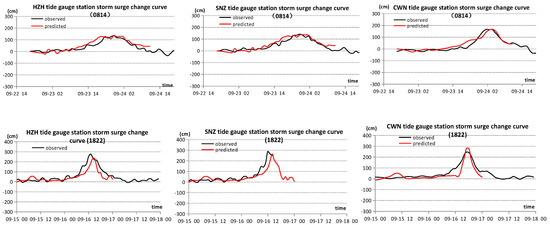
Figure 4.
The validation of storm surge levels of tidal gauge stations.
3. Risk Analysis of Different Levels of Storm Surges
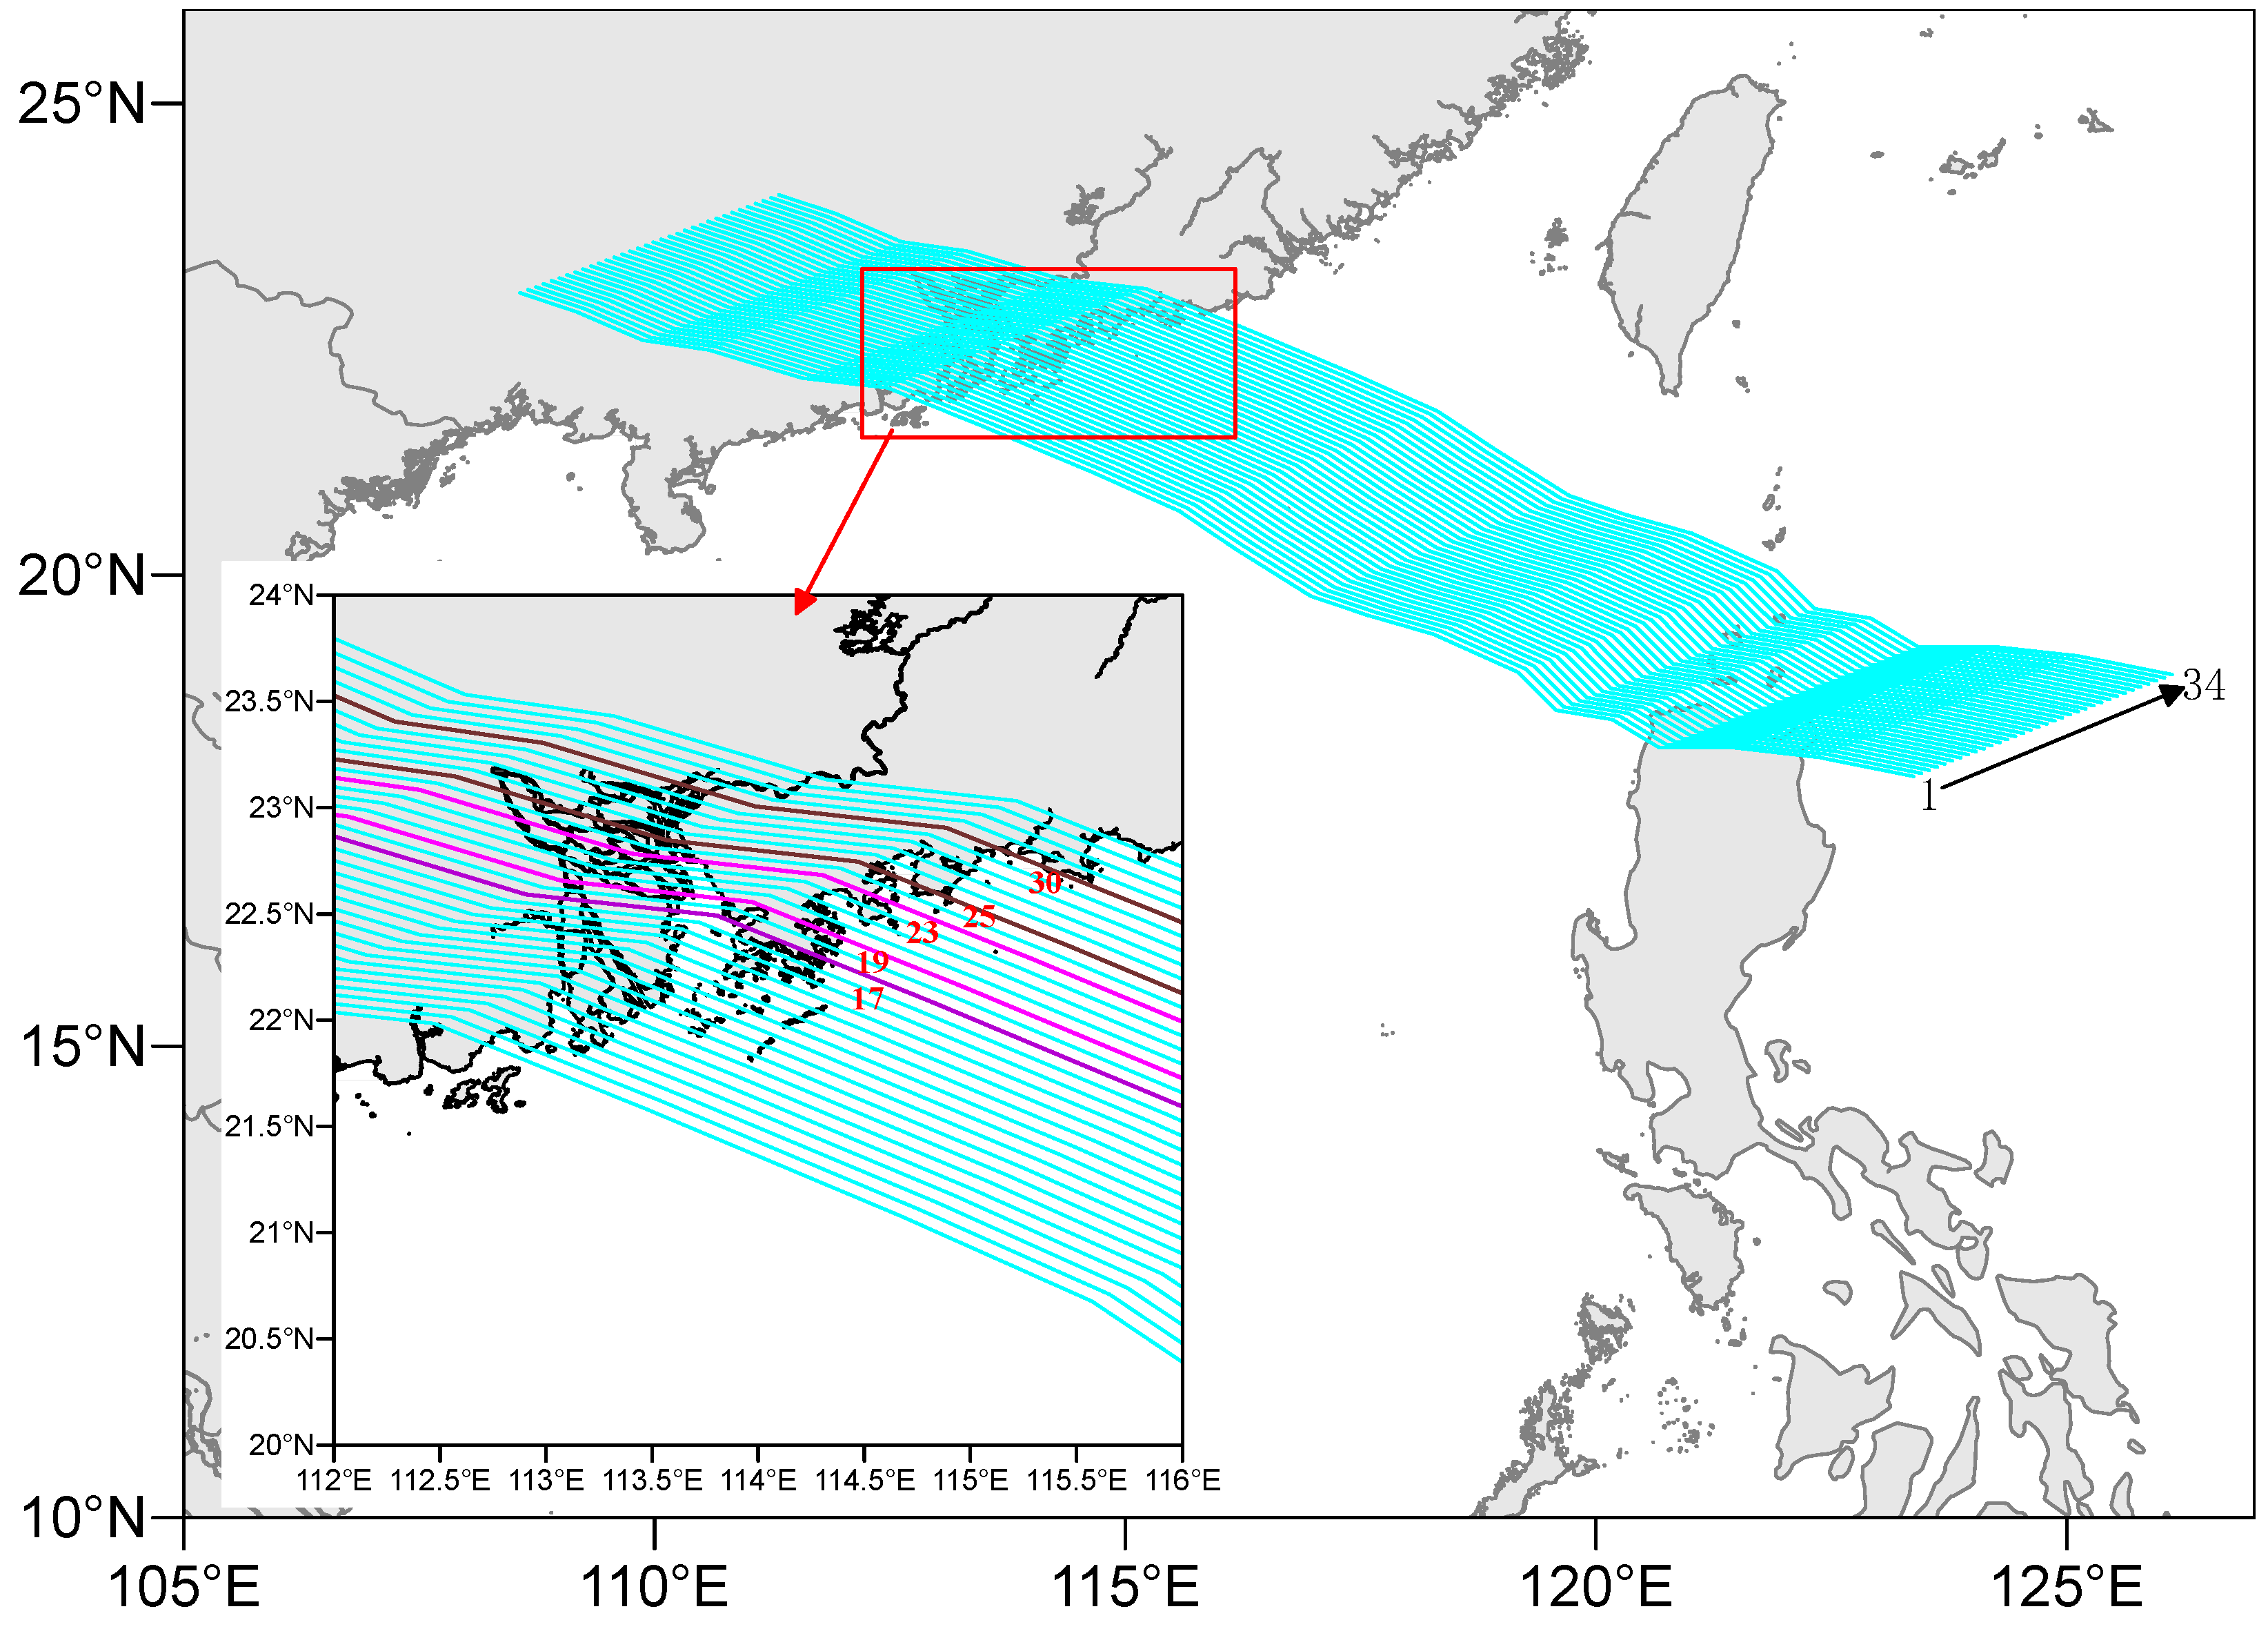
3.1. Selection of the Least Favorable Path for Typhoons
Affected by Typhoon Mangkhut’s storm surge, the aquaculture area in the province was affected, resulting in a loss of 20,824.53 hectares and 54,947.98 tons of aquaculture. Additionally, 324 fishing boats were destroyed and 453 were damaged. Furthermore, there was damage to 5.76 km of embankments and 24.99 km of seawalls and revetments. The direct economic loss amounted to CNY 2.370 billion.
Based on the severe storm surge and disaster losses caused by Typhoon Mangkhut, the typhoon track of this particular event was considered to be the most favorable for increasing water levels. By relocating Typhoon Mangkhut to the study area and considering a distance of 0.25 times the radius of maximum wind speed, 34 typhoon tracks were generated on both sides, providing complete coverage of the study area. The distribution of these tracks is illustrated in Figure 5.
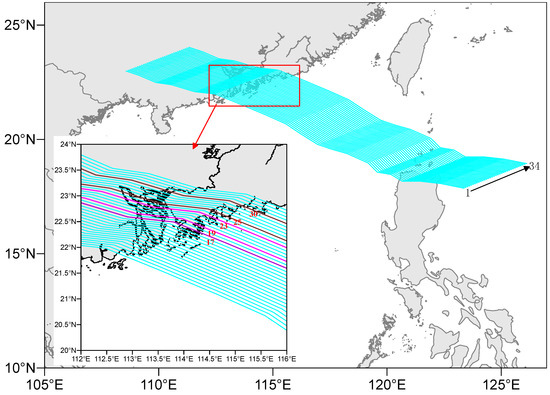
Figure 5.
Typhoon tracks designed based on the ‘Mangkhut‘ typhoon.
The typhoon parameters required for simulating typhoon storm surge with different intensity levels mainly include the minimum pressure of the typhoon center, the maximum wind speed radius of the typhoon, the maximum wind speed near the center, the peripheral sea level pressure, the moving speed, and the selection of typhoon path. These parameters are calculated according to the method outlined in storm surge technical directives [24]. To comprehensively investigate the impact of varying typhoon intensities on the area of study, two conditions were taken into account for the intensity classification:
- (1)
- To assess the potential impact of the maximum possible typhoon, as per the guidelines, the extreme value I distribution is employed to determine the P0 value (P0 = 876 hPa), which represents the central pressure of such a typhoon occurring once every 1000 years.
- (2)
- To evaluate the general influence of typhoons, the guidelines dictate using the P0 value (P0 = 900 hPa) derived from the extreme value I distribution for an event occurring once every 200 years as a baseline. From this, the minimum pressure at the typhoon’s center is incrementally increased, thereby constructing four typhoons with progressively weaker intensities.
Drawing upon the aforementioned empirical calculation method and historical observation data, the maximum wind speed radius was determined by averaging the empirical formula-derived value and the observed values of all typhoons with similar intensities, based on their minimum pressure values at the center. The specific values for these parameters were determined as shown in Table 1.

Table 1.
The table of parameters for typhoons.
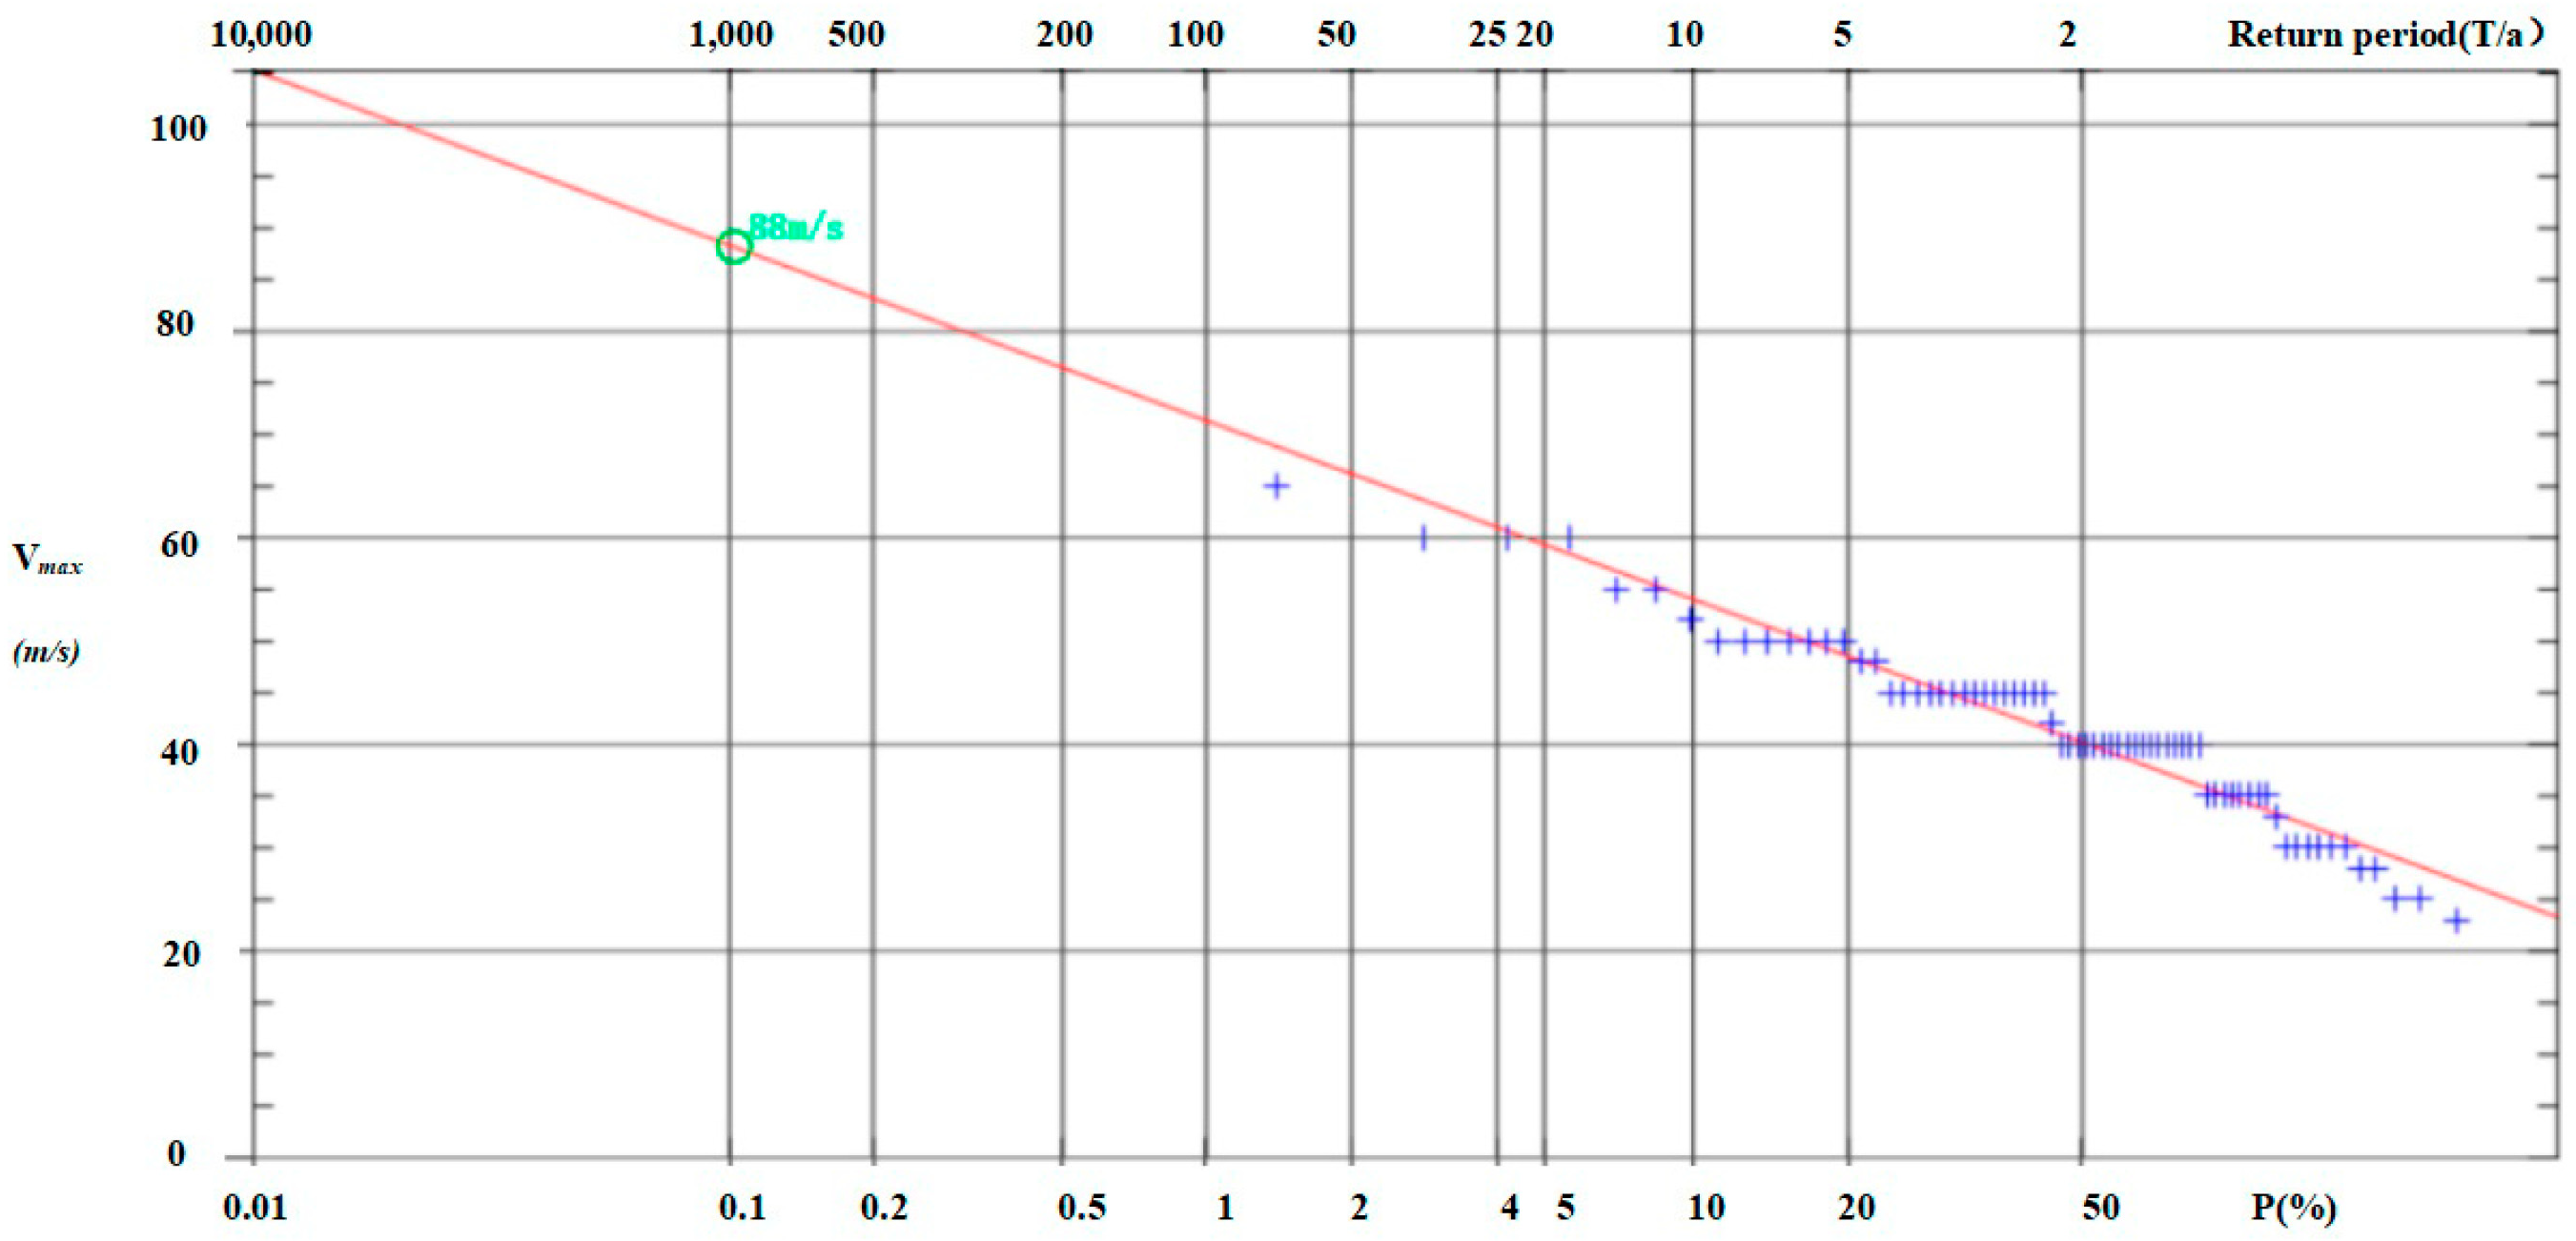
The probability theory method is employed to compute the near-center maximum wind speed (Vmax) of a potential maximum typhoon. Leveraging the best track data of tropical cyclones from 1949 to 2018 provided by the China Meteorological Administration (CMA), the maximum wind speeds of typhoons traversing the sea area within 400 km of the evaluation zone were sampled. In the case where no typhoon entered the area in a given year, the Vmax of that year was assigned the minimum value recorded in the series of typhoon Vmax values entering the area. The maximum wind speed value for a 1000-year return period was estimated using Gumbel frequency analysis (also known as extreme value type I frequency analysis), which served as the basis for determining the maximum wind speed of the potential maximum typhoon (Figure 6 for analysis results). Consequently, the maximum wind speed at the center of a typhoon with a 1000-year return period in the study area is Vmax = 88 m/s.
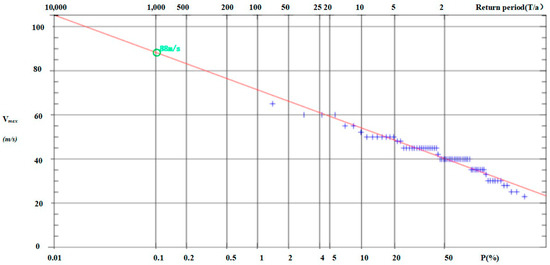
Figure 6.
Gumbel frequency distribution curve of the maximum wind speed.
According to the records of the maximum wind speed and the minimum pressure of the historical typhoon center in the best track set of tropical cyclones from 1949 to 2018, and referring to the wind-pressure relationship proposed by Atkinson-Holidy (1977), the measured data were regressed and counted, and the empirical formulas for calculating the maximum wind speed and the minimum pressure P0 value of the typhoon center are established as follows:
Using the best track data of tropical cyclones from 1949 to 2018 of the China Meteorological Administration (CMA), more than 50% of the tropical cyclones affecting the vicinity of the area of study move at 10 to 20 km/h, and nearly 80% of the tropical cyclones move at less than 20 km/h. The average moving speed of all samples was 15 km/h.
3.2. Assessment of Storm Surge Inundation Risk Based on High-Precision DEM Data
3.2.1. DEM Data Preprocessing
DEM data is the most important and fundamental data that directly impacts the results of storm surge inundation analysis. In this paper, high-precision DEM data with a spatial resolution of 1 m was utilized, supplemented by DEM data at a scale of 1:50,000 (with a resolution of approximately 28 m) for the surrounding area. The coverage of high-precision data (1 m) extended beyond the range of low-altitude coastal areas, providing reliable data support for the project.
In the ArcGIS software, the number of elevation points was comprehensively analyzed. Based on the effective range of data in the submerged area with maximum storm surge energy (876 hPa), a comprehensive comparison and inspection of the data were conducted to correct errors such as eliminating unreasonable depressions and highlands. The natural neighbor interpolation method was used to interpolate the corrected elevation point data, and finally the DEM raster data with a spatial resolution of 1 m was obtained.
3.2.2. The Method for Calculating Storm Surge Includes the Determination of Range and Water Depth
The storm surge submerged area under a specific tidal level was calculated using the DEM raster data modified by the tidal level data through the ArcGIS spatial analysis module. The main processes are as follows:
- (1)
- According to the model, the tidal level H under the influence of storm surge across six grades (876 hPa, 910 hPa, 920 hPa, 930 hPa, 940 hPa, and 950 hPa) along the coast was calculated.
- (2)
- According to the tidal level H, the modified DEM raster data were reclassified into two categories: ‘>H’ and ‘≤H’.
- (3)
- Among them, ‘≤H’ represents the ‘passive’ submerged area, and the grid file was converted into Polygon factor data. By applying condition judgment and selection, the corresponding Polygon factor data connected to the sea area was outputted, thereby converting the ‘passive’ submerged area into an ‘active’ submerged area and obtaining the range of submergence under each level of storm surge.
- (4)
- The Polygon element data of the ‘active’ submerged area was converted into Raster format, and as a judgment condition, the tidal level H and DEM data were algebraically subtracted to obtain the depth D of submerged water.
- (5)
- Referring to the relevant methods of “risk level determination” in the “Technical Guidelines for Risk Assessment and Zoning of Storm Surge Disasters,” an area with ‘D < 0.15 m’ is considered nondangerous and was excluded. By following steps (2) to (5), we finally obtain the submerged area with water depth ‘0.15 ≤ D < H’ and its corresponding water depth raster data.
- (6)
- For a small amount of edge burr data that does not conform to the actual situation due to the pixel resolution problem in the algebraic operation process, the modified water depth raster data can be obtained by filtering through the conditional selection tool. The water depth raster data was suitable for partially submerged areas of land, but for original land-water system areas such as rivers and pond surfaces, it was necessary to obtain presubmergence water depth data in order to determine storm surge depths under various grades.
4. Results
4.1. Storm Surges Induced by Different Typhoon Intensities
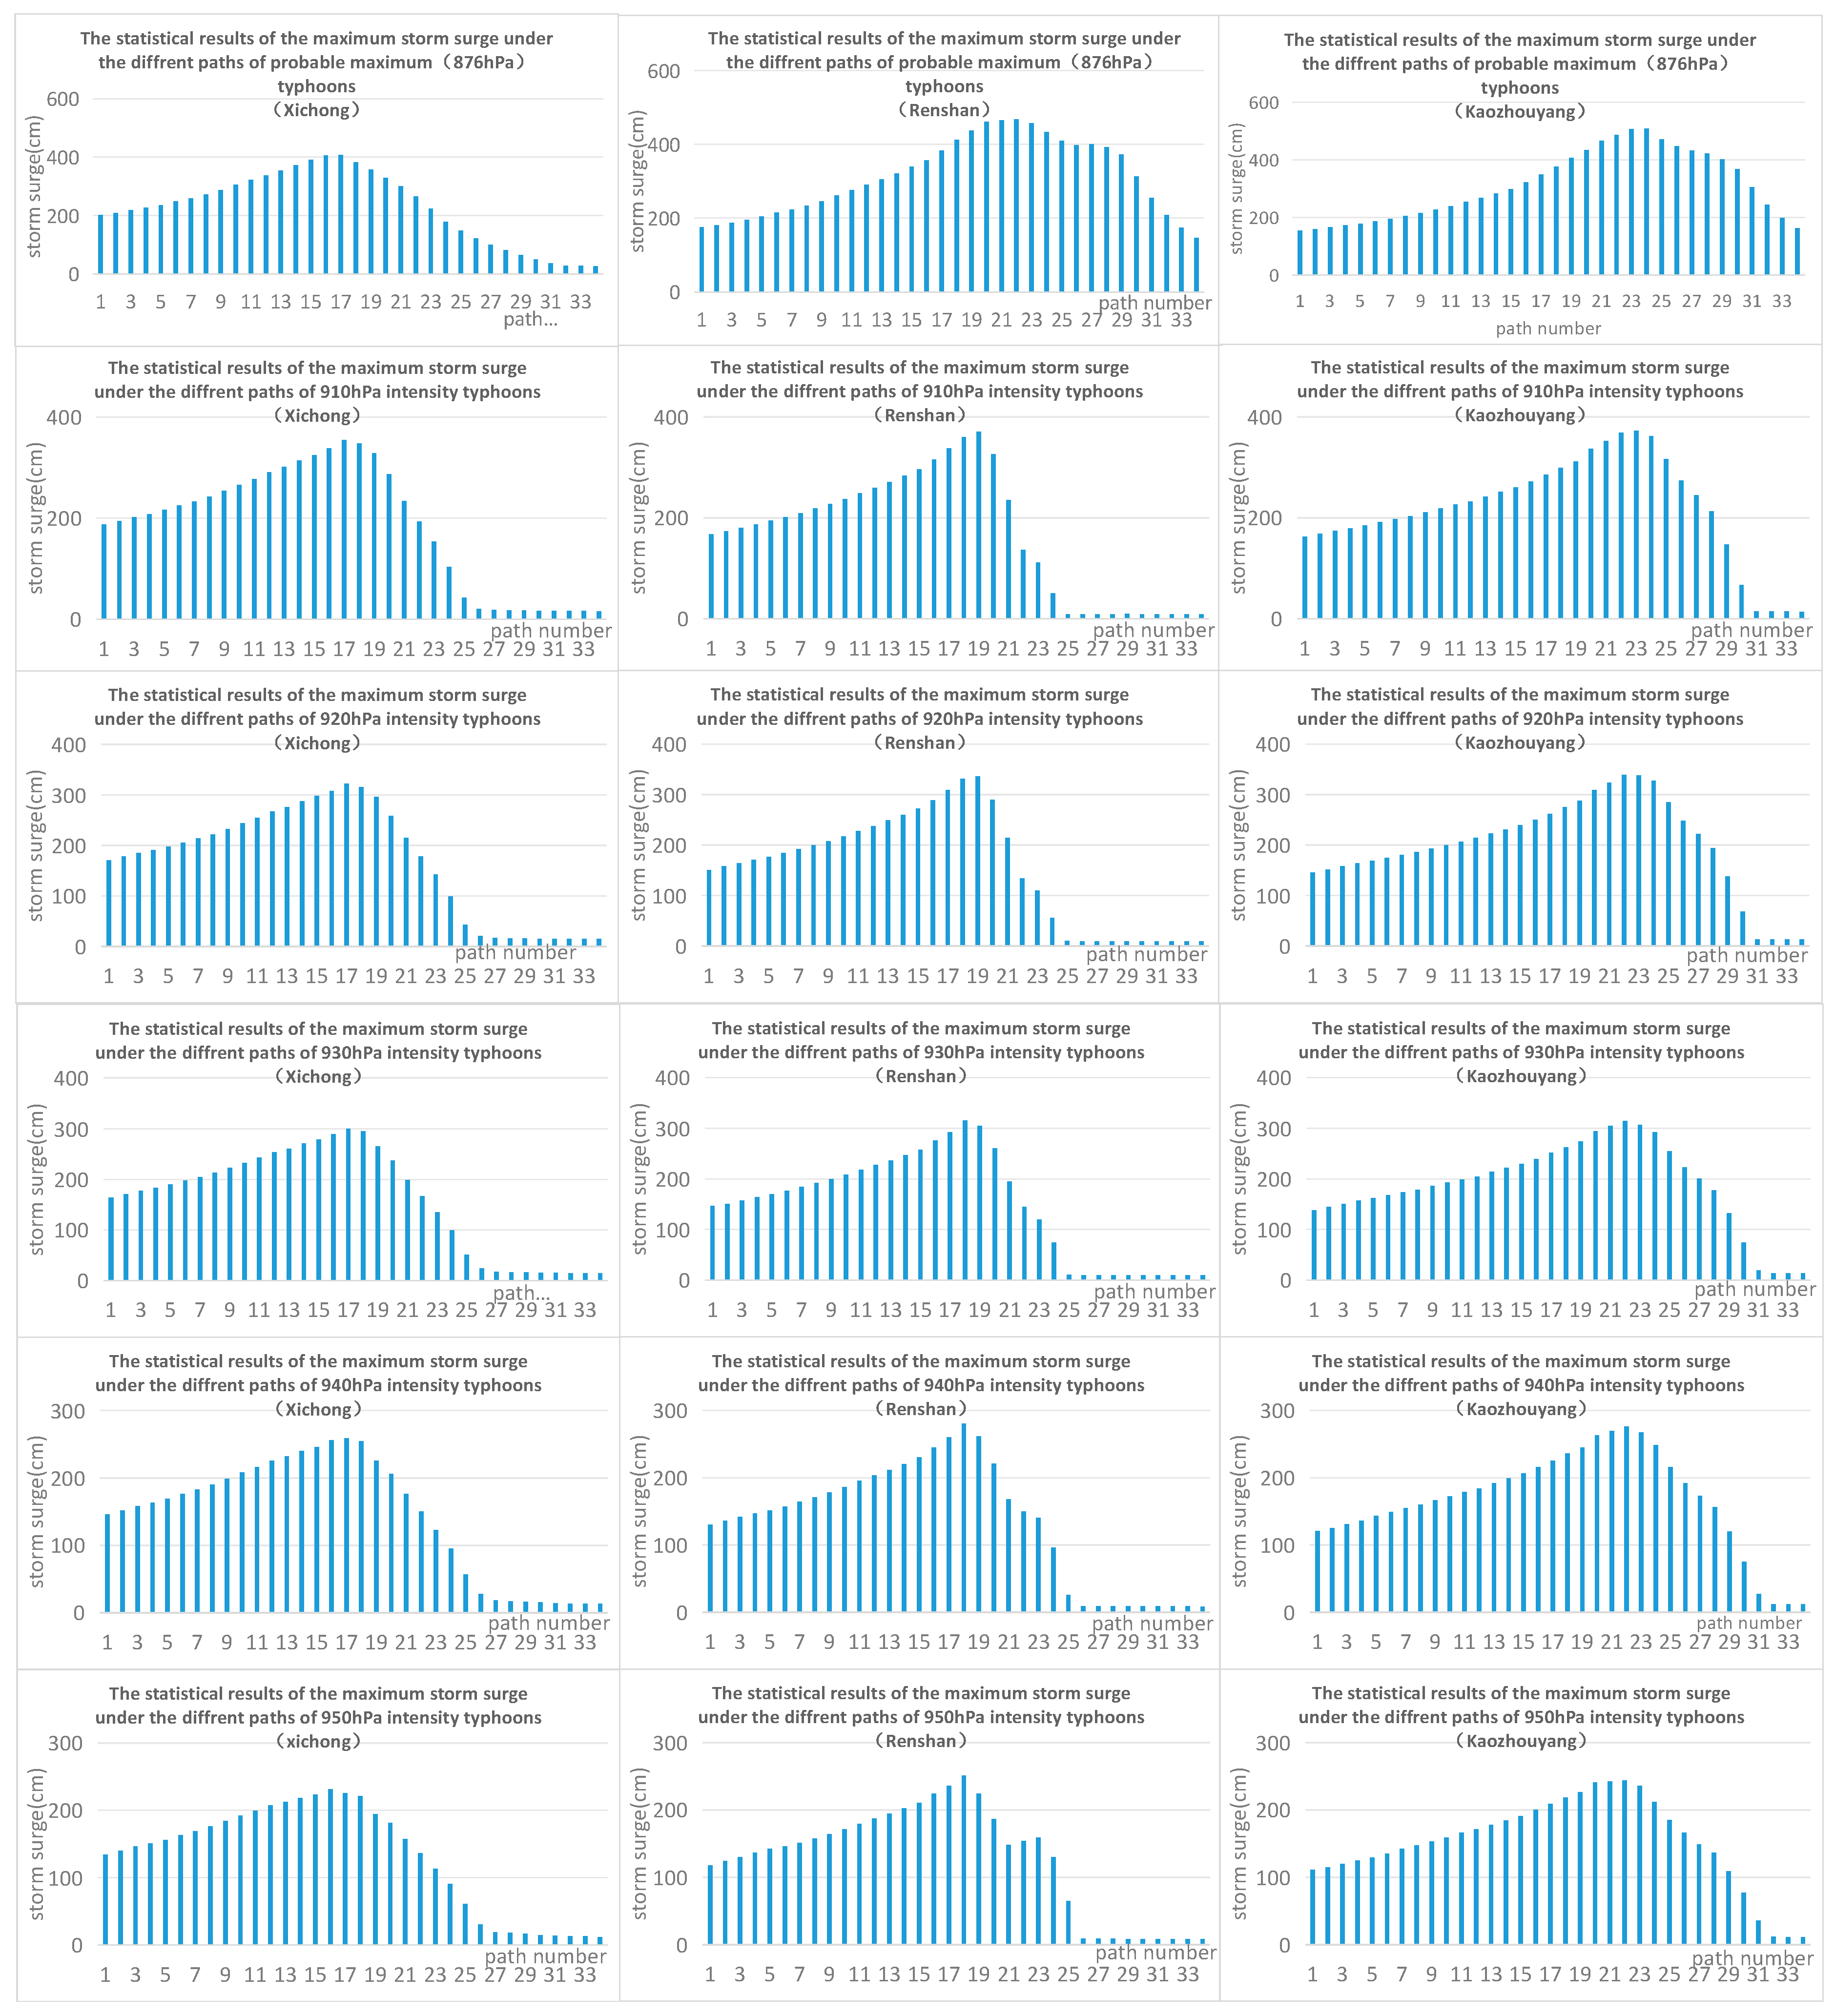
The storm surge and wave coupling model was used to simulate the storm surge under 34 typhoon tracks at six different intensity levels. The maximum storm surge under different grades of typhoon in three regions was calculated respectively. The statistical results of the maximum storm surge under different intensity typhoons are shown in Table 2 and Figure 7. The results show that: (1) the maximum storm surge generally increased with the increase in typhoon intensity; (2) the surge levels in Renshan and Kaozhouyang were higher than Xichong; and (3) under probable maximum typhoon (876 hPa), the storm surge of Renshan and Kaozhouyang was much larger than that of Xichong. However, for typhoons ranging from different intensities between 910 hPa to 950 hPa, the three regions exhibited a similar relationship between typhoon intensity and storm surge level.
Table 2.
The statistical results of the maximum storm surge (unit: cm) under different intensity typhoons.
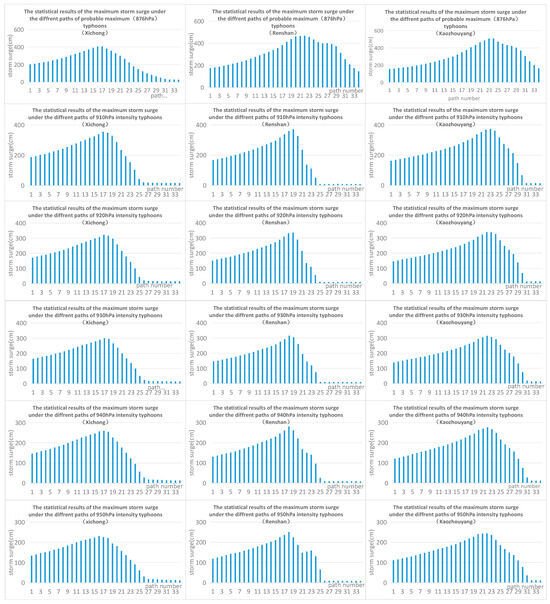
Figure 7.
The statistical results of the maximum storm surge for each path under different typhoon intensities (paths numbered from west to east).
4.2. Influences of Typhoon Paths
Figure 7 shows a comparison of the maximum surge levels at 34 typhoon paths (numbered from west to east) for six different typhoon intensities. Generally, the right semicircular area in the forward direction of the typhoon experiences an onshore wind, which brings about a large storm surge, while the left semicircular area encounters an offshore wind, typically resulting in a small storm surge or a decrease in water levels. From the figure, the affected typhoon areas for three regions can be observed as follows:
Typhoons that made landfall along the coast from Taishan to Xichong brought storm surges to the coast of Xichong. The typhoon that landed on the middle coast of Hong Kong (path number 17, Figure 5) caused the largest storm surge to the coast of Xichong. However, typhoons that landed in the west of Gangkou (path number 25, Figure 5) had little effect on Xichong. Typhoons that made landfall along the coast from Taishan to Gangkou brought storm surges to the coast of Renshan. The typhoon that landed on the west coast of Hong Kong (path number 19, Figure 5) caused the largest storm surge to the coast of Renshan. However, typhoons that landed in the west of Gangkou (path number 25, Figure 5) had little effect on Renshan. Typhoons that made landfall along the coast from Taishan to Zhelang brought storm surges to the coast of Kaozhouyang. The typhoon that landed on the east coast of Daya bay (path number 23, Figure 5) caused the largest storm surge to the coast of Kaozhouyang. However, typhoons that landed in the west of Zhelang (path number 30, Figure 5) had almost no effect on Kaozhouyang.
4.3. Analysis of Different Levels of Storm Surge Inundation
The results of the maximum surge level under different intensity levels of typhoons were superimposed on two different astronomical tide conditions: 10% monthly astronomical high tide level (1.95 m) and average tide level (0.66 m). The storm surge inundation range of the study area under six intensity levels was thus calculated using the ArcGIS spatial analysis module (Table 3).
Table 3.
Statistics of the submerged area (km2) under different typhoon intensities.
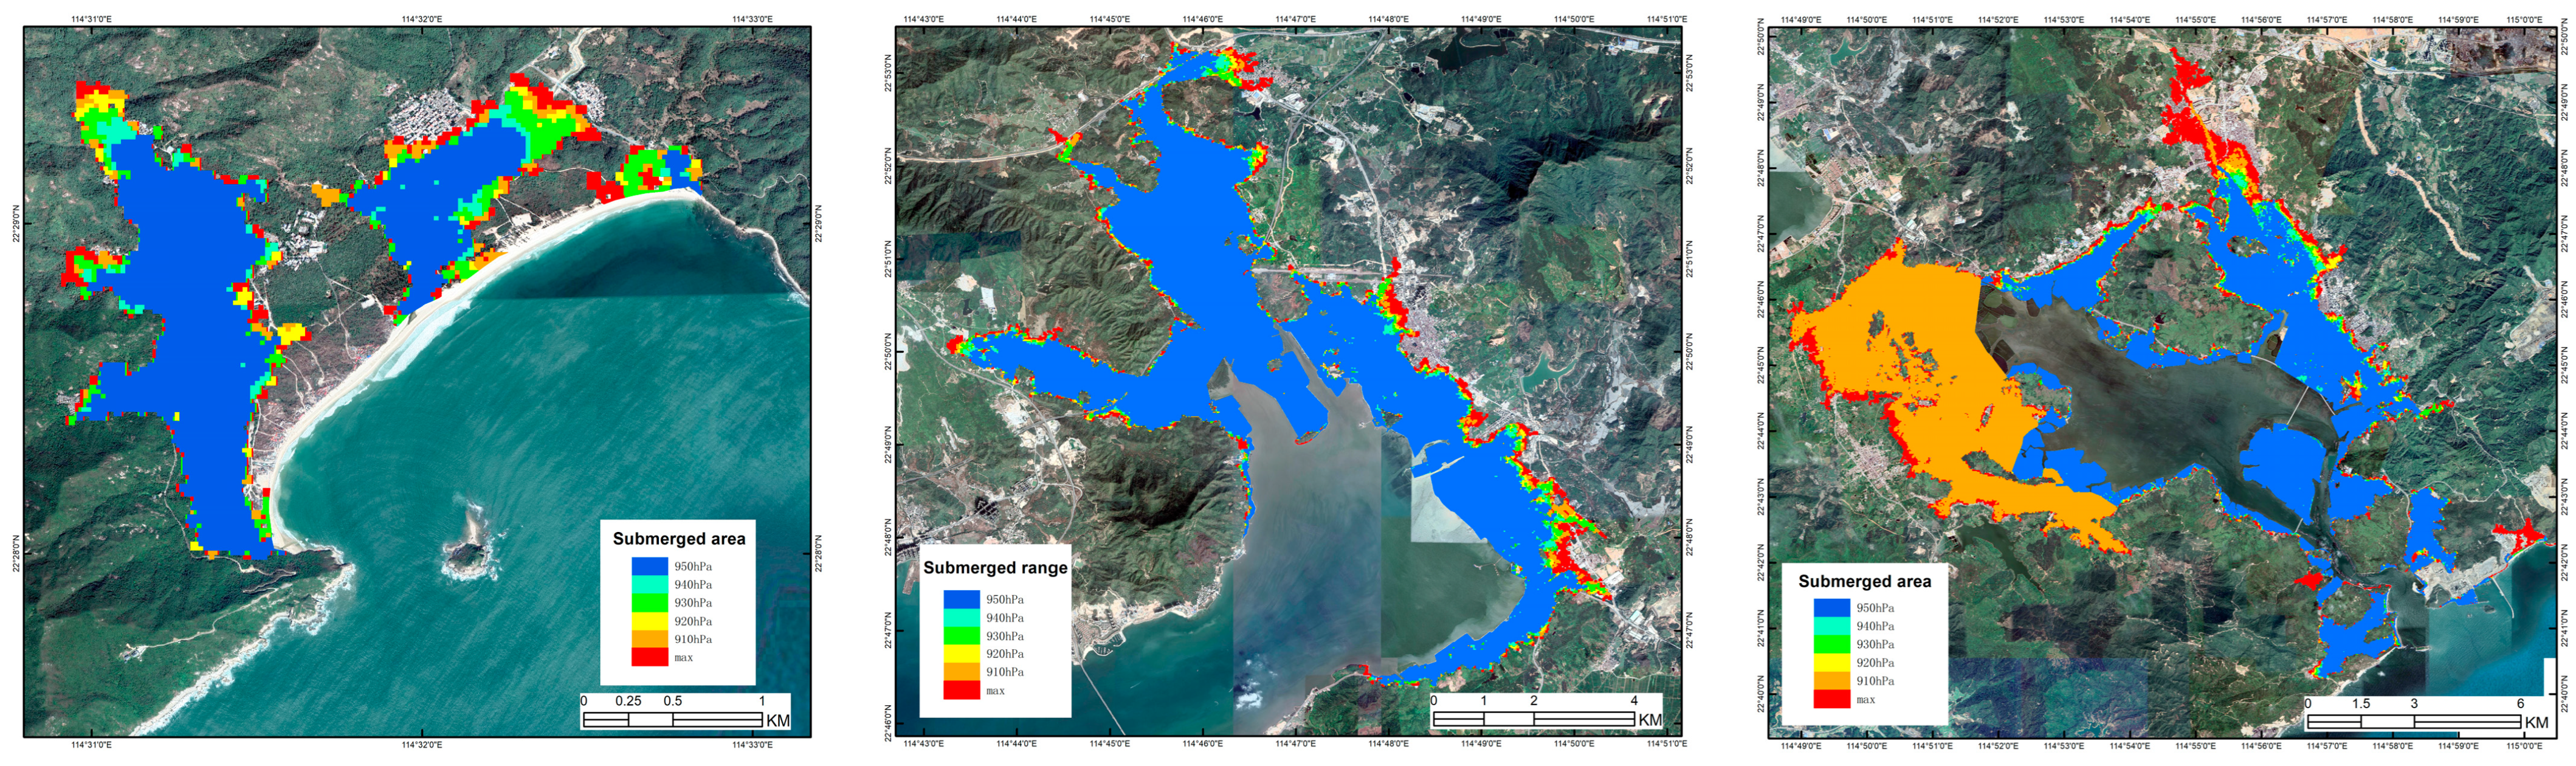
The comparison of the submergence range under each level of storm surge and the 10% monthly astronomical tide level (the average tidal level), as illustrated in Figure 8 and Figure 9, revealed that the stronger the typhoon level, the greater the submergence range. When considering the statistics of submergence area, a weakening of the typhoon level from 876 hPa to 950 hPa results in significant reductions. Specifically, under the 10% monthly astronomical tide, (1) the highest water level along the coast of Xichong decreases from 6.03 m to 4.26 m, with the submergence area shrinking from 2.4 km2 to 1.6 km2. (2) The highest water level along the coast of Renshan diminishes from 6.63 m to 4.46 m, accompanied by a reduction in submergence area from 31.9 km2 to 26.2 km2. (3) Similarly, at Kaozhouyang, the highest water level drops from 6.68 m to 4.04 m, and the submergence area decreases from 68.1 km2 to 30.3 km2.
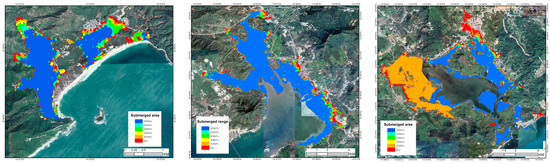
Figure 8.
The submergence range map under the 10% monthly astronomical high tide level is superimposed on the storm surge increase for each grade. (left: Xichong, middle: Renshan, right: Kaozhouyang).
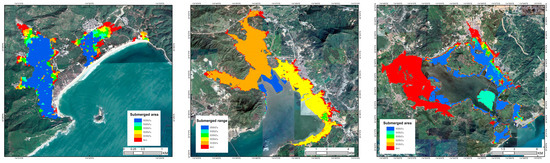
Figure 9.
The submergence range under the average tidal level superimposed by the storm surge of each grade. (left: Xichong, middle: Renshan, right: Kaozhouyang).
Under the average tidal level, (1) the highest water level on the Xichong coast falls from 4.74 m to 2.97 m, with a corresponding reduction in submergence area from 1.9 km2 to 1.2 km2. (2) The Renshan coast experiences a decrease in the highest water level from 5.34 m to 3.17 m, leading to a reduction in submergence area from 28.7 km2 to 1.9 km2. (3) Lastly, at Kaozhouyang, the highest water level decreases from 5.68 m to 3.04 m, and the submergence area diminishes from 62.4 km2 to 22.3 km2.
5. Discussion
5.1. Effect of Coastline Shapes on Storm Surges
The surge levels in Renshan and Kaozhouyang are higher than Xichong because the Renshan river valley estuary and Kaozhouyang are pocket-shaped, while Xichong has a relatively open terrain. Pocket-shaped terrain has an energy-gathering effect on storm surges. When the coastline or bay is shaped like a horn or pocket, this terrain exacerbates the storm surge as it enters the bay mouth, causing it to gradually amplify. Once the storm surge reaches the head of the bay, it becomes constrained and less able to disperse, the water level rises sharply, thereby intensifying its destructive force; the stronger the typhoon is, the more obvious the aggregation is. Under probable maximum typhoon (876 hPa), the storm surge of Renshan and Kaozhouyang is much larger than that of Xichong. However, for typhoons ranging from different intensities between 910 hPa to 950 hPa, the three regions exhibit a similar relationship between typhoon intensity and storm surge level.
5.2. Effect of Terrain Topography under Human Activities
The comparison of the submergence ranges under various storm surge levels and the 10% monthly astronomical tide level (the average tidal level) reveals that the stronger the typhoon, the greater the submergence range (Figure 8 and Figure 9). When considering the statistics of submerged areas, it becomes evident that as the typhoon’s intensity weakens from 876 hPa to 950 hPa, under both the 10% monthly astronomical tide and the average tidal level, the submerged areas are greater under the 10% monthly astronomical tide. However, these areas increase at a slower rate as the intensity of the typhoon intensifies (Table 3), due to the increasing elevation of the bedrock topography.
Under varying high water level conditions, the submerged areas along the study’s coastline differ significantly. When the highest water level along the coast is below 3 m, the submerged area primarily consists of low-lying regions, including ponds and fields near the coast of the Xichong River, as well as ponds and fields along the middle and lower reaches of the freshwater. Conversely, when the highest water level exceeds 4.0 m, there is minimal change in the submerged area and the residential area within its scope. When the highest water level along the coast remains below 3.5 m, the submerged area primarily encompasses low-lying regions like ponds and fields near the coast of Renshan. However, if the highest water level surpasses 4.5 m, there is minimal change in both the submerged area and the residential area within its range. For a coastline with a highest water level under 3.0 m, the submerged area is dominated by low-lying regions, such as ponds and fields near the coast of Kaozhuyang. If the highest water level exceeds 4.3 m, there is little variation in the submerged area and the residential area it encompasses. Under the same typhoon intensity, the total water level can vary significantly, resulting in differing submerged ranges depending on the superposition of precipitation with various astronomical tide conditions. For instance, in Renshan under a 950 hPa typhoon, the submerged area is 30.3 km2 and 1.9 km2, respectively, under the conditions of a 10% monthly astronomical tide high tide level and an average tidal level. The difference in submerged area is substantial.
6. Conclusions
To map the inundation caused by storm surges in coastal regions, GIS spatial analysis was coupled with process-based modelling of storm surges. A total of 204 numerical experiments of storm surge modelling were conducted to obtain the statistical worst surge level and the first-order submerged areas along the coast. Three coastal regions in the south east of the Guangdong–Macao–Hong Kong Great Bay Area were chosen as case studies for the presented approaches. Based on the results, the following conclusions were drawn:
The coastline shape affects the storm surge level. Both the Renshan river valley estuary and the Kaozhouyang exhibit pocket-shaped terrain, whereas the Xichong area’s terrain is relatively open. Consequently, the surge levels in Renshan and Kaozhouyang are higher than those in Xichong. Whether the storm surge can cause disasters depends largely on whether the maximum storm surge overlaps with the astronomical tide, especially with the high tide of astronomical spring tide. However, the submerged areas increase at a slower rate as the intensity of the typhoon intensifies due to the increasing elevation of the bedrock topography. Whether the storm surge causes disasters is ultimately reflected in the water level in front of the embankment. When the highest water level along the coast is lower than 3 m, the submerged area is mainly the low-lying areas such as ponds and fields of coast of the study areas. When the highest water level is greater than 4.0 m, the submerged area and the residential area within the scope have little change.
This study suggests that the GIS application, coupled with numerical modelling of storm surges, is a promising approach for large-scale assessment of storm-induced inundation, which can be generalized for regional and national first-order assessments. The more complex flooding dynamics will need to be developed when the terrestrial bottom friction information, heavily modified by human activities, can be obtained. Moreover, understanding the impact of coastline morphology and subaerial anthropogenically modified topography on storm surges and inundation is critical in grasping the behavior of storm surges and in efforts to prevent and mitigate storm surge disasters. It is recommended to increase observation equipment along the coast, reinforce the height of seawalls, and provide early warnings to reduce the occurrence of disasters in those anthropogenically infilled estuaries.
Author Contributions
Software, B.X.; Validation, J.Z. (Junpeng Zhao) and C.L.; Data curation, W.X. and W.Z.; Writing—original draft, J.Z. (Juan Zhang) and J.D.; Writing—review & editing, J.Z. (Juan Zhang) and J.D. All authors have read and agreed to the published version of the manuscript.
Funding
This study was supported by the National Natural Science Foundation of China, and the project number is 52071350. Junjie Deng is supported by the National Natural Science Foundation of China, China (Grant No. 42161160305; 42476152; U1901209).
Data Availability Statement
The data presented in this study are available on request from the corresponding author. The data are not publicly available due to the cumbersome amount of data.
Conflicts of Interest
The authors declare no conflict of interest.
References
- Dana, M. Real-time, sketch-based GIS database. In Proceedings of the GeoDesign Summit, Redlands, CA, USA, 6–8 January 2010; pp. 230–236. [Google Scholar]
- Goodchild, M. Spatial by design. In Proceedings of the GeoDesign Summit, Redlands, CA, USA, 6–8 January 2010; pp. 419–423. [Google Scholar]
- Wu, W.; Sun, W.-X. The calculation of storm surge inundations some coasts of time bohai sea. J. Ocean. Univ. Qingdao 1995, 25, 146–152. [Google Scholar]
- Sha, R.-N.; Yin, B.-S.; Yang, D.-Z. A numerical study on storm surge and inundation induced by hurricanes in the nearshore of Tianjin. Mar. Sci. 2007, 31, 63–67. [Google Scholar]
- Zhu, J.-Z.; Yu, P.-B. Numerical method for the storm tide overflow model in Hangzhou bay and Qiantangjiang estuary. Adv. Water Sci. 2009, 20, 269–274. [Google Scholar]
- Wu, W.; Fu, C.-F.; Yu, F.-J.; Liu, Q.-X. Numerical simulation of the influence of Wenzhou coastal dike on storm surge inundation. J. Mar. Sci. 2012, 30, 36. [Google Scholar]
- Cao, C.H.; Bau, T.; Gao, S.; Xu, J.; Cao, Y.; Wu, L.; Zhao, P. High resolution 3D storm surge and inundation numerical model used in the Jiaozhou Bay. Mar. Sci. 2013, 37, 118–125. [Google Scholar]
- Li, Y.; Fang, W.-H.; Lin, W.; Ye, Y.-T. Parameterization of synthetic tropical cyclones at various scales for probable maximum storm surge risk modeling. Mar. Sci. 2014, 38, 71–80. [Google Scholar]
- Zhang, X.-J.; Deng, Y.-F.; Qiu, J.-F.; Bei, Z.Y.; Chen, B.R.; Wang, J.; Qian, Y.C.; Huang, W.T. Preliminary Exploration and Application of Integrated Method of Storm Surge Disaster Risk Assessment and Zoning Results in Adjacent Areas. Ocean. Dev. Manag. 2022, 39, 43–48. [Google Scholar]
- Ding, Y.-R.; Wang, S.-B.; Liu, S.-C. Research on the risk assessment and zoning of storm surge in Huanghua City. Mar. Forecast. 2022, 39, 9–15. [Google Scholar]
- Zhang, M.; Luo, J.; Hu, J.L.; Zeng, X.Z. Inundation risk assessment of storm surge along Lei Zhou coastal areas. J. Trop. Oceanogr. 2019, 38, 1–12. [Google Scholar]
- Mu, L.; Liu, D.-R.; Wang, D.-S. A Typhoon Storm Surge Risk Assessment Method and System Based on ArcGIS Platform. Chinese Patent CN110377674A, 25 October 2019. [Google Scholar]
- Gao, Z.-C.; Yu, M.; Ding, Z.-D. Typhoon storm surge risk assessment based on GIS-A case study of Taizhou. Mar. Environ. Sci. 2012, 21, 439–447. [Google Scholar]
- Liang, H.-Y.; Zhou, X.-Q. Risk assessment on storm surge in the Haikou Bay. Acta Oceanol. Sin. 2005, 27, 22–29. [Google Scholar]
- Tang, F.-P.; Guo, J.-B.; Yu, H.-F.; Pan, X.-J. Scenario simulation method and plantform of typhoon storm surge inundation based on geographic information system. Geogr. Geo-Inf. Sci. 2019, 35, 6–19. [Google Scholar]
- Wang, X.-N.; Wang, X.-W.; Huang, H.-B.; Liu, C.X. Research on storm surge disaster risk early warning method based on GIS. China Flood Drought Manag. 2021, 31, 15–20. [Google Scholar]
- Wang, S.; Mu, L.; Qin, H.; Wang, L.Z.; Yao, Z.F.; Zhao, E.J. The utilization of physically based models and GIS techniques for comprehensive risk assessment of storm surge: A case study of Huizhou. Coast. Ocean. Process. 2022, 9, 939380. [Google Scholar] [CrossRef]
- Besset, M.; Anthony, E.J.; Bouchette, F. Multi-decadal variations in delta shorelines and their relationship to river sediment supply: An assessment and review. Earth Sci. Rev. 2019, 193, 199–219. [Google Scholar] [CrossRef]
- Deng, J.; Bao, Y. Morphologic evolution and hydrodynamic variation during the last 30 years in the LINGDING Bay, South China Sea. J. Coast. Res. SI 2011, 64, 1482–1489. [Google Scholar]
- Wei, X.; Cai, S.; Zhan, W. Impact of anthropogenic activities on morphological and deposition flux changes in the Pearl River Estuary, China. Sci. Rep. 2021, 11, 16643. [Google Scholar] [CrossRef] [PubMed]
- Zhang, X.; Lin, J.; Huang, H.; Deng, J.; Chen, A. Analysis on the Dynamics of Coastline and Reclamation in Pearl River Estuary in China for Nearly Last Half Century. Water 2022, 14, 1228. [Google Scholar] [CrossRef]
- Kolar, R.L.; Gray, W.G.; Westerink, J.J.; Luettich, R.A., Jr. Shallow water modeling in spherical coordinates: Equation formulation, numerical implementation and application. J. Hydraul. Res. 1994, 32, 3–24. [Google Scholar] [CrossRef]
- Jelesnianski, C.P. Numerical computations of storm surges without bottom stress. Mon. Weather Rev. 1966, 94, 379–394. [Google Scholar] [CrossRef]
- HY/T0273-2019; Technical Directives for Risk Assessment and Zoning of Marine Disasters Part 1: Storm Surge. The Ministry of Natural Resources of the People’s Republic China: Beijing, China, 2019.


Disclaimer/Publisher’s Note: The statements, opinions and data contained in all publications are solely those of the individual author(s) and contributor(s) and not of MDPI and/or the editor(s). MDPI and/or the editor(s) disclaim responsibility for any injury to people or property resulting from any ideas, methods, instructions or products referred to in the content. |
© 2024 by the authors. Licensee MDPI, Basel, Switzerland. This article is an open access article distributed under the terms and conditions of the Creative Commons Attribution (CC BY) license (https://creativecommons.org/licenses/by/4.0/).