Abstract
The Kongquehe Sag, located in the western Lop Nur, has abundant pore subsurface brine. In order to study the source and origin, we tested and analyzed the hydrochemical composition and stable isotopes of the subsurface brine. The findings reveal that the brine exhibits a moderate to low degree of mineralization, with values ranging from 50.50 g/L to 91.14 g/L. The stable isotope compositions of unconfined and confined waters are different, with the mean values of δD being −8.00‰ and −51.75‰ and the mean values of δ18O being 10.08‰ and −6.01‰. These values are indicative of an intense evaporative environment prevalent in the Kongquehe Sag area. Furthermore, the 87Sr/86Sr ratios vary between 0.710642 and 0.710837, and δ34S values range from 9.2 to 10.7. These data suggest the long-term evolution of sulfur substances, predominantly through dissolution and sedimentation processes, with minimal influence from redox reactions. The data garnered from this research not only offer a novel perspective of the insights gained into the hydrochemical characteristics and the stable isotope signatures of the brines in the Kongquehe Sag area but also enriches the theoretical framework concerning the source and origin of subsurface brines, potentially informing future exploration strategies.
1. Introduction
Brine is rich in various valuable elements, including economically significant ones like K+, Li+, and B3+. These elements have served as vital sources of essential compounds utilized by humans [1,2]. The potassium reserves found in brine are crucial to the global production and supply of potash [3]. In 2020, worldwide potash production capacity reached 62.4 million tons, with K-rich brine deposits accounting for 21.64% of this total [4]. The key production regions include Qarhan Salt Lake, Lop Nur Salt Lake, the Dead Sea, Atacama Salt Lake, and Great Salt Lake [5,6].
Lop Nur is located between the East Tianshan Mountains and the Altun Mountains in China and is the lowest place in the Tarim Basin [7]. As the catchment center, the Lop Nur area accumulated significant amounts of salt brought from the Tarim River basin during geological historic times and is thus thought to be one of the most favorable prospects for potash deposit formation in China [8,9]. Nevertheless, most current research has focused on the eastern part of Lop Nur, and whether the western part has the potential for potassium formation remains unknown. This has recently become an important topic for scholars to study.
Recently, the authors’ team found a number of small salt lakes in the Kongquehe Sag area, mainly composed of Quaternary sediment deposits, distributed in a fusiform ring belt. The outer ring of the salt lake is eolian sand, the secondary outer ring is saline soil, the inner ring is a salt deposit, and the degree of mineralization of surface brine is 320 g/L, and the potassium ion content is 1303 mg/L, reaching the grade of brine potassium salt mining, indicating that the Kongquehe Sag area has good prospects for potassium exploration. However, to date, a comprehensive understanding of the brine in this area is lacking, and the origin of the brine is still unclear.
Isotopes of hydrogen, oxygen, sulfur, and strontium are frequently utilized as tracers to indicate the origin of salt lakes and subsurface brines, as well as water exchange. In addition, calculating and analyzing the hydrochemical composition and characteristic coefficient of subsurface brine can reveal the water chemistry types and evolution of subsurface brine [10,11,12]. Zhao et al. (2024) analyzed the S, Sr, H, and O isotopes of Mahai Salt Lake and its surrounding waters and found that the water sources were river and fault-related waters mixed in a ratio greater than 15:1 [13]. Yang et al. (2024) revealed that Ca-Cl type brines in the Qaidam Basin with high Sr2+ concentrations and high 87Sr/86Sr ratios are supplied by springs or infiltrate along faults [14]. Yang et al. (2023) collected and tested isotopes of surface water and groundwater in five typical watersheds in Qaidam Basin, using hydrochemistry, isotopes, and other methods for cause analyses, understanding the spatial and temporal variations in surface water and groundwater chemistry and isotopes [15].
To reveal the material source and origin of the brine from the Kongquehe Sag area, we analyzed the hydrochemical composition and H–O–S–Sr isotope characteristics of the brine. The obtained results will provide new data for the related exploration of potash salt in the western part of the Lop Nur region.
2. Materials and Methods
2.1. Study Area
The Kongquehe Sag area (87°10′10.98″ E, 40°47′31.90″ N) is located in the west of Lop Nur (Figure 1b). The regions feature a warm, temperate, continental, arid climate; rainfall is scarce, evaporation is strong, sunshine is abundant, and heat is abundant [16]. The annual precipitation fluctuates within the range of 20–30 mm, and the annual potential evaporation reaches 2000–3000 mm. The average annual temperature is 11.5 °C; the lowest temperature recorded is observed in December, whereas the highest temperature is observed in July. The annual sunshine duration is 2800–3100 h, and the percentage of sunshine is 58–75%.
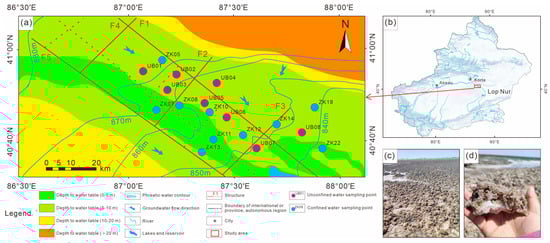
Figure 1.
(a) Schematic hydrogeological map of Kongquehe Sag area and sampling location; (b) bitmap of the study area; (c,d) salt-crust photograph of the small salt lake in the Kongquehe Sag.
In terms of its geotectonic position, the Kongquehe Sag belongs to a secondary structural unit in the north depression of the Tarim Basin [17]. There are two groups of faults, NW-directed and NE-directed, as well as several secondary sags. The strata in this area are mainly Quaternary eolian deposits, scouring proluvial deposits, and chemical deposits. Chemical deposits are mainly distributed in small dry salt lakes on both sides of the Tarim River, and the surface is covered by a large area of salt shells and salt flats (Figure 1c,d). The main components are halite and glauberite. According to the lithological changes in strata revealed by the borehole, the surface is fine-grained sand; the middle part is medium-fine-grained sand, clay and silty soil interbedded layer, and silty soil and fine-grained sand interbedded layer in the lower part (Figure 2).
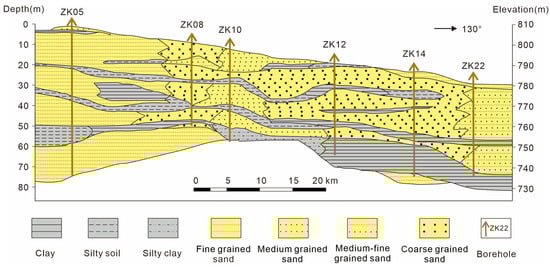
Figure 2.
Lithological section of the Kongquehe Sag area.
The subsurface brine mainly exists in the medium-fine-grained sand and coarse-grained sand layers of the Upper Pleistocene of the Quaternary system. It is pore brine with buried water depths of 2.20–7.12 m and unit water influx of 0.42–0.95 L/s·m and is moderately rich in water (0.1–1.0 L/s·m is medium water yield property). The thickness of the aquifer is between 15 and 38 m, and the water permeability coefficient K = 4–8 m/d, permeability is good (1–10 m/d is medium permeability). The water-resisting layer is a Quaternary lacustrine clay and silty clay layer with a thickness ranging from 1.0 to 20.0 m, generally within 3.0–7.0 m. The top and bottom layers are good water barrier layers with horizontal occurrence, which is conducive to the preservation of brine.
2.2. Sampling and Analysis
In this study, a total of 10 confined brine samples were collected from boreholes in 2023, as well as 8 unconfined brine samples in the Kongquehe Sag area (Figure 1a). Before brine collection, the 10 L polyethylene sampling barrel prepared in advance was cleaned three times with brine in the drilling hole, and the deep brine was extracted from the drilling hole to test its temperature and pH on-site [18]. To prevent evaporation of the collected samples, they were packed directly into the sampling drum and wrapped in plastic wrap, and then returned to the laboratory for testing as soon as possible at low temperatures, covered to avoid sunlight during transportation [19]. The hydrochemical composition, along with H–O–S–Sr isotope analyses, was conducted at the State Key Laboratory of Biogeology and Environmental Geology at the China University of Geosciences.
The tested items included pH value, K+, Ca2+, Na+, Mg2+, Cl−, SO42−, HCO3−, Br−, degree of mineralization, and other components. Among them, the contents of Mg2+ and Ca2+ were determined by complexometric titration, and the test error was less than 0.2%. The content of Cl− was determined by the silver method, and the test error was less than 0.2%. The content of HCO3− was determined by hydrochloric acid titration, and the test error was less than 0.2%. The content of K+ was determined by the sodium tetraphenylborate method, and the test error was less than 0.5%. The content of SO42− was determined by the barium sulfate method, and the test error was less than 0.5%. The Na+ content was calculated by difference subtraction, and the error was less than 2.0%. The content of Br− was determined by the spectrophotometric method, and the test error was less than 1.0%. The pH value was determined by the glass electrode method, and the test error was less than 1.0%. The degree of mineralization was determined by the gravimetric method, and the test error was less than 1.0%. The density was determined by the hydrometer method, and the test error was less than 1.0%.
The H and O isotopes were measured using a liquid water isotope laser analyzer, and the calculated results were expressed as the kilowatt difference δ of Vienna Standard Mean Ocean Water (VSMOW). The test accuracy reached 0.5‰ and 0.1‰, respectively. S isotopes were determined using a Thermoquest Finnigan Delta PlusXL (Thermo Fisher Scientific, Waltham, MA, USA) isotope ratio mass spectrometer. V-CDT was used as the standard for S isotopes. The analysis error was controlled within ±0.2‰. Sr isotopes were tested using a Nu Plasma II (Nu Instruments, Wrexham, UK) multi-collector inductively coupled plasma mass spectrometry (MC-ICP-MS), and the NIST SRM 987 Sr isotope reference material was used as the standard sample. The test accuracy was 0.000001.
3. Results
3.1. Brine Water Chemical Characteristics
3.1.1. Types of Water Chemistry
The analysis and detection results are shown in Table 1. The pH values of confined brines in the study area ranged from 7.31 to 8.27, with an average of 8.08, and unconfined brines ranged from 8.15 to 8.31, with an average of 8.24. The density of confined brines ranged from 1.05 to 1.15 g/cm3, with an average of 1.09 g/cm3, and unconfined brines ranged from 1.09 to 1.14 g/cm3, with an average of 1.12. The mineralization of confined brines was between 50.50 and 91.14 g/L, with an average of 64.14 g/L, and unconfined brines was between 63.38 and 79.87 g/L, with an average of 69.29 g/L. According to the Kurnakov–Valyashko classification [20], the main type of brine in the study area is the magnesium sulfate subtype.

Table 1.
The analysis results of hydrochemistry in brine.
3.1.2. Ion Content
The ion content analysis results indicate that Na+ and Cl− were absolutely dominant among the macroions. From the perspective of cation composition, ρ(Na+) > ρ(Mg2+) > ρ(Ca2+) > ρ(K+), the mass concentration of Na+ + K+ was between 15.16 and 29.81 g/L, and the mass concentrations of Mg2+ and Ca2+ were small. The main anion composition was ρ(Cl analysis results) > ρ(SO42−) > ρ(HCO3−), the mass concentration of Cl− was between 26.63 and 53.62 g/L, and the mass concentration of Cl− was more than one order of magnitude different from that of HCO3−. The order of trace element ion contents in the brine was Sr2+ > Br− > Li+. The content of Sr2+ was 25.67–45.13 mg/L, with an average of 33.18 mg/L; the content of Br− was 2.86–14.87 mg/L, with an average of 8.09 mg/L; and the content of Li+ was 0.16–0.51 mg/L, with an average of 0.37 mg/L.
3.1.3. Hydro-Geochemical Coefficients
Previous studies have shown that the source and evolution of subsurface brine can be revealed by calculating the hydrogeochemical coefficients of the brine [21]. For any ion x, ρx represents the mass concentration, and nx represents the molarity. The hydrogeochemical coefficients in the study area were calculated according to the test results of sample analysis. As shown in Table 2, the sodium/chloride coefficient ranged from 0.83 to 0.99, with an average value of 0.93. The bromine/chlorine coefficient ranged from 0.18 to 0.47, with an average value of 0.33. The desulfurization coefficient ranged from 2.60 to 8.21, with an average value of 6.46. The coefficients of calcium/magnesium ranged from 0.29 to 1.28, with an average of 0.50. The potassium/chloride coefficient ranged from 0.68 to 5.17, with an average value of 3.73.
Table 2.
Hydrogeochemical coefficients of brine sample.
3.2. Characteristics of Isotopic Composition of Brine
3.2.1. H–O Isotope Composition Characteristics
Hydrogen and oxygen isotopic compositions are strong evidence for the analysis of water-recharged sources and have been widely used in groundwater and brines in various geological periods [22]. In research, water movement can be traced on a regional scale. Table 3 shows that the δD values of the confined brines in the study area ranged from −57.60‰ to −47.39‰, with an average of −51.76‰, and the δ18O values ranged from −7.64‰ to −4.99‰, with an average of −6.01‰. The δD values of the unconfined brines ranged from −12.48‰ to −3.34‰, with an average of −8.00‰, and the δ18O values ranged from 3.08‰ to 14.56‰, with an average of 10.08‰. Among them, δD and δ18O of unconfined brines > δD and δ18O of confined brines.
Table 3.
H–O–S–Sr isotope composition in different water bodies.
3.2.2. Characteristics of S Isotope Composition
The difference in the δ34S values of sulfate in natural water reflects the characteristics of sulfur isotope fractionation [23]. The source of sulfur in water can be determined by comparison. Table 3 shows that the δ34S values of the confined brines in the study area ranged from 9.20 to 10.70, with an average of 10.03. The δ34S values of unconfined brines varied from 9.80 to 10.50, with an average of 10.21. Among them, δ34S of unconfined brines > δ34S of confined brines, but the differences were not large.
3.2.3. Characteristics of Sr Isotope Composition
Unlike hydrogen and oxygen isotopes, the strontium isotopic composition of groundwater is similar to the isotopic composition of the bedrock with which it interacted and is almost unaffected by fractionation or mineral precipitation. Therefore, strontium isotopes are often used as indicators of sources of solutes in natural waters, water–rock interactions, and water mixing [24]. Table 3 shows that the 87Sr/86Sr values of confined brines in the study area ranged from 0.710642 to 0.710837, with an average value of 0.710767. The 87Sr/86Sr values of unconfined brines ranged from 0.710779 to 0.710821, with an average of 0.710801. Among them, 87Sr/86Sr of unconfined brines > 87Sr/86Sr of confined brines.
4. Discussions
4.1. Source of Brine Supply
In the Piper diagram (Figure 3), the cations in the subsurface brine are concentrated in the Na+ + K+ end element; the contents of these two cations accounted for more than 90% of the total cations, and the contents of Mg2+ and Ca2+ were very low. The main anions were Cl− + SO42−, which accounted for more than 90% of the total anions. Of these, Cl− was the main anion, with a small amount of SO42−; HCO3− and CO32− contents were very low, reflecting that these brine samples were rarely affected by atmospheric water mixing. The macroelement contents are almost the same between the confined brines and unconfined brines. Because the study area is located in the depression of the northern Tarim Basin, the ice-snow melting water, rainfall infiltration, and groundwater recharge of the northern mountain system continue to gather in this area from the surrounding areas. After dissolving soluble salt ions from the rocks, the water migrates to low-lying areas [25]. After long-term accumulation, coupled with evaporation and concentration under arid climate conditions, brine with a high degree of mineralization is ultimately formed [26].
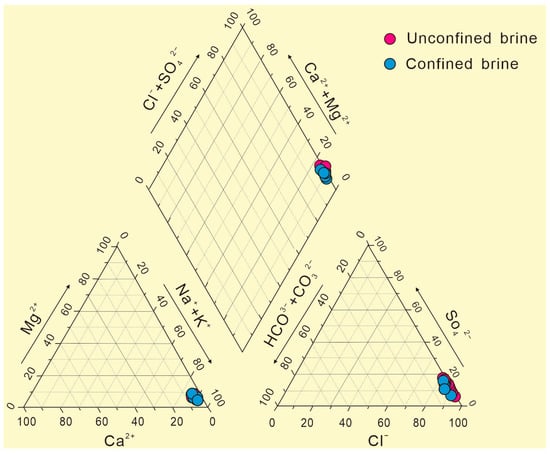
Figure 3.
The Piper diagram of confined brines and unconfined brines.
To investigate the origin of subsurface brine in the Kongquehe Sag area, the ion characteristic coefficients of the five brines were analyzed [27]. The average sodium/chloride coefficient of brine in the study area was 0.93, which is higher than that of normal seawater (0.87) and close to 1. This can be attributed to the dissolution of salt and indicates non-marine brine. The bromine/chlorine coefficient of the brine in the study area was an average of 0.35. That of normal seawater is 3.4, that of sedimentary metamorphic brine is >3.4, and that of halite-dissolution brine was 0.083–0.83. Thus, the subsurface brine in the study area is of the formation mechanism of the dissolution and filtration of salts. The desulfurization coefficient had an average value of 6.11. Generally, when this value is closer to 0, it indicates a better sealing property. The coefficient of deep subsurface brine in the study area was small (2.60), indicating a better-sealing property, whereas that of the shallow brine was worse. The calcium/magnesium coefficient had an average value of 0.56. Generally, a longer sealing time represents a better-sealing property and a higher degree of metamorphism. The coefficient of the deep subsurface brine in the study area was larger (1.28), indicating that the sealing property was relatively good and the metamorphism degree was relatively high. The potassium/chloride coefficient had an average value of 3.47. In general, when the potassium/chloride coefficient is greater than 75, the brine is rich in K, indicating that the deposition period of the study area has not reached the stage of K salt precipitation [28]. In summary, the subsurface brine in the Kongquehe Sag area may have come from early terrestrial saline lake deposits; the deep brine system was relatively closed during the formation process; the degree of metamorphism was higher; and there were sources of halite-dissolution brine.
4.2. Cause Analysis
The H–O isotope data of the subsurface brine samples from the study area were projected into the H–O relationship diagram, as shown in Figure 4. They all deviated from the GMWL and were located at the lower right of the GMWL, roughly divided into confined brines and unconfined brines, and the δD and δ18O of the unconfined brines were significantly more enriched than those of the confined brines. This phenomenon is more common in dry climates or closed basins [29]. Because the climate of the Tarim Basin, where the Kongquehe Sag area is located, is extremely arid, the annual evaporation is much larger than the precipitation, and the subsurface brine is mainly replenished by surface water. The unconfined brines are shallowly buried, and the dynamic fractionation of H–O isotopes in the water body continues during the evaporation process, which makes the isotopes more enriched. In addition, in the process of lateral infiltration and recharge, unconfined brines may dissolve and filter the salt substances in the formation and achieve equilibrium with oxygen-containing minerals by isotope exchange reaction, which also leads to the fractionation of H–O isotopes in the water body [30]. Therefore, the subsurface brine in the Kongquehe Sag area is likely formed by the combined action of evaporation and salt leaching.
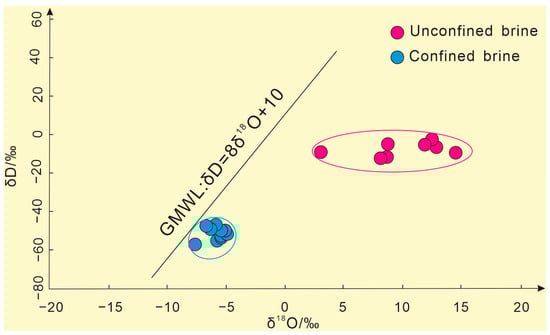
Figure 4.
The H–O isotope composition of confined brines and unconfined brines.
The factors of sulfur isotope fractionation mainly include the mixing of different sulfur isotope sources and biochemical action [31]. A large number of studies have shown that in the low-temperature environment of the crust surface, the reduction reaction of oxy-type sulfide caused by microbial activity plays an important role in the fractionation of sulfur isotopes, but the physical fractionation of the sulfur isotope composition of sulfate in inorganic chemical reactions is not obvious [32]. The S isotopic composition of dissolved sulfate in natural water is basically the same as that of the original sulfate, which is crystallized by evaporation and concentration and dissolved into water via sulfate mineral dissolution. Compared with the δ34S value (9.9) of solid sulfate minerals in this area [33], the δ34S value (10.11) of subsurface brine is very similar (Figure 5), which reflects the long-term evolution of sulfur substances, mainly through dissolution and sedimentation, whereas the redox process under the influence of microorganisms is not obvious. In addition, because of the wide distribution for the evaporites of Mesozoic–Cenozoic in the Tarim Basin, the gypsum salt layers and glauberite-halite layer are widely found in the Kuqa Basin, south of the Tianshan Mountains in the upper reaches of the Tarim River basin, and the δ34S values range from 7.17‰ to 13.15‰, with an average of 10.19‰ [34]. It is concluded that the sulfates of the subsurface brine in the Kongquehe Sag area were may mainly derived from the weathering products of the Mesozoic–Cenozoic gypsum calcium glauber layer in the Tarim Basin.
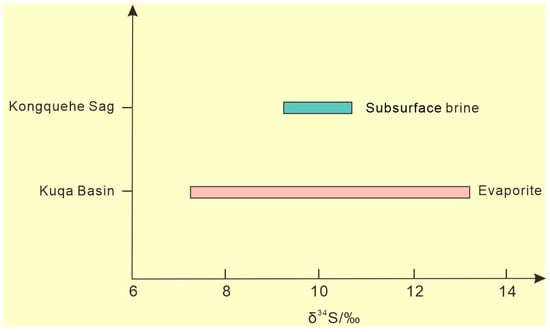
Figure 5.
The S isotope distribution in the study area.
The main sources of strontium in seawater are shell sources (mean value 0.7119) and mantle sources (mean value 0.7035), and the strontium isotope composition of seawater is a comprehensive reflection of the mixture of these two sources. Since the beginning of the Mesozoic era, the average value of 87Sr/86Sr in seawater has shown an overall increasing trend, reaching a maximum value of 0.7093 at present [35]. The 87Sr/86Sr of the brine (mean value 0.7107) in the study area is significantly lower than that of crustal source strontium of the continental surface weathering system (Figure 6), and the 87Sr/86Sr isotopic characteristics are close to but slightly higher than those of seawater. It has been reported that the Ordovician carbonate 87Sr/86Sr in the Tazhong area of the Tarim Basin ranges from 0.70644 to 0.70938 (similar to Ordovician seawater, 0.7078–0.7090). Silurian formation water 87Sr/86Sr is between 0.71057 and 0.71258. The 87Sr/86Sr of Carboniferous formation water is between 0.71100 and 0.71900 [36]. This ratio in the Paleogene marine rocks of the Kuqa Depression ranges from 0.708718 to 0.709326, and that of the Miocene Marine rocks with sea–land mixing ranges from 0.709909 to 0.710868 [37]. Comparison with 87Sr/86Sr of existing brines in the Tarim Basin reveals that the characteristics of subsurface brine 87Sr/86Sr in the study area are most similar to those of Miocene salt rocks, which indicates that Miocene salt may be the source salt of this set of brines.
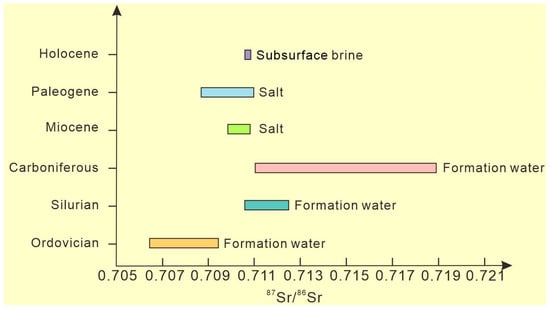
Figure 6.
The Sr isotope distribution in the study area.
4.3. Genetic Analysis of Brine
Generally, the coupling of “extreme components” of the three elements of provenance, structure, and climate is the key to the formation of brine [38]. Through the past combined with this study, the drainage system of the Kongquehe Sag area is well developed. Since the Middle Pleistocene, the Tarim River has been flowing through the area intermittently. All kinds of salt-bearing rocks in the South Tianshan Mountains have been weathered and denuded by nature for a long time, and most of the broken materials are transported and deposited in the Kongquehe Sag by the action of running water, providing this area with rich salt provenance for a long time [39].
In the late Pliocene, under the continuous subduction of the Indian plate to the north, the Cenozoic strata in the Tarim Basin began to shrink, resulting in the X-type conjugate faults in the NW-directed and NE-directed and forming migration channels or water-bearing spaces for groundwater in the Kongquehe Sag area [40,41]. Under the circumstances of high pressure and a closed reduction environment, groundwater continuously migrated and circulated in formation pores, fault fractures, and other parts, and a water–rock reaction occurred with the surrounding rock. It produces material exchange and enrichment to form high-salinity brine.
Since the Quaternary period, the long-term climate environment in this area was dominated by extreme drought (Figure 7), which promoted the rapid and intense evaporation of surface water. Surface evaporation causes a large amount of the original surface water to concentrate and crystallize into salt, laying the foundation for the enrichment of the brine [42,43].
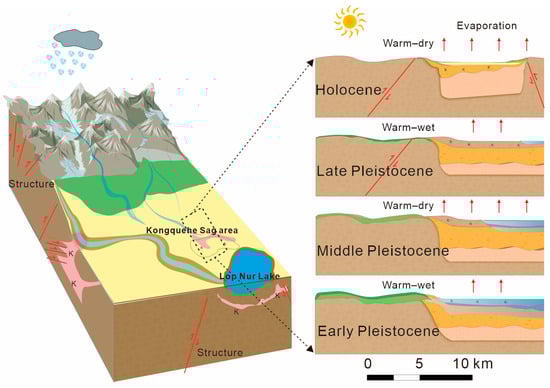
Figure 7.
The diagram of brine source and origin in the Kongquehe Sag area.
5. Conclusions
The subsurface brine of the Kongquehe Sag area mainly exists in the medium-fine-grained sand and coarse-grained sand layers of the Upper Pleistocene of the Quaternary system. The hydrochemical type is of the magnesium sulfate subtype, and the mineralization of the subsurface brines exhibits a moderate to low degree, with values ranging from 50.50 g/L to 91.14 g/L. The stable isotope compositions of unconfined and confined waters are different, with the mean values of δD being −8.00‰ and −51.75‰, and the mean value of δ18O being 10.08‰ and −6.01‰. These values are indicative of an intense evaporative environment prevalent in the Kongquehe Sag area. Furthermore, the 87Sr/86Sr ratios vary between 0.710642 and 0.710837, and δ34S values range from 9.2 to 10.7. These data suggest the long-term evolution of sulfur substances, predominantly through dissolution and sedimentation processes, with minimal influence from redox reactions. The obtained results will provide new data for the theory of the source and origin of subsurface brine and related exploration of potash salt in the Lop Nur region.
Author Contributions
Conceptualization, methodology, data analysis, data collection, and writing—original draft preparation, L.J. and F.H.; Conceptualization, Y.W.; software, S.G. and B.Z.; formal analysis, L.H. and Z.Y.; investigation, X.Z. All authors have read and agreed to the published version of the manuscript.
Funding
This paper was supported by the Major Science and Technology Projects of Xinjiang Uyghur Autonomous Region (2022A03009) and the Third Xinjiang Scientific Expedition Program (2022xjkk1303).
Data Availability Statement
Data are contained within the article.
Acknowledgments
The authors would like to express sincere thanks to the editors and reviewers for their contributions to the manuscript.
Conflicts of Interest
The authors declare no conflicts of interest.
References
- Munk, L.A.; Hynek, S.A.; Bradley, D.C.; Boutt, D.; Labay, K.; Jochens, H. Lithium brines: A global perspective. Rev. Econ. Geol. 2016, 18, 339–365. [Google Scholar]
- Ihsanullah, I.; Mustafa, J.; Zafar, A.M.; Obaid, M.; Atieh, M.A.; Ghaffour, N. Waste to wealth: A critical analysis of resource recovery from desalination brine. Desalination 2022, 543, 116093. [Google Scholar] [CrossRef]
- Samantray, J.; Anand, A.; Dash, B.; Ghosh, M.K.; Behera, A.K. Silicate minerals-Potential source of potash—A review. Miner. Eng. 2022, 179, 107463. [Google Scholar] [CrossRef]
- Liu, C.L.; Lowenstein, T.K.; Wang, A.; Zheng, C.; Yu, J. Brine: Genesis and Sustainable Resource Recovery Worldwide. Annu. Rev. Environ. Resour. 2023, 48, 371–394. [Google Scholar] [CrossRef]
- Khalil, A.; Mohammed, S.; Hashaikeh, R.; Hilal, N. Lithium recovery from brine: Recent developments and challenges. Desalination 2022, 528, 115611. [Google Scholar] [CrossRef]
- Mojid, M.R.; Lee, K.J.; You, J. A review on advances in direct lithium extraction from continental brines: Ion-sieve adsorption and electrochemical methods for varied Mg/Li ratios. Sustain. Mater. Technol. 2024, 40, e00923. [Google Scholar] [CrossRef]
- Mischke, S.; Liu, C.; Zhang, J.; Zhang, C.; Zhang, H.; Jiao, P.; Plessen, B. The world’s earliest Aral-Sea type disaster: The decline of the Loulan Kingdom in the Tarim Basin. Sci. Rep. 2017, 7, 43102. [Google Scholar] [CrossRef]
- Liu, C.L.; Jiao, P.C.; Lü, F.L.; Wang, Y.Z.; Sun, X.H.; Zhang, H.; Wang, L.C.; Yao, F.J. The impact of the linked factors of provenance, tectonics and climate on potash formation: An example from the potash Deposits of Lop Nur depression in Tarim Basin, Xinjiang, Western China. Acta Geol. Sin.-Engl. Ed. 2015, 89, 2030–2047. [Google Scholar]
- Warren, J.K.; Warren, J.K. Potash resources: Occurrences and controls. In Evaporites: A Geological Compendium; Springer: Berlin/Heidelberg, Germany, 2016; pp. 1081–1185. [Google Scholar]
- Álvarez-Amado, F.; Tardani, D.; Poblete-González, C.; Godfrey, L.; Matte-Estrada, D. Hydrogeochemical processes controlling the water composition in a hyperarid environment: New insights from Li, B, and Sr isotopes in the Salar de Atacama. Sci. Total Environ. 2022, 835, 155470. [Google Scholar] [CrossRef]
- Miao, W.; Zhang, X.; Li, Y.; Li, W.; Yuan, X.; Li, C. Lithium and strontium isotopic systematics in the Nalenggele River catchment of Qaidam basin, China: Quantifying contributions to lithium brines and deciphering lithium behavior in hydrological processes. J. Hydrol. 2022, 614, 128630. [Google Scholar] [CrossRef]
- Yu, X.; Yuan, X.; Guo, H.; Zhang, Y.; Cao, H.; Luo, T.; Gong, Z.; Huang, H. Coupling Hydrochemistry and Stable Isotopes (δ2H, δ18O and 87Sr/86Sr) to Identify the Major Factors Affecting the Hydrochemical Process of Groundwater and Surface Water in the Lower Reaches of the Yarlung-Zangbo River, Southern Tibet, Southwestern China. Water 2022, 14, 3906. [Google Scholar] [CrossRef]
- Zhao, Y.; Wang, N.; Shen, L.; Li, R.; Liu, C.; Jiao, P.; Hu, Y.; Zhao, X. Contribution of deep material sources to shallow potash formation of the Quaternary Mahai Salt Lake in the Qaidam Basin: Evidence from isotopes and trace elements. Ore Geol. Rev. 2024, 171, 106166. [Google Scholar] [CrossRef]
- Yang, F.; Fan, Q.; Han, G.; Wang, W.; Liu, J.; Bai, H. Origin and Evolution of Deep K-Rich Confined Brine in Mahai Basin, Qinghai–Tibet Plateau. Aquat. Geochem. 2024. [Google Scholar] [CrossRef]
- Yang, H.; Wei, J.; Shi, K. Hydrochemical and Isotopic Characteristics and the Spatiotemporal Differences of Surface Water and Groundwater in the Qaidam Basin, China. Water 2023, 16, 169. [Google Scholar] [CrossRef]
- Wang, S.; Zuo, Q.; Zhou, K.; Wang, J.; Wang, W. Predictions of Land Use/Land Cover Change and Landscape Pattern Analysis in the Lower Reaches of the Tarim River, China. Land 2023, 12, 1093. [Google Scholar] [CrossRef]
- Zhang, J.; Xing, F.; Krijgsman, W.; Zhang, C.; Wei, W.; Chen, L.; Yang, S.; Liu, X.; Lu, Y. Palaeogeographic reconstructions of the Eocene-Oligocene Tarim Basin (NW China): Sedimentary response to late Eocene sea retreat. Palaeogeogr. Palaeoclimatol. Palaeoecol. 2022, 587, 110796. [Google Scholar] [CrossRef]
- Shvarts, A.A.; Kaplan, E.M.; Rumynin, V.G.; Borovitskaya, E.Y.; Erzova, V.A. Natural radioactivity of groundwater in Vendian deposits in St. Petersburg Region. J. Environ. Radioact. 2023, 264, 107189. [Google Scholar] [CrossRef]
- Mirzavand, M.; Walter, J. Delineating the mechanisms controlling groundwater salinization using chemo-isotopic data and meta-heuristic clustering algorithms (case study: Saguenay-Lac-Saint-Jean region in the Canadian Shield, Quebec, Canada). Environ. Sci. Pollut. Res. 2024, 31, 42406–42427. [Google Scholar] [CrossRef]
- Jiang, L.; Duan, X.; Yang, Z.; He, L.; Dong, Y.; Wang, Y. Fluid inclusion and stable isotope (H–O–S–Pb) constraints on the genesis of the Haxi gold deposit, west Junggar, China. J. Asian Earth Sci. X 2023, 9, 100131. [Google Scholar] [CrossRef]
- Wang, H.; Zhang, Q. Research advances in identifying sulfate contamination sources of water environment by using stable isotopes. Int. J. Environ. Res. Public Health 2019, 16, 1914. [Google Scholar] [CrossRef]
- Christensen, J.N.; Dafflon, B.; Shiel, A.E.; Tokunaga, T.K.; Wan, J.; Faybishenko, B.; Dong, W.; Williams, K.H.; Hobson, C.; Brown, S.T.; et al. Using strontium isotopes to evaluate the spatial variation of groundwater recharge. Sci. Total Environ. 2018, 637, 672–685. [Google Scholar] [CrossRef] [PubMed]
- Boussaada, N.; Bouselsal, B.; Benhamida, S.A.; Hammad, N.; Kharroubi, M. Geochemistry and water quality assessment of continental intercalary aquifer in Ouargla region (Sahara, Algeria). J. Ecol. Eng. 2023, 24, 279–294. [Google Scholar] [CrossRef] [PubMed]
- Heidari, A.; Samiei-Fard, R. Geochemical characteristics of saline soils formed during the recent retreat of the Caspian Sea. Catena 2024, 243, 108208. [Google Scholar] [CrossRef]
- Adams, J.J.; Bachu, S. Equations of state for basin geofluids: Algorithm review and intercomparison for brines. Geofluids 2002, 2, 257–271. [Google Scholar] [CrossRef]
- Bazamad, M.; Tangestani, M.H.; Asadi, S.; Staubwasser, M. Investigating the geochemical behavior and exploration potential of lithium in brines; a case study of Bam salt plug, Zagros Zone, southern Iran. Sci. Rep. 2023, 13, 21567. [Google Scholar] [CrossRef]
- Kong, Y.; Wang, K.; Pan, S.; Ren, Y.; Zhang, W. Effect of Moisture Sources on the Isotopic Composition of Precipitation in Northwest China. Water 2023, 15, 1584. [Google Scholar] [CrossRef]
- Zhang, H.; Yu, J.; Wang, P.; Wang, T.; Li, Y. Groundwater-fed oasis in arid Northwest China: Insights into hydrological and hydrochemical processes. J. Hydrol. 2021, 597, 126154. [Google Scholar] [CrossRef]
- Li, Q.; Fan, Q.; Wei, H.; Qin, Z.; Zhang, X.; Du, Y.; Shan, F. Sulfur isotope constraints on the formation of MgSO4-deficient evaporites in the Qarhan salt Lake, western China. J. Asian Earth Sci. 2020, 189, 104160. [Google Scholar] [CrossRef]
- Makhnach, A.; Mikhajlov, N.; Kolosov, I.; Gulis, L.; Shimanovich, V.; Demeneva, O. Comparative analysis of sulfur isotope behavior in the basins with evaporites of chloride and sulfate types. Sediment. Geol. 2020, 134, 343–360. [Google Scholar] [CrossRef]
- Tan, H.; Ma, H.; Wei, H.; Xu, J.; Li, T. Chlorine, sulfur and oxygen isotopic constraints on ancient evaporite deposit in the Western Tarim Basin, China. Geochem. J. 2006, 40, 569–577. [Google Scholar] [CrossRef]
- Liu, C.L.; Wang, L.; Yan, M.; Zhao, Y.; Cao, Y.; Fang, X.; Shen, L.; Wu, C.; Lü, F.; Ding, T. The Mesozoic-Cenozoic tectonic settings, paleogeography and evaporitic sedimentation of Tethyan blocks within China: Implications for potash formation. Ore Geol. Rev. 2018, 102, 406–425. [Google Scholar] [CrossRef]
- Veizer, J.; Demovic, R. Strontium as a tool in facies analysis. J. Sediment. Res. 1974, 44, 93–115. [Google Scholar]
- Liu, C.; Wang, M.; Jiao, P.; Li, S.; Chen, Y. Features and formation mechanism of faults and potash-forming effect in the Lop Nur Salt Lake, Xinjiang, China. Acta Geol. Sin. (Engl. Ed.) 2006, 80, 936–943. [Google Scholar]
- Xu, Y.; Cao, Y.; Liu, C.; Zhang, H.; Nie, X. The history of transgressions during the Late Paleocene-Early Eocene in the Kuqa Depression, Tarim Basin: Constraints from COS-Sr isotopic geochemistry. Minerals 2020, 10, 834. [Google Scholar] [CrossRef]
- Liu, C.L.; Zhang, J.F.; Jiao, P.; Mischke, S. The Holocene history of Lop Nur and its palaeoclimate implications. Quat. Sci. Rev. 2016, 148, 163–175. [Google Scholar] [CrossRef]
- Jiang, L.; Cai, C.; Worden, R.H.; Crowley, S.F.; Jia, L.; Zhang, K.; Duncan, I.J. Multiphase dolomitization of deeply buried Cambrian petroleum reservoirs, Tarim Basin, north-west China. Sedimentology 2016, 63, 2130–2157. [Google Scholar] [CrossRef]
- Setiati, R.; Akbar, F.; Prasucipto Karisma, G.; Ramadhani, A.; Setiawan, S.; Aditya, R.; Taufiq Fathaddin, M.; Giat Sukaryo, S.; Bharoto, B.; Sumirat, I. Application of Neutron Computed Tomography in Enhanced Oil Recovery for Analysing Oil Distribution in Berea Sandstone using Bagasse Surfactant. Rud.-Geološko-Naft. Zb. 2023, 38, 87–95. [Google Scholar] [CrossRef]
- Irfan, M.; Hamza, S.; Waqar Azeem, M.; Mahmud, S.; Nawaz-ul-Huda, S.; Qadir, A. Groundwater Exploration and Salinity Intrusion Studies using Electrical Resistivity Survey (ERS)-Winder, Balochistan, Pakistan. Rud.-Geološko-Naft. Zb. 2022, 37, 31–44. [Google Scholar] [CrossRef]
- Shang, K.; Tian, J.; Lv, H.; Zhang, X.; Li, J.; Zhang, Y. Geochemical Characteristics and the Sedimentary Environment of Lower Cambrian Argillaceous Rocks on the Kongquehe Slope, Tarim Basin, China. Energies 2022, 15, 5400. [Google Scholar] [CrossRef]
- Li, L.; Ni, W.; Cheng, Y.; Wang, H.; Yuan, K.; Zhou, B. Evaluation of the eco-geo-environment in the Qaidam Basin, China. Environ. Earth Sci. 2021, 80, 27. [Google Scholar] [CrossRef]
- Zachara, J.M.; Moran, J.J.; Resch, C.T.; Lindemann, S.R.; Felmy, A.R.; Bowden, M.E.; Cory, A.B.; Fredrickson, J.K. Geo-and biogeochemical processes in a heliothermal hypersaline lake. Geochim. Cosmochim. Acta 2016, 181, 144–163. [Google Scholar] [CrossRef]
- Zheng, M.P.; Hou, X.H.; Zhang, Y.S.; Xing, E.Y.; Li, H.P.; Yin, H.W.; Yu, C.Q.; Wang, N.J.; Deng, X.L.; Wei, Z.; et al. Progress in the investigation of potash resources in western China. China Geol. 2018, 1, 392–401. [Google Scholar] [CrossRef]


Disclaimer/Publisher’s Note: The statements, opinions and data contained in all publications are solely those of the individual author(s) and contributor(s) and not of MDPI and/or the editor(s). MDPI and/or the editor(s) disclaim responsibility for any injury to people or property resulting from any ideas, methods, instructions or products referred to in the content. |
© 2024 by the authors. Licensee MDPI, Basel, Switzerland. This article is an open access article distributed under the terms and conditions of the Creative Commons Attribution (CC BY) license (https://creativecommons.org/licenses/by/4.0/).