Article

Coupled DSSAT and HYDRUS-1D Simulation of the Farmland–Crop Water Cycling Process in the Dengkouyangshui Irrigation District

1
College of Water Conservancy and Civil Engineering, Inner Mongolia Agricultural University, Hohhot 010018, China
2
Yinshanbeilu Grassland Eco-Hydrology National Observation and Research Station, China Institute of Water Resources and Hydropower Research, Beijing 100038, China
3
Institute of Water Resources for Pastoral Area Ministry of Water Resources, Hohhot 010020, China
4
Inner Mongolia Autonomous Region Yellow River Dengkou Irrigation District Management Center, Baotou 014000, China
*
Author to whom correspondence should be addressed.
Water 2024, 16(7), 1049; https://doi.org/10.3390/w16071049
Submission received: 9 February 2024 / Revised: 24 March 2024 / Accepted: 3 April 2024 / Published: 5 April 2024

Abstract

:
(1) Background: Effective water management in agricultural systems poses a significant challenge, particularly in the Dengkouyangshui irrigation district. Inefficiencies and insufficient detail in water usage across crop growth stages have resulted in suboptimal water cycling. Recent infrastructure improvements and technological interventions necessitate a reevaluation of water usage, especially concerning changes in irrigation and seepage dynamics. (2) Methods: This study addresses these concerns by employing an integrated modeling approach that combines the DSSAT with the HYDRUS-1D soil hydrology model to simulate complex interactions among soil, crop growth, and irrigation practices within the district. Observational data were used to calibrate and validate the integrated model, including soil moisture, LAI, and crop yields from the 2022 and 2023 agricultural seasons. (3) Results: The simulation results strongly align with the empirical data, highlighting the ability of the model to capture the intricate dynamics of soil–water–atmosphere–plant interactions. (4) Conclusions: The soil’s retention and moisture-holding characteristics exhibited resilience during periods without water supplementation, with measurable declines in soil moisture at various depths, indicating the soil’s capacity to support crops in water-limited conditions. This study delineates water consumption by maize crops throughout their growth cycle, providing insights into evapotranspiration partitioning and quantifying seepage losses. An in-depth analysis of water balances at different growth stages informs irrigation strategies, suggesting optimal volumes to enhance efficiency during critical crop development phases. This integrative modeling approach is valuable for providing actionable data to optimize the water cycling process and improve agricultural sustainability in the Dengkouyangshui irrigation district.

1. Introduction

In China, irrigation districts, especially large-scale districts, play a crucial role in grain and quality agricultural product production. They serve as the cornerstone and essential safeguard for food production security [1]. The Dengkouyangshui irrigation district in the Inner Mongolia Autonomous Region is among the significant Yellow River irrigation projects registered with the Ministry of Water Resources. Nevertheless, a lack of understanding of the water cycling mechanism in various sub-irrigation areas has led to suboptimal irrigation water use efficiency. Therefore, investigating water cycling processes within the Dengkouyangshui irrigation district is highly important for enhancing irrigation water use efficiency and boosting crop yields. The water cycle serves as the crucial link connecting various terrestrial systems, such as the hydrosphere, atmosphere, lithosphere, and biosphere [2] Hydrological models [3,4,5,6] have proven to be effective tools for exploring the complex mechanisms of water cycling in irrigation districts and are indispensable in research related to water resource management and the impact of human productive activities on the water cycle [7]. Numerous scholars have carried out both experimental and numerical simulation studies on the water cycle in irrigation areas [8,9,10]; however, these investigations tend to be expensive and time-consuming, and the outcomes are often specific to each study. The advent of the hydraulic model HEC-RAS [11] and agricultural hydrological models such as HYDRUS [12], SWAT [13], and SWAP [14] has provided deeper insights into the dynamics of soil moisture and the behavior of water cycles within irrigation districts [15]. For instance, Wang Guoshuai et al. used the HYDRUS-1D model to examine the temporal dynamics of salinity in dunes, examine the interface between dunes and wasteland, and in wasteland, identify the movement patterns of water and salt in desert oases [16]. Yu et al. applied the Hydrus-1D model in Beijing to investigate the boundary flux characteristics of their simulation results, illustrating that evapotranspiration is the predominant mechanism for soil water reduction in the maize root zone [17]. Barman et al. assessed the efficiency of the SWAT model in the Periyar River basin in India and discovered that the model performed well in the watershed, with a water balance study revealing that surface runoff was the major contributor to the total effective water amount at 41%, followed by actual evapotranspiration at 28% [18]. Through comprehensive studies, hydrological models have proven to be effective in simulating the entire water cycling process. However, in these models, vegetation parameters such as the leaf area index (LAI) and root depth, which are vital for plant characteristics, are often simplified or considered constant. Ongoing dynamic changes in vegetation parameters are frequently overlooked [19].
Consequently, researchers have developed coupled models of crop growth and water cycling to represent the water cycling processes in irrigation districts more accurately. For example, Hao Yuanyuan et al. created a distributed model at the irrigation district scale using the one-dimensional agricultural hydrological model HYDRUS-EPIC to study the current conditions of soil water and salinity, as well as crop growth under existing irrigation practices, and to identify challenges within the study area [20]. The findings showed that high soil salinity levels were a major constraint on crop yield in the district. Wang Pu et al. [20] established a distributed water transformation model at the irrigation district scale that integrated irrigation and drainage, farmland soil moisture movement, crop growth, and groundwater flow, enabling quantitative analysis of the supply, consumption, and discharge dynamics within the irrigation area [21]. Wang et al. used a coupled HYDRUS-1D and EPIC model to simulate the soil water–salt dynamics and crop growth of winter wheat at the Fengqiu National Key Agricultural Ecology Experimental Station in the North China Plain [22]. They observed decreased evapotranspiration under saline stress, primarily due to lower crop transpiration. Although saline–alkali stress reduced grain yield, the trend in water use efficiency varied with precipitation level. Challenges such as high evaporation rates and low irrigation efficiency remain in large-scale Yellow River lift irrigation districts, and the water transformation processes during the main crops’ various growth stages are poorly understood.
In summary, the water cycle in irrigation districts plays a vital role in developing and allocating agricultural water resources. Distributed hydrological models combined with crop models can effectively describe soil moisture movement within irrigation districts. Following the continuation of construction support and modernization reforms in the Dengkouyangshui irrigation district in 2022, the current irrigation and seepage volumes remain unclear. There is a lack of studies on maize growth under water-saving irrigation and soil moisture dynamics in the Dengkouyangshui irrigation district of the Inner Mongolia Autonomous Region. Therefore, the objective of this research is to develop a coupled model that integrates the one-dimensional agricultural hydrological model HYDRUS-1D with the crop model DSSAT for the controlled area of the Yuejin Canal and the Gidan Gate within the Dengkouyangshui irrigation district in Inner Mongolia. Comprehensive regional soil moisture content and crop growth observations will be conducted for model calibration and validation. This study aimed to elucidate the water cycling processes at the agricultural field scale within irrigation districts to precisely describe the water usage processes during each growth stage of the main crops and to evaluate the water balance. This research intends to provide a reference for enhancing the efficiency of irrigation water use on farmlands and for the judicious distribution of agricultural water resources in the Dengkouyangshui irrigation district.

2. Materials and Methods

2.1. Study Area Overview

The Dengkouyangshui irrigation district is situated on the Tumochuan Plain on the northern bank of the Yellow River at the southern base of the Daqing Mountains. It extends across the Donghe District of Baotou City, Tumote Right Banner, Tumote Left Banner, and Tuoketuo County of Hohhot, spanning coordinates from 40°24′00″ N to 40°34′15″ N and from 110°08′55″ E to 111°48′00″ E. The total area within the district’s irrigation range is approximately 85.10 million mu (Figure 1). The specific study area includes the controlled region of Yuejin Canal No. 5 and Gidan Gate, which are located at a longitude of 110°32′ E and a latitude of 40°26′ N. The terrain features a gentle slope, with a gradient between 0.1% and 1%. Characterized by a continental monsoon climate, the area receives average annual precipitation ranging from 347 mm to 392 mm, experiences an average annual evaporation rate of 2000 mm, and maintains an average annual temperature between 6.5 °C and 7.3 °C. The frost-free period in the study area lasts approximately 134 days, typically supporting only one cropping season annually. The primary crops grown are maize and sunflower. Irrigation primarily relies on water from the Yellow River, with a single irrigation event occurring in mid-July during crop growth. The annual average volume of Yellow River water diverted for irrigation in the Dengkouyangshui district is approximately 242 million m3. Agricultural water use efficiency for irrigation is low, with effective utilization coefficients of 0.5032 and 0.5067 for 2022 and 2023, respectively.

2.2. Experimental Design and Data Collection

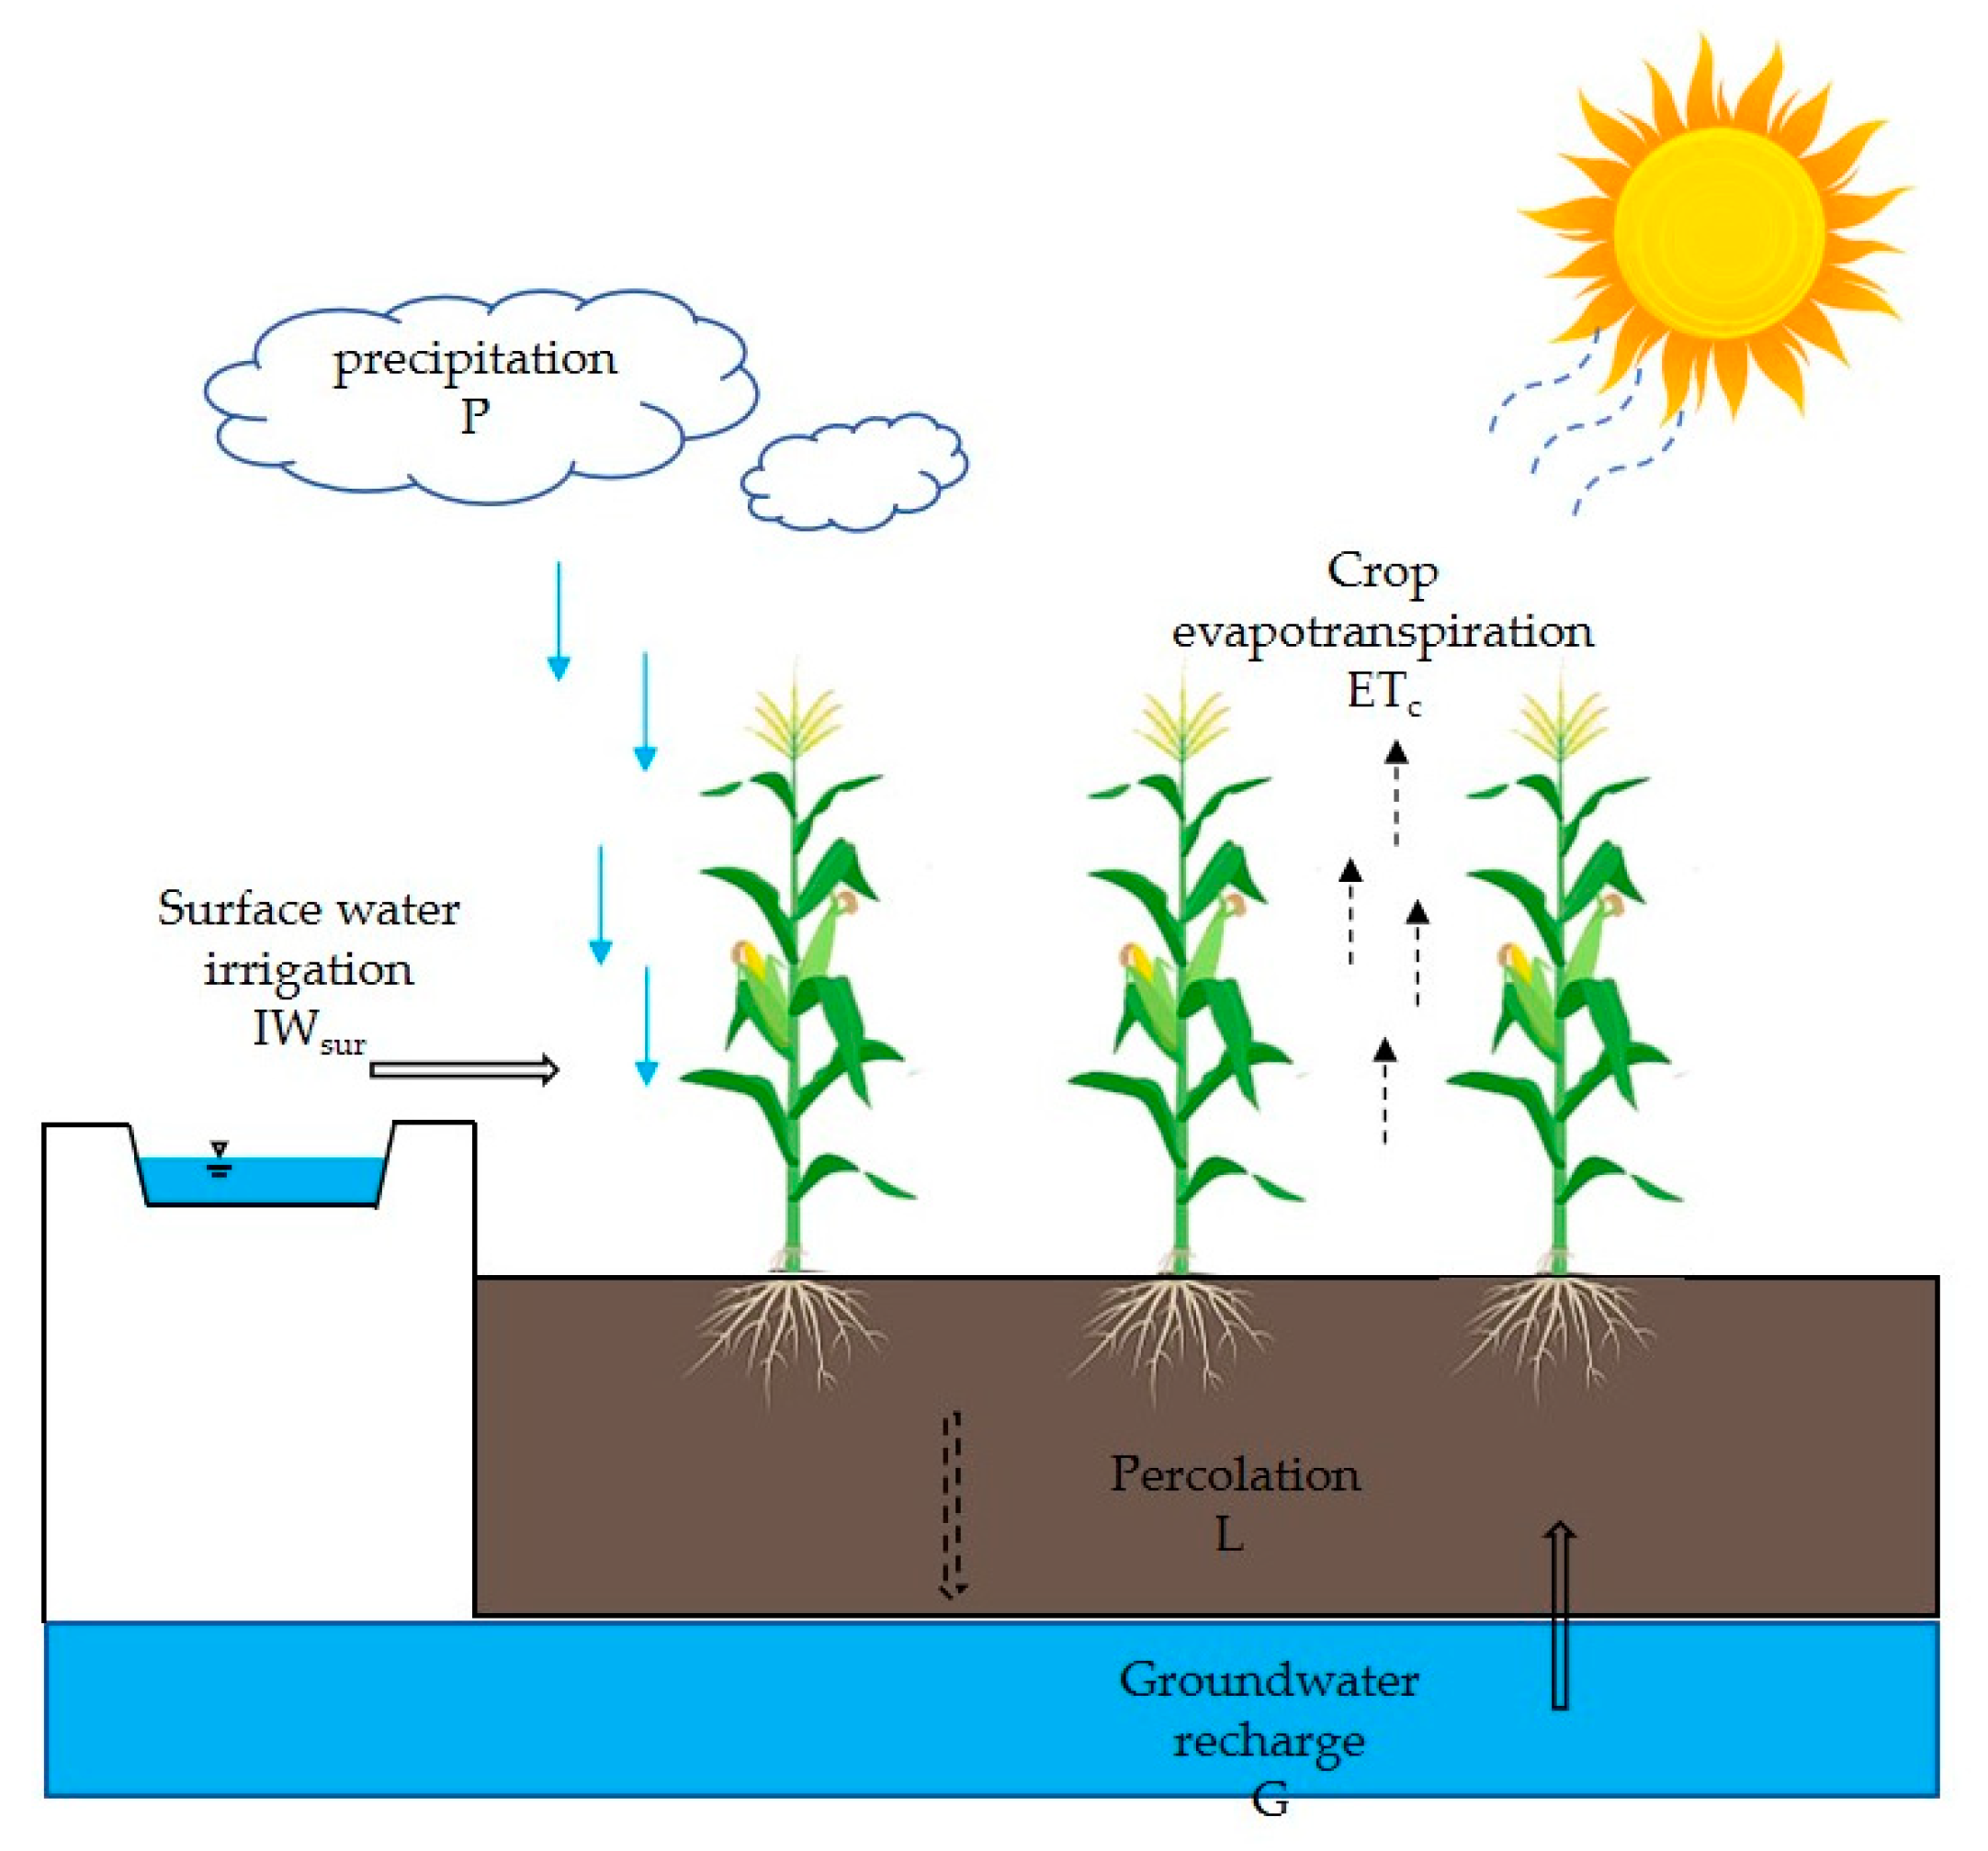
The controlled areas of the No. 5 Yuejin Canal and Gidan Gate are located in the branch canal of the Dengkouyangshui irrigation district, upstream from the Yuejin Canal and near the Yellow River, under the management of Yellow River irrigation. From May to September 2022 and 2023, field experiments were performed in this region within the Inner Mongolia Dengkouyangshui irrigation district, including an agricultural land area of 56,000 mu. Considering the types of crops, irrigation practices, soil, and groundwater conditions in the study area, 12 stationary monitoring sites were set up following an ArcGIS grid pattern (Figure 1). Various indicators, including soil moisture, the height of crop plants, and the LAI, were monitored on a monthly basis. Irrigation was applied once each year in mid-July, based on the regional conditions, with irrigation amounts recorded at 120 mm in 2022 and 124 mm in 2023, alongside yield assessments at the time of harvest. The soil moisture content was ascertained using the oven-drying technique, the height of the crop plants was measured with a tape measure, and the leaf area of the crops was evaluated. Before the commencement of the study, the soil texture at each monitoring site was assessed using the soil bulk density approach (Table 1), with sampling depths aligned with those used for measuring soil moisture. A well within the experimental field was designated for the continuous observation of groundwater levels (monitored once every 30 days, Figure 2); this information was obtained from the local irrigation district management office. Daily weather data, such as precipitation, solar radiation, temperature, wind velocity, and humidity, were acquired from the National Meteorological Information Center.

2.2.1. Soil Physical Properties of the Study Area

Soil samples were obtained from the experimental site at six distinct depths: 0–10 cm, >10–20 cm, >20–40 cm, >40–60 cm, >60–80 cm, and >80–100 cm, with each layer being sampled three times, with each sampling interval being 10 cm. The field capacity and soil bulk density were ascertained using the ring knife method. The soil particle size distribution was assessed by employing a dry sieve particle size analyzer. The contents of sand, silt, and clay particles in the various soil layers at each point are shown in Table 1. Based on the sand, silt, clay contents, and soil bulk density, the van Genuchten (VG) soil parameters were predicted using the Rosetta conversion function, and the results are presented in Table 1.

2.2.2. Meteorological Data Collection

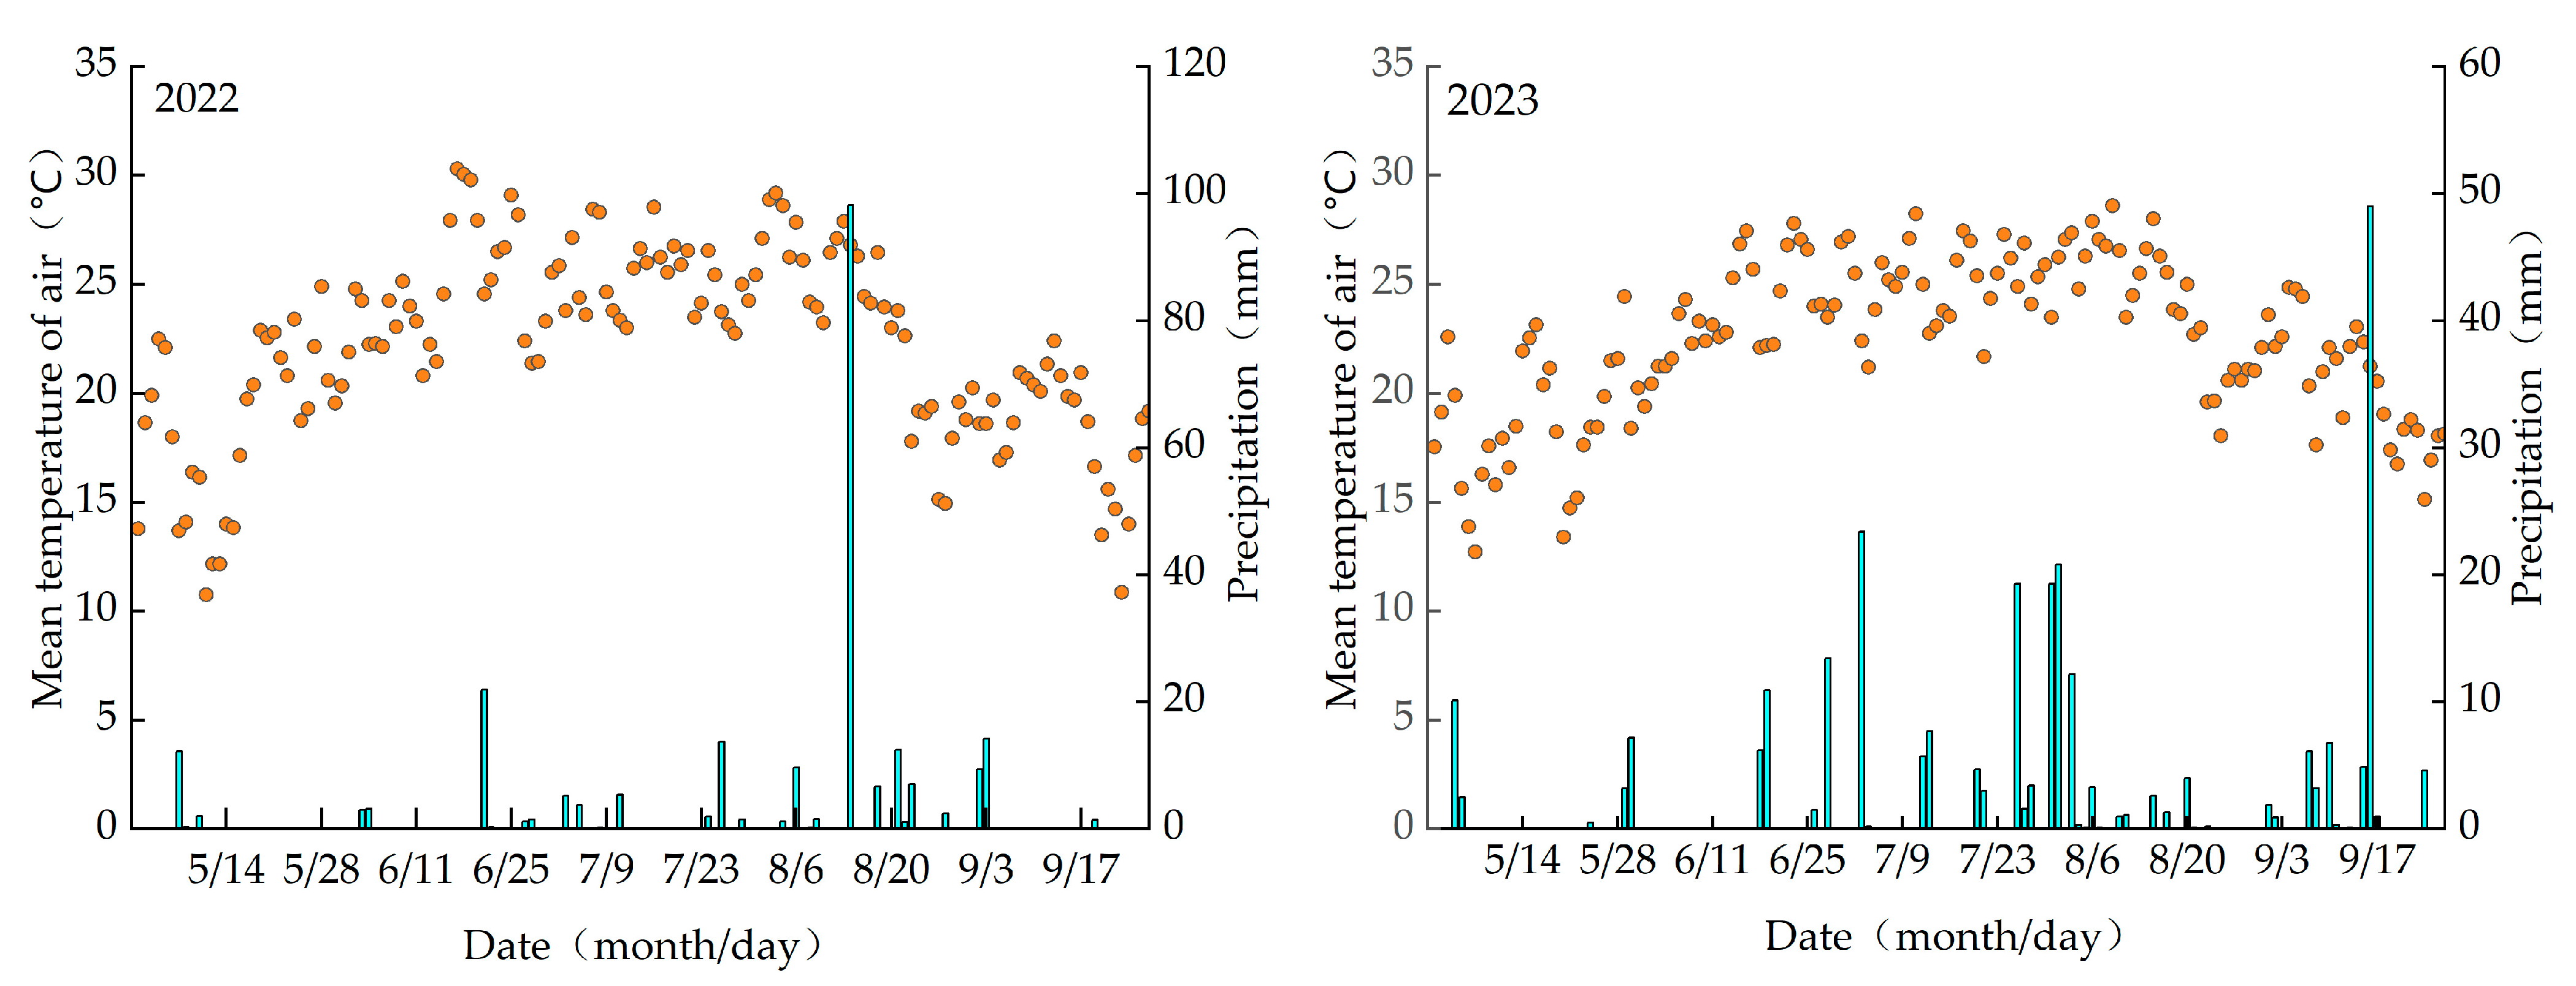
The temperature and precipitation data for the years 2022 and 2023, covering the growing season, are presented in Figure 3. The total precipitation for 2022 and 2023 was 280.5 mm and 242.2 mm, respectively, as of 4 December, 2023, with temperature ranges extending from −18.3 °C to 38.3 °C in 2022 and from −25 °C to 35.3 °C in 2023. The average temperatures varied between 10.31 °C and 12.06 °C, resulting in an overall average of 11.18 °C. During the growing season, which spans from May 1st to September 30th of both years, precipitation amounts were 243.9 mm in 2022 and 199.5 mm in 2023, constituting 86.95% and 82.37% of the yearly totals, respectively. The average temperatures recorded during the growing season were 22.14 °C for 2022 and 22.31 °C for 2023. The highest daily average temperature was 30.3 °C, observed in June, whereas the lowest daily average temperature was −18.95 °C, noted in January.

2.2.3. Crop Growing Season

Maize planting typically took place around May 1st, with the harvest occurring around 29 September, resulting in a growing period of approximately 152 days. The rapid growth phase for maize occurred during June and July, lasting the longest, at approximately 65 Table 2.

2.2.4. Groundwater Depth

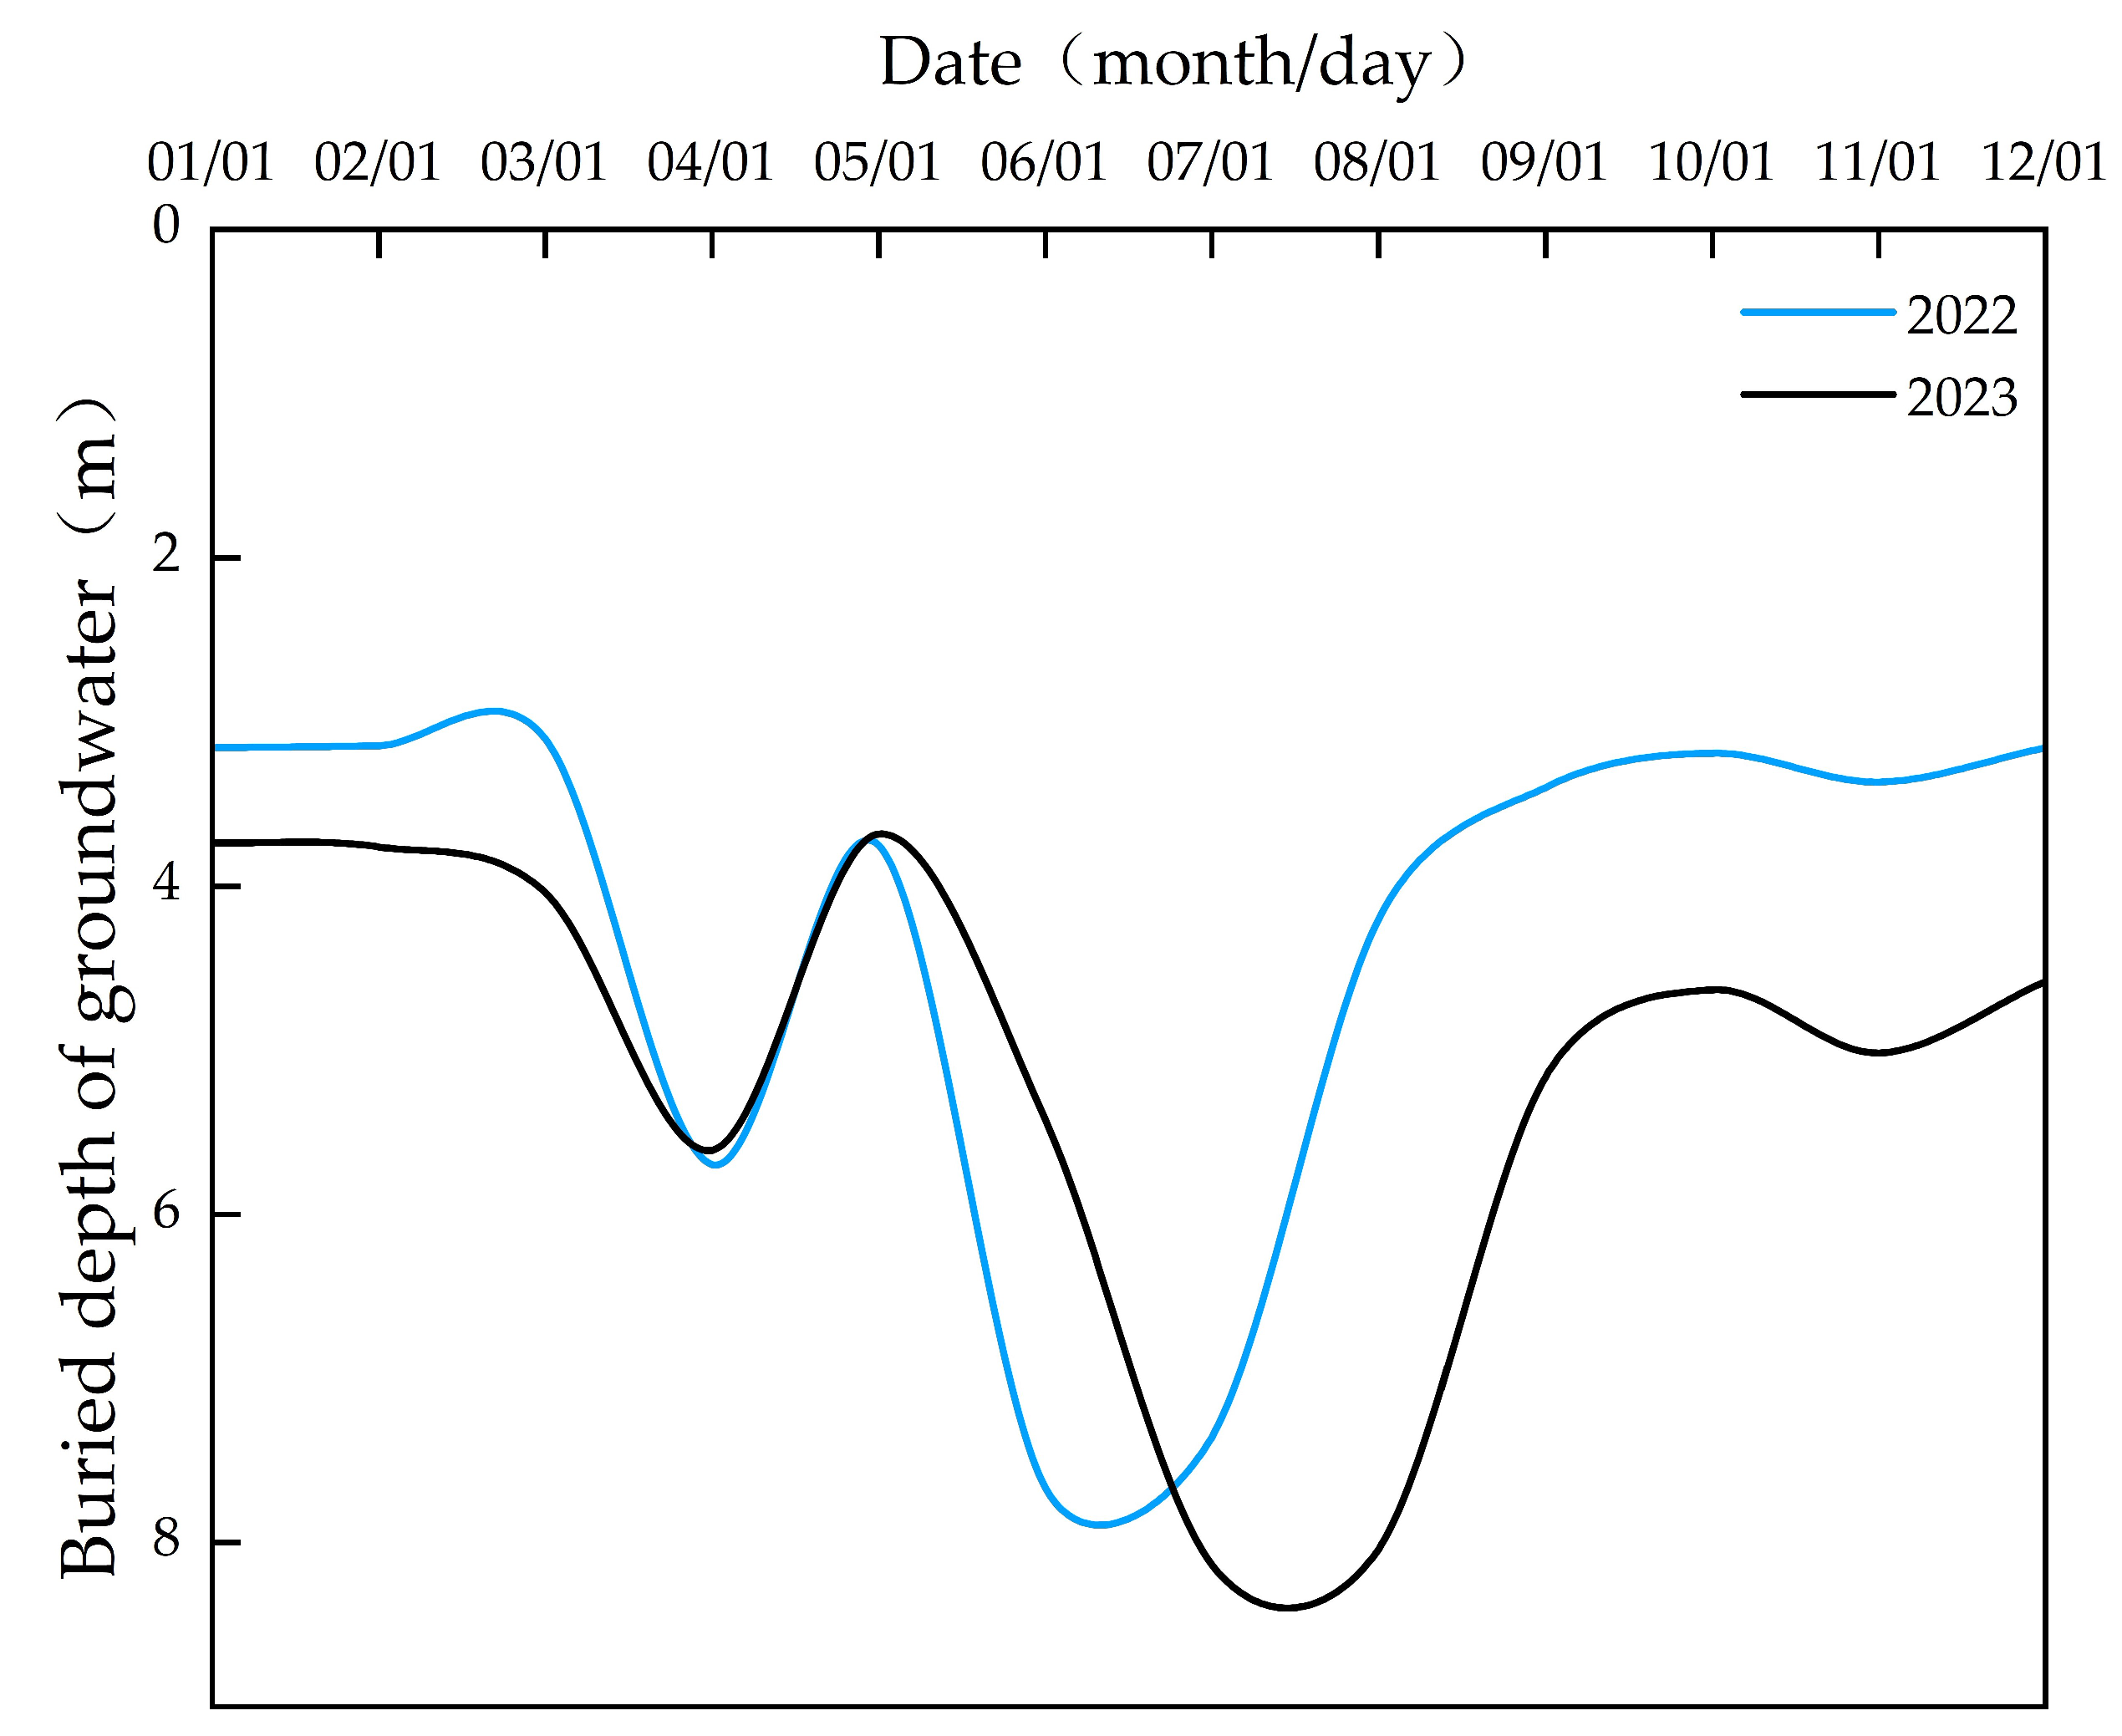
In the No. 5 Yuejin Canal and Gidan Gate areas of the Dengkouyangshui irrigation district, the groundwater is predominantly deep, with an annual average depth ranging from 3.10 to 7.67 m. The shallowest groundwater depth was observed in June, measuring between 7.36 and 7.67 m, whereas the deepest groundwater depth was recorded in March at 3.10 to 3.15 m. Figure 4 displays the annual average groundwater depth for the years 2022 and 2023 in the specified area of the Dengkouyangshui irrigation district. The figure shows a gradual increase in groundwater depth over recent years, attributable to the adoption of water conservation practices. Given that the groundwater depth exceeds 3 m, its influence on this study is considered minimal.

2.3. DSSAT-HYDRUS-1D Coupled Model

2.3.1. DSSAT Model

Crop growth models are capable of quantitatively expressing crop growth processes, yields, and the influence of environmental factors [23]. The Decision Support System for Agrotechnology Transfer (DSSAT) is one of the most widely applied crop growth models worldwide and is characterized by multifunctionality, spatialization, digitalization, and visualization. It allows more accurate predictions of growth patterns, growth potential, and climate effects than other methods [24].
(1) The DSSAT model’s formula for dry matter accumulation [25] is as follows:
Δ T O T = 0.758 × P A R C E × 10 6 × I P A R 0.004 × T O T × S W D F ,
where Δ TOT represents the daily increase in crop dry matter (t/ha); PARCE denotes the efficiency of converting photosynthetically active radiation (g/MJ); IPAR is the intercepted photosynthetically active radiation (MJ/ha); TOT is the total dry matter (t/ha); and SWDF represents the water stress factor impacting dry matter accumulation.
Within the DSSAT model, the formula for calculating the PARCE is as follows:
P A R C E = P A R C E m a x × 1 e x p 0.008 × T 8 ,
where PARCEmax denotes the maximum efficiency of photosynthetically active radiation conversion (g/MJ) and T denotes the daily average temperature (°C).
(2) The basic principle of the DSSAT model for calculating water stress is to compare the relationship between potential transpiration and potential root water uptake. When moisture is abundant, the potential for root water uptake surpasses the potential for transpiration. Nonetheless, as water is depleted from the soil through root water uptake and soil evaporation, the potential for root water uptake diminishes gradually until it arrives at a specific threshold. At this juncture, the first water stress factor, SWDF1, becomes apparent. This stress factor primarily affects crop extensional growth, such as dry matter accumulation and leaf expansion. When potential transpiration equals or surpasses potential root water uptake, a second stress factor, SWDF2, appears to mainly affect crop growth and biomass formation processes. The water stress calculation formula [25] is as follows:
S W D F 1 = W S p R W U E P × T p ,
S W D F 2 = W S p T p ,
where SWDF1 denotes the first water stress factor within the crop model; WSp represents the potential root water uptake (mm); RWUEP refers to a parameter specific to the species; Tp indicates the potential transpiration (mm); and SWDF2 is identified as the second water stress factor in the crop model.

2.3.2. HYDRUS-1D Model

The HYDRUS-1D model, developed by the U.S. Salinity Laboratory, simulates the one-dimensional vertical movement of water, heat, and solutes in saturated-unsaturated porous media, including root water uptake [26]. After years of development, HYDRUS-1D has seen widespread use and can effectively model variations in soil moisture, temperature, and solute concentrations due to agricultural irrigation and fertilization. The vertical transport of soil moisture in both saturated and unsaturated media is governed by the modified Richards equation and the van Genuchten model [27], as detailed in Equations (5)–(8):
θ t = z [ K h ( h z + 1 ) ] S z , t ,
K h = K s S e l [ 1 ( 1 S e 1 m ) m ] 2 ,
S e = θ h θ r θ s θ r ,
θ h = θ r + θ s θ r ( 1 + α h n ) m h < 0 θ r h > 0 ,
where θ represents the volumetric water content (cm3/cm3); K(h) denotes the hydraulic conductivity of unsaturated soil (cm·d−1); S(z, t) is the rate of root water uptake (cm3·cm−3·d1); (t) signifies the time (days); (z) indicates the soil depth (cm); (h) is the pressure head (cm); Ks is the saturated soil hydraulic conductivity (cm·d−1); Se is the effective saturation; (l) represents the pore connectivity factor; α, m, and n are empirical parameters of the model; and θr and θs are the residual and saturated water contents of the soil, respectively.

2.3.3. DSSAT-HYDRUS-1D Coupled Model

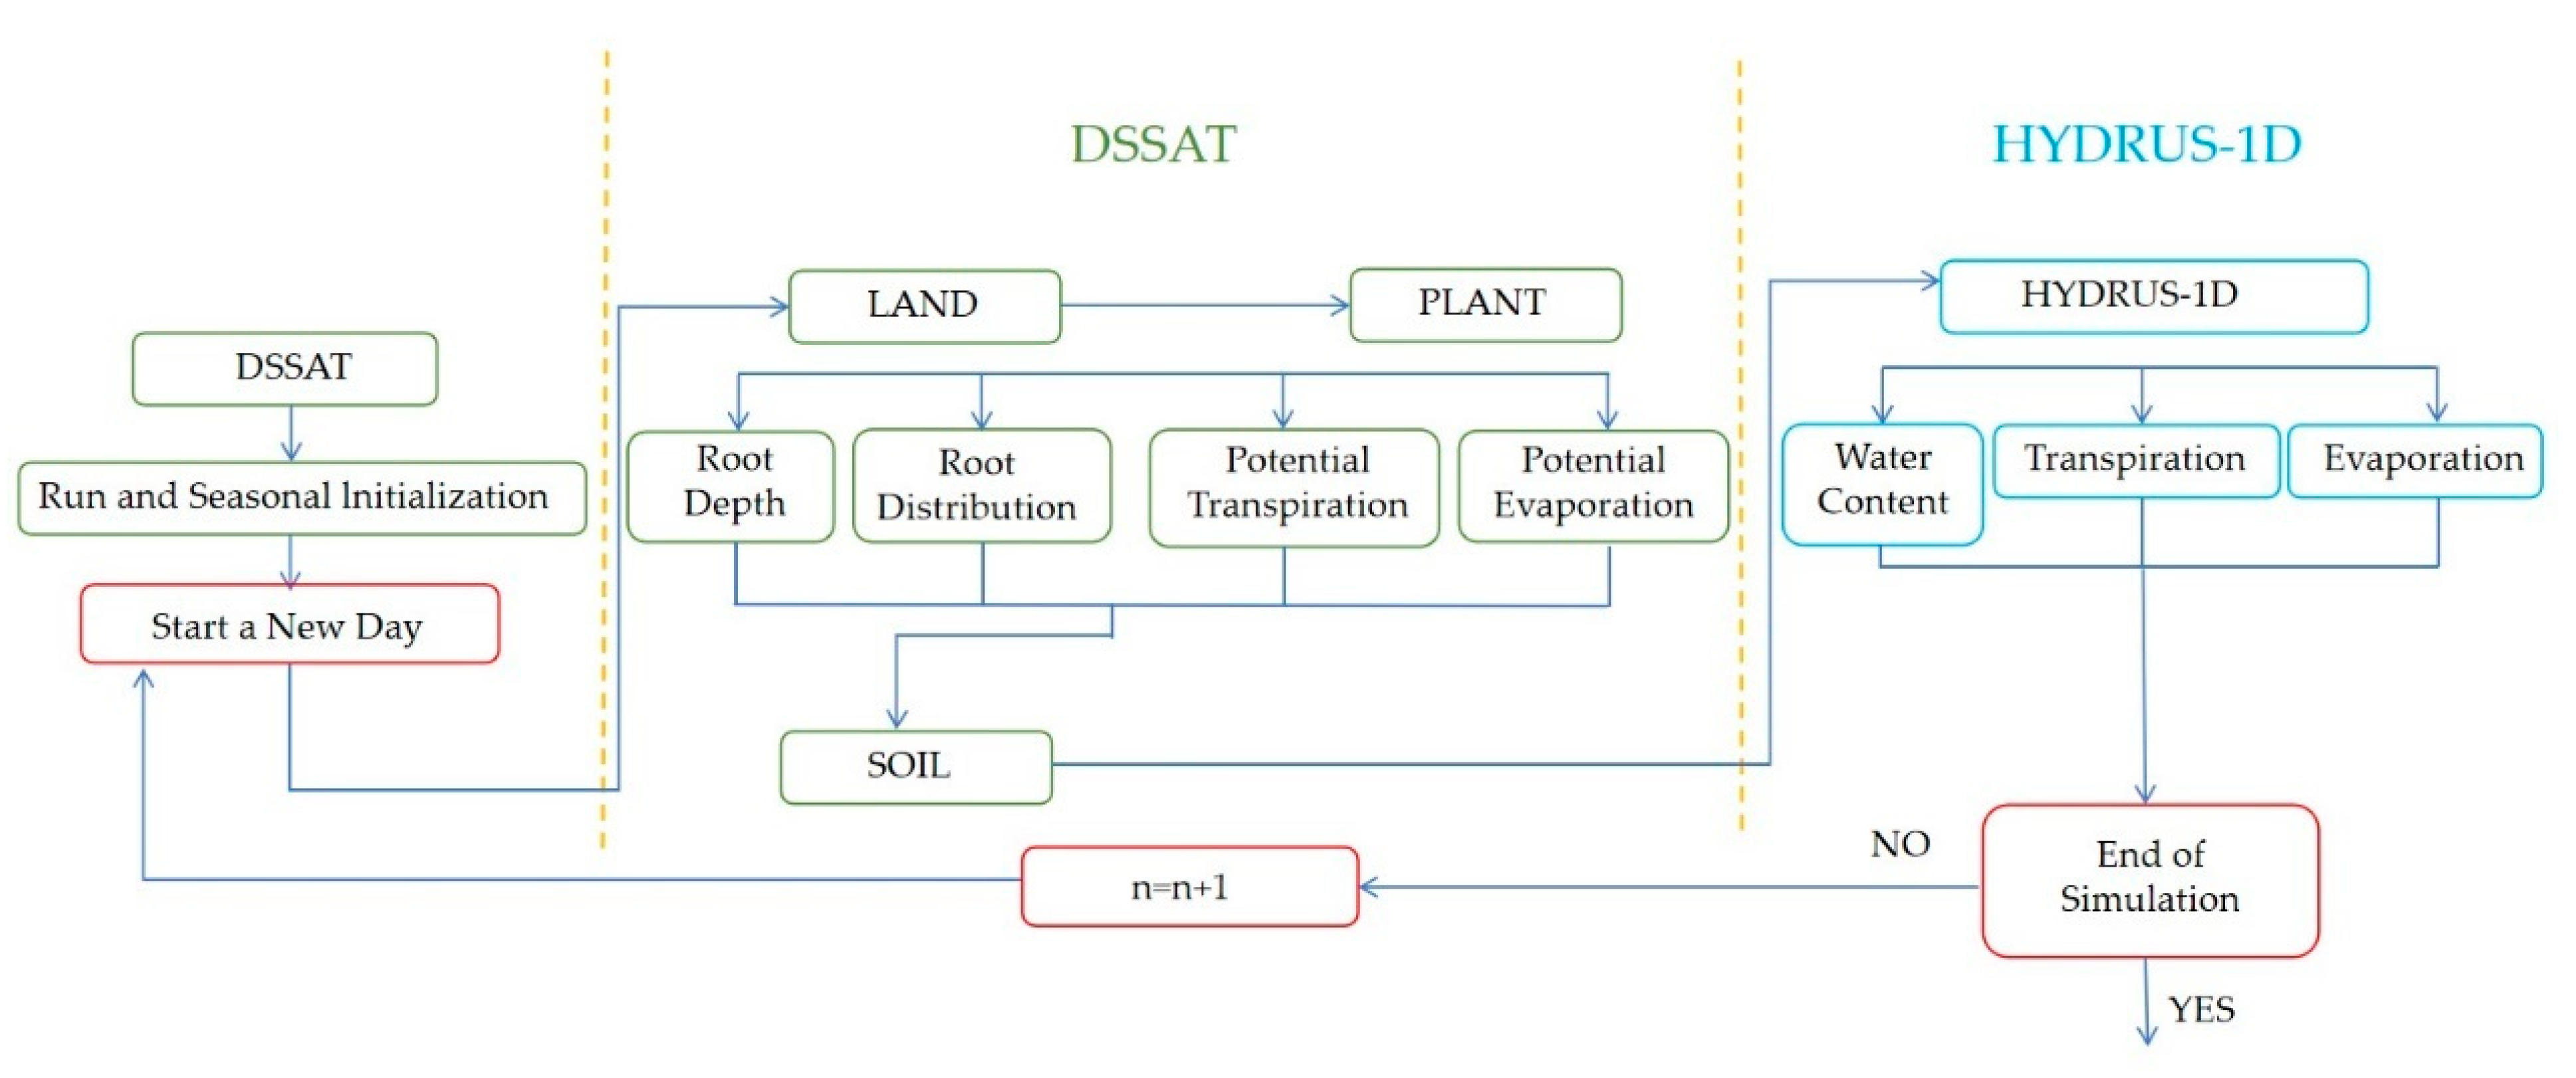
The DSSAT is predominantly utilized for simulating crop growth and development processes and currently adopts a water balance method for soil hydrology and water redistribution processes. In contrast, HYDRUS-1D, a hydrological model, employs the numerical solution of the Richards equation for simulating soil water flow, although its ability to model crop-related processes is relatively limited. Both DSSAT and HYDRUS-1D have been extensively applied and validated within their respective fields of application. To elucidate the interactions between soil moisture dynamics and crop growth, this paper integrates DSSAT crop growth simulations into the HYDRUS-1D model. Figure 5 illustrates the integration process between the HYDRUS-1D and DSSAT models, wherein DSSAT utilizes crop parameters and weather data to calculate crop growth. The outputs generated by the DSSAT, such as the root depth, potential evapotranspiration, irrigation, and precipitation parameters, are passed as inputs to HYDRUS-1D. HYDRUS-1D subsequently calculates the soil moisture content and the actual rates of transpiration and evaporation, integrates them daily using the variable time step of HYDRUS-1D, and subsequently sends the information back to the DSSAT [28]. The temporal and spatial discretization of the two models are different; thus, synchronization is needed. The models exchange information at a daily time interval, while HYDRUS-1D performs multiple steps within this interval. Consequently, the outputs from HYDRUS-1D must be averaged across multiple nodes before being input into DSSAT.

2.4. Model Establishment, Calibration, and Validation

2.4.1. Division of Simulation Units in the Study Area

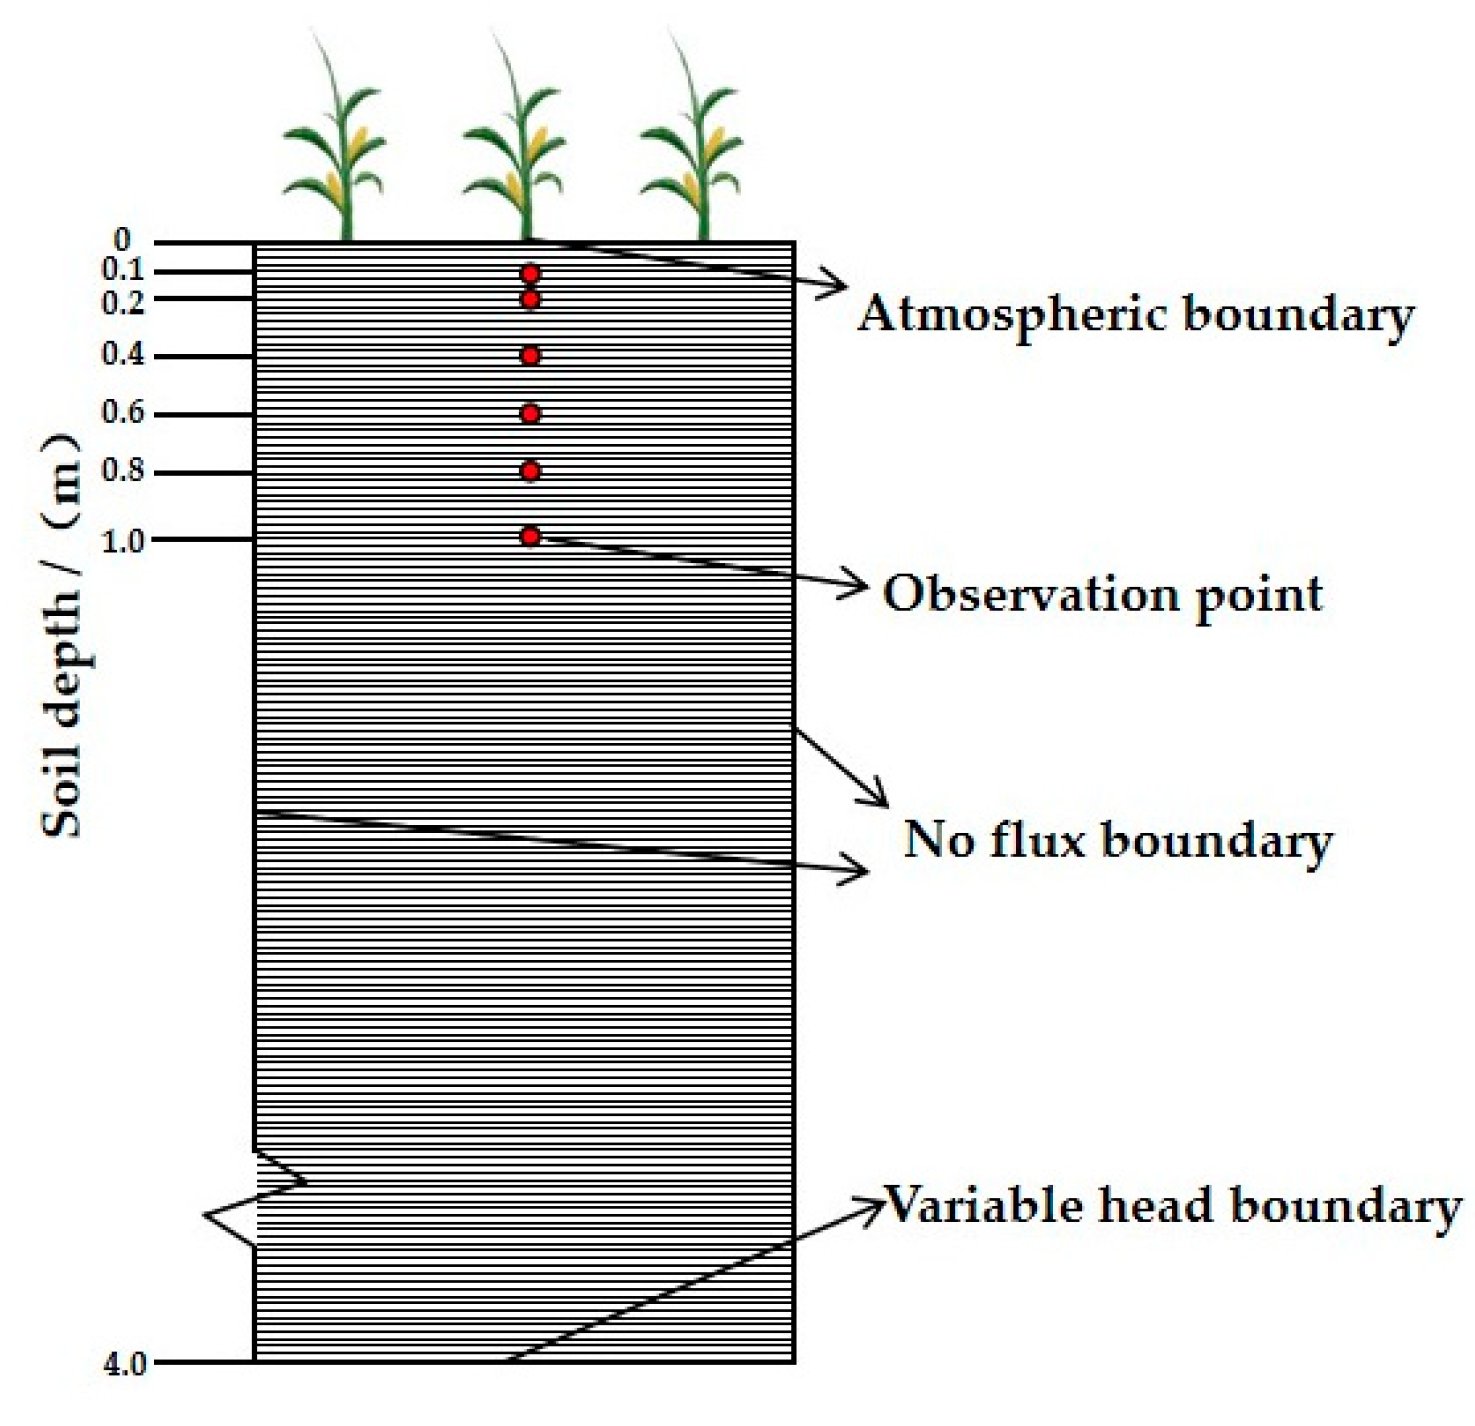
As shown in Figure 6, the depth of the simulation profile for the maize field is 400 cm. Reflecting the measured soil texture of the maize field (Table 1), the simulation profile was established with five layers, adhering to the collective research profile divisions outlined in Table 1. The vertical one-dimensional soil column was discretized into 401 nodes with a node spacing of 1 cm. The observation points were placed at soil depths of 10 cm, 20 cm, 40 cm, 60 cm, 80 cm, and 100 cm. The maize field simulation period was set from May 1st to 28 September, with 150 simulation days. The initial timestep is set to 0.1 days, the minimum timestep is set to 0.001 days, and the maximum timestep is set to 5 days.

2.4.2. Initial and Boundary Conditions

The boundary conditions for water movement in the maize field soil column are as follows: the upper boundary is set to atmospheric conditions, while the lower boundary is a variable head condition. Atmospheric boundary conditions necessitate the input of daily amounts of precipitation, evaporation, and transpiration. The variable head boundary condition employs daily values of groundwater depth to ascertain variable pressure head values. The initial state of the soil profile is determined by the soil moisture content measured in the field.

2.4.3. Soil Parameters

Initial soil hydraulic parameters (θs, θr, α, n, l) are determined based on the soil bulk density and the content of sand, silt, and clay particles (Table 1), with the bulk density, θs, Ks, and the content of sand, silt, and clay specified based on measured values (the soil data for DSSAT modeling are the same as those for HYDRUS-1D). The root water uptake parameters (h1, h2, h3h, h3l, h4, hφ, and hφ50) were set using default values provided by the software.

2.4.4. Model Calibration and Validation

The parameters were calibrated against 2022 data points for soil moisture content, leaf area index, and yield, while 2023 data points were utilized to validate the model’s simulation accuracy. For model calibration and evaluation, the root mean square error (RMSE), regression coefficient (b), coefficient of determination (R2), and mean relative error (MRE) were used [29].
R M S E = 1 N i 1 N ( P i O i ) 2
R 2 = i = 1 N ( O i O ¯ ) ( P i P ¯ ) i = 1 N ( O i O ¯ ) 2 0.5 i = 1 N ( P i P ¯ ) 2 0.5 2
b = i = 1 N O i × P i i = 1 N O i 2
M R E = 1 N i = 1 N ( P i O i ) O i × 100 %
where N represents the number of measured values, Oi represents the measured value, Pi is the (i) simulated value, O ¯ is the mean of the observed values, and P ¯ is the mean of the simulated values. The closer the MRE and RMSE are to 0 and the closer the regression coefficient (b) is to 1, the greater the accuracy of the model simulation. An R2 value close to 1 signifies that the model effectively captures the trends of the measured values. Generally, an MRE within ±10%, an RMSE-to-mean measured value ratio within 20%, and an R2 above 0.5 are considered to meet the calibration requirements.

3. Results

3.1. Model Calibration

The model was calibrated using soil moisture, leaf area index (LAI), and yield data collected in 2022. The simulated soil moisture values closely matched the measured values, and the simulation results accurately reflected the dynamic changes in soil moisture. The accuracy of the parameters met the requirements, indicating the high simulation precision of the model. The calibrated soil hydraulic parameters are detailed in Table 3. The values of the calibrated root water uptake parameters are provided in Table 4. As shown in Table 5, the average soil moisture from 0 to 100 cm had an MRE of 5.77%, an RMSE of 0.02, a coefficient of determination (R2) of 0.90, and a regression coefficient (b) of 1.02. The LAI had an MRE of 8.28%, an RMSE of 0.16, an R2 of 0.92, and a b value of 0.98. The yield had an MRE of 2.34%, an RMSE of 1.30, an R2 of 0.84, and a b value of 0.93. The genetic parameters for the Dssat-Forages-Alfalfa model, consisting of six parameters, were adjusted based on experimental data from 2022 to 2023 and the DSSAT-GLUE model parameter estimation tool, with the revised genetic parameters [30] displayed in Table 6.

3.2. Model Validation

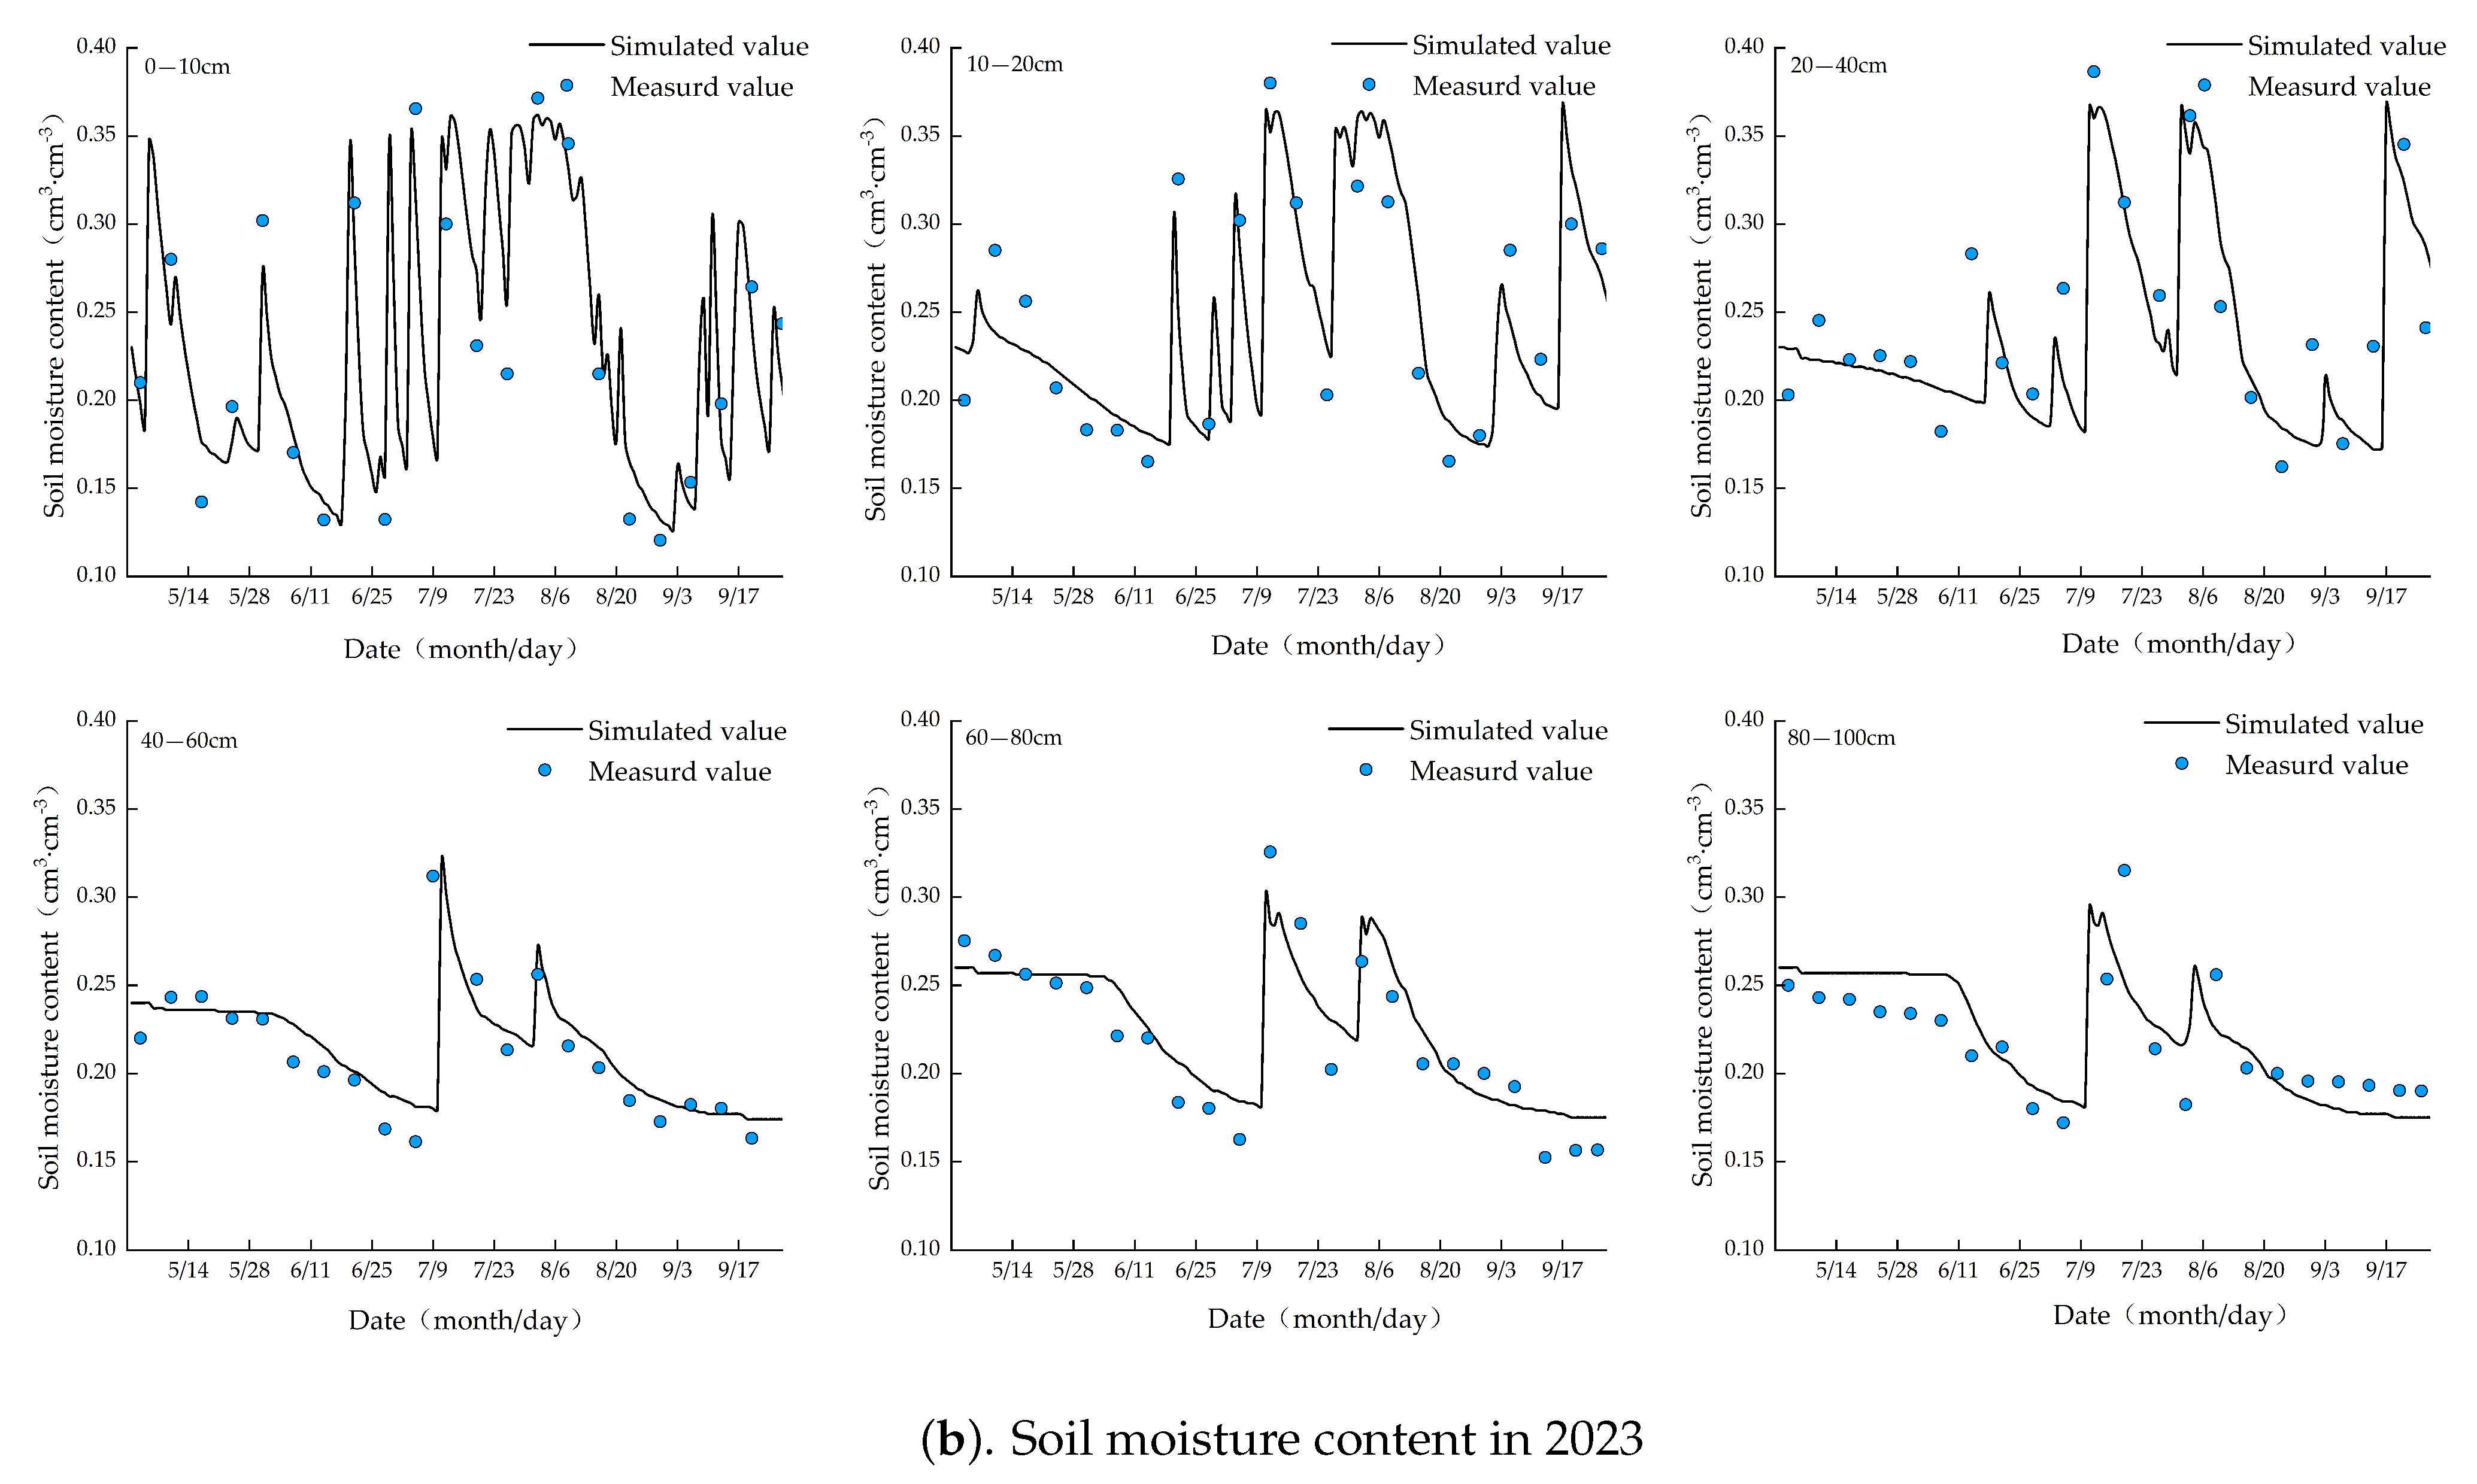
The model was validated against soil moisture and temperature data measured beginning in 2023, with all the parameters set to the values obtained after model calibration. The validation results are displayed in Figure 7, with the evaluation indicators for soil moisture (MRE: 6.03%, RMSE: 0.04, R2: 0.89, b: 0.92), LAI (MRE: 6.57%, RMSE: 0.20, R2: 0.91, b: 1.12), and yield (MRE: 1.58%, RMSE: 1.24, R2: 0.88, b: 0.90) meeting the required precision and closely aligning with the calibration results, as shown in Table 3.

3.3. Soil Moisture Dynamics

The DSSAT-HYDRUS-1D coupled model simulation results from 2022 and 2023 were used to analyze the dynamic changes in soil moisture in maize fields. The detailed changes are illustrated in Figure 8. Figure 8a shows that during the period from May 1st to 9 July, precipitation was sparse, accounting for only 22.6% of the total precipitation during the growing season. On many days, the accumulated precipitation did not exceed 5 mm. Consequently, between the beginning of the study and 9 July, only the surface soil moisture (0–40 cm) exhibited minor fluctuations, while the moisture content in the 40–100 cm soil layer remained largely unchanged. Following concentrated precipitation from 10 July to 4 September, as indicated in Figure 3, with daily precipitation peaking at 98.2 mm, significant changes were observed in the surface soil layer (0–40 cm), and the moisture content in the 40–100 cm soil layer progressively increased due to infiltration. The soil exhibited a high water retention capacity, leading to slow moisture depletion in the absence of additional water sources; between June 22nd and 9 July, the moisture content at soil depths of 10 cm, 20 cm, and 40 cm decreased by 47.68%, 30.24%, and 22.81%, respectively. During the period of concentrated precipitation, the moisture content at soil depths of 10 cm, 20 cm, 40 cm, 60 cm, 80 cm, and 100 cm increased by 58.62%, 40.17%, 34.46%, 27.95%, 13.28%, and 5.40%, respectively.
The soil moisture changes in 2023 are depicted in Figure 8b. The experimental site received irrigation once on 10 July 2023, in accordance with local irrigation practices. Precipitation in 2023 primarily occurred from mid-June to early September, comprising 66.51% of the total precipitation during the growing season (as shown in Figure 2). Consequently, the soil moisture content exhibited significant fluctuations during this period, with average values at soil depths of 10 cm, 20 cm, 40 cm, 60 cm, 80 cm, and 100 cm of 0.24 cm3/cm3, 0.25 cm3/cm3, 0.24 cm3/cm3, 0.21 cm3/cm3, 0.22 cm3/cm3, and 0.21 cm3/cm3, respectively. The percentages of the increase in soil moisture content before and after irrigation at depths of 10 cm, 20 cm, 40 cm, 60 cm, 80 cm, and 100 cm were 94.41%, 89.58%, 87.82%, 79.47%, 66.85%, and 62.98%, respectively.

3.4. Impact of Soil Moisture Variation on Crop Growth

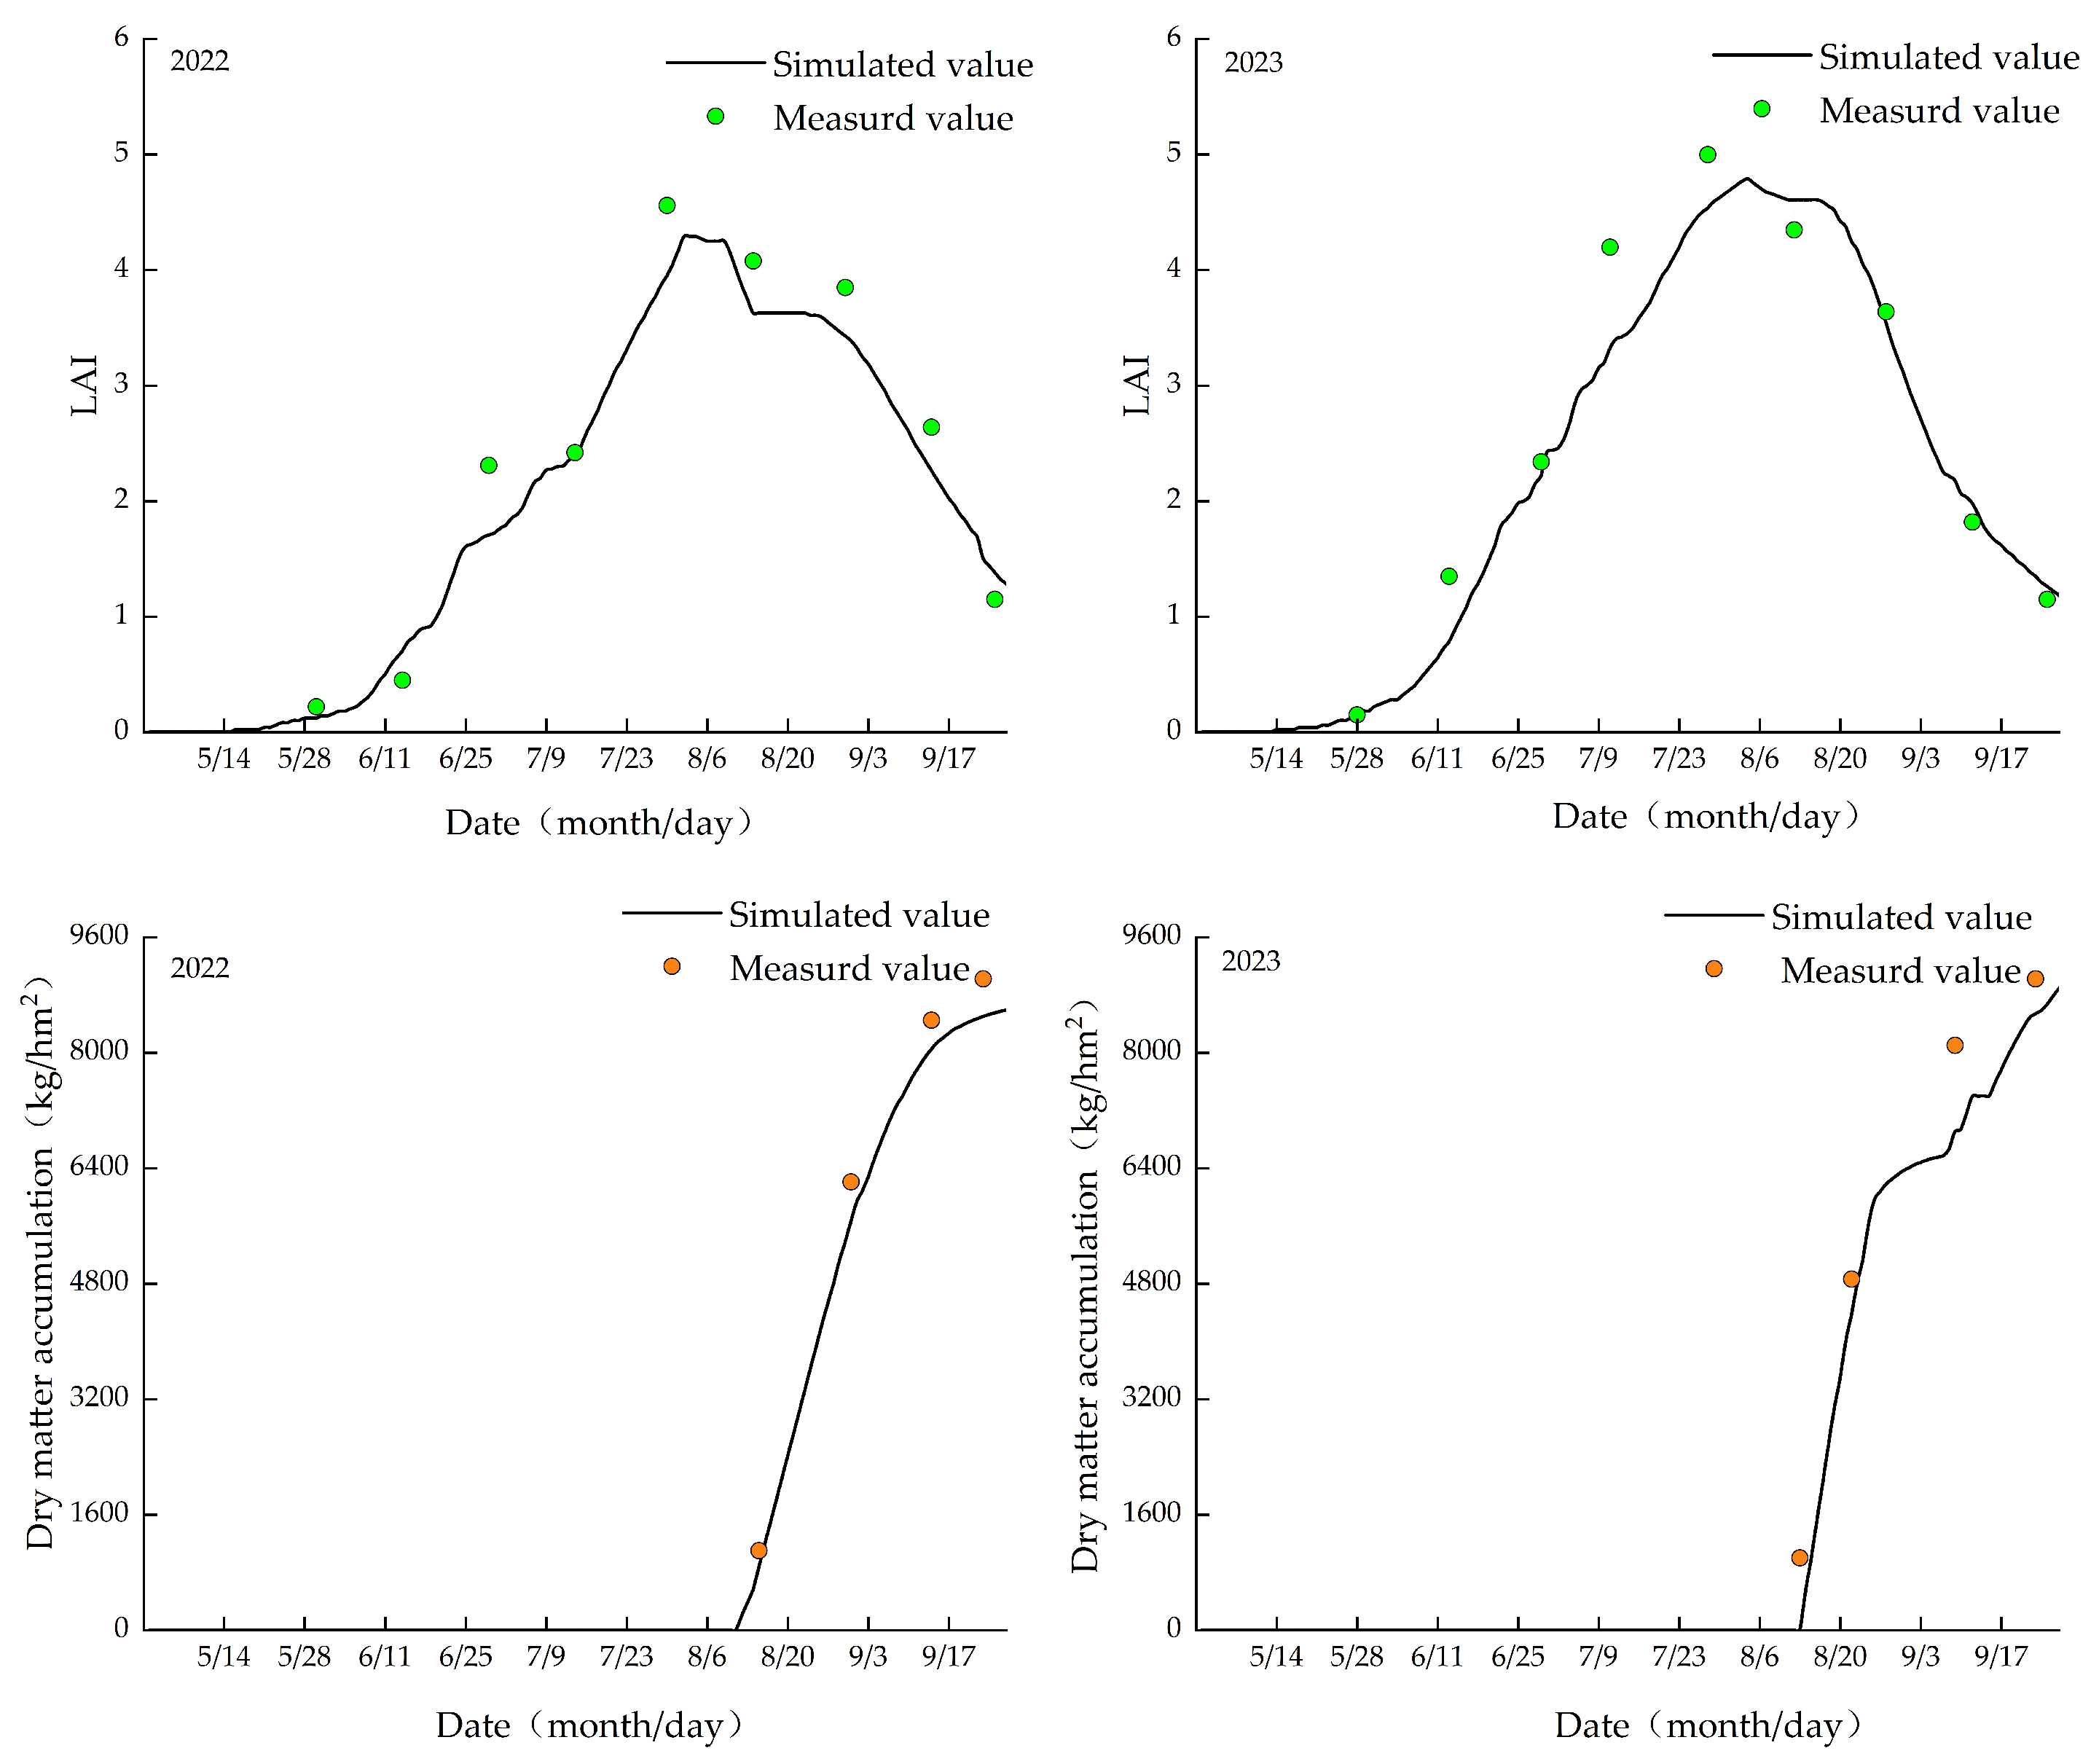
The LAIs of maize plants in 2022 and 2023 are depicted in Figure 9. The LAI experienced considerable variations in line with the growth stages of the crop, displaying a characteristically unimodal pattern that was consistent across both years. Growth commenced in mid-May, rapidly accelerating through the fast growth period to a peak, followed by a gradual decline during the middle to late growth stages as the maize began to senesce and the leaves eventually yellowed and withered. In 2022, the peak maize LAI occurred on August 2nd, preceded by a noticeable downward trend in the soil moisture content. This result suggested a greater water demand during periods of increased LAI. As the maize continued to grow and the LAI started to decline, the rate of soil moisture reduction began to slow. In 2023, the peak LAI reached 4.79 on 4 August.
The yield of summer maize is intricately linked to the production and accumulation of dry matter, with the primary strategy for yield enhancement being an increase in dry matter quantity. The accumulation of dry matter commenced at a slow pace from the rapid growth stage, accelerated from the mid-growth to late-growth stages, and then decelerated after the late-growth stage. In 2022, an exponential increase in dry matter accumulation, which requires significant water resources, was observed during the mid-growth period. The precipitation in this period resulted in elevated soil moisture levels, which then declined swiftly. This phase was followed by a period of steady growth, with an average daily yield growth rate of 56.00 kg/hm2 across the entire growth cycle. In 2023, a phase of slow growth was noted in early September, aligning with a gradual reduction in soil moisture levels. Throughout the entire growth cycle, the average daily yield growth rate was 60.42 kg/hm2.

3.5. Analysis of Water Dynamics during Crop Growth Stages

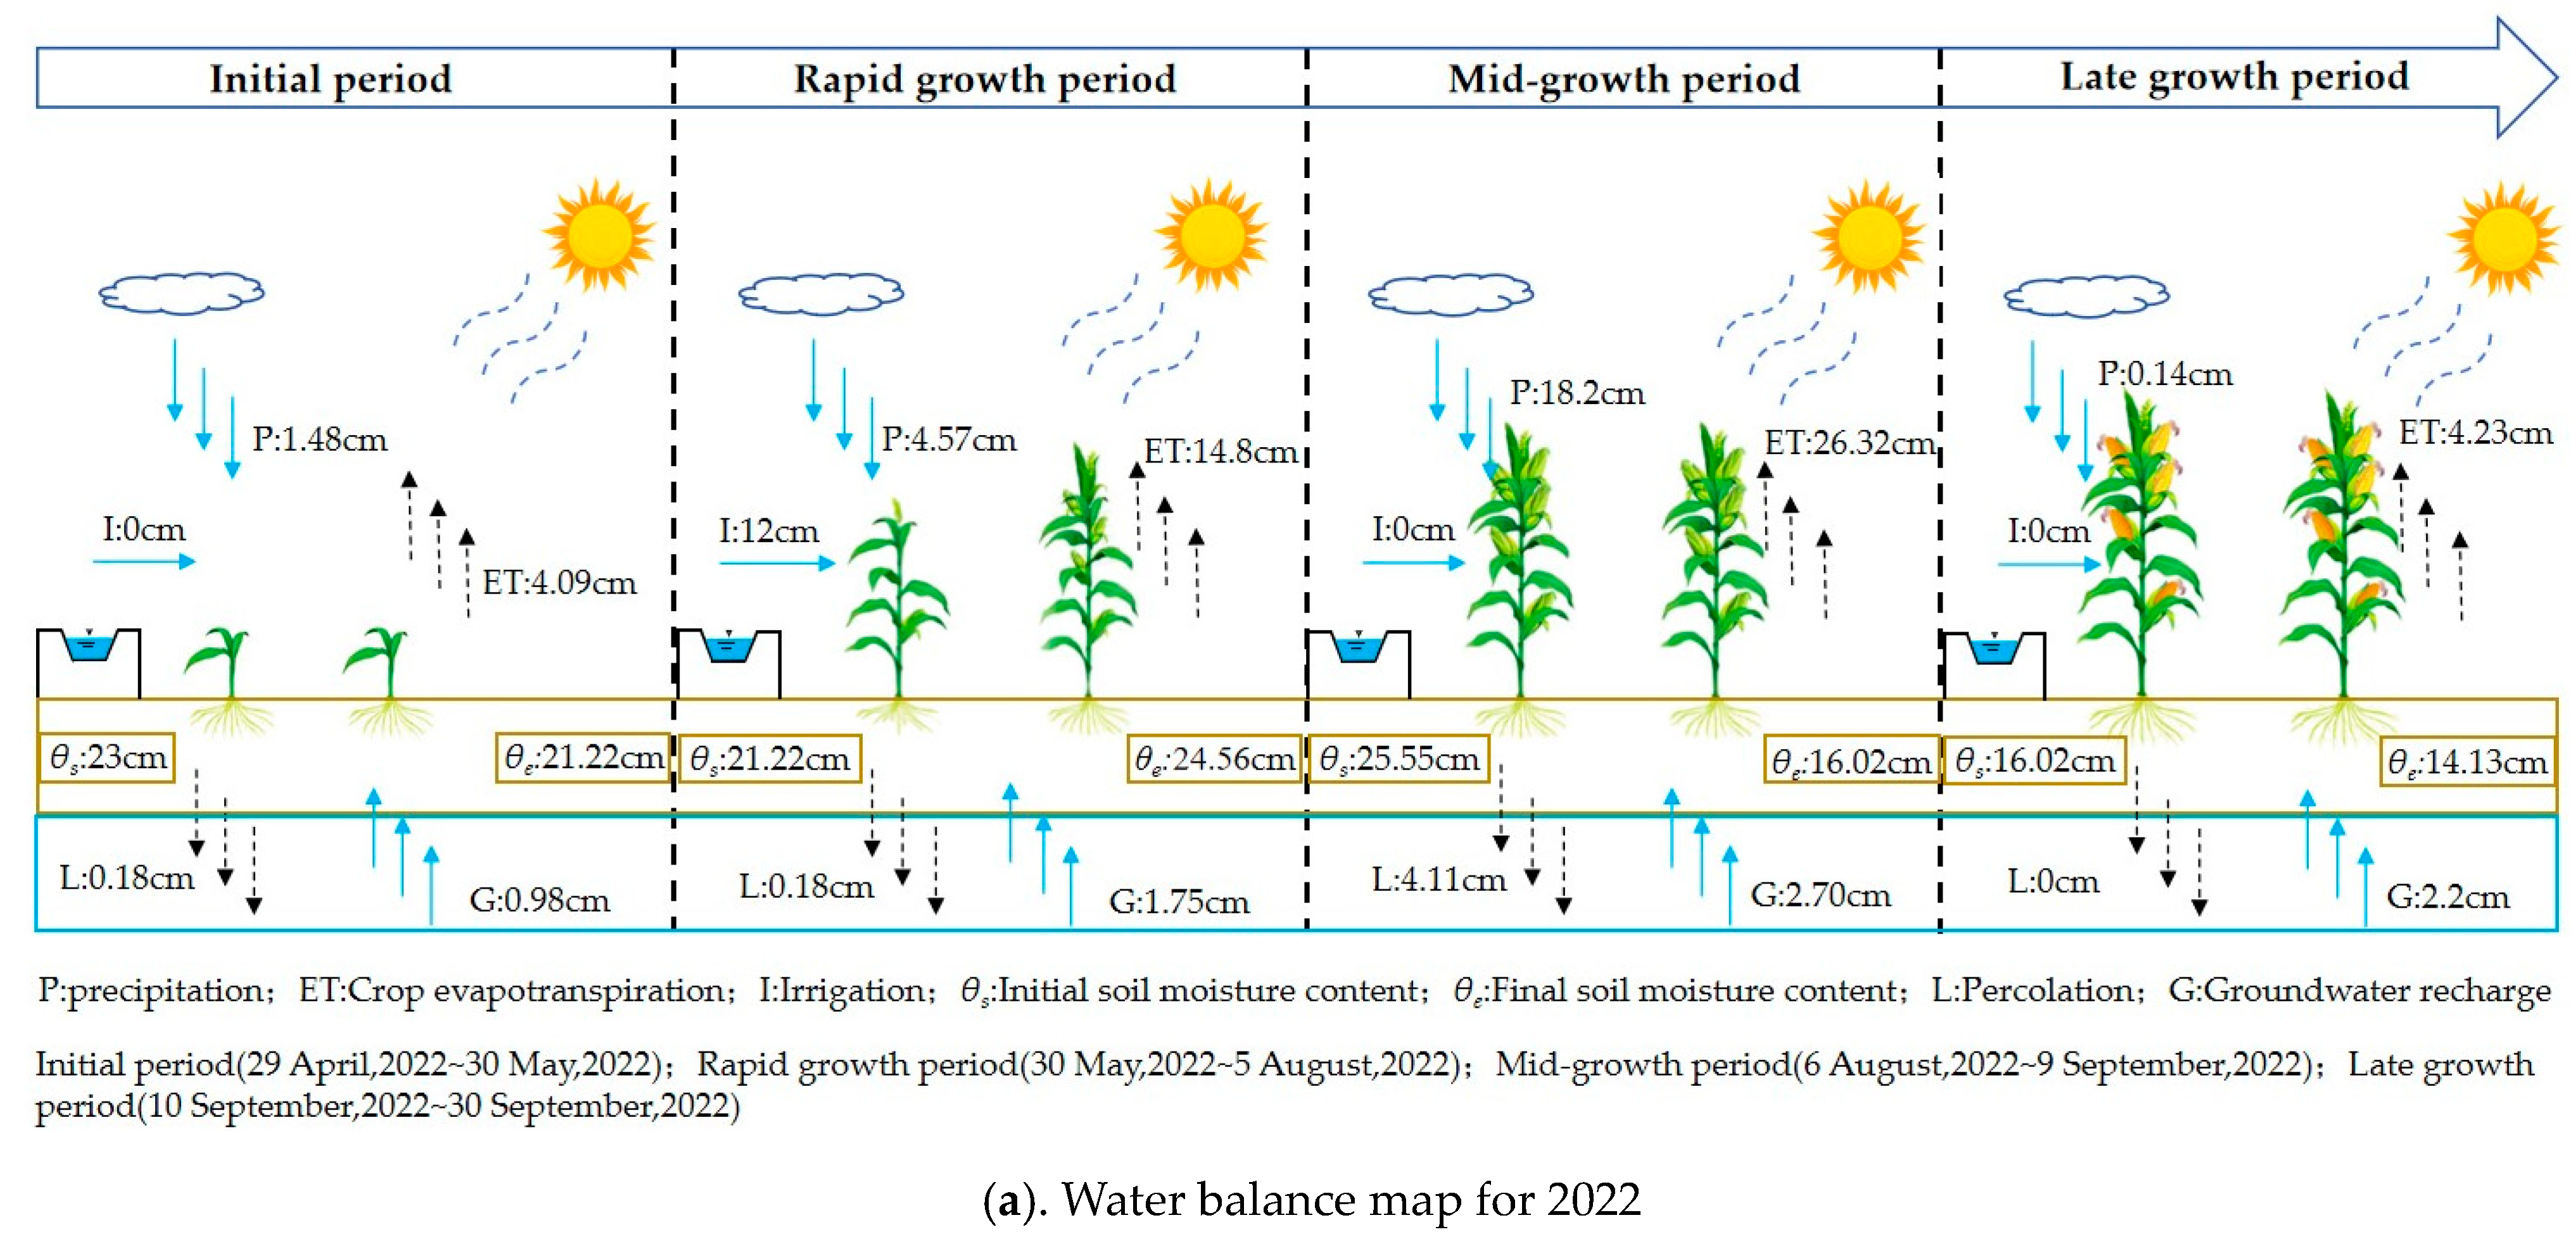
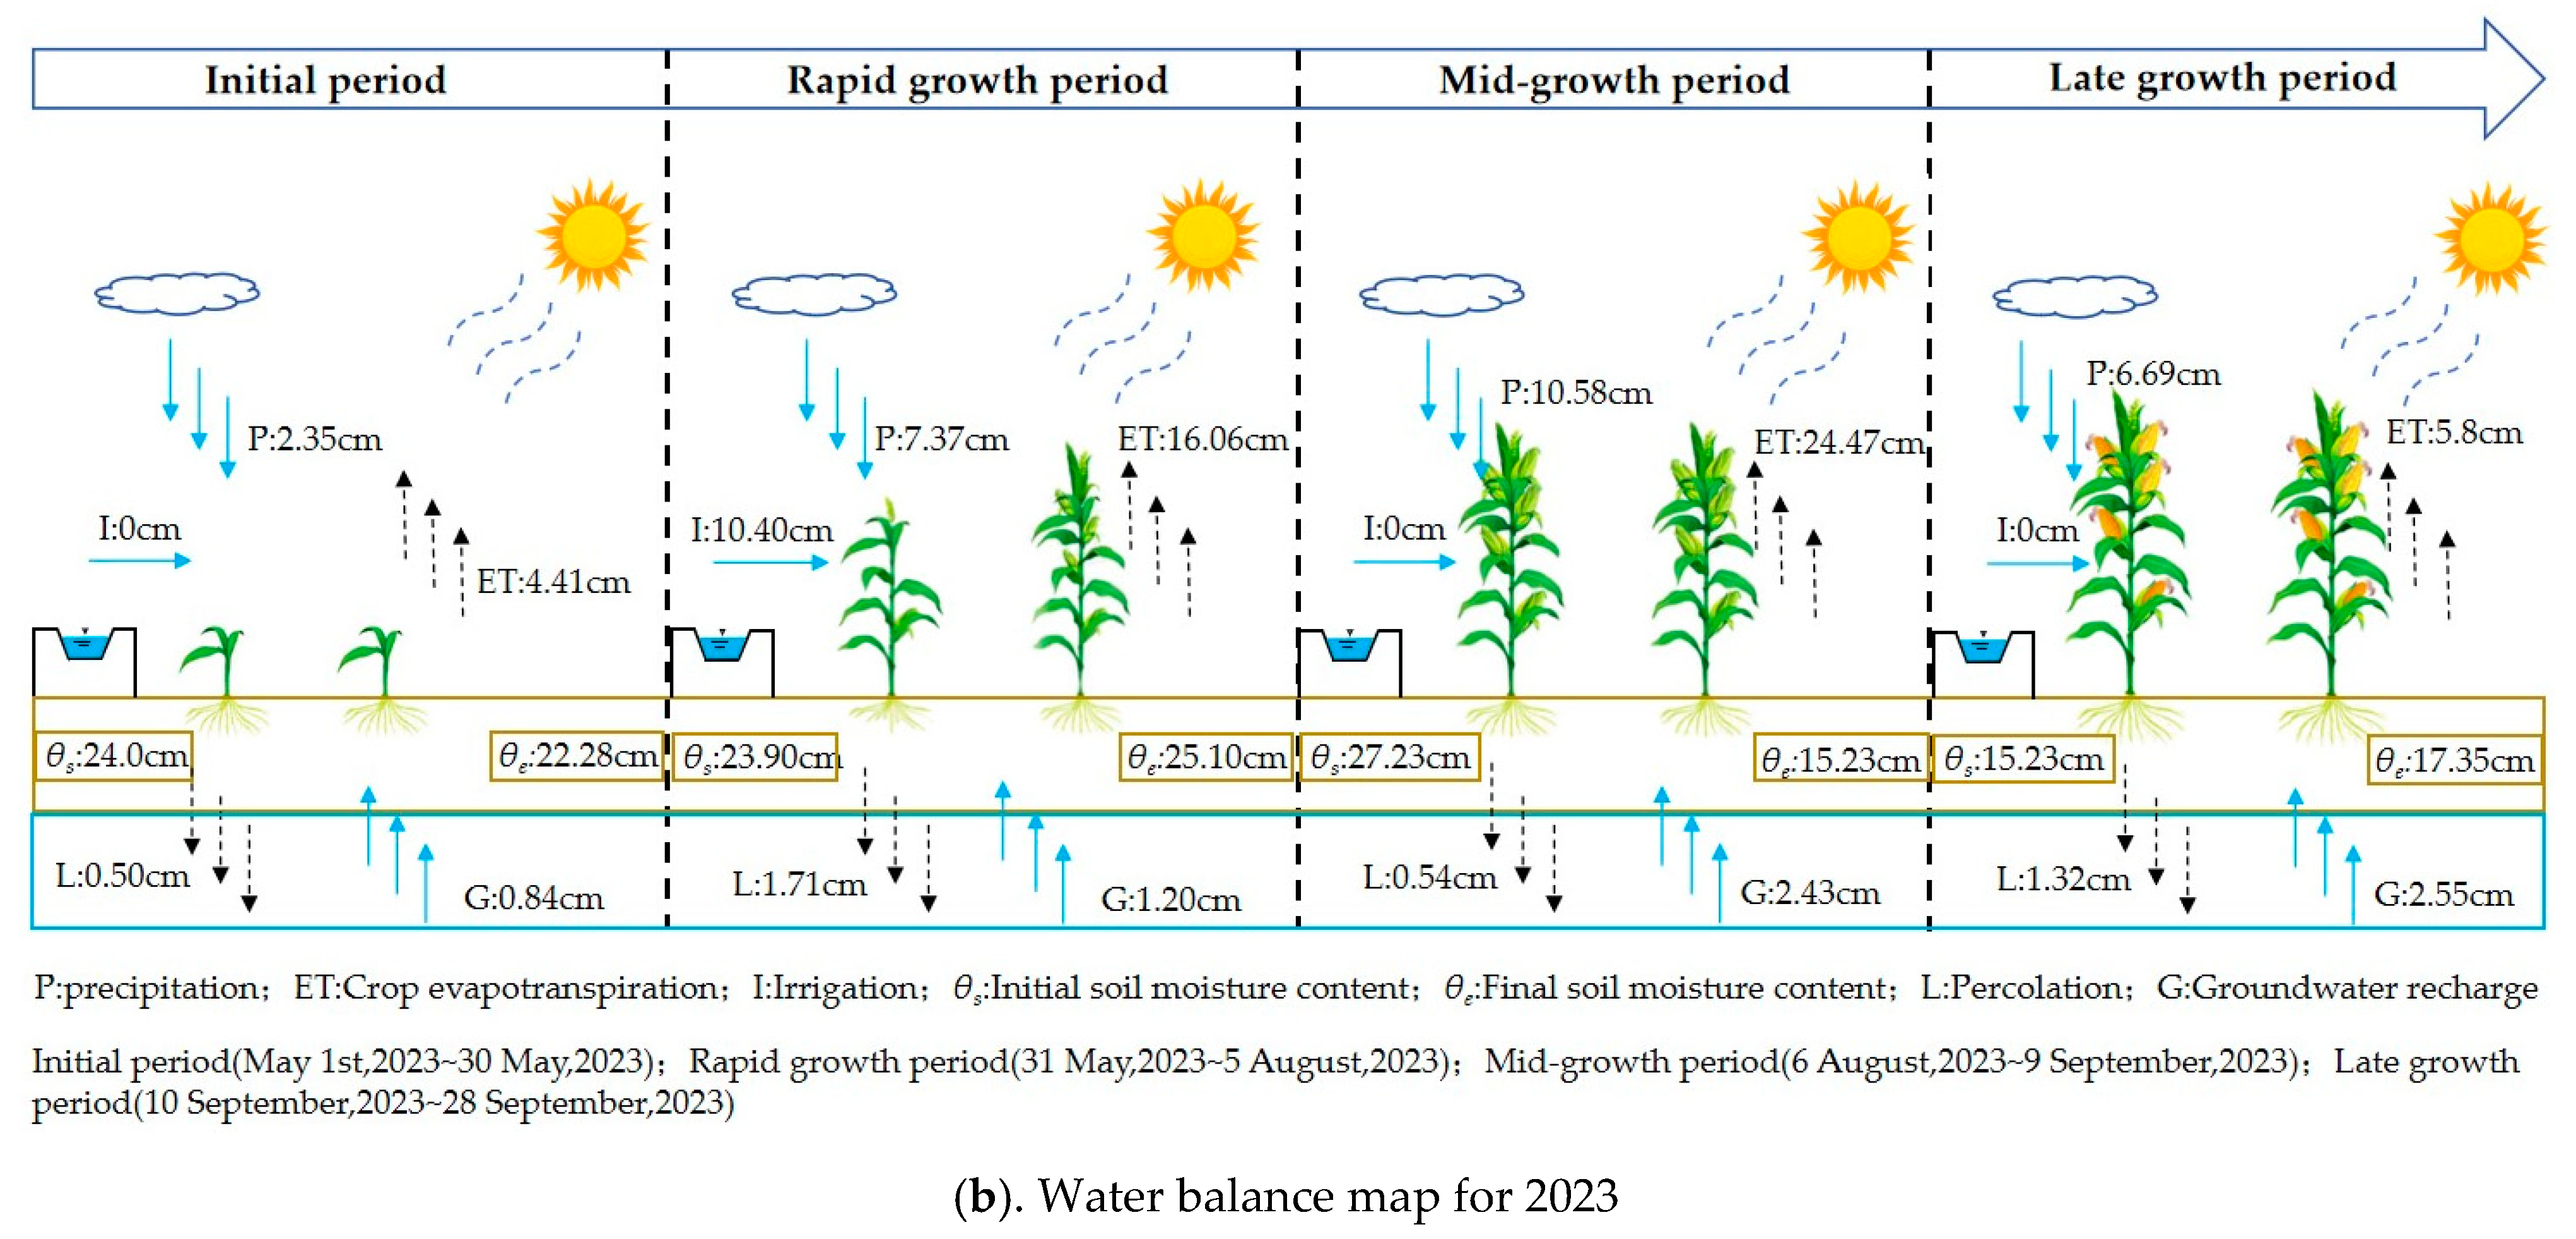
Using outputs from the DSSAT-HYDRUS-1D coupled model for soil moisture, evapotranspiration, and groundwater recharge in maize during 2022 and 2023 and based on water balance principles, an analysis of water variation within the 0–100 cm soil profile across different growth stages was conducted. The results are depicted in Figure 10.
In 2022, irrigation in the experimental field was concentrated during the rapid growth period (from 10 July to 16 July), increasing soil moisture content and resulting in 0.18 cm of water percolation in the 0–100 cm soil layer. On 14 August, 98.2 mm of precipitation during the mid-growth period caused the greatest percolation of the period at 4.11 cm. The total percolation during the growing season amounted to 4.47 cm, representing 91.9% of the season’s total percolation. The rapid and mid-growth periods had the highest rates of evapotranspiration, recorded at 14.80 cm and 26.32 cm, constituting 29.95% and 53.26% of the total evapotranspiration, respectively. Evaporation and transpiration accounted for 52.25% and 83.54% of the water input (precipitation + irrigation), respectively, with percolation accounting for 4.47 cm or 12.28% of the total input water.
In 2023, percolation in the experimental field was about 4.07 cm, mainly during the rapid growth and post-growth periods, at 1.71 cm and 1.32 cm, respectively, accounting for 74.47% of the total percolation. This amount correlated with 73.7 mm and 105.8 mm of precipitation in these periods, constituting 66.51% of the total precipitation, alongside one irrigation event during the rapid growth period. The highest evapotranspiration, at 24.47 cm, occurred during the mid-growth period, accounting for 48.23% of the total evapotranspiration. Evaporation and transpiration represented 52.85% and 75.96% of the water input (precipitation + irrigation), respectively. Evaporation at the beginning of growth ranged from 38.80 mm to 40.60 mm, with an average rate of 1.29 to 1.35 mm/d. During the rapid growth period, it ranged from 57.60 mm to 60.40 mm, with an average rate of 0.86 to 0.90 mm/d. During the mid-growth period, the evaporation ranged from 76.80 mm to 84 mm, with an average rate of 2.19 to 2.40 mm/d. During the post-growth period, it ranged from 17.00 mm to 23.2 mm, with an average rate of 0.94 to 1.29 mm/d. The evaporation rate exhibited a pattern of starting and ending increase, with a dip in the middle. The average transpiration rates during the early growth, rapid growth, mid-growth, and post-growth periods were 0.06 to 0.12 mm/d, 1.35 to 1.50 mm/d, 4.59 to 5.33 mm/d, and 1.41 to 1.93 mm/d, respectively, showing an initial increase followed by a decrease. The total water consumption of the crop throughout the growing season was between 494.2 mm and 507.4 mm, following a pattern of initial increase followed by a decrease.

4. Discussion

Field experiments and numerical simulations were conducted in the Dengkouyangshui irrigation district of Inner Mongolia at the Wuhe and Gaiden sluice research sites in 2022 and 2023. A coupled model was constructed by integrating the one-dimensional agricultural hydrological model HYDRUS-1D with the crop model DSSAT. This DSSAT-HYDRUS-1D coupled model underwent calibration and validation with 2022 and 2023 data (including soil moisture content, leaf area index, and crop yield) [31]. The calibration matched the simulated and measured values [32], effectively representing the soil moisture cycle within the Wuhe and Gaiden sluice research areas. In the coupled model, the root mean square error (RMSE) for the soil moisture content ranged from 0.02 to 0.04, while the RMSE for the leaf area index varied from 0.16 to 0.20. These results are comparable to those obtained by Li Lei [33], who integrated remote sensing data on soil moisture in the maize root zone and developed a coupled model combining the crop growth model (WOFOST) and the hydrological model (HYDRUS-1D), achieving soil moisture RMSE values between 0.073 and 0.101 and leaf area index RMSE values between 0.45 and 1.05. The precision of the RMSE in our model surpassed that of Li Lei’s study, possibly due to the latter’s method of dividing the 0–100 cm soil profile into just two layers, which might have reduced the accuracy. Using the DSSAT-HYDRUS-1D coupled model, the soil moisture content was simulated for the entire maize-growing period. The study revealed that from the start of the period to early July, when precipitation was minimal, only surface soil moisture (0–40 cm) showed minor variations, whereas the moisture content in the 40–100 cm soil layer remained mostly constant. With concentrated precipitation from mid-July to early September, significant moisture content changes occurred in the 0–40 cm surface soil layer, and the moisture content in the 40–100 cm soil layer gradually increased due to infiltration. Various soil depths reached peak moisture contents in August or September, consistent with the findings of researchers such as Cheng et al. [34] and Wang et al. [16]. According to 2022 and 2023, the leaf area index (LAI) changed notably across the crop growth stages, following a similar unimodal pattern in both years and reaching its peak in early August (4.23 to 4.79), which falls within the LAImax value range for the northwestern region (4.2 to 6.2) [35]. During this time, the soil moisture content significantly decreased, supporting the observations of Li Donghao [36]. Over the two years, the data showed that dry matter accumulation experienced exponential growth during the mid-growth period, coinciding with a high demand for water. Following precipitation, the soil moisture increases and then rapidly decreases, peaking at harvest [37]. The average daily yield growth rate throughout the entire growing season was between 56.00 and 60.42 kg/hm2. Feng et al. [38], using a combination of the HYDRUS model and the EPIC module, assessed the impact of saline water irrigation on grain yield under subsurface drainage conditions. The findings indicated that, at a salinity level of 4.4 dS m−1, the average daily grain yield growth rate was approximately 50.67 kg/hm2. The yield in this study was greater than that reported by Feng et al. [38], possibly because the impact of salinity on crop growth was not considered in this research.
The investigation showed that the evaporation amounts for maize during the early growth, rapid growth, mid-growth, and post-growth stages ranged from 38.80 mm to 40.60 mm, 57.60 mm to 60.40 mm, 76.80 mm to 84.00 mm, and 17.00 mm to 23.20 mm, respectively; the average evaporation rates were 1.29 to 1.35 mm/d, 0.86 to 0.90 mm/d, 2.19 to 2.40 mm/d, and 0.94 to 1.29 mm/d, respectively. During the maize growing period, the evaporation rate peaked at the beginning and end, with a decrease in the middle, echoing the findings of Zhang et al. [39] in the Yellow River Irrigation District. The average transpiration rates of the plants during the early growth, rapid growth, mid-growth, and post-growth stages were 0.06 to 0.12 mm/d, 1.35 to 1.50 mm/d, 4.59 to 5.33 mm/d, and 1.41 to 1.93 mm/d, respectively, demonstrating an increase followed by a decrease. The total water consumption of the crop throughout the growing season was between 494.2 mm and 507.4 mm. These results align with those of Fu et al. [40], who simulated the water balance during the summer maize growing period using the HYDRUS-2D model. Research by Ren et al. [41] on a typical irrigation-drainage unit in the Hetao Irrigation District showed that crop water consumption during the growing season ranged from 495 mm to 567 mm, which is greater than the findings of this study because of the greater net irrigation depth and more frequent irrigation events. The total deep percolation of the soil throughout the growing season ranged from 44.70 mm to 60.70 mm, making up 12.28% to 15.42% of the input water (irrigation + precipitation), in agreement with the studies of Chen [42], Zhao and Zhao [43], and Yang [44]. According to Chen Junwu, soil percolation is influenced not by irrigation intensity but by the soil moisture content before irrigation [42]. The lower percolation rate in this study could be due to the reduced initial soil moisture content measured. In the post-growth stage of 2022, owing to decreased precipitation, all the input water was used for crop growth, leading to no percolation, which is consistent with Yang’s [44] observations.
This study focused on water movement in crops but did not examine solute transport, limiting itself to the water cycle process on a small agricultural scale. Future efforts will include the use of the DSSAT-HYDRUS-1D coupled model and the ArcGIS platform, along with regional soil water and salinity data as well as crop growth data, to quantitatively evaluate the spatiotemporal status of soil water, salinity, and crop growth across the entire Dengkouyangshui irrigation district.

5. Conclusions

This paper integrates the HYDRUS-1D model with the DSSAT crop model through the DSSAT-HYDRUS-1D coupled model to investigate the agricultural water cycle process in maize fields within the Wuhe and Gaiden sluice areas of the Dengkouyangshui irrigation district in Inner Mongolia. The principal findings are summarized as follows:
(1) The DSSAT-HYDRUS-1D coupled model underwent calibration and validation with data collected in 2022 and 2023. The root mean square error (RMSE) relative to the average measured values ranged from 5.03% to 15.74%, the mean relative error (MRE) ranged from 4.00% to 7.79%, the coefficient of determination (R2) ranged from 0.77 to 0.94, and the regression coefficient (b) ranged from 0.89 to 1.06. The accuracy of the parameters was within acceptable limits, indicating that the model achieved high simulation precision.
(2) The soil at the study site was characterized by relatively high water retention and holding capacities. Without water replenishment, soil moisture depletion gradually decreased from late June to early July, with moisture decreases of 47.68%, 30.24%, and 22.81% in the 10 cm, 20 cm, and 40 cm soil layers, respectively. The moisture content in the shallow (0–40 cm) and deeper (40–100 cm) soil layers increased by 78.62% to 94.41% and 60.33% to 79.47%, respectively, before and after irrigation. The leaf area index varied significantly across different crop growth stages, showing a consistent unimodal pattern over two years, with an average daily yield increase of 56.00 to 60.42 kg/hm2 throughout the growing season.
(3) The total water consumption for maize at the site during the growing season was between 494.2 mm and 507.4 mm. Soil evaporation and transpiration represented 52.25% to 52.85% and 75.96% to 83.54% of the total input water (precipitation + irrigation), respectively. The percolation ranged from 4.47 cm to 6.07 cm, accounting for 10.15% to 13.09% of the total input water. The analysis of the water balance during different crop growth stages suggested that the optimal irrigation volume during the rapid growth period should be between 104 mm and 120 mm.

Author Contributions

Conceptualization, J.Z.; methodology, J.Z.; software, G.W.; validation, J.Z., D.T. and B.X.; formal analysis, J.Z.; investigation, F.W.; resources, Z.Z.; data curation, J.Z. and X.M.; writing—original draft preparation, J.Z.; writing—review and editing, D.T., H.S. and G.W.; visualization, J.Z.; supervision, B.X.; project administration, D.T. and H.S.; funding acquisition, D.T. All authors have read and agreed to the published version of the manuscript.

Funding

This study was supported by the Integrated demonstration of spatio-temporal regulation and economical and intensive utilization of water resources in the Yellow River diversion irrigation area of Inner Mongolia, Grant No 2023JBGS0003; it was also supported by the Study on the Research on influencing factors identification and intelligent evaluation model of water use efficiency in Dengkouyangshui irrigation district, Grant No MK2022J13.

Data Availability Statement

Data are contained within the article.

Acknowledgments

We highly appreciate the reviewers’ and editors’ useful suggestions on this work. This study was supported by the Yinshanbeilu Grassland Eco-hydrology National Observation and Research Station Field testing station.

Conflicts of Interest

The authors declare no conflicts of interest.

References

  1. Zhou, X.; Liao, J. Accelerating the development of lrrigated areas in Jjiangxi Province, suggestions on helping food production security. J. Irrig. Drain. 2022, 41, 115–118. [Google Scholar] [CrossRef]
  2. Ding, Y.; Zhou, C.; Shao, M.A.; Chen, Y.; Zhang, G.; Zhang, S.; Han, T.; Nan, Z. Studies of earth surface processes: Progress and prospect. Adv. Earth Sci. 2013, 28, 407–419. [Google Scholar]
  3. Jeyalakshmi, S.; Chilkoti, V.; Bolisetti, T.; Balachandar, R. Earth data assimilation in hydrologic models: Recent advances. Int. J. Environ. Stud. 2021, 78, 1003–1021. [Google Scholar] [CrossRef]
  4. Ackerer, J.; Kuppel, S.; Braud, I.; Pasquet, S.; Fovet, O.; Probst, A.; Pierret, M.-C.; Ruiz, L.; Tallec, T.; Lesparre, N. Exploring the Critical Zone Heterogeneity and the Hydrological Diversity Using an Integrated Ecohydrological Model in Three Contrasted Long-Term Observatories. Water Resour. Res. 2023, 59, e2023WR035672. [Google Scholar] [CrossRef]
  5. Yang, S.; Yu, J.; Lou, H.; Sun, W.; Zhao, C.; Wang, X.; Song, W.; Cai, M.; Dai, Y. Review of the remote sensing hydrological mode. Acta Geogr. Sin. 2023, 78, 1691–1702. [Google Scholar]
  6. Beven, K. How to make advances in hydrological modelling. Hydrol. Res. 2019, 50, 1481–1494. [Google Scholar] [CrossRef]
  7. Pei, Y.; Xu, J.; Xiao, W.; Yang, M.; Hou, B. Development and application of the water amount, quality and efficiency regulation model based on dualistic water cycle. J. Hydraul. Eng. 2020, 51, 1473–1485. [Google Scholar]
  8. Wang, Y. Evaluation of Farmland Water Circulation Health in Irrigated Area of North China Plain: A Case Study of Junliu Irrigated Area. Master’s Thesis, Hebei University of Engineering, Handan, China, 2021. [Google Scholar]
  9. Zhang, M. Study on Law of Hydrological Cycle and Water Resources Regulation in Jinghui Canal Irrigation District. Ph.D. Thesis, Chang’an University, Xi’an, China, 2021. [Google Scholar]
  10. Wang, R.; Xiong, L.; Xu, X.; Liu, S.; Feng, Z.; Wang, S.; Huang, Q.; Huang, G. Long-term responses of the water cycle to climate variability and human activities in a large arid irrigation district with shallow groundwater: Insights from agro-hydrological modeling. J. Hydrol. 2023, 626, 130264. [Google Scholar] [CrossRef]
  11. Gaagai, A.; Aouissi, H.A.; Krauklis, A.E.; Burlakovs, J.; Athamena, A.; Zekker, I.; Boudoukha, A.; Benaabidate, L.; Chenchouni, H. Modeling and Risk Analysis of Dam-Break Flooding in a Semi-Arid Montane Watershed: A Case Study of the Yabous Dam, Northeastern Algeria. Water 2022, 14, 767. [Google Scholar] [CrossRef]
  12. Gao, Z.; Zhong, R.; Yang, S. Recent progresses in research and applications of Hydrus model in China. Soils 2022, 54, 219–231. [Google Scholar]
  13. Yu, Q.; Liu, C. Research progress on the application of SWAT model in irrigation area. J. Irrig. Drain. 2015, 34, 281–284. [Google Scholar] [CrossRef]
  14. Yuan, C.; Feng, S. Simylation of soil water-salt flux of sunflower farmland in Hetao Lrrigation District based on SWAP model. J. Water Resour. Water Eng. 2023, 34, 19–27, 36. [Google Scholar]
  15. Shao, P.; Xiong, Y.; Yuan, N.; Peng, Z.; Li, Y.; Su, P.; Wei, G.; Ye, L.; Lin, X. Hydrological cycle for Paddy-Ponds-Ditches system and reuse of returnflow in Southern hilly irrigated areas. Trans. Chin. Soc. Agric. Eng. 2023, 39, 106–117. [Google Scholar] [CrossRef]
  16. Wang, G.; Shi, H.; Li, X.; Yan, J.; Miao, Q.; Chen, N.; Wang, W. Simulation and evaluation of soil water and salt transport in desert oases of Hetao Irrigation District using HYDRUS-1D model. Trans. Chin. Soc. Agric. Eng. 2021, 37, 87–98. [Google Scholar]
  17. Yu, J.; Wu, Y.; Xu, L.; Peng, J.; Chen, G.; Shen, X.; Lan, R.; Zhao, C.; Zhangzhong, L. Evaluating the Hydrus-1D Model Optimized by Remote Sensing Data for Soil Moisture Simulations in the Maize Root Zone. Remote Sens. 2022, 14, 6079. [Google Scholar] [CrossRef]
  18. Barman, L.; Prasad, R.K.; Sivakumar, B. Streamflow simulation using Soil and Water Assessment Tool (SWAT): Application to Periyar River basin in India. ISH J. Hydraul. Eng. 2023, 29, 332–345. [Google Scholar] [CrossRef]
  19. Li, Y. Study on Maize Yield Estimation Using Remote Sensing Technology Integrated with Coupled WOFOST and HYDRUS Models. Ph.D. Thesis, Lanzhou University, Lanzhou, China, 2012. [Google Scholar]
  20. Hao, Y.; Xu, X.; Ren, D.; Huang, Q.; Huang, G. Distributed modeling of soil water-salt dynamics and crop yields based on HYDRUS-EPIC model in Hetao Irrigation District. Trans. Chin. Soc. Agric. Eng. 2015, 31, 110–116. [Google Scholar]
  21. Wang, P.; Lu, Z.; Huo, Z. Distributed water transformation model based on multi-process coupling in rice irrigation area. J. Hydraul. Eng. 2021, 52, 1163–1173. [Google Scholar] [CrossRef]
  22. Wang, X.; Liu, G.; Yang, J.; Huang, G.; Yao, R. Evaluating the effects of irrigation water salinity on water movement, crop yield and water use efficiency by means of a coupled hydrologic/crop growth model. Agric. Water Manag. 2017, 185, 13–26. [Google Scholar] [CrossRef]
  23. Zhu, Y.; Tang, L.; Liu, L.; Liu, B.; Zhang, X.; Qiu, X.; Tian, Y.; Cao, W. Research progress on the crop growth model crop grow. Sci. Agric. Sin. 2021, 53, 3235–3256. [Google Scholar]
  24. Jones, J.W.; Hoogenboom, G.; Porter, C.H.; Boote, K.J.; Batchelor, W.D.; Hunt, L.A.; Wilkens, P.W.; Singh, U.; Gijsman, A.J.; Ritchie, J.T. The DSSAT cropping system model. Eur. J. Agron. 2003, 18, 235–265. [Google Scholar] [CrossRef]
  25. Wang, P. Research of Optimizing Deficit lrrigation for Sugarcane in Guangxi Province Using the DSSAT Model Based on Genetic Algorithm. Master’s Thesis, Hebei University of Engineering, Handan, China, 2022. [Google Scholar]
  26. Šimůnek, J.; Šejna, M.; Saito, H.; Sakai, M.; Van Genuchten, M.T. The HYDRUS-1D Software Package for Simulating the Movement of Water, Heat, and Multiple Solutes in Variably-Saturated Media; Version 4.08; University of California-Riverside: San Diego, CA, USA, 2009; pp. 1–240. [Google Scholar]
  27. van Genuchten, M.T. A Closed-form Equation for Predicting the Hydraulic Conductivity of Unsaturated Soils1. Soil Sci. Soc. Am. J. 1980, 44, 892–898. [Google Scholar] [CrossRef]
  28. Shelia, V.; Šimůnek, J.; Boote, K.; Hoogenbooom, G. Coupling DSSAT and HYDRUS-1D for simulations of soil water dynamics in the soil-plant-atmosphere system. J. Hydrol. Hydromech. 2018, 66, 232–245. [Google Scholar] [CrossRef]
  29. Ren, D.; Xu, X.; Hao, Y.; Huang, G. Modeling and assessing field irrigation water use in a canal system of Hetao, upper Yellow River basin: Application to maize, sunflower and watermelon. J. Hydrol. 2016, 532, 122–139. [Google Scholar] [CrossRef]
  30. Wang, W. Study on Management Model of Summer Maize Based onDSSAT and Assimilation of Remote Sensing. Master’s Thesis, Zhengzhou University, Zhengzhou, China, 2020. [Google Scholar]
  31. Miao, X.; Wang, G.; Li, R.; Xu, B.; Zheng, H.; Tian, D.; Wang, J.; Ren, J.; Li, Z.; Zhou, J. Study on Modeling and Evaluating Alfalfa Yield and Optimal Water Use Efficiency in the Agro-Pastoral Ecotone of Northern China. Plants 2024, 13, 229. [Google Scholar] [CrossRef] [PubMed]
  32. Ahirwar, S.; Subbaiah, R.; Gupta, P.; Tiwari, M.K.; Trivedi, M.M.; Vaishnav, P. Simulation of Maize Phenology and Grain Yield Using DSSAT Model. Int. J. Environ. Clim. Change 2023, 13, 2545–2556. [Google Scholar] [CrossRef]
  33. Li, L. Estimation of Root Zone Soil Moisture of Maize by Assimilating Remote Sensing Data. Ph.D. Thesis, University of Chinese Academy of Sciences, Beijing, China, 2022. [Google Scholar]
  34. Cheng, L.; Wu, B.; Jia, X.; Yin, J.; Fei, B.; Zhang, L.; Yue, Y.; Sun, Y.; Li, J. Dynamic change of soil moisture and its response to rainfall during the growing season in Mu Us SandyLand based on continyous observation data. Arid Land Geogr. 2024, 1–16. [Google Scholar]
  35. Liu, Q. Evaluation of the Impact of Spatial and Temporal Evolution of Drought on Maize Growth and Yield. Master’s Thesis, Northwest A&F University, Xianyang, China, 2022. [Google Scholar]
  36. Li, D. Study on the Restricting Factors and Promoting Ways of Irrigation Water Productivity in Heihe Oasis Based on Soil and Agronomic Measures. Ph.D. Thesis, China Agricultural University, Beijing, China, 2019. [Google Scholar]
  37. Wang, Y. Effects of Irrigation and Nitrogen Application on Winter Wheat-Summer Maize Yield and Water and Nitrogen Use Efficiency in North China. Master’s Thesis, Beijing Forestry University, Beijing, China, 2021. [Google Scholar]
  38. Feng, G.; Zhu, C.; Wu, Q.; Wang, C.; Zhang, Z.; Mwiya, R.M.; Zhang, L. Evaluating the impacts of saline water irrigation on soil water-salt and summer maize yield in subsurface drainage condition using coupled HYDRUS and EPIC model. Agric. Water Manag. 2021, 258, 107175. [Google Scholar] [CrossRef]
  39. Zhang, Y.-L.; Wang, F.-X.; Shock, C.C.; Yang, K.-J.; Kang, S.-Z.; Qin, J.-T.; Li, S.-E. Effects of plastic mulch on the radiative and thermal conditions and potato growth under drip irrigation in arid Northwest China. Soil Till. Res. 2017, 172, 1–11. [Google Scholar] [CrossRef]
  40. Fu, Y.; Li, Y.; Yu, H.; Wu, J.; Zhang, X. Effects of ridging and plastic film mulching on the water balance of summer maize during its growth period. Trans. Chin. Soc. Agric. Eng. 2023, 39, 76–87. [Google Scholar]
  41. Ren, D.; Xu, X.; Huang, G. Irrigation water use in typical irrigation and drainage system of Hetao Irrigation District. Trans. Chin. Soc. Agric. Eng. 2019, 35, 98–105. [Google Scholar]
  42. Chen, J. Simulation study of farmland water balance in arid area based on SHAW model. Water Resour. Plan. Design 2018, 81–84, 104. [Google Scholar] [CrossRef]
  43. Zhao, L.; Zhao, W. Water balance and migration for maize in an oasis farmland of northwest China. Chin. Sci. Bull. 2014, 59, 4829–4837. [Google Scholar] [CrossRef]
  44. Yang, D. Effects of Tillage Methods on Maize Growth and Soil Water Transport in the Field and Its Simulation. Master’s Thesis, Shenyang Agricultural University, Shenyang, China, 2022. [Google Scholar]
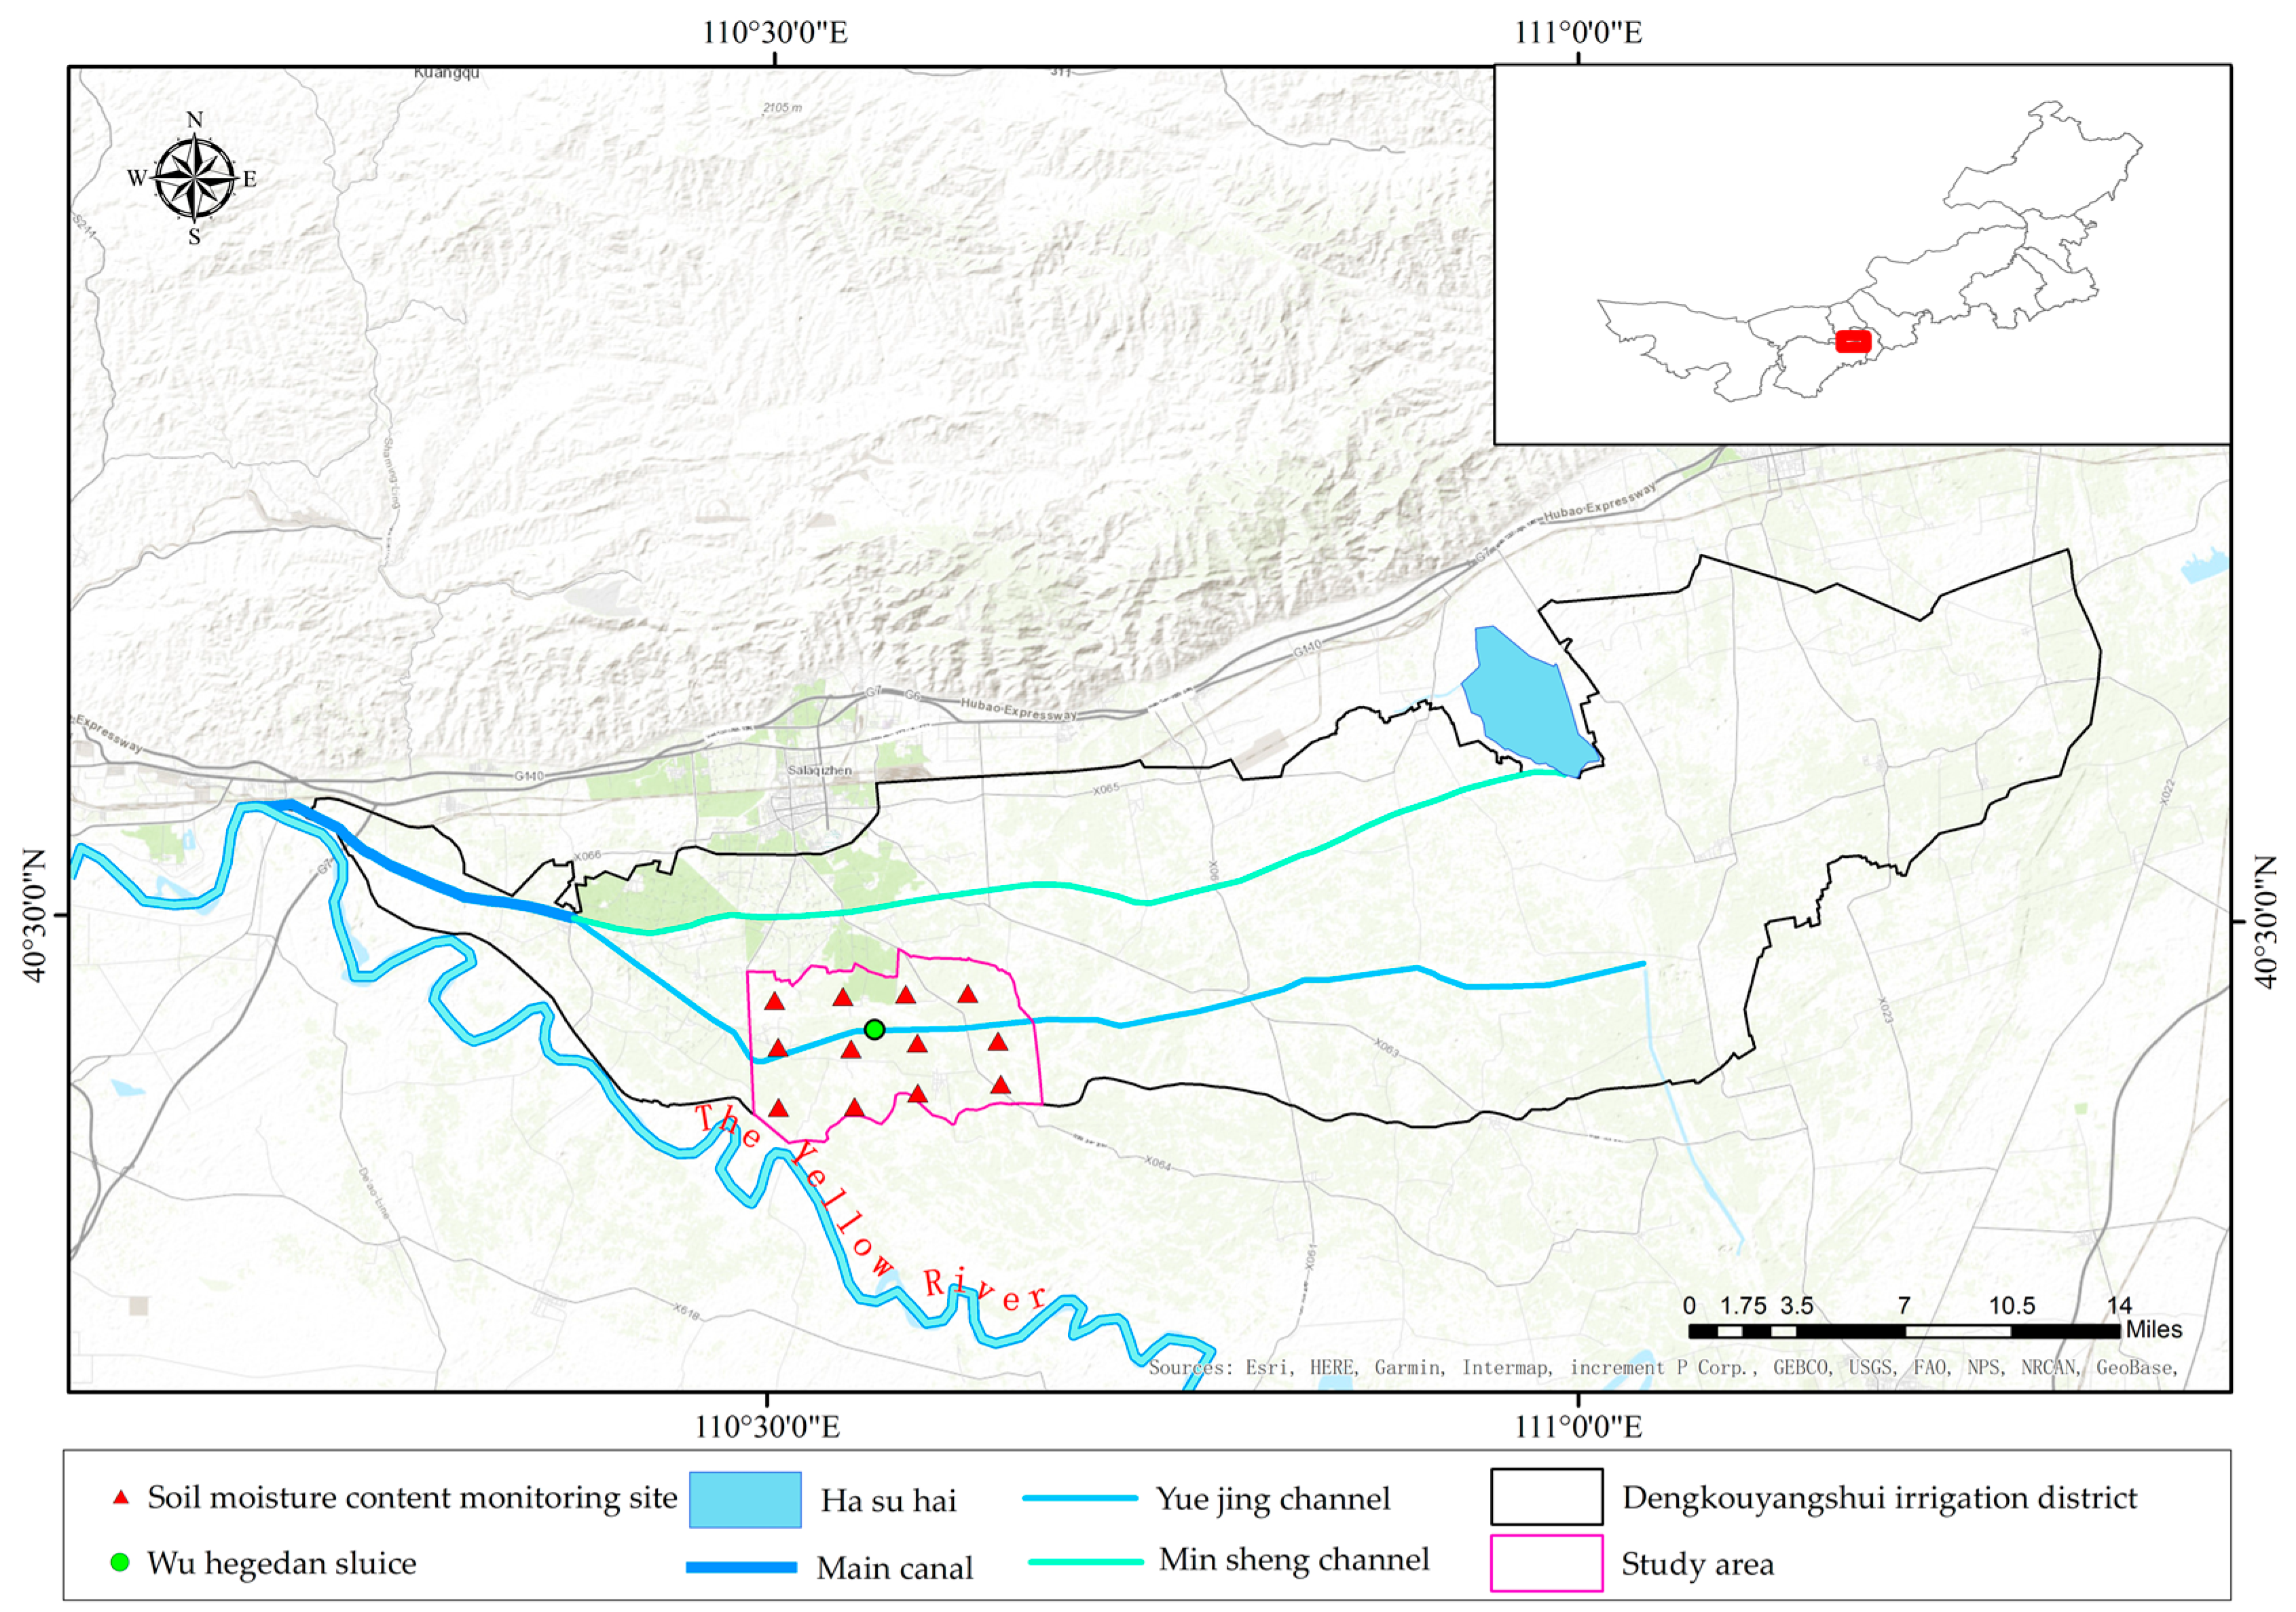
Figure 1. Overview of the study area and soil moisture content monitoring points.
Water 16 01049 g001
Figure 2. Schematic diagram of farmland water circulation.
Water 16 01049 g002
Figure 3. The mean temperature and precipitation during the growth period in 2022 and 2023.
Water 16 01049 g003
Figure 4. Groundwater level changes in 2022 and 2023.
Water 16 01049 g004
Figure 5. Flowchart of the coupled DSSAT and HYDRUS-1D model.
Water 16 01049 g005
Figure 6. Schematic diagram of the HYDRUS-1D model construction.
Water 16 01049 g006
Figure 7. The validation plot of the soil moisture content, LAI, and yield in 2023.
Water 16 01049 g007
Figure 8. Comparison of the simulated and measured values of soil moisture content at the model calibration test site in 2022 (a) and 2023 (b).
Water 16 01049 g008aWater 16 01049 g008b
Figure 9. Comparison of the simulated and measured leaf area indices and dry matter accumulation in the experimental plots in 2022 and 2023.
Water 16 01049 g009
Figure 10. Water balance maps for 2022 (a) and 2023 (b).
Water 16 01049 g010aWater 16 01049 g010b
Table 1. Soil physical properties and VG parameters.
Soil
Depth/cm
Soil Physical PropertiesVG Parameters
0.02~2
mm
0.002~0.2 mm<0.002 mmSoil Bulk Density/(g·cm−3)Field Capacityqrqsa/(cm−1)n
/%/%/%
0–2056.83024.61518.5551.590.370.06700.38620.03211.4623
20–4062.60522.58014.8151.610.280.05380.39140.04151.4325
40–6067.02021.48511.4951.650.300.04200.38310.03231.4134
60–8058.45022.26019.2901.520.310.05860.38890.02511.3841
80–10055.29524.81019.8951.450.280.04370.38230.02201.4251
Table 2. Corn growth period statistics for 2022 and 2023.
YearCropPlanting TimeGrowing PeriodDays/d
Initial Period/dRapid Growth Period/dMid-Growth Period/dLate Growth Period/d
2022Maize29 April32673520154
2023Maize1 May30673518150
Table 3. The soil water characteristic parameters were determined.
Land TypesSoil Layer/cmθrθsαnKs/(cm·d−1)l
Maize0~200.06700.38620.02641.378236.820.5
20~400.05380.39140.02321.42658.350.5
40~600.04200.38310.03231.413443.620.5
60~800.05860.38890.02371.365238.720.5
80~1000.04370.38230.02081.415660.250.5
Table 4. The parameter of root uptake was calibrated.
FunctionFunction/cmDescriptionCalibration Values/cm
Water stress functionh1No water extraction at higher pressure heads−12
h2h below which optimal water starts−35
h3hh below which water uptake reduction starts at high atmospheric demand−325
h3lh below which water uptake reduction starts at low atmospheric demand−600
h4h below which water uptake is zero−8000
r2HThreshold level of high atmospheric demand/(cmd−1)0.5
r2LThreshold level of low atmospheric demand/(cmd−1)0.1
Table 5. Model simulation accuracy index evaluation.
Statistical IndexRMSER2bMRE/%
Model calibration (2022)Soil moisture content (cm3/cm3)0.020.901.025.77
LAI0.160.920.988.28
Yield (kg/hm2)1.300.840.932.34
Model validation (2023)Soil moisture content (cm3/cm3)0.040.890.926.03
LAI0.200.911.126.57
Yield (kg/hm2)1.240.880.901.58
Table 6. Genetic parameters of maize.
ParameterP1P2P5G2G3PHINT
Range100~4000~4600~1000500~10005~1230~75
Optimal value385.40.496814.5985.011.575.0
P1: Days from emergence to the end of the juvenile phase (°C d); P2: photoperiod sensitivity coefficient; P5: days from silking to phenological maturity (°C d); G2: potential kernel number; G3: potential kernel growth rate (mg/(grain·d)); PHINT: days required for a leaf tip to emerge (°C d).
Disclaimer/Publisher’s Note: The statements, opinions and data contained in all publications are solely those of the individual author(s) and contributor(s) and not of MDPI and/or the editor(s). MDPI and/or the editor(s) disclaim responsibility for any injury to people or property resulting from any ideas, methods, instructions or products referred to in the content.