Article

Ecological Well-Being Model for Water-Saving Planning in Irrigation Areas of Arid Northwest China

1
Yellow River Conservancy Technical Institute, Kaifeng 475000, China
2
Henan Engineering Research Center of Project Operation and Ecological Security for Inter-Basin Regional Water Diversion Project, Kaifeng 475004, China
3
School of Electrical Engineering, North China University of Water Resources and Electric Power, Zhengzhou 450011, China
*
Author to whom correspondence should be addressed.
Water 2025, 17(8), 1193; https://doi.org/10.3390/w17081193
Submission received: 12 March 2025 / Revised: 6 April 2025 / Accepted: 10 April 2025 / Published: 16 April 2025

Abstract

:
Agriculture consumes a large amount of water. Water-saving initiatives can alter the water cycles in irrigation areas, thereby influencing the ecological and environmental processes associated with water circulation. The greater the intensity, scale, and extent of these efforts, the more significant their impact on ecological and environmental systems. Therefore, it is essential for water-saving initiatives to ensure regional ecological well-being. This paper examines the balance between water saving and ecological well-being in northwest China, which is characterized by severe water scarcity, fragile ecological environments, significant water waste in agriculture and ecological usage, and substantial potential for water savings. By integrating deep water-saving controls with ecological protection, this paper proposes an ecological development model for implementing deep water-saving strategies in irrigation areas. This approach is crucial for mitigating water scarcity in the arid regions of northwest China. The Hetao Irrigation District is used as a case study to calculate the maximum water-saving potential while considering ecological conservation.

1. Introduction

In the context of increasing water scarcity, water saving has become an inevitable trend, and identifying suitable water-saving models is a top priority for ensuring the sustainable development of irrigation areas. The arid northwest region of China (including six provinces and autonomous regions: Shaanxi, Gansu, Qinghai, Ningxia, Xinjiang, and Shanxi, as well as the central and western parts of Inner Mongolia) is located in the middle and upper reaches of the Yellow River and the northwestern inland river basins, where cultivated land irrigation is mainly concentrated in large and medium-sized irrigation districts. Due to low natural precipitation, long-term water diversion for irrigation has created a unique ecological pattern adapted to the region’s water diversion and drainage conditions. Water diversion has become a critical lifeline for sustaining the healthy development of the regional oasis economy–society–ecological system, with reasonable groundwater levels serving as an essential guarantee for maintaining the stability of the irrigation areas and surrounding oases. However, large-scale water-saving measures alter the water cycle processes and groundwater recharge patterns in irrigation areas, potentially impacting the vegetation, lake, and wetland ecosystems in these regions. Therefore, when formulating water-saving measures for large-scale irrigation districts in the arid northwest, it is crucial to fully consider the ecological constraints on the extent of water-saving required to maintain the stability of the irrigation areas and surrounding oases. The goal is to find a balance between water-use efficiency and the ecological impact of water-saving and to identify a deep water-saving ecological development model that supports the sustainable development of irrigation areas.
This paper begins with the concept of ecosystem stability, identifies the key structures of irrigation area ecosystems, and explains the critical roles of vegetation (such as forests and grasslands), farmland, and lakes in maintaining ecosystem stability. It proposes a method for calculating suitable groundwater depths for these ecological components and uses groundwater levels as a comprehensive constraint indicator for ecosystem stability. Furthermore, the study introduces a deep water-saving ecological development model that balances food security and ecological security. Using the Hetao Irrigation District as an example, this paper calculates the maximum water-saving potential of the irrigation area while maintaining ecological stability.

2. Constraints for Maintaining Ecosystem Stability in Irrigation Areas

2.1. Concept of Ecological Stability in Irrigation Areas

The irrigation area ecosystem is a complex ecological system composed of both cultivated crops and naturally growing epiphytic vegetation. The stability of this ecosystem is closely related to the stability of the species within the irrigation area. A stable irrigation area ecosystem typically exhibits a diverse species structure with intricate and interdependent relationships. The various structural components of the ecosystem can remain active over the long term and maintain their autonomy, possessing the capacity for self-repair in the face of external environmental disturbances. Maintaining ecosystem stability requires ensuring the stability of the internal species, reducing the threat from invasive species or external factors, and maintaining a balanced state of species diversity and population within the system. This represents the ideal state of stability for the irrigation area ecosystem [1,2,3].

2.2. Mechanism of Groundwater Level Constraints on the Stability of Irrigation Area Ecosystems

The large-scale irrigation districts in the arid northwest of China have developed a unique yet fragile oasis-type irrigation ecosystem over millennia. The basic units of this ecosystem include mountains, water, forests, fields, lakes, and grasslands, collectively forming a cohesive system [4]. Mountains serve as the origin of water, where groundwater, under significant pressure, moves vertically to the ground surface as mountain springs; mountains also function as primary water convergence areas. Forests and grasslands act as water conservation zones, modifying the surface runoff process in the water cycle. During wet periods, they enhance infiltration, replenishing soil and groundwater, while in dry periods, their root systems absorb groundwater, releasing it into the atmosphere and thus helping to regulate water movement. Farmland represents the primary water consumption area, where irrigation contributes significantly to both groundwater recharge and atmospheric evaporation. Lakes and wetlands are water storages, accumulating surface water and laterally flowing groundwater.
It is evident that water in irrigation areas plays a crucial role in the health of the ecosystem and the water cycle. The water cycle allows the ecosystem to regulate itself and to recover from small disturbances, serving as a key safeguard for maintaining ecological stability in these areas. The robustness of the water cycle is an essential factor in ensuring ecological stability within the irrigation district [5]. Due to the minimal area of mountainous regions within the irrigation district, this study does not consider the impact of mountains on the ecological stability of the irrigation system. Maintaining the stability of the ecosystem primarily depends on the ecological stability of key structural elements [6] such as forests, farmland, lakes, and grasslands.
The arid region of northwest China experiences low annual precipitation and extremely uneven water resource distribution. The dual natural–anthropogenic water cycle serves as a critical function for key ecosystem elements in irrigation districts, including forests, farmland, lakes, and grasslands, as shown in Figure 1. Groundwater levels are a significant factor influencing the ecological stability of these elements. Forests and grasslands in irrigation areas receive limited irrigation water, relying on root systems to absorb groundwater to meet growth requirements. Groundwater thus sustains the ecological stability of forests and grasslands. Farmland, being the primary area transformed by human activities, also serves as a major zone for water diversion and surface water infiltration. Water leakage from canals and infiltration of surface irrigation water recharge groundwater, which then moves into the soil under capillary action. Crops absorb this soil moisture through their root systems to support growth. Additionally, soil salinity poses a stress on farmland and affects agricultural productivity. Maintaining an appropriate groundwater level is essential to prevent soil salinization, thereby ensuring sustainable soil and agricultural productivity in irrigation districts.
Lakes are hydraulically connected with the groundwater system, with lake water volume and surface area constrained by groundwater depth. Human activity has altered the ground surface and water supply in the irrigation district’s water cycle, with these dual natural–human processes jointly governing groundwater stability and ecological balance of forests, fields, lakes, and grasslands.
However, substantial groundwater extraction or reduced recharge can cause a significant drop in groundwater levels, leading to river and lake depletion, vegetation degradation, desertification, and the drying of wetlands [7,8,9,10,11]. Conversely, excessive groundwater recharge can lead to secondary swamp formation, soil salinization, and increased groundwater salinity. Groundwater also influences the local climate in irrigation districts. Low groundwater levels reduce evaporation to the atmosphere, leading to decreased atmospheric moisture and affecting rainfall and other meteorological factors. The main sources of groundwater recharge are seepage from diversion and drainage channels and field irrigation. Reductions in these recharge sources can lower groundwater levels, disrupting the ecological stability. Therefore, maintaining an optimal groundwater level is essential to improve water resource efficiency while preserving the ecosystem stability of the irrigation district.

2.3. Calculation Method for the Optimal Groundwater Depth

This study examines the interplay between the groundwater depths and key elements of the irrigation district ecosystem (such as vegetation, farmland, and lakes) and identifies the optimal groundwater depth for maintaining ecosystem stability under the multifunctional constraints of the irrigation district.

2.3.1. Optimal Groundwater Depth for Ecosystem Stability

Vegetation, such as forests and grasses within irrigation areas, is largely dependent on irrigation, with groundwater absorbed by root systems serving as an essential or even sole water source for the survival of vegetation. The spatial distribution of groundwater levels and shallow groundwater directly affects plant growth and the spatial structure of vegetation communities [12]. Fluctuations in groundwater levels directly control the effectiveness of water absorption by vegetation; when groundwater depth is too great, the number of plant species capable of absorbing groundwater decreases, resulting in a reduced variety of vegetation and the destabilization of the ecosystem. Conversely, if groundwater depth is too shallow, it can alter soil structure, thereby disrupting plant growth conditions and causing ecosystem instability.
Based on these principles, an optimal groundwater depth is most conducive to ecological stability, where plant species richness reaches its maximum. When the groundwater depth falls below or exceeds this optimal value, plant species diversity declines, and vegetation growth is inhibited. The relationship between plant species richness and groundwater depth, based on analysis using the Gaussian model, is as follows [13]:
f x = 1 2 π x e 1 2 ( x μ σ ) ,
where x represents the groundwater depth, f x denotes the biomass that reflects the state of plant growth, primarily referring to vegetation abundance and coverage, μ represents the optimal groundwater depth for peak species abundance, and σ quantifies the tolerance range around this optimum, with smaller values indicating narrower ecological adaptability.
In plant communities, dominant species are typically those with high individual numbers, extensive canopy cover, substantial biomass, larger size, and strong vitality. These species exert a significant influence on the structure and environmental formation of the community, while they are the least affected by external factors. Thus, to a certain extent, the optimal ecological water level of dominant species can represent the suitable ecological water level for the vegetation community in the irrigation district [14,15]. In this study, the calculation of dominance follows the formula proposed by Makoto Sadakata [16].
D o m i n a n c e = R e l a t i v e   a b u n d a n c e + R e l a t i v e   c o v e r a g e + R e l a t i v e   h e i g h t + R e l a t i v e   f r e q u e n c y × 1 400 ,
R e l a t i v e   a b u n d a n c e = A b u n d a n c e   o f   a   s p e c i f i c   p o p u l a t i o n S u m   o f   a b u n d a n c e s   o f   a l l   p o p u l a t i o n s × 100 ,
R e l a t i v e   c o v e r a g e = C o v e r a g e   o f   a   s p e c i f i c   p o p u l a t i o n   S u m   o f   c o v e r a g e s   o f   a l l   p o p u l a t i o n s   × 100 ,
R e l a t i v e   h e i g h t = A v e r a g e   h e i g h t   o f   a s p e c i f i c   p o p u l a t i o n S u m   o f   a v e r a g e   h e i g h t s   o f   a l l   p o p u l a t i o n s × 100 ,
R e l a t i v e   f r e q u e n c y = F r e q u e n c y   o f   a s p e c i f i c   p o p u l a t i o n S u m   o f   f r e q u e n c i e s   o f   a l l   p o p u l a t i o n s × 100 .

2.3.2. Optimal Groundwater Depth for Farmland

The health of farmland in irrigation areas determines crop yield and quality and impacts the water environment quality within the area. The main threats to farmland health are soil salinization and desertification, which can be effectively controlled by reasonably managing groundwater depth. During the irrigation phase in irrigation areas, soil salts are leached into the groundwater. When groundwater depth is shallow, intense evaporation from the farmland surface causes salts in the groundwater to accumulate and migrate to the upper soil layers. When the groundwater is too close to the topsoil, soil salinization in arable land intensifies. Therefore, it is essential to prevent irrigation-induced rises in groundwater levels during agricultural irrigation [17]. While managing salinity, groundwater must still supply water to crops; thus, the groundwater level should meet salinity control requirements while supporting crop growth to prevent soil desertification. Further research on farmland groundwater depth is necessary to identify the critical level that prevents both salinization and desertification, ensuring safe agricultural production and ecosystem stability in irrigation areas.
During the process of groundwater replenishing soil moisture, capillary action plays a crucial role, causing groundwater to rise from the water table to form a moist layer of a certain thickness. This thickness is determined by the maximum capillary rise height. Scholars such as Wang Yong et al. established the theoretical formula for calculating capillary rise height [18]. The formula for calculating capillary water rise is as follows:
H = 2 σ ρ w g R ,
where H represents the maximum capillary rise height, m ; σ is the surface tension of the liquid, N / m ; ρ w denotes the density of water, k g / m 3 ; g is the gravitational acceleration, m / s 2 ; and R is the equivalent capillary diameter (effective pore diameter).
The calculation formulas for the equivalent capillary diameter R and surface tension σ of the liquid are as follows:
R = 1.6 n 39.5 % + 0.0774 · d ,
σ = σ ( T ) ,
where n represents soil porosity, d denotes the effective particle size of the soil ( m m ) , T indicates the soil water temperature (°C).
  • Critical Groundwater Depth for Field Crops
In irrigation areas, under fixed soil conditions, the water supply for field crops mainly comes from phreatic water. Due to soil capillary action, a moist layer forms. When the crop roots come into contact with this moist layer influenced by phreatic water, it supplies the water needed for the crops. Thus, the formula for calculating the critical groundwater depth that affects field crops is as follows:
h i = 2 σ ( T ¯ ) ρ w g 1.6 n 39.5 % + 0.0774 · d + D i ,
where h i represents the critical groundwater depth for the i crop m , D i denotes the root depth for normal growth of the i crop ( m ).
  • Critical Groundwater Depth for Farmland Salinization in Irrigation Areas
The primary cause of farmland salinization in irrigation areas is a shallow groundwater depth. The evaporation of groundwater transports salts to the surface, and the moisture layer influenced by groundwater, under the effect of capillary action, serves as the main source of surface water evaporation. Therefore, the moisture layer influenced by groundwater is directly defined as the critical groundwater depth for farmland salinization in irrigation areas. The calculation formula is as follows:
h 0 = 2 σ ( T m i n ) ρ w g 1.6 n 39.5 % + 0.0774 · d ,
where h 0 represents the critical groundwater depth for farmland salinization (m), and T m i n denotes the minimum temperature of soil water, measured in degrees Celsius (°C).

2.3.3. Optimal Groundwater Depth for Lakes

Groundwater plays a crucial role in the hydrological balance of lakes. To avoid competition for water between ecological and agricultural uses during the irrigation period, water replenishment for lakes in irrigation areas is conducted during fallow periods. During the crop growth period, groundwater in the irrigation area is replenished, while lake replenishment is minimal. At this time, groundwater supplies water to the lakes, supporting the significant evaporation losses from the lakes. Additionally, the presence of lake groups can influence the groundwater circulation patterns in the irrigation area, reducing the fluctuations in regional groundwater levels. There exists a complex exchange relationship between groundwater depth and lake water volume [19]. By reviewing literature, the interaction mechanisms between lakes and groundwater can be identified, providing valuable insights for the study of lake water balance and the hydrological processes in irrigation areas.

3. Water-Saving Models for Irrigation Areas with Stable Ecosystems

Water-saving measures in irrigation areas include engineering practices such as canal lining, land leveling, and micro-irrigation techniques, as well as non-engineering measures like adjusting planting structures and optimizing irrigation quotas [20,21,22,23,24]. After the implementation of these water-saving measures, the total amount of irrigation water decreases, resulting in reduced irrigation water replenishment in the fields. This leads to a decrease in the surface infiltration that replenishes groundwater, subsequently causing changes in groundwater levels. When the groundwater level drops to a certain threshold, the stability of the irrigation area’s ecosystem may be jeopardized. Therefore, it is essential to understand the variations in groundwater levels under different water-saving measures and to identify the water-saving measure that maximizes water-saving potential while keeping the groundwater depth within an appropriate range. A deep water-saving model helps sustain the ecological stability of irrigation areas.

3.1. Analysis of Water-Saving Measures

3.1.1. Canal Water-Saving Measures

Canal lining is a primary water-saving measure in irrigation areas. By lining the canals to prevent seepage, this practice can reduce the resistance in riverbeds and accelerate the rate of water movement within the canal system, thereby decreasing leakage and enhancing the efficiency of water utilization in the irrigation area. The canal water-saving measures are critical factors in regulating groundwater replenishment. It is essential to select an appropriate lining ratio for the canal system that optimizes water savings while maintaining the groundwater depth necessary for ecological stability in the irrigation area. The calculation formula for the water-saving volume of the canal water-saving scheme is as follows:
Q = Q d ( η 0 η 1 )
where Q represents the water-saving volume (m3) achieved after increasing the canal system’s water utilization coefficient, Q d denotes the total water diversion from the canal system (m3), and η 0 and η 1 are the current and improved values of the water utilization coefficient for the irrigation area’s canal system, respectively.

3.1.2. Field Water-Saving Measures

Field water-saving projects include techniques such as bed transformation, spray irrigation, and plastic film irrigation. Micro-spray irrigation technology is relatively outdated and has high investment costs; it is primarily used in the cultivation areas of cash crops like vegetables, contributing minimally to the overall water-saving potential of the irrigation area. Plastic film coverage is currently the most widely adopted water-saving measure in irrigation districts. Bed transformation is a method aimed at leveling arable land and enhancing the efficiency of water resource utilization in the fields. After the transformation of the beds, the arable land avoids the accumulation of water in pits and depressions, allowing water resources to percolate evenly into the soil, thus achieving water-saving objectives. The calculation formula for the water-saving volume of field water-saving measures is as follows:
W = A I 0 I 1 ,
where W represents the water-saving volume (m3) achieved by implementing the field water-saving measures, A denotes the irrigated area (mu) (1 mu ≈ 0.0667 hectares), and I 0 and I 1 refer to the per mu irrigation quotas (m3/mu) before and after the implementation of the field water-saving measures in the irrigation district, respectively.

3.1.3. Optimization of Irrigation Regimes for Water Savings

Optimizing irrigation regimes is also an important measure in the water-saving efforts of irrigation districts. The irrigation process is not merely about increasing or decreasing the amount of irrigation water supplied for crop absorption; rather, it involves formulating appropriate irrigation quotas to maximize the yield of field crops [20,21]. The optimization of irrigation quotas primarily focuses on adjusting the amount of water applied during the crop growth period, which can be implemented through changes in irrigation frequency and other methods. In irrigation districts, autumn irrigation is necessary for salinity leaching requirements; thus, optimizing the autumn irrigation quota represents another critical water-saving strategy in the fields. The calculation formula for water savings through optimized irrigation quotas is as follows:
G = B ( l 0 l 1 )
where G denotes the water savings achieved by implementing the field water-saving scheme (m3), B represents the irrigated area (mu), and l 0 and l 1 are the average irrigation quotas per mu (m3/mu) before and after the implementation of the field water-saving scheme in the irrigation area, respectively.

3.2. Construction of a Water-Saving Model with Groundwater Control

Based on the current situation and the effectiveness of water-saving practices in irrigation areas, various measures can be implemented, including canal lining, border field reconstruction, plastic film mulching, and the optimization of irrigation quotas [22,23,24,25,26,27]. These outcomes characterize the effects observed following the implementation of water-saving strategies. By integrating relevant experimental studies, we can analyze the impact of these water-saving measures.
Under the influence of water-saving measures, the original water cycle pattern of the irrigation area is disrupted, resulting in corresponding changes in both surface water and groundwater. By integrating the calculation of water-saving potential with the water cycle dynamics of the irrigation area, this study examines changes in surface water and groundwater under different water-saving scenarios. The goal is to identify the maximum water-saving potential that maintains the stability of the irrigation area’s ecosystem while controlling groundwater levels, as shown in Figure 2. The water-saving volume for the irrigation area is calculated under various scenarios, and the variations in groundwater levels are analyzed based on different surface water recharge patterns following the implementation of water-saving measures. The Watershed Distributed Water Cycle Model (WACM) [28], developed by the Water Resources and Hydropower Scientific Research Institute of China, is utilized to simulate groundwater changes under these water-saving measures. Groundwater levels after implementing various water-saving schemes are calculated and compared to the levels necessary for maintaining ecosystem stability. This analysis helps determine the most appropriate water-saving model that supports the ecological stability of the irrigation area and guides the implementation of relevant water-saving measures.

4. Water-Saving Potential—A Case Study of the Hetao Irrigation District

The Hetao Irrigation District spans 769,000 hectares (as shown in Figure 3), receiving minimal rainfall—averaging less than 160 mm annually—while facing high evaporation rates, with a long-term average of 2278 mm per year. The Hetao Irrigation District exhibits a typical artificial “diversion-storage-consumption-drainage” regulated water cycle, where hydrological processes are jointly constrained by the seasonal distribution of Yellow River runoff (60% occurring during summer floods) and the internal “dry drainage” system. A close hydraulic connection exists between shallow groundwater and surface water, with groundwater flow direction controlled by the layout of irrigation canals, generally showing a southwest-to-northeast movement trend. Significant vertical heterogeneity in soil texture (predominantly silty loam in the top 1m layer, with clay lenses in deeper layers) results in spatial variability in capillary rise heights. Historical irrigation practices (e.g., the intensive diversion-irrigation model of the 1970s) have left behind secondary salinization issues, necessitating that modern water-saving measures balance both salt leaching requirements and ecological water level maintenance. This unique hydrological regime makes the Hetao region a classic example for studying water-ecological balance in artificial oases.
The Yellow River irrigation area is mainly sandwiched by the main drainage canal to the south and the main canal to the north. The combined Yellow River irrigation area is primarily found on both sides of the main drainage canal, at the tail ends of the Yellow River irrigation areas, and in the Ulan Buh Desert region. The well irrigation areas are mainly north of the main drainage canal, south of the Yin Mountains, and in the Ulan Buh Desert. Through the renovation of irrigation infrastructure and improved water management, the basic conditions of the Hetao Irrigation District have significantly improved, and farmland irrigation efficiency has gradually increased. However, there remains a significant efficiency gap when compared to other regions. In 2021, the effective utilization coefficients for farmland irrigation water in China, Bayannur, and Hetao Irrigation District were 0.568, 0.4715, and 0.4491, respectively, and in 2022, they were 0.565, 0.467, and 0.4467. It should be noted that extreme drought events have occurred in the region since 2022 (e.g., precipitation in 2023 was only 112 mm), which may impact the long-term adaptability of water-saving measures. Although this study partially addresses this limitation through climate normalization (see Section 2.2), future research should incorporate more recent extreme climate data. Currently, the Hetao Irrigation District faces an urgent need to explore deeper water-saving and control practices. This paper examines the water-saving model of the Hetao Irrigation District from the perspectives of ecological constraints and water-saving pathways, calculating the water-saving potential that maintains ecosystem stability.

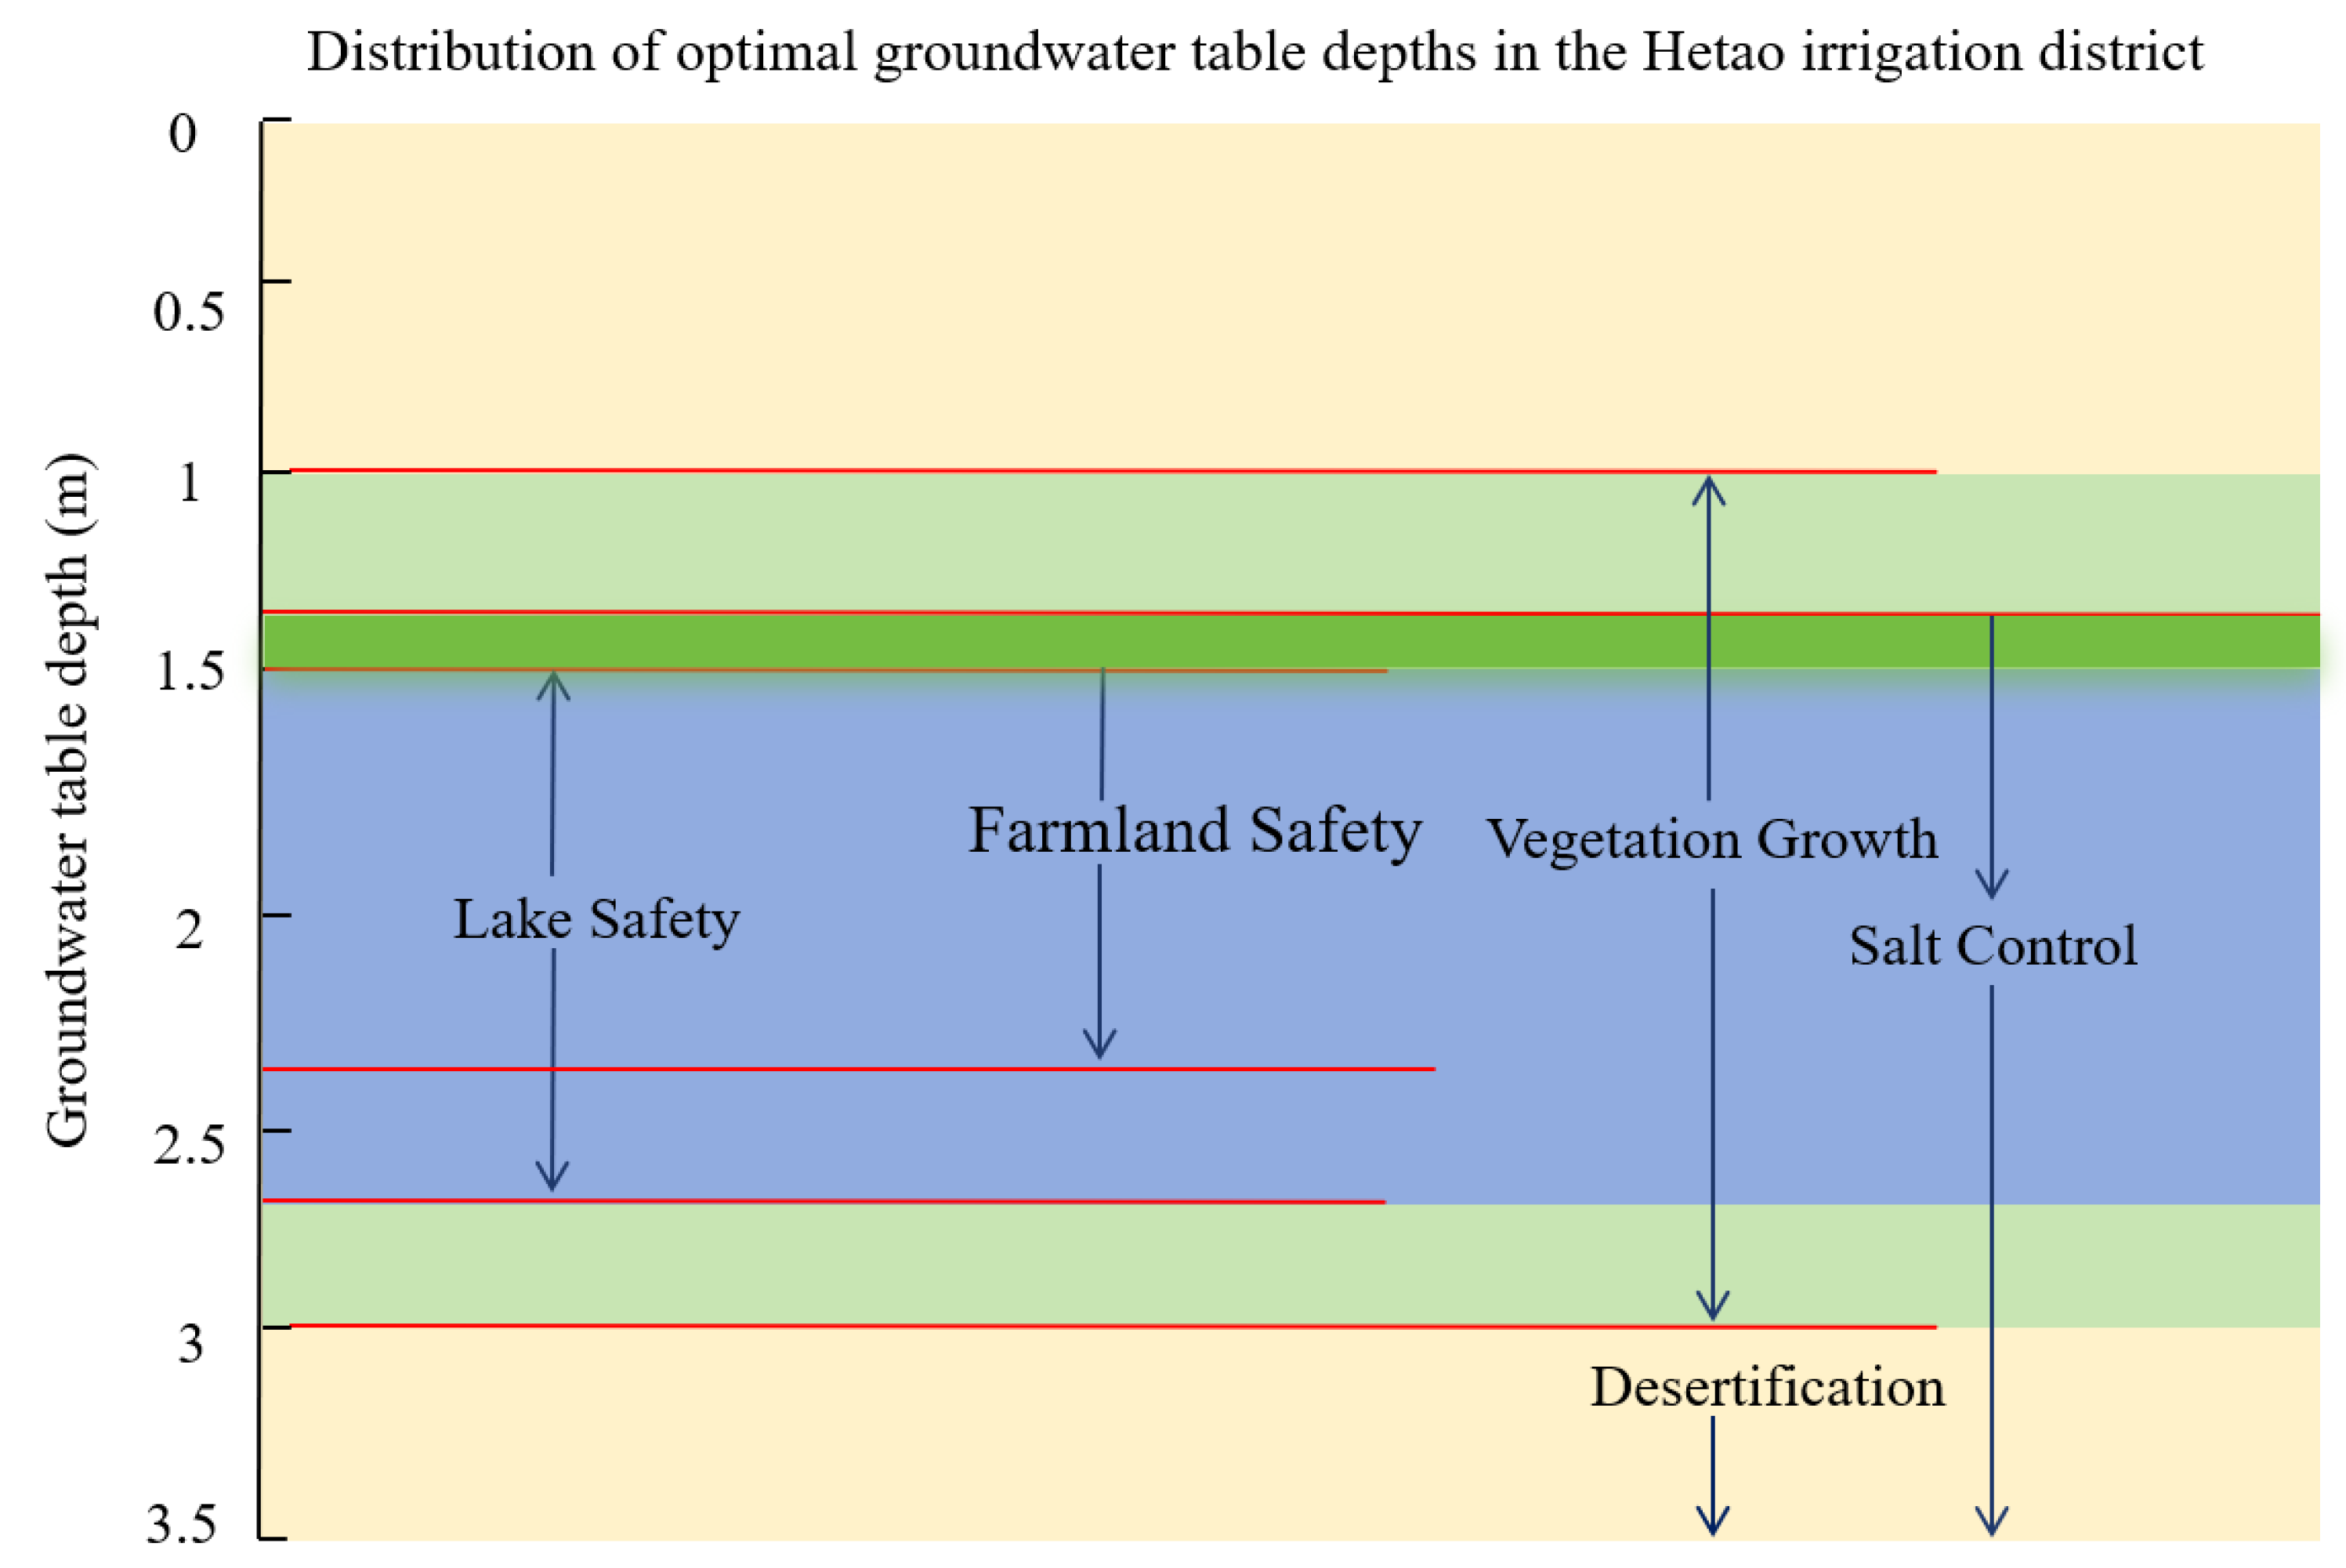
4.1. Ecological Constraints

The Hetao Irrigation District has developed a fragile oasis-type ecosystem over centuries. Due to low local precipitation and strong evaporation, the vegetation and wetlands outside the farmland rely entirely on return flows from agricultural irrigation. Therefore, to protect the health and stability of the regional ecosystem, water-saving measures must consider the water requirements for maintaining the vegetation and wetland ecosystems.

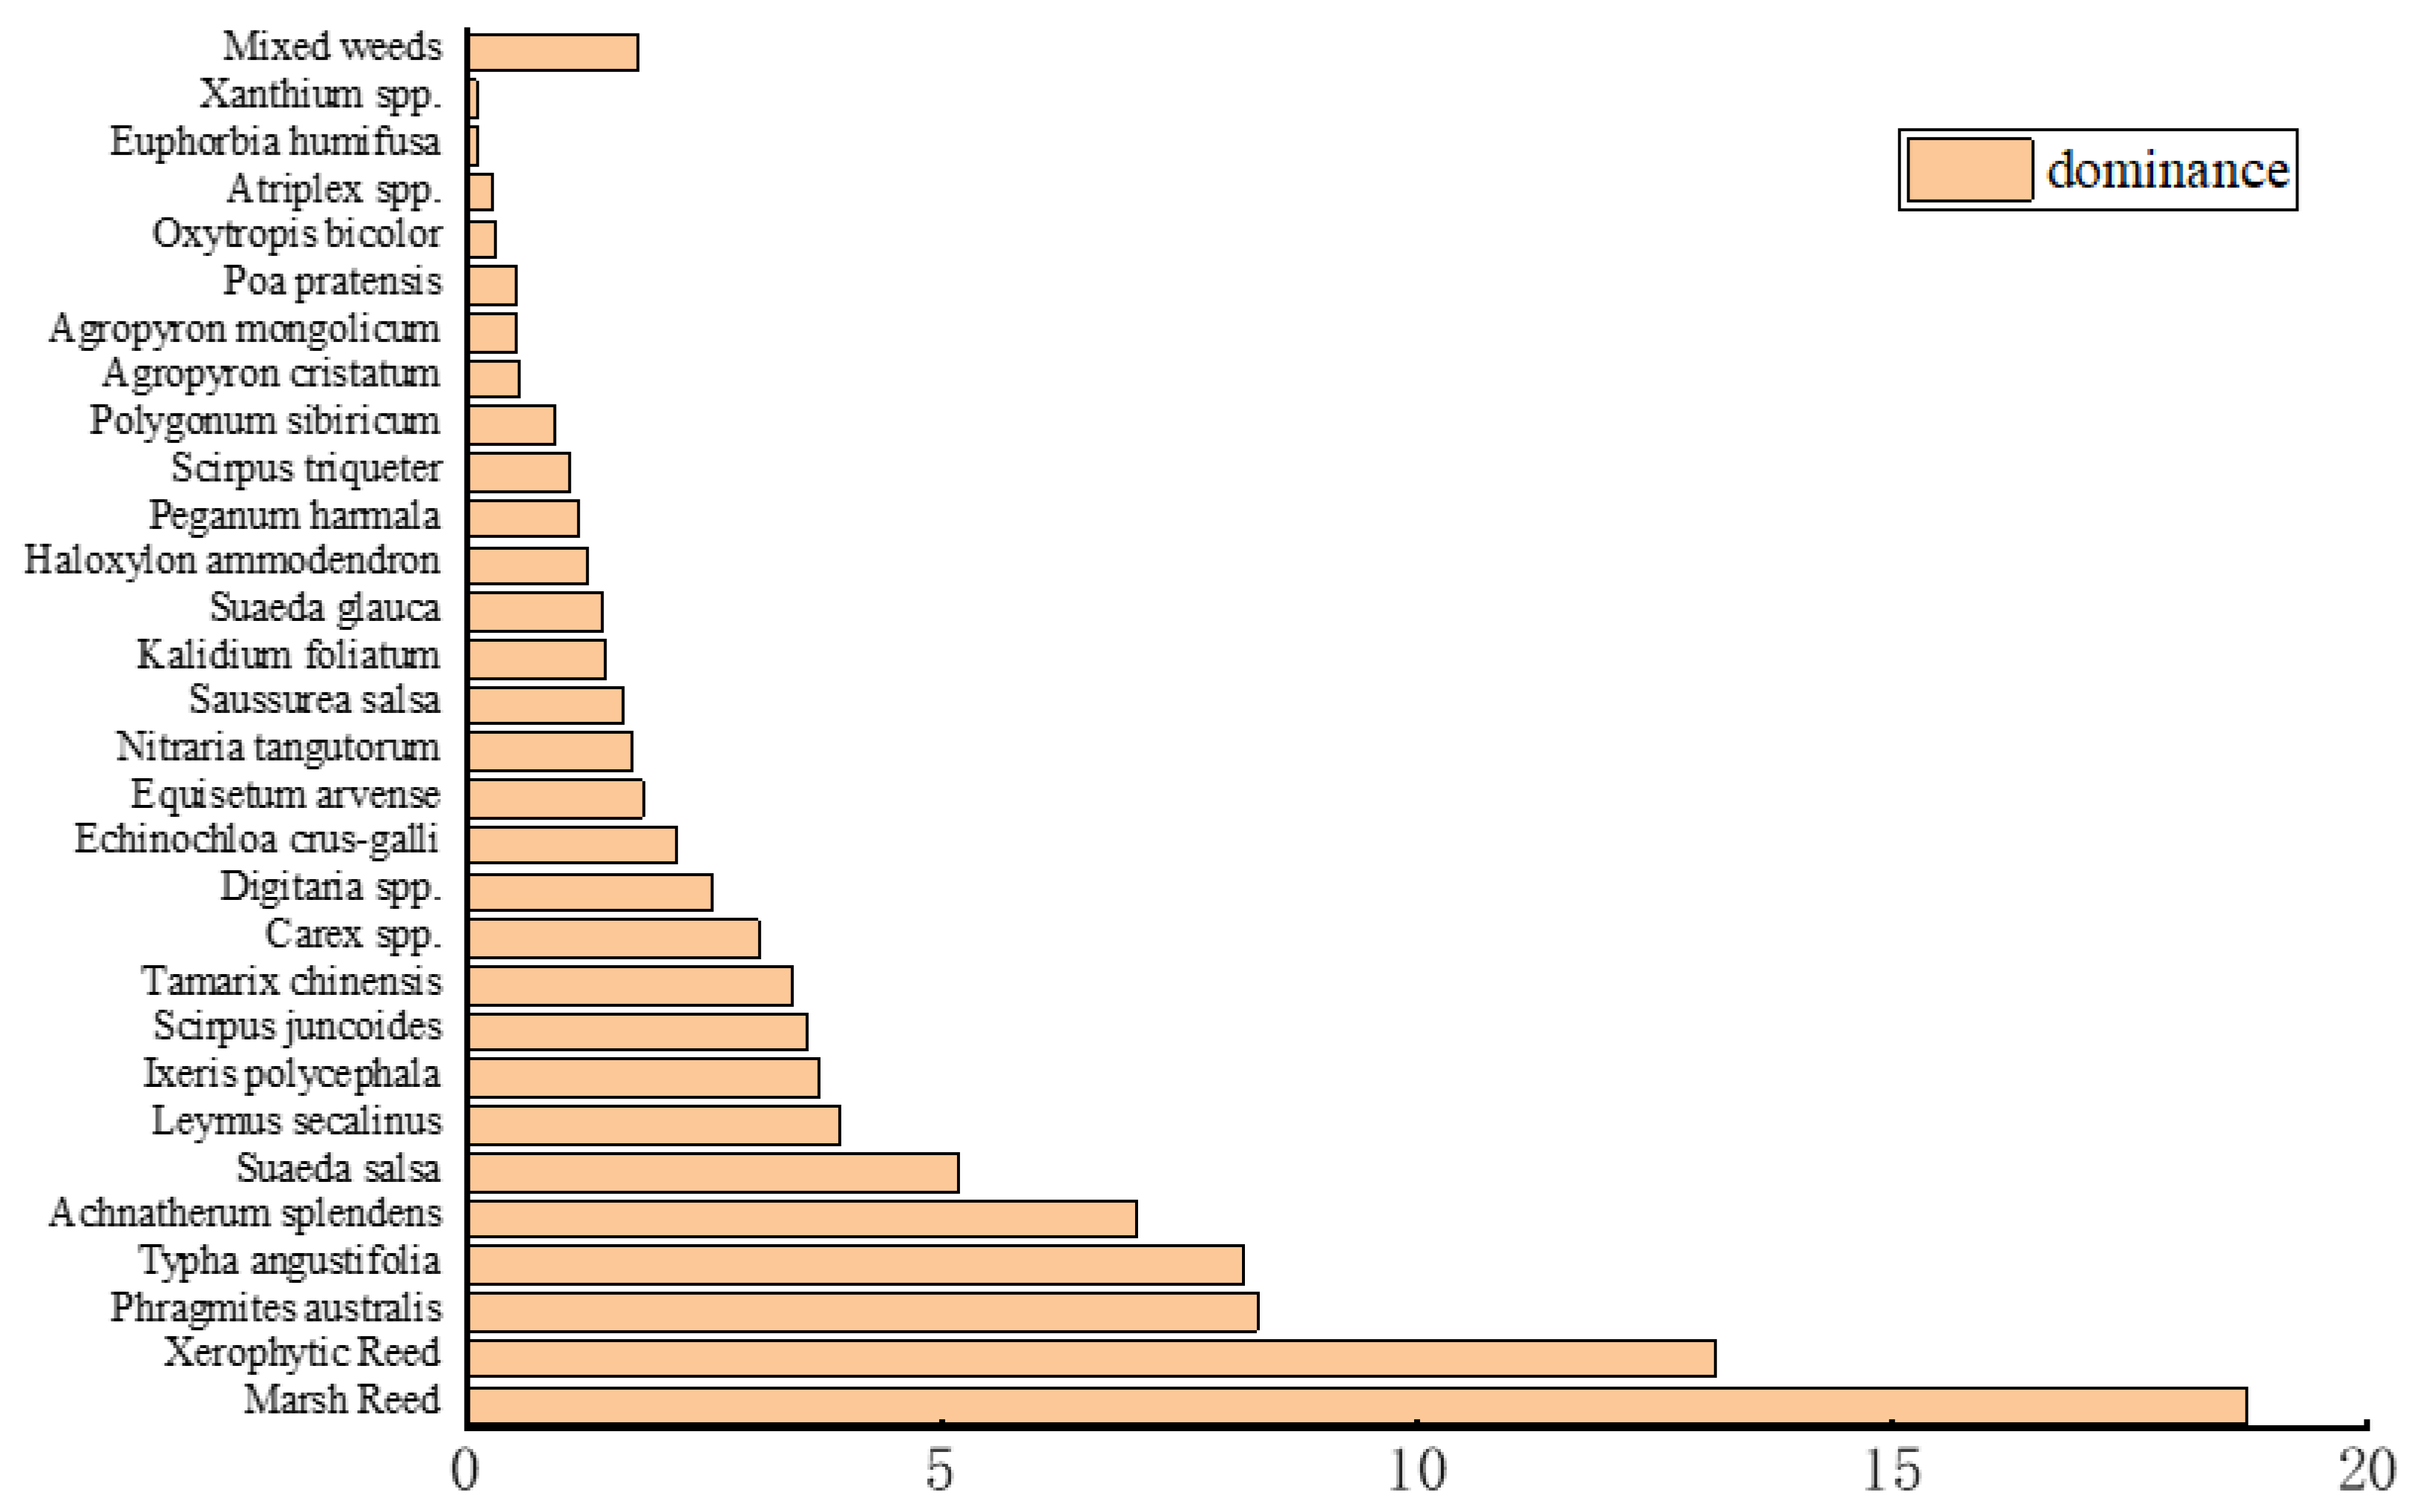
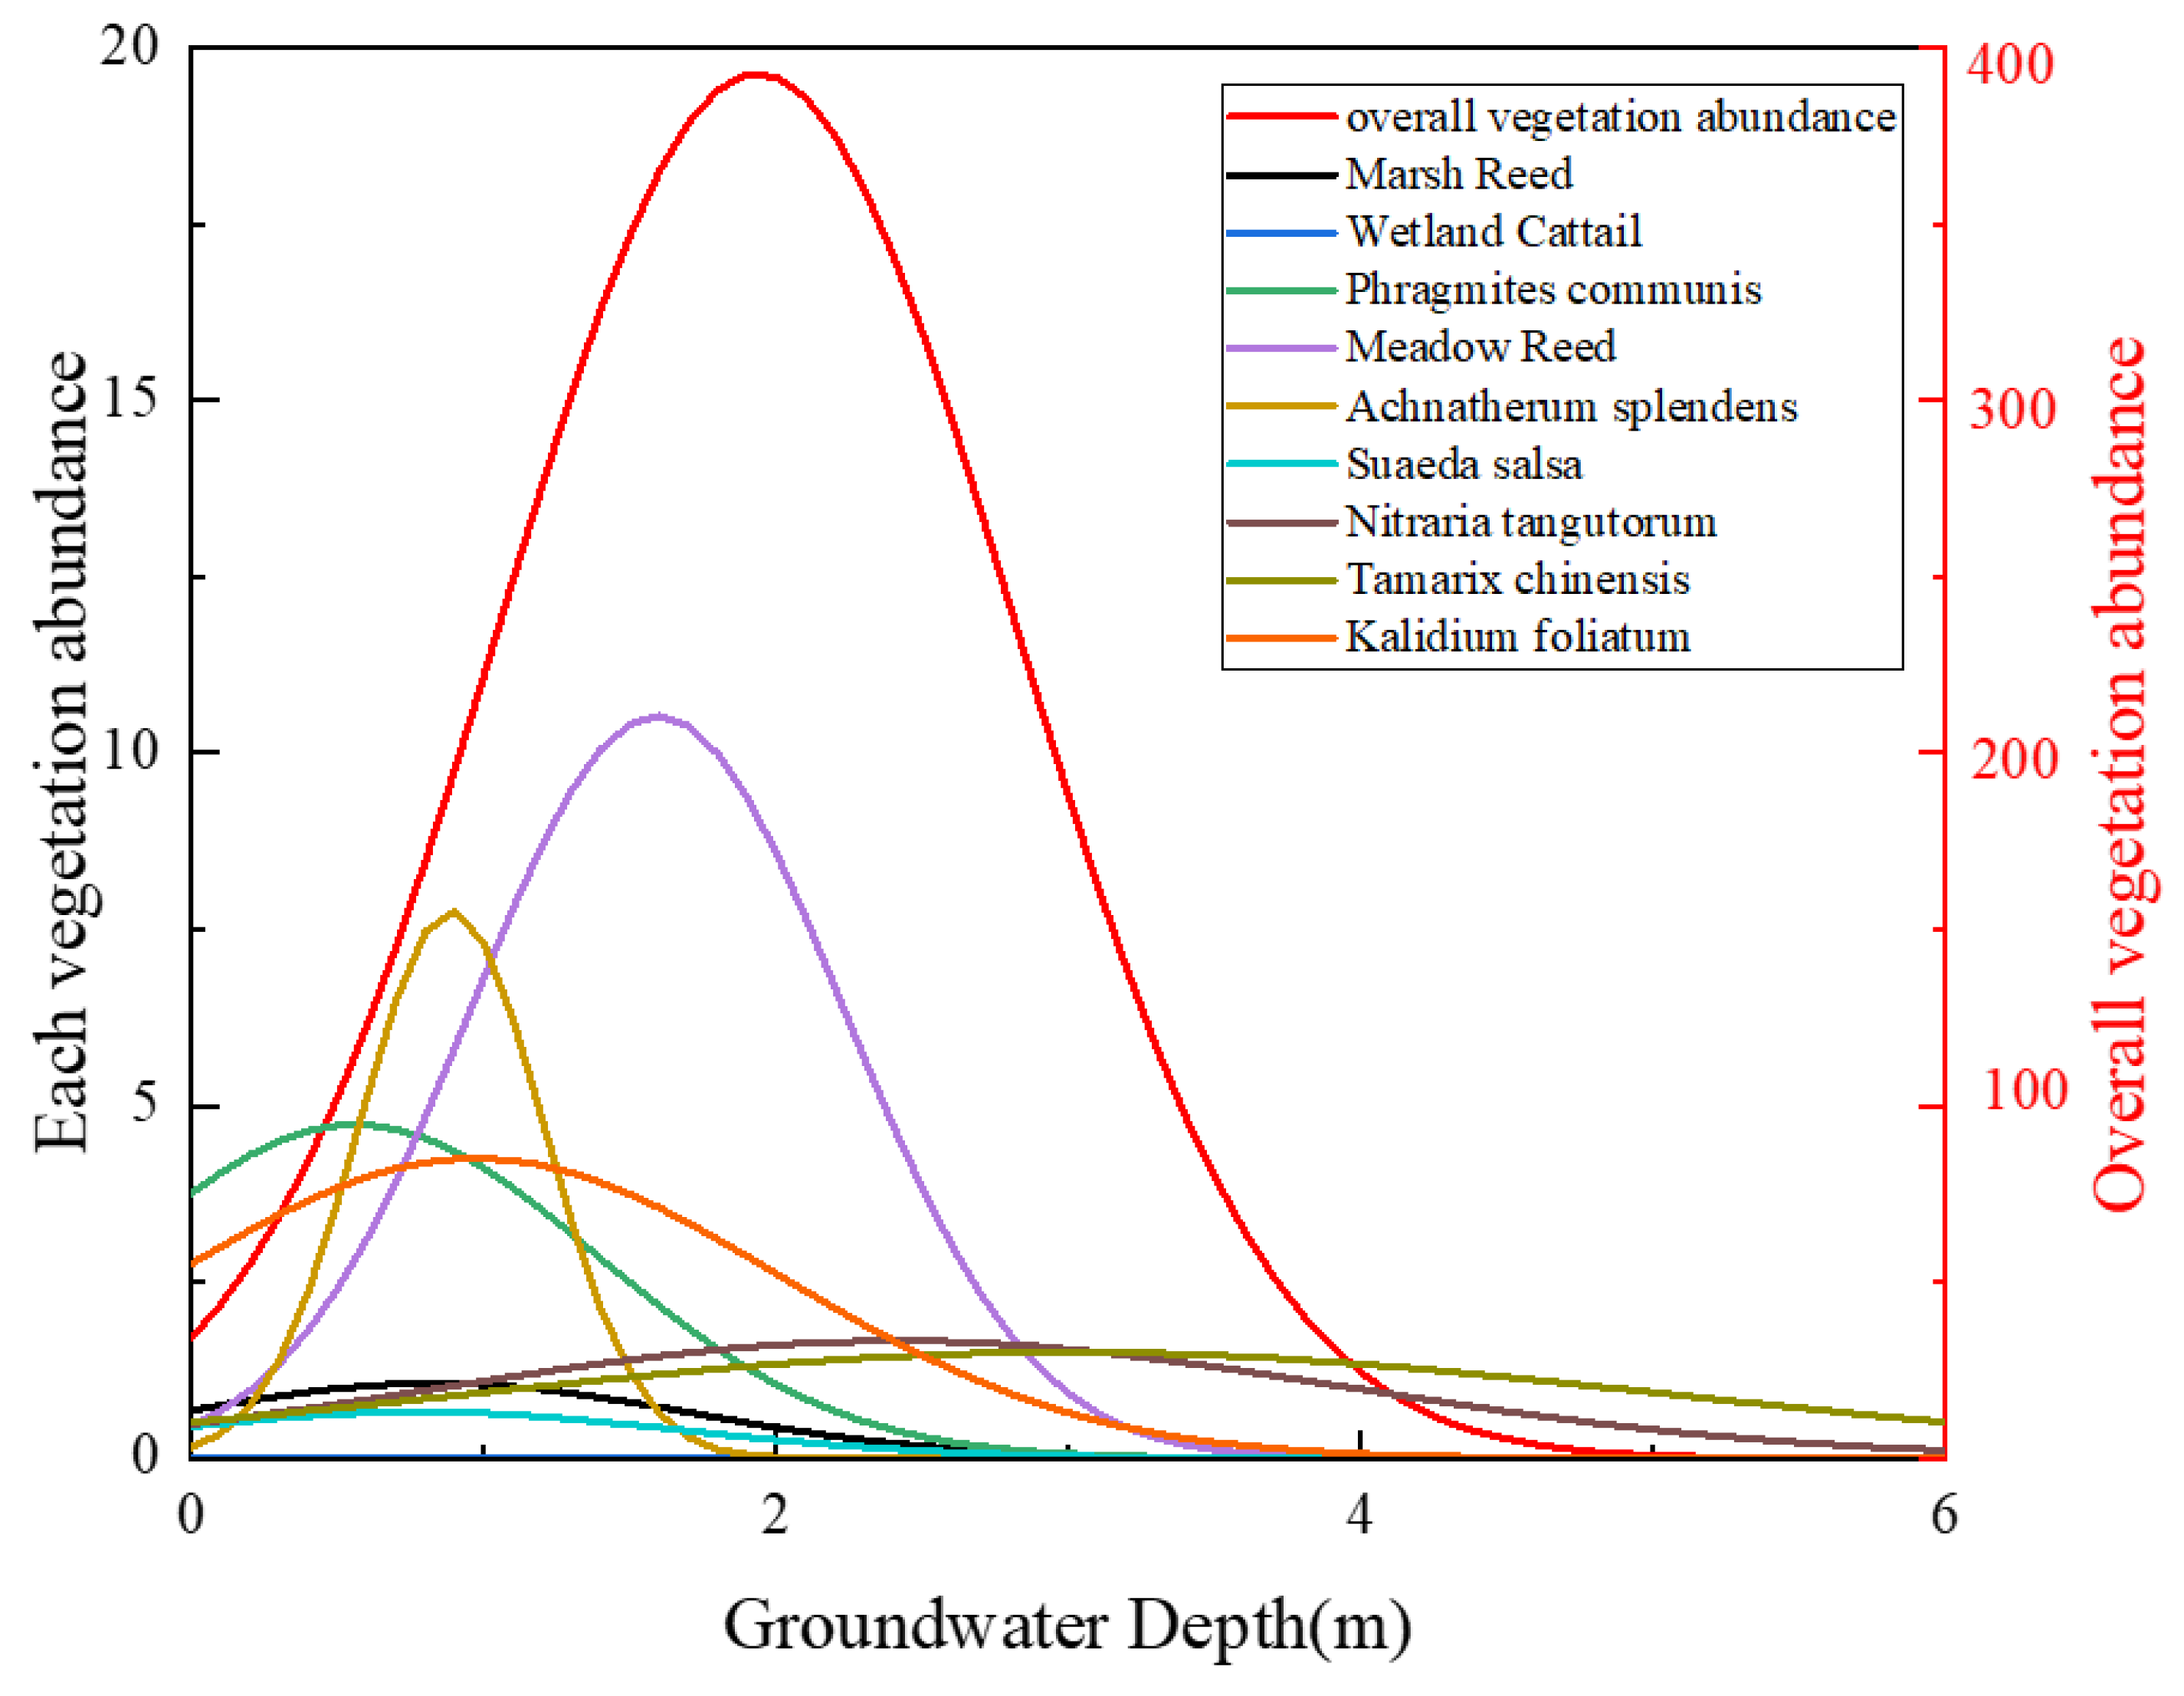
4.1.1. Constraints for Vegetation Ecological Stability

The Hetao Irrigation District is a typical irrigation region in arid and semi-arid zones that draws water from the Yellow River. Compared to cultivated land, forested and grassland vegetation areas are relatively limited, with forested areas mainly comprising artificially planted economic and ecological forests, which are regularly distributed under the influence of human activities. Natural vegetation clusters can be found along rivers, canals, roadsides, and on some unused lands within the irrigation district. These deep-rooted plants are capable of directly absorbing groundwater to meet their growth needs. Large amounts of reeds grow within and around water diversion and drainage channels, showcasing strong adaptability to environmental conditions but also fluctuating with changes in groundwater levels [29]. Wetlands, which require specific environmental conditions, are typically located in low-lying areas along riverbanks and around lakes, where groundwater is shallow [30]. Indicator species for sandy wastelands primarily include Caragana, Hedysarum, and Nitraria, with Nitraria predominantly found on stabilized dunes and sandbars. These plants rely on groundwater absorbed through their root systems [31,32]. Thus, analyzing the sensitivity of vegetation to groundwater depth in the irrigation district is essential for identifying the optimal groundwater depth range for vegetation growth in the region.
The species dominance of vegetation in the Hetao region was calculated using Formulas (2)–(6), as shown in Table 1 and Figure 4.
A review of vegetation data and related literature analysis reveals that certain vegetation types, such as Stipa glareosa, Agriophyllum squarrosum, Peganum harmala, Euphorbia humifusa, and Orobanche spp., show no significant correlation between vegetation abundance and groundwater depth. This suggests that these species either do not rely on groundwater for their water needs or only partially depend on it. Consequently, the correlation analysis was limited to certain dominant vegetation. Using data obtained from the literature [33,34,35,36,37,38], MATLAB software (2023) was employed to analyze the relationship between the vegetation abundance and the groundwater depth. The resulting unimodal curves were used to discuss the suitable groundwater depth ranges for optimal vegetation growth. The results are shown in Table 2.
A regression analysis was conducted on the overall vegetation abundance and burial depth summarized in the literature, establishing the following mathematical model:
f x = e 0.6522 x 2 + 2.5245 x + 3.5301
where f(x) is overall vegetation abundance and x is groundwater depth.
The vegetation abundance models demonstrate clear hydrological niche differentiation across species (Figure 5). Hydrophytic species (Marsh Reed, Wetland cattail, Phragmites communis) exhibit peak abundance ( f x > 0.8) in shallow groundwater conditions (0.5–1.5 m), with Marsh Reed showing the widest tolerance range (σ = 0.53 m). Mesophytes (Meadow Reed, Achnatherum splendens, Suaeda salsa) display intermediate optima (1.0–2.0 m), while xerophytes (Nitraria tangutorum, Tamarix chinensis) thrive in deeper groundwater (2.0–4.0 m), with Tamarix having the broadest ecological amplitude (σ = 1.72 m). Notably, Kalidium foliatum’s narrow optimal range (0.8–1.0 m, σ = 0.31 m) suggests high sensitivity to water table fluctuations. The bimodal distribution of overall vegetation abundance correlates with these divergent strategies—forming distinct ecological guilds around 1.3 m (wetland species) and 2.8 m (desert species) groundwater depths. These models collectively explain 78–92% of observed abundance variations (R2 values), with prediction errors < 15% (RMSE). The σ values reflect each species’ adaptive capacity, where σ > 1.0m indicates generalists (e.g., Tamarix) and σ < 0.5m specialists (e.g., Kalidium). This continuum of hydrological niches supports targeted groundwater management for biodiversity conservation.
Based on the results of the literature review and numerical model calculations, the following conclusion can be drawn: the suitable groundwater level for forest and grassland areas in the Hetao irrigation district should be maintained between 1 and 3.0 m, with a maximum depth of 3.0 m. This level is necessary to ensure that natural vegetation does not degrade and to control the progression of land sandification and desertification.

4.1.2. Constraints for Farmland Ecological Stability

The main crops grown in the Hetao Irrigation District are wheat, corn, and sunflower. According to the “Report on the Measurement and Calculation of Irrigation Water Utilization Coefficient in the Hetao Irrigation District”, the average effective particle size of the soil in the Hetao Irrigation District is 0.11 mm, with an average porosity of 41.3%. The crop growth period is from April to September, with an average temperature of T = 18   ° C . The liquid surface tension is σ = 72.9 × 10 3   N / m . Based on studies by scholars on different crops in the Hetao Irrigation District, the suitable root depth for wheat, corn, and sunflower is 80 cm, 120 cm, and 135 cm [39,40,41], respectively. Using Formula (10), the appropriate groundwater depth for the growth of wheat, corn, and sunflower in the Hetao Irrigation District is calculated, with results shown in Table 3. Similarly, the critical underground depth for soil salinization in the Hetao Irrigation District is calculated using Formula (11).
The results of calculating the critical groundwater depths for different crops and salinity control reveal that the Hetao Irrigation District needs to maintain a groundwater depth greater than 1.29 m . In the Hetao Irrigation District, the optimal groundwater depths to support the growth of wheat, corn, and sunflower are 1.29~2.09 m , 1.29~2.49 m , and 1.29~2.64 m , respectively. Sunflowers, with the deepest root systems in the soil, can absorb groundwater from greater depths to sustain their growth. A comparison between the calculated critical values for optimal groundwater depth for crop growth and the research findings of numerous scholars indicates strong alignment between these calculated values and existing research results. The utilization of arable land in the Hetao Irrigation District varies at different irrigation stages, leading to different requirements for groundwater. From the thawing period until the spring irrigation (March to April), the suitable control depth for groundwater is between 2.0~2.4 m ; from after winter irrigation until the next thawing (late October to February of the following year), the suitable control depth is between 2.0~2.7 m . This range not only meets the water requirements for crop growth but also protects the ecological safety of the farmland in the irrigation district.

4.1.3. Constraints for Lake Ecological Stability

A literature review reveals that Zhao Xiaoyu studied the water requirements of Wuliangsuhai Lake in the Hetao Irrigation District for ecosystem support [42], pollution control, evaporation, and biological habitat needs, determining an annual replenishment volume of 891 million m3, with groundwater levels in the irrigation district ideally maintained between 1.20 and 2.64 m . Chen Jiansheng [43] and colleagues used isotopic labeling methods to investigate the recharge relationship between Wuliangsuhai Lake and groundwater in the Hetao Irrigation District, finding that a groundwater level between 1.50 and 2.75 m facilitates optimal recharge interactions with the lake. Hou Qingqiu identified October as the period of maximum groundwater depth reduction, with depths reaching 3.3 m and a peak lake recharge volume of 10 million m 3 [44] Wang Lixiang’s study [45] on the fluctuation mechanisms of lakes in the Hetao Irrigation District found that when groundwater depths range from 1.43 to 2.63 m , the lake area varies from 1218.75 to 4068.75 h m 2 . Based on this literature, the optimal groundwater depth range for the Hetao Irrigation District is determined to be 1.50~2.63 m .
The suitable groundwater depth affecting lake safety in the Hetao Irrigation District was determined through a literature review. The findings indicate that the appropriate groundwater depth for this region ranges from 1.50 to 2.63 m . Consequently, the suitable groundwater level for multifunctional integration in the Hetao Irrigation District is between 1.50 and 2.49 m , as detailed in Figure 6.

4.2. Development of Water-Saving Plans for the Irrigation District

In recent years, the Hetao Irrigation District has achieved significant results in water-saving irrigation through continuous reform and innovation in various aspects, including engineering construction, land consolidation, crop structure, farming systems, agronomic water-saving practices, water management, water fee collection, and group management reforms. As a result, the efficiency of irrigation water use has improved markedly.
Among these efforts are the following:
  • The canal system lining primarily employs the method of concrete membrane bag U-shaped lining for main, branch, and lateral canals, reducing water conveyance losses due to leakage. This is currently the most significant water-saving method in the Hetao Irrigation District.
  • On the fields, water-saving is mainly achieved through land consolidation projects, sprinkler and micro-irrigation upgrades, wide film mulching, and soil cover practices, which reduce ineffective soil evaporation and decrease the average irrigation water volume per acre.
  • Adjusting the crop structure is also an important measure for achieving overall water savings in the irrigation district. Over the past decade, the crop structure in the Hetao Irrigation District has gradually shifted from primarily growing wheat and corn to focusing on sunflower and corn, with sunflower cultivation now accounting for 47% of the area, while wheat occupies only 7%. According to the future development plan for the Hetao Irrigation District, the potential for further adjustment of the crop structure is already quite limited.
  • Optimizing the irrigation system includes refining irrigation quotas and frequency during the crop growth period and optimizing the autumn irrigation system, which are crucial aspects for tapping into future water-saving potential in the Hetao Irrigation District.
Based on the current water-saving situation and effects in the Hetao Irrigation District, this study identifies significant water-saving measures, including canal system water-saving measures, field water-saving measures, irrigation system optimization measures, and crop structure adjustment measures, as the main strategies. It combines existing experimental research to analyze their water-saving effects while comprehensively considering factors such as food security, water usage habits, water-saving experiences, and investment in water-saving initiatives. A reasonable combination of engineering and non-engineering measures is proposed, leading to the development of a comprehensive agricultural water-saving scheme for the Hetao Irrigation District, as shown in Table 4.

4.3. Analysis of Results for the Comprehensive Water-Saving Plan

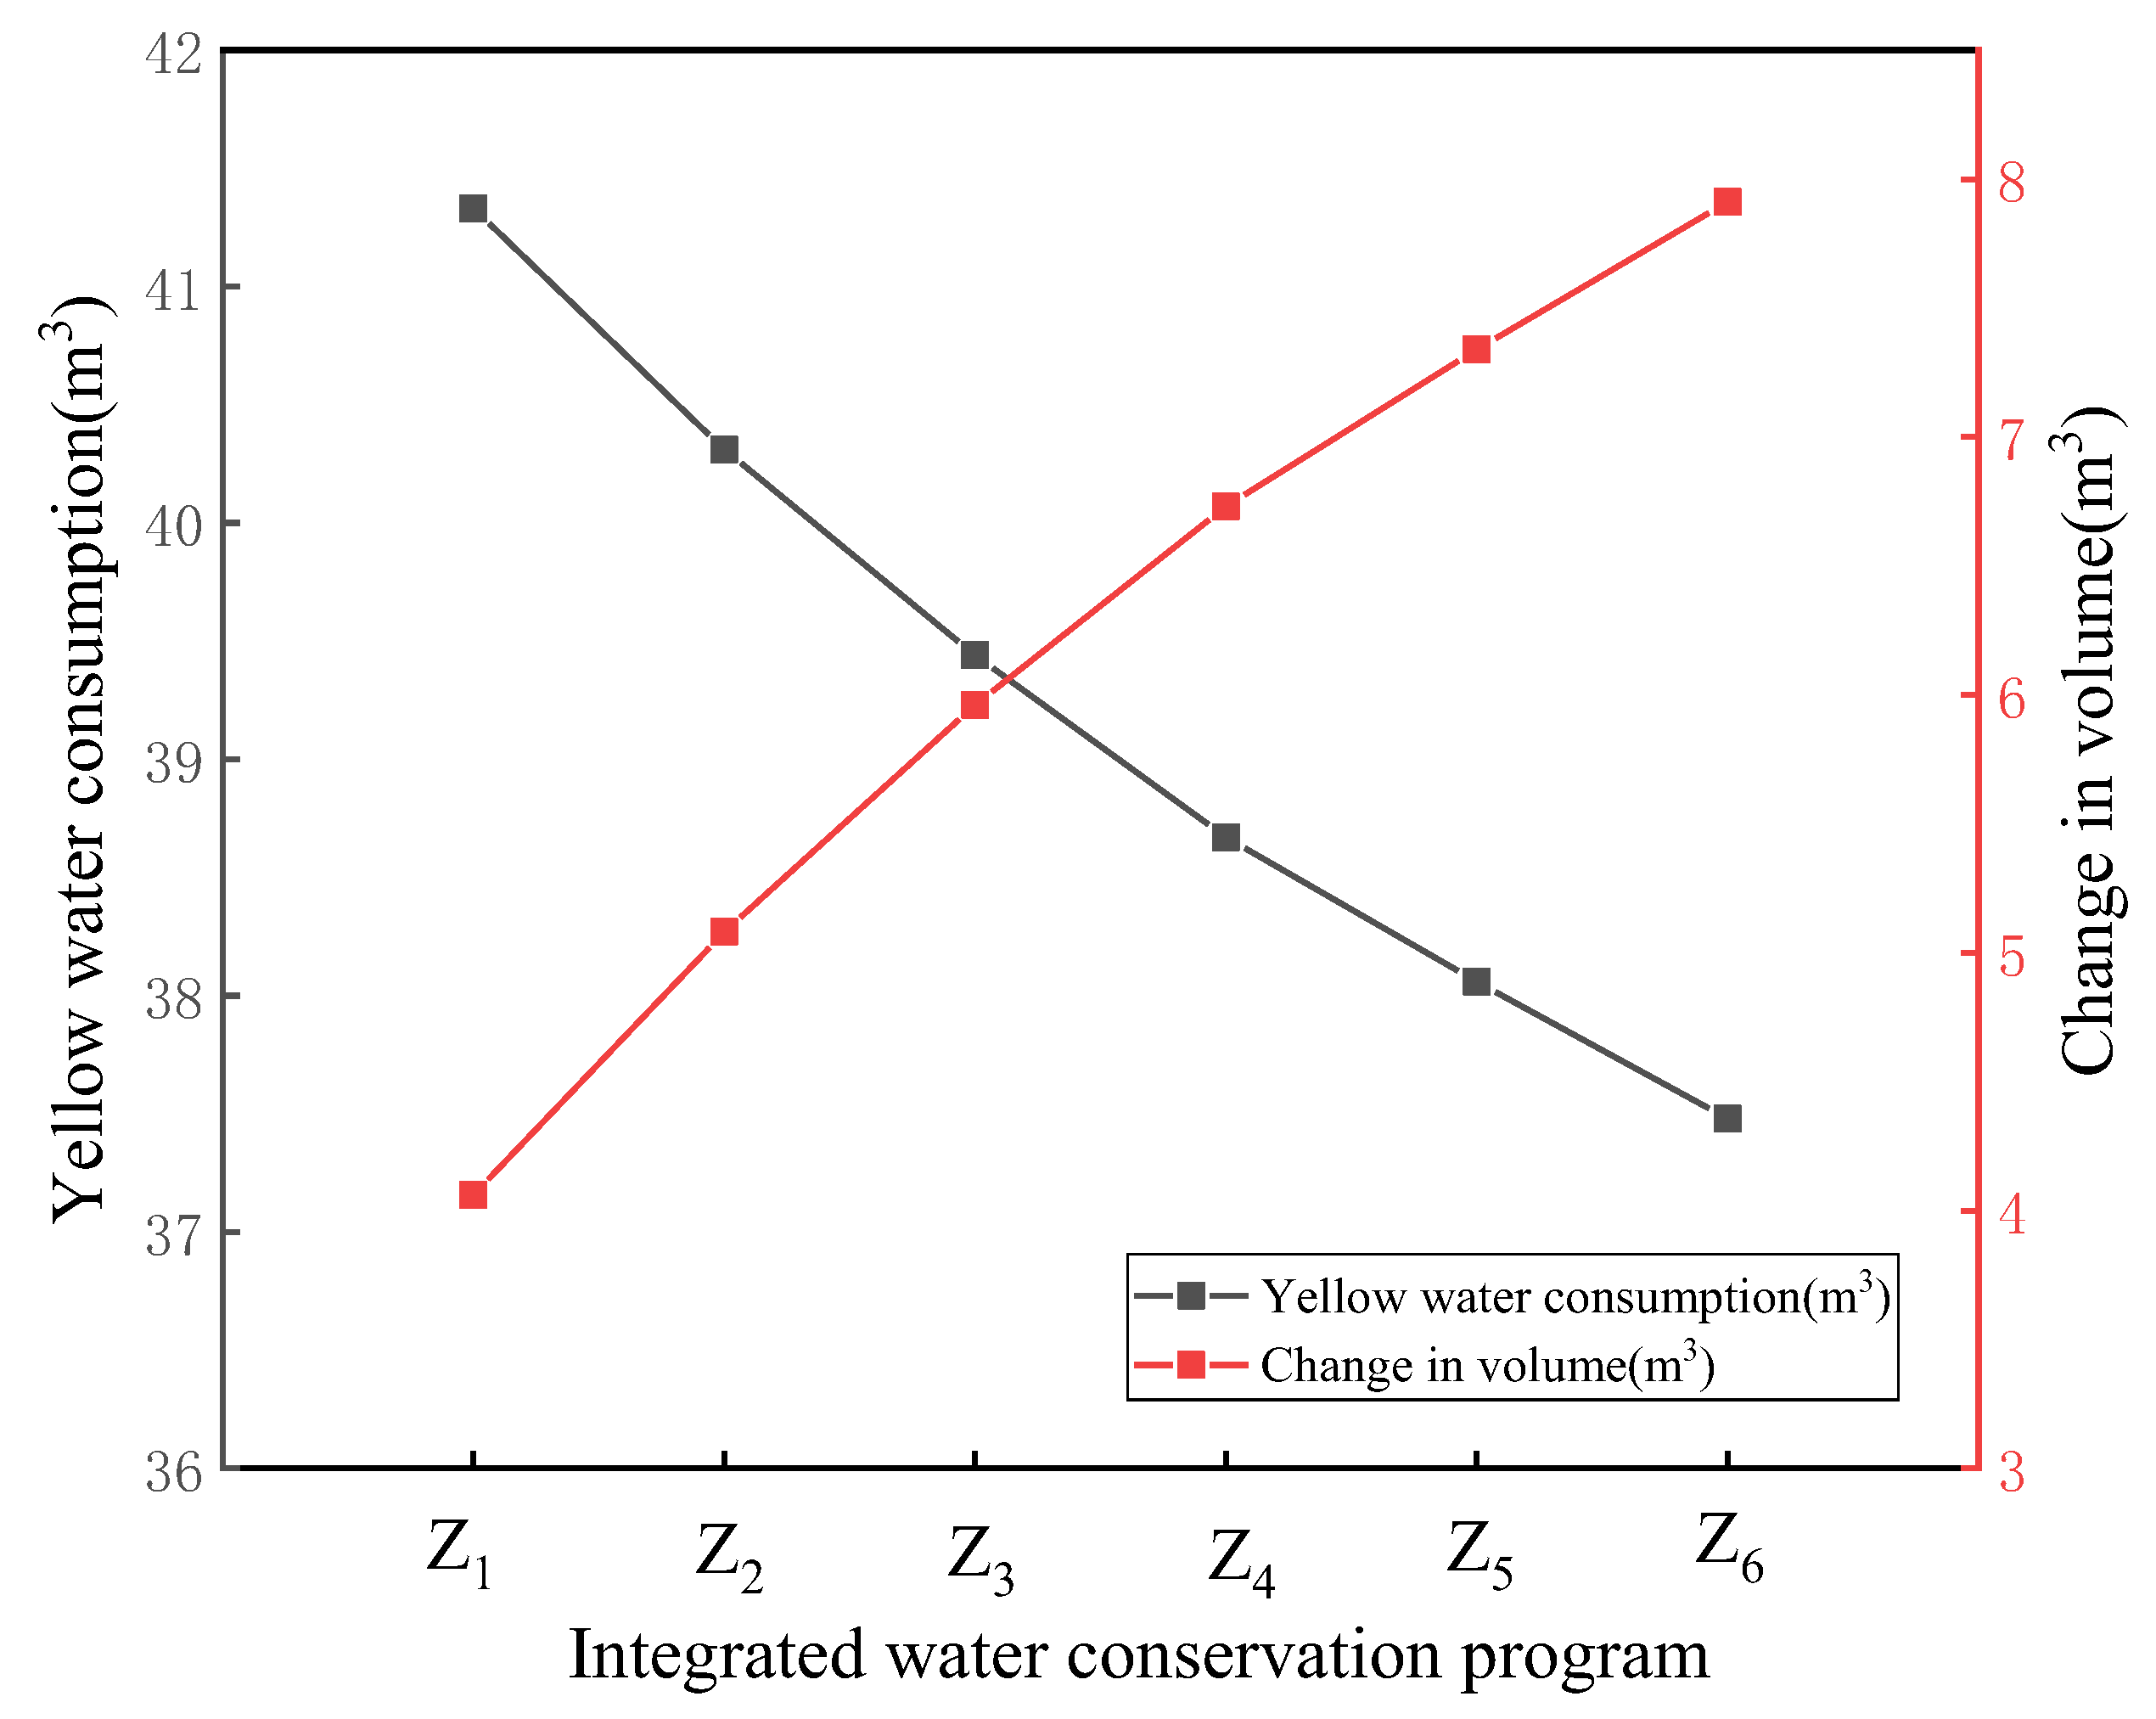
4.3.1. Changes in the Utilization of Yellow River Water

The average annual water consumption from the Yellow River for the comprehensive plans Z1 to Z6 is 4.133, 4.031, 3.944, 3.867, 3.806, and 3.748 billion m3, respectively. Compared to the current baseline plan, the water withdrawal from the Yellow River is reduced by 0.406, 0.508, 0.596, 0.673, 0.734, and 0.791 billion m3, as shown in Table 5 and Figure 7.

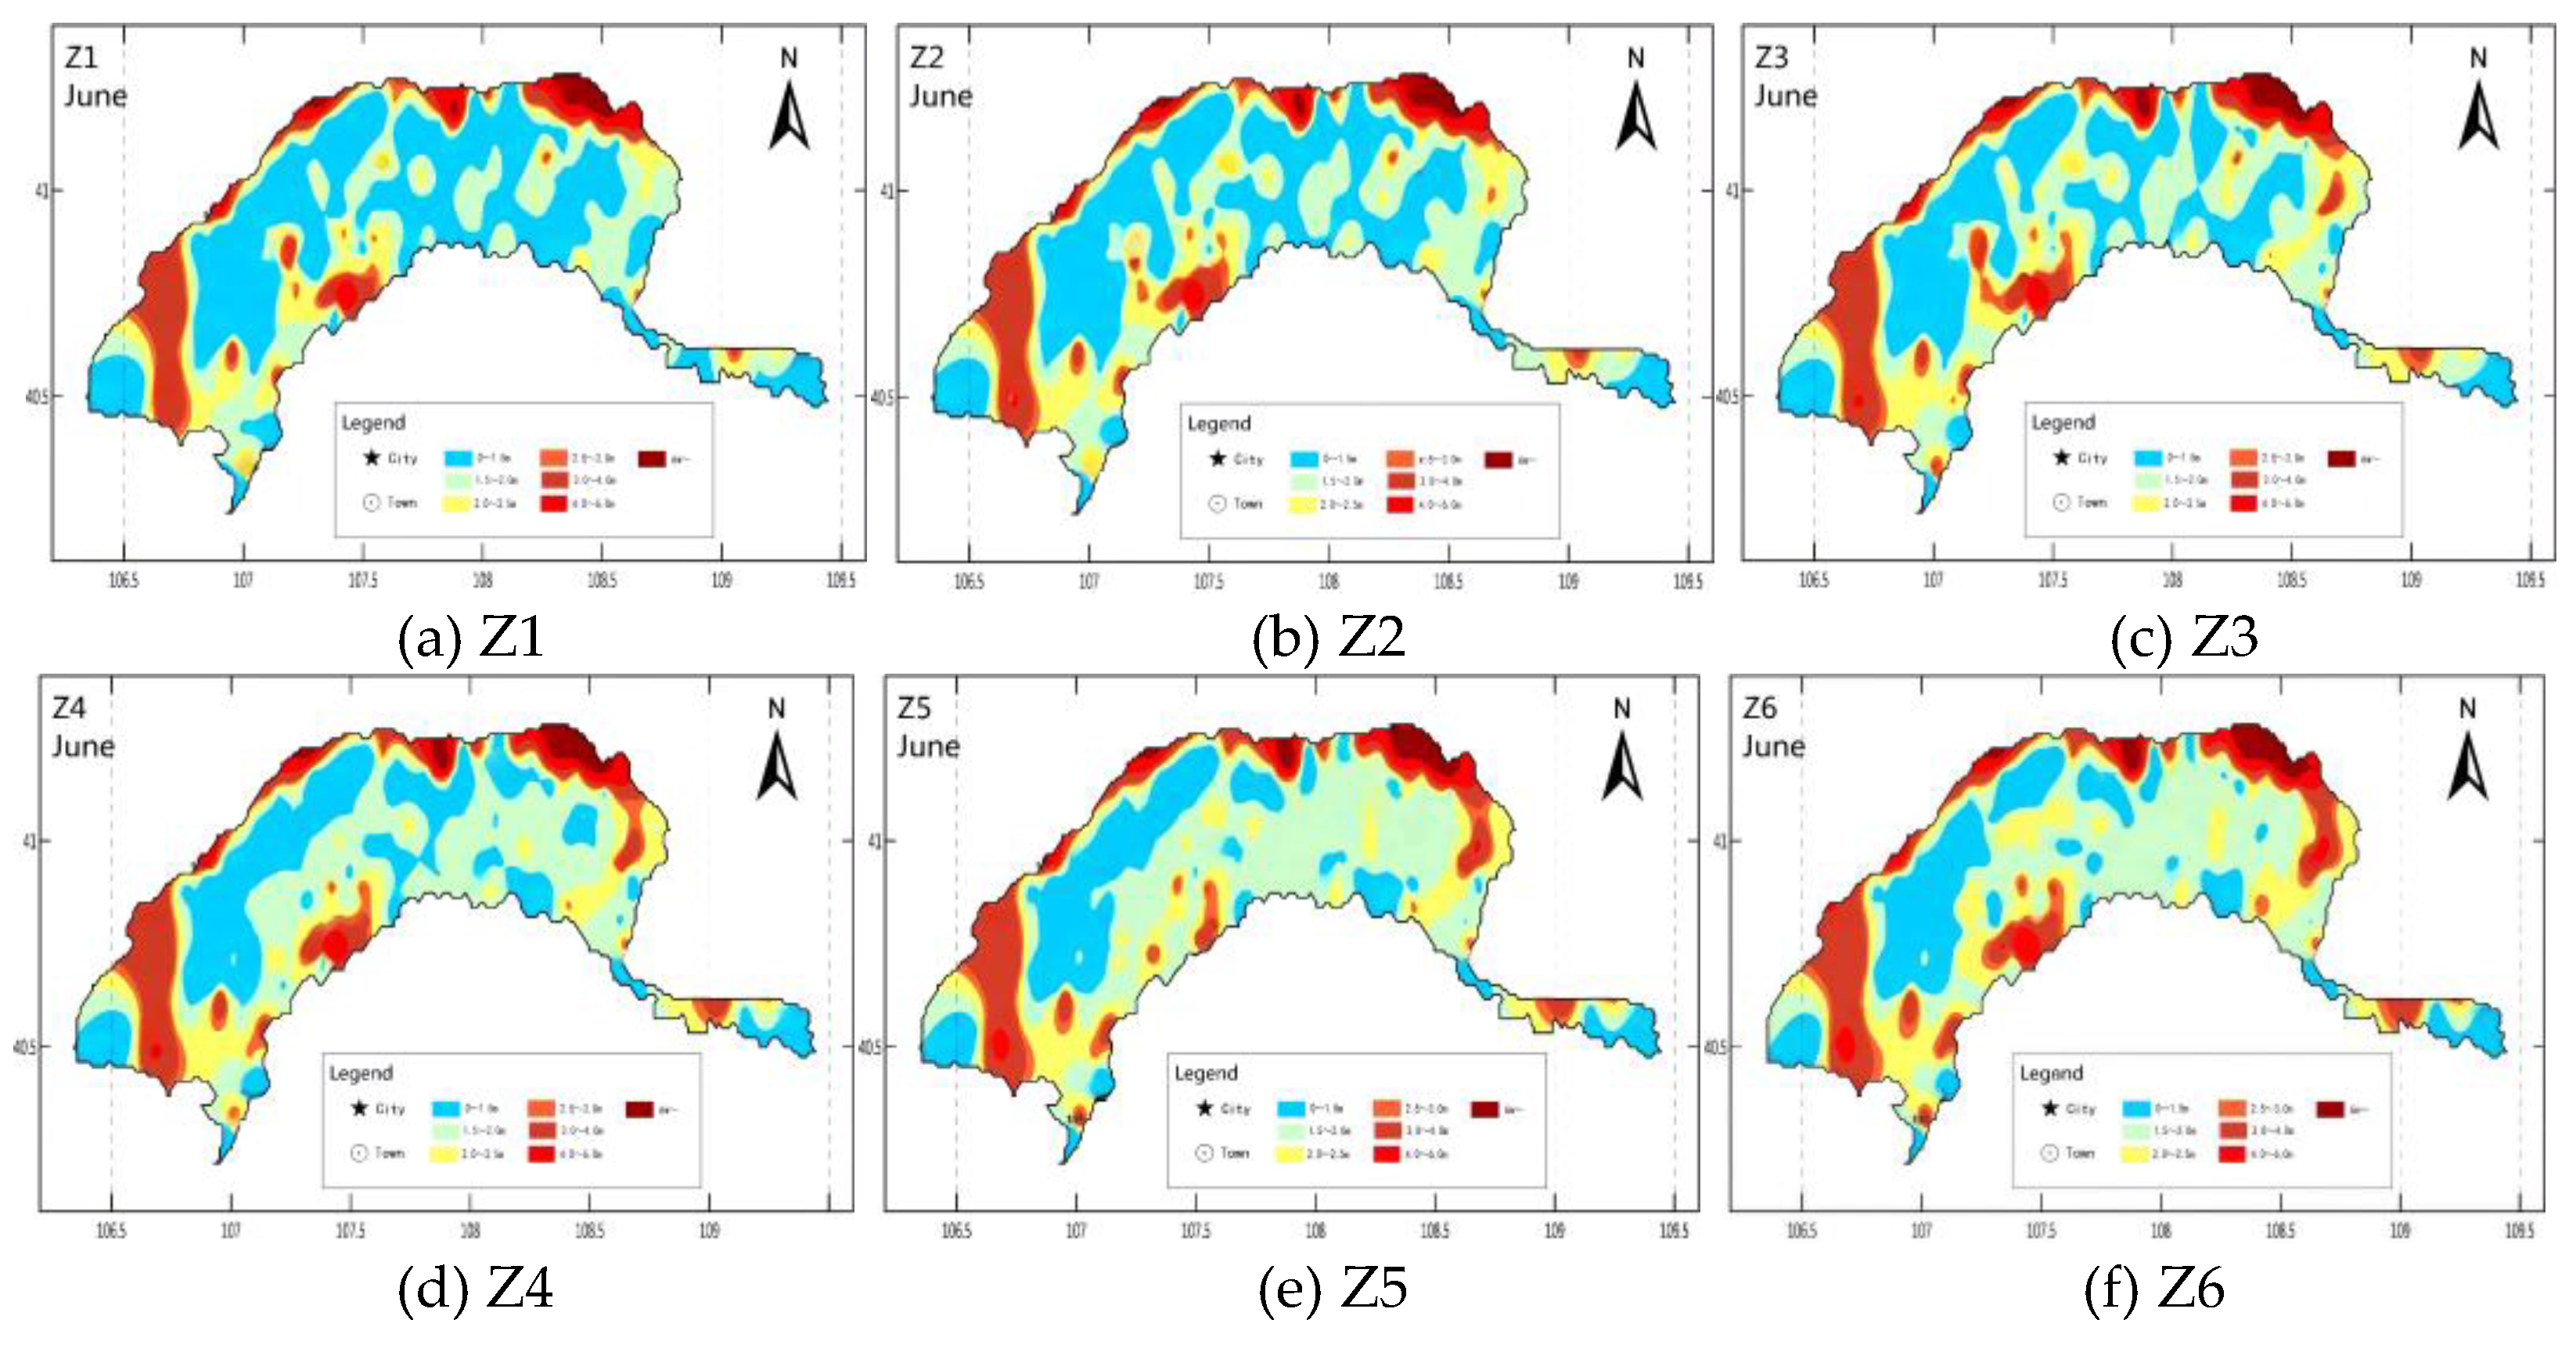
4.3.2. Changes in the Groundwater Depth

With the simultaneous improvement of the canal system water utilization coefficient and field water use efficiency, the amount of irrigation water in the farmland of the irrigation district gradually decreases as the intensity of irrigation system optimization increases, leading to a continuous reduction in the volume of water drawn from the Yellow River. Under plans Z1 to Z6, the average annual groundwater depth in the irrigation district increases by 0.27, 0.34, 0.40, 0.44, 0.50, and 0.56 m , respectively, compared to the baseline year. During the dry season (March), the groundwater depth starts at 2.43 m and subsequently decreases by 0.19, 0.24, 0.29, 0.31, 0.36, and 0.40 m . In the wet season (November), the groundwater depth starts at 1.62 m and decreases by 0.33, 0.41, 0.49, 0.53, 0.60, and 0.67 m , indicating that water-saving measures have a greater impact on groundwater depth during the wet season. For details, please refer to Table 6.
From the spatial and temporal distribution of groundwater depth, it is evident that as water-saving intensity increases, the area of shallow groundwater zones has continuously decreased compared to the baseline year, while the area of deeper groundwater zones has steadily increased. For instance, in June (see Figure 8 and Table 6), significant increases in groundwater depth are observed in areas such as northern Dengkou County, the vicinity of Linhe-Hangjinhou Banner urban areas, eastern and southern Wuyuan County, and the Sanhuhe irrigation zone in Urad Front Banner. Notably, the area with a depth of less than 1.0 m has decreased most significantly; the Z1 scheme saw a reduction of 1708 km2 (a 14.5% decrease) in areas under 1.0 m , while the Z6 scheme exhibited an even larger reduction, with the area decreasing by 3275 km2 (a 27.8% reduction).
Although large-scale spring irrigation began from April to June, the area with groundwater depths greater than 1.5 m has still increased significantly compared to the baseline year. In the Z6 scheme, the area exceeding 1.5 m expanded by 3047 km2, representing a 25.9% increase, with the 1.5~2.0 m depth interval experiencing the most substantial growth, adding 1463 km2, or a 12.4% increase. This indicates that as the water utilization efficiency of canal systems improves, areas that originally had groundwater depths below 1.0 m have experienced a decline in groundwater levels, with a significant portion shifting to depths of 1.5~2.0 m , resulting in a more pronounced impact on the regional ecosystem.

4.4. Water-Saving Potential for Ecosystem Stability

Considering both water saving and ecological protection, the recommended plan Z4 is deemed a more feasible comprehensive regulation scheme. Schemes Z1 and Z2 significantly affect terrestrial ecosystems and lake wetlands, but the impact is manageable. However, there remains a considerable gap between these schemes and the overall development goals of the irrigation district, as ecological health has not yet reached critical thresholds. Therefore, further intensification of water-saving measures is required. Schemes Z5 and Z6 impose substantial negative effects on both agricultural and natural ecosystems. The key difference between schemes Z3 and Z4 is the strength of in-field measures, with the potential impacts of both scenarios being relatively similar. Based on the response thresholds for terrestrial ecosystems and lake wetlands, while the impact of Z4 is slightly greater, it remains within an acceptable range and is economically feasible. Consequently, Scheme Z4 is recommended as the more viable integrated management option. Compared to the long-term series from 1990 to 2013, the water-saving potential in the Hetao Irrigation District is approximately 760 million m3, while the water-saving potential from the Yellow River is about 670 million m3.

5. Conclusions

Implementing agricultural water-saving measures while ensuring ecological stability is a crucial strategy for water resource management in China, especially in the arid and semi-arid irrigation areas of northwest China, where such measures are of significant importance. Ecological fragility is a typical characteristic of these irrigation areas; thus, maintaining the stability of the irrigation ecosystem during the implementation of water-saving measures is essential for the sustainable development of both production and livelihoods. This paper clarifies how the groundwater depth constrains the stability of irrigation ecosystems by analyzing its impact on key ecological components such as forests, farmland, lakes, and grasslands. It examines the optimal groundwater depth necessary for the healthy development of these components and determines the suitable groundwater depth required to maintain the stability of the irrigation ecosystem. A threshold assessment method is proposed to evaluate the amount of water-saving needed to sustain the regional ecological environment, based on the irrigation area water cycle model. Furthermore, this study serves as a reference for implementing deep water-saving ecological development models in large irrigation areas in arid regions worldwide.
Using the Hetao Irrigation District as a case study, scenarios are established for water-saving measures across irrigation channels, field irrigation, and irrigation scheduling optimization, as well as combinations of these strategies. A distributed hydrological model is employed to simulate changes in groundwater depth and drainage amounts under different water-saving scenarios, determining the potential for water savings while maintaining controlled groundwater levels in the Hetao Irrigation District. When the combined water-saving scheme Z4 is implemented, the groundwater depth in the irrigation area reaches 2.51 m, which is the critical threshold for ecosystem stability. At this point, the maximum water-saving potential for the Hetao Irrigation District is determined to be 760 million cubic meters.

Author Contributions

Conceptualization, H.H. and Z.W.; methodology, H.H.; software, L.L.; validation, H.H., Z.W. and L.L.; formal analysis, Z.W.; investigation, H.H.; resources, H.H.; data curation, Z.W.; writing—original draft preparation, H.H.; writing—review and editing, Z.W.; visualization, L.L.; supervision, H.H.; project administration, Z.W.; funding acquisition, L.L. All authors have read and agreed to the published version of the manuscript.

Funding

This research was funded by Henan Provincial Major Science and Technology Special Projects, no. 231100320100; Central Government Guides Local Science and Technology Development Funds Project of Henan Province, no. Z20241471035; Philosophy and Social Sciences Projects of Henan Province, no. 2023BJJ062; Kaifeng City Key Technology Tackling Projects, no. 2403105; and Henan Province Key Technology Tackling Projects, no. 252102240135.

Institutional Review Board Statement

Not applicable.

Informed Consent Statement

Not applicable.

Data Availability Statement

Data are contained within the article.

Conflicts of Interest

The authors declare no conflicts of interest.

Abbreviations

Abbreviations/ParametersNoteAbbreviations/ParametersNote
f x the biomass that reflects the state of plant growth, primarily referring to vegetation abundance and coverage x the groundwater depth
μ the optimal groundwater depth for peak species abundance σ the tolerance range around this optimum, with smaller values indicating narrower ecological adaptability
H the maximum capillary rise height m ρ w the density of water k g / m 3
g the gravitational acceleration m / s 2 R the equivalent capillary diameter (effective pore diameter)
h i the critical groundwater depth for the i crop m D i the root depth for normal growth of the i crop ( m ).
h 0 the critical groundwater depth for farmland salinization (m) T m i n the minimum temperature of soil water, measured in degrees Celsius (°C)
Q the water-saving volume (m3) achieved after increasing the canal system’s water utilization coefficient Q d the total water diversion from the canal system (m3
η 0 the current values of the water utilization coefficient for the irrigation area’s canal system η 1 the improved values of the water utilization coefficient for the irrigation area’s canal system
W the water-saving volume (m3) achieved by implementing the field water-saving measures A the irrigated area (mu)
I 0 , I 1 the per mu irrigation quotas (m3/mu) before and after the implementation of the field water-saving measures in the irrigation district, respectively G the water savings achieved by implementing the field water-saving scheme (m3)
B the irrigated area (mu) l 0 , l 1 the average irrigation quotas per mu (m3/mu) before and after the implementation of the field water-saving scheme in the irrigation area, respectively
WACMThe Watershed Distributed Water Cycle Model

References

  1. Schaeffer, D.J.; Herricks, D.E.; Kerster, H.W. Ecosystem health: 1. Measuring ecosystem health. Environ. Manag. 1988, 12, 445–455. [Google Scholar]
  2. Rapport, D.J.; Böhm, G.; Buckingham, D.; Cairns, J., Jr.; Costanza, R.; Karr, J.R.; De Kruijf, H.A.M.; Levins, R.; McMichael, A.J.; Nielsen, N.O.; et al. Ecosystem health: The concept, the ISEH, and the important tasks ahead. Ecosyst. Health 1999, 5, 82–90. [Google Scholar] [CrossRef]
  3. Zhl-Cheng, H.; Feng-Jin, X.; Jiang-Hua, S.; Dong-Mei, S. The current status of ecosystem health and its assessment. Chin. J. Eco Agric. 2003, 3, 189–192. (In Chinese) [Google Scholar]
  4. Gulimire, H.; Wang, G.Y.; Zhang, Y.; Liu, Q.Q.; Su, L.T. Influence mechanism of intermittent ecological water conveyance on groundwater level and vegetation in arid land. Arid. Land Geogr. 2018, 41, 50–57. (In Chinese) [Google Scholar]
  5. Zhang, Y.Q.; Bai, Q.Y.; Wang, H.Y. Discussion on Suitable Depth of Groundwater Level, Water-saving Threshold and Water-salt Balance in Hetao Irrigation District. J. Irrig. Drain. 2019, 38, 83–86. (In Chinese) [Google Scholar]
  6. Guan, X.Y.; Wang, S.L.; Gao, Z.Y.; Lv, Y.; Fu, X.J. Spatio-temporal variability of soil salinity and its relationship with the depth to groundwater in salinization irrigation district. Acta Ecol. Sin. 2012, 32, 1202–1210. (In Chinese) [Google Scholar] [CrossRef]
  7. Kopeé, D.; Michalska-Hejduk, D.; Krogulec, E. The relation ship ground water levels as an indicator of between vegetation and spontaneous wetland restoration. Ecol. Eng. 2013, 57, 242–251. [Google Scholar]
  8. Jia, L.M.; Guo, Z.X.; Long, Y.H.; Guo, K.; Liao, Z. Research advances in ecological ground water level in arid areas. Ecol. Sci. 2015, 34, 187–193. (In Chinese) [Google Scholar]
  9. Xin, P.; Kong, J.; Li, L.; Barry, D. Modelling of groundwater—Vegetation interactions in a tidal marsh. Adv. Water Resour. 2013, 57, 52–68. [Google Scholar] [CrossRef]
  10. Zhang, Q.; Qiang, Q.U.A.N.; Li, J.; Chen, J.; Li, Q. Groundwater Dynamic Changing under Water-saving Irrigation Conditions of Hetao Irrigation District. J. Irrig. Drain. 2018, 37, 97–101. (In Chinese) [Google Scholar]
  11. Zhang, C.C.; Shao, J.L.; Li, C.J.; Cui, Y.L. Eco-environmental effects on groundwater and its eco-environmental index. Hydrogeol. Eng. Geol. 2003, 30, 6–10. (In Chinese) [Google Scholar]
  12. Liu, S.S.; Xu, G.Q.; Li, Y.; Wu, X.; Liu, J.; Mi, X.J. Difference and consistency of responses of five sandy shrubs to changes in groundwater level in the Hailiutu River Basin. Acta Ecol. Sin. 2021, 41, 615–625. (In Chinese) [Google Scholar]
  13. Wang, W.; Su, X.S.; Wang, X.Y. Vegetation Ecological Risk Assessment Research Under the Impact of Groundwater Withdraw: A Case Study of Wulannao Area, Ordos Basin. J. Jilin Univ. (Earth Sci. Ed.) 2010, 40, 1344–1352. (In Chinese) [Google Scholar]
  14. Li, B.; Yang, C.; Lin, P. Ecology, 3rd ed.; Higher Education Press: Beijing, China, 2000; pp. 34–78. [Google Scholar]
  15. Wan, L.; Cao, W.B.; Hu, F.S. Eco-Hydrological Geology, 3rd ed.; Geological Publishing House: Beijing, China, 2005. [Google Scholar]
  16. Zhang, J.T. Quantitative Ecology, 3rd ed.; Science Press: Beijing, China, 2004. [Google Scholar]
  17. Chang, C.L. Research on Ecological Groundwater Depth and the Optimum Irrigation Amount for Different Crop Planting Patterns in Hetao Irrigation District. Master’s Thesis, Inner Mongolia Agricultural University, Hohhot, China, 2005. [Google Scholar]
  18. Wang, Y.; Chen, M.; Zhao, Y.; Yan, L.; Deng, W.; Wang, Q. Calculation and regulation of groundwater level based on the stability of groundwater-dependent ecosystem. Adv. Water Sci. 2021, 32, 597–607. (In Chinese) [Google Scholar]
  19. Manhong, X.; Shaogang, D.; Baiwei, L. Evolution of groundwater-lake system in typical open-pit coal mine area. J. Lake Sci. 2020, 32, 187–197. (In Chinese) [Google Scholar] [CrossRef]
  20. Grafton, R.Q.; Williams, J.; Perry, C.J.; Molle, F.; Ringler, C.; Steduto, P.; Udall, B.; Wheeler, S.A.; Wang, Y.; Garrick, D.; et al. The paradox of irrigation efficiency. Science 2018, 361, 748–750. [Google Scholar] [CrossRef]
  21. Yan, Q.S.; Li, H.; Wang, X.K. Status, problems, trends and suggestions for water-saving irrigation equipment in China. J. Drain. Irrig. Mach. 2015, 33, 78–92. (In Chinese) [Google Scholar]
  22. Wang, H.; Hu, P. Key issues of ecological conservation in the Yellow River basin from a water cycle perspective. J. Hydraul. Eng. 2020, 51, 1009–1014. (In Chinese) [Google Scholar]
  23. Jin, X.M. Quantitative relationship between the desert vegetation and groundwater depth in Ejina Oasis, the Heihe River Basin. Earth Sci. Front. 2010, 17, 181–186. (In Chinese) [Google Scholar]
  24. Yue, Q.; Zhang, F.; Guo, P. Optimization-based agricultural water-saving potential analysis in Minqin County, Gansu Province China. Water 2018, 10, 1125. [Google Scholar] [CrossRef]
  25. Jägermeyr, J.; Gerten, D.; Heinke, J.; Schaphoff, S.; Kummu, M.; Lucht, W. Water savings potentials of irrigation systems: Global simulation of processes and linkages. Hydrol. Earth Syst. Sci. 2015, 19, 3073–3091. [Google Scholar] [CrossRef]
  26. Raeisi, L.G.; Morid, S.; Delavar, M.; Srinivasan, R. Effect and side-effect assessment of different agricultural water saving measures in an integrated framework. Agric. Water Manag. 2019, 223, 105685. [Google Scholar] [CrossRef]
  27. Huang, G.; Hoekstra, A.Y.; Krol, M.S.; Jägermeyr, J.; Galindo, A.; Yu, C.; Wang, R. Water-saving agriculture can deliver deep water cuts for China. Resour. Conserv. Recycl. 2020, 154, 104578. [Google Scholar] [CrossRef]
  28. Bi, Y.; Zhao, J.; Zhang, W.G.; Zhao, Y. Simulation of hydrological cycle for mountain-water-forest-cropland. lake-grass system in Hetao region, Inner Mongolia of China by WACM4.0 model. Trans. Chin. Soc. Agric. Eng. 2020, 36, 148–158. (In Chinese) [Google Scholar]
  29. Chen, M.; Zhang, Q.; Wang, Y.; Yan, L.; Deng, W. Critical depth of recharge of the vegetation by groundwater in the West Liaohe Plain. Adv. Water Sci. 2019, 30, 24–33. (In Chinese) [Google Scholar]
  30. Xiyi, W.; Hailiang, X.; Cunde, P.; Hongbo, L.; Pei, Z. Relation of dominant herbaceous plant species to groundwater depth in the lower reaches of Tarim River. J. Desert Res. 2016, 36, 216–224. (In Chinese) [Google Scholar]
  31. Zhao, W.Z.; Chang, X.L. Effect of hydrologic process changes on ND in desert-oasis ecotone of Hexi corridor. Sci. China Earth Sci. 2014, 44, 1561–1571. [Google Scholar]
  32. Song, Y.F.; Guo, Z.X.; Lu, Y.J. Pixel-level spatiotemporal analyses of vegetation fractional coverage variation and its influential factors in a desert steppe: A case study in Inner Mongolia, China. Water 2017, 9, 478. [Google Scholar] [CrossRef]
  33. Cheng Yan, C.Y.; Chen Li, C.L.; Yin JunQi, Y.J.; Bai ZeLong, B.Z.; Zhao WenYu, Z.W. Depth interval study of vegetation ecological groundwater in the water source area at Manaz River valley. Environ. Sci. Technol. 2018, 41, 26–33. (In Chinese) [Google Scholar]
  34. Li, X.; Zheng, Y.; Sun, Z.; Tian, Y.; Zheng, C.; Liu, J.; Liu, S.; Xu, Z. An integrated ecohydrological modeling approach to exploring the dynamic interaction between groundwater and phreatophytes. Ecol. Model. 2017, 356, 127–140. [Google Scholar] [CrossRef]
  35. Er-Yong, Z.; Zheng-Ping, T.; Xiao-Yong, W.; Xu-Dong, C.; Li-He, Y. A study of vegetation response to groundwater on regional scale in northern Ordos Basin based on structure chart method. Geol. China 2012, 39, 811–817. (In Chinese) [Google Scholar]
  36. Sun, X.C.; Jen, X.M.; Wan, L. Effect of groundwater on vegetation growth in Yinchuan Plain. Geoscience 2008, 22, 321–324. (In Chinese) [Google Scholar]
  37. Liu, H.; Zhang, W.Z.; Li, Z.K. Ecohydrology of groundwater dependent ecosystems: Review. Adv. Earth Sci. 2018, 33, 741–750. (In Chinese) [Google Scholar]
  38. Wang, P.; Zhang, Y.; Yu, J.; Fu, G.; Ao, F. Vegetation dynamics induced by groundwater fluctuations in the lower Heihe River Basin, Northwestern China. J. Plant Ecol. 2011, 4, 77–90. [Google Scholar] [CrossRef]
  39. Dong, X.Y. Physiological Mechanism and Cultivation Techniques of High Yield and Efficiency Winter-seeded Spring Wheat in Inner Mongolia. Ph.D. Dissertation, Inner Mongolia Agricultural University, Hohhot, China, 2020. [Google Scholar]
  40. Liu, J.M.; An, S.Q.; Liao, R.W.; Ren, S.X.; Liang, H. Temporal variation and spatial distribution of the root system of corn in a soil profile Chinese. J. Eco Agric. 2009, 17, 517–521. (In Chinese) [Google Scholar]
  41. Min, H.; Zhongyi, Q.; Liping, W.; Yanhong, D.; Yao, Z.; Zhe, L.; Yule, S. Effects of Different Amendments on the Properties of Salinized Soil and Sunflower Growth in Hetao Irrigation District. J. Soil Water Conserv. 2019, 33, 316–322. (In Chinese) [Google Scholar]
  42. Xiaoyu, Z.; Peiling, Y.; Ren, S. Calculating Ecological Demand of Upland Wetlands for Water Using the Ecological-Water-Level Difference Method: Taking Wuliangsuhai Wetland as an Example. J. Irrig. Drain. 2018, 37, 59–65. [Google Scholar]
  43. Chen, J.S.; Zhang, Z.W.; Liu, Z.; Ji, B. Isotope study of recharge relationships of water sources in Wuliangsuhai Lake and its surrounding areas. Water Resour. Prot. 2013, 29, 12–18. (In Chinese) [Google Scholar]
  44. Hou, Q.Q.; Dong, S.G.; Gao, D.H.; Ma, M.Y.; Chen, Y. Hydrogeochemical Evolution and Water and Salt Migration in the Wuliangsuhai Watershed. Environ. Sci. Technol. 2021, 44, 108–114. [Google Scholar]
  45. Wang, L.X. The Driving Mechanism of Lake Fluctuation in Hetao Irrigation Area, Inner Mongolia. Master’s Thesis, Ludong University, Yantai, China, 2005. [Google Scholar]
Figure 1. Irrigation water cycle processes.
Water 17 01193 g001
Figure 2. Model water-saving potential in irrigated area.
Water 17 01193 g002
Figure 3. The Hetao Irrigation District.
Water 17 01193 g003
Figure 4. Vegetation species dominance in the Hetao region.
Water 17 01193 g004
Figure 5. Normal distribution of species dominance of vegetation in the loop.
Water 17 01193 g005
Figure 6. Distribution of suitable groundwater depth in Hetao irrigation area.
Water 17 01193 g006
Figure 7. Changes in water diversion in the irrigation district under.
Water 17 01193 g007
Figure 8. Spatial changes in groundwater depth in the irrigation district in June under different integrated water-saving conditions.
Water 17 01193 g008
Table 1. Vegetation species dominance in the Hetao region.
IndexVegetationDominanceIndexVegetationDominance
1Marsh Reed18.7216Saussurea salsa1.65
2Xerophytic Reed13.1517Kalidium foliatum1.47
3Phragmites australis8.32 18Suaeda glauca1.43
4Typha angustifolia8.18 19Haloxylon ammodendron1.28
5Achnatherum splendens7.06 20Peganum harmala1.19
6Suaeda salsa5.18 21Scirpus triqueter1.08
7Leymus secalinus3.93 22Polygonum sibiricum0.94
8Ixeris polycephala3.72 23Agropyron cristatum0.55
9Scirpus juncoides3.58 24Agropyron mongolicum0.53
10Tamarix chinensis3.44 25Poa pratensis0.52
11Carex spp.3.08 26Oxytropis bicolor0.31
12Digitaria spp.2.57 27Atriplex spp.0.27
13Echinochloa crus-galli2.22 28Euphorbia humifusa0.12
14Equisetum arvense1.85 29Xanthium spp.0.11
15Nitraria tangutorum1.74 30Mixed weeds1.81
Table 2. Vegetation abundance–groundwater depth relationship.
VegetationVegetation Abundance–Water Level Relationship ModelSuitable Range (m)Optimal Water Level (m)
Marsh reed f x = e 0.6501 x 2 + 1.0804 x 0.3889 0.5~1.5<2.0
Wetland cattail f x = e 0.2287 x 2 + 0.4973 x 4.6470 0.5~1.0<1.5
Phragmites communis f x = e 0.7301 x 2 + 0.8203 x + 1.3237 0.5~1.0<1.5
Meadow reed f x = e 1.2339 x 2 + 3.9315 x 0.7778 0.8~2.0<2.5
Achnatherum splendens f x = e 4.968 x 2 + 8.8324 x 1.8763 0.5~1.5<2.0
Suaeda salsa f x = e 0.6179 x 2 + 0.9644 x 0.7972 0.5~1.0<1.5
Nitraria tangutorum f x = e 0.2107 x 2 + 1.0164 x 0.7163 2.0~3.0<3.5
Tamarix chinensis f x = e 0.1194 x 2 + 0.7164 x 0.6668 2.0~4.0<4.0
Kalidium foliatum f x = e 0.4591 x 2 + 0.8925 x + 1.0135 0.8~1.0<1.5
Table 3. Critical value of groundwater depth for crop growth and soil salinization in Hetao irrigation area.
Crop D i h i ( m ) Critical Buried Depth of Salinization (m)Optimal Groundwater Depth (m)
Wheat802.091.291.29~2.09
Cron1202.491.29~2.49
Sunflower1352.641.29~2.64
Table 4. Comprehensive set of agricultural water saving programs in the river-loop irrigation area.
Water Conservation
Step
Concrete ContentIntegrated Programs
Z1Z2Z3Z4Z5Z6
Planting structureAdjustment of cropping structure: wheat 5%, maize 25%, sunflower 50%, other 20%.
Drainage water conservationFocusing on the lining of trunk canals, sub-trunk canals, branch canals, etc., with the proportion of backbone canals lined reaching 17% and the coefficient of water utilization of the canal system reaching 0.54%.
Focusing on the lining of trunk canals, sub-trunk canals, branch canals, etc., the proportion of backbone canals lined reaches 20%, and the water utilization coefficient of the canal system reaches 0.55 percent.
Focusing on the lining of trunk canals, sub-trunk canals, branch canals, etc., the proportion of backbone canals lined has reached 23%, and the coefficient of water utilization of the canal system has reached 0.56 percent.
Focusing on the lining of trunk canals, sub-trunk canals, branch canals, etc., the proportion of backbone canals lined has reached 26%, and the coefficient of water utilization of the canal system has reached 0.57%.
Focusing on the lining of trunk canals, sub-trunk canals, branch canals, etc., the proportion of backbone canals lined has reached 29%, and the coefficient of water utilization of the canal system has reached 0.58 percent.
Water conservation in the fieldContinuous implementation of water conservation measures such as field land leveling and border field renovation, and completion of 60% of the task of renovating 5 million mu of medium- and low-yield fields
Continuous implementation of water conservation measures such as field land leveling and border field renovation, and completion of 80% of the task of renovating 5 million mu of medium- and low-yield fields
Continuous implementation of water conservation measures such as field land leveling and border field renovation, and completion of 100% of the renovation of 5 million mu of low- and medium-yield fields
Promote water conservation measures such as piped water, sprinkler irrigation, micro-irrigation, etc., in vegetable and fruit crop production areas, covering 50 percent of their ratios.
Promote water conservation measures such as piped water, sprinkler irrigation, micro-irrigation, etc., in vegetable and fruit crop production areas, covering 70% of their ratios.
Promote water conservation measures such as piped water, sprinkler irrigation, micro-irrigation, etc., in vegetable and fruit crop production areas, covering 90% of their ratios.
Adoption of soil - water conservation techniques, such as no - tillage treatment of landfill - derived residues and extensive mulching, significantly reduces water evaporation between trees. As a result, the effective area for water conservation is increased by 20%.
Adoption of soil water conservation techniques such as no-tillage cultivation of landfill stubble and wide mulching significantly reduces water evaporation between trees and promotes an area of 30 percent.
Adoption of soil water conservation techniques such as no-tillage cultivation of landfill stubble and wide mulching to significantly reduce water evaporation between trees, with the popularization area reaching 40 percent.
Irrigation system optimizationOptimize irrigation management by reducing wheat irrigation quotas by 30 m3/mu, corn by 20 m3/mu, and sunflower unchanged.
Optimize irrigation management by reducing wheat irrigation quotas by 40 m3/mu, corn by 40 m3/mu, and sunflower by 20 m3/mu.
Note: √ indicates that this item is included in the solution.
Table 5. Average annual yellow water consumption under each integrated water conservation program.
ProgrammaticDrainage Water Utilization FactorYellow Water Consumption (Billion m3)Change in Volume (Billion m3)
standard of reference0.49645.390
Z10.5441.33−4.06
Z20.5540.31−5.08
Z30.5639.44−5.96
Z40.5638.67−6.73
Z50.5738.06−7.34
Z60.5837.48−7.91
Table 6. Changes in average groundwater depth in the irrigation district under each scheme.
SchemesGroundwater DepthChange (m)
AnnMarJunSepNovAnnMarJunSepNov
Standard of reference2.062.431.732.231.6200000
Z12.322.622.052.521.940.270.190.320.290.33
Z22.392.672.142.592.030.340.240.410.360.41
Z32.462.722.222.652.110.400.290.490.420.49
Z42.502.742.282.702.150.440.310.550.470.53
Z52.552.782.352.752.220.500.360.620.520.60
Z62.612.832.422.812.290.560.400.690.580.67
Disclaimer/Publisher’s Note: The statements, opinions and data contained in all publications are solely those of the individual author(s) and contributor(s) and not of MDPI and/or the editor(s). MDPI and/or the editor(s) disclaim responsibility for any injury to people or property resulting from any ideas, methods, instructions or products referred to in the content.

