Article

Mechanism Analysis of the Effects of Rainfall Intensity, Grass Coverage, and Slope on Slope Erosion Processes

College of Surveying and Geo-Informatics, North China University of Water Resources and Electric Power, Zhengzhou 450001, China
*
Author to whom correspondence should be addressed.
Water 2025, 17(8), 1194; https://doi.org/10.3390/w17081194
Submission received: 10 March 2025 / Revised: 8 April 2025 / Accepted: 12 April 2025 / Published: 16 April 2025
(This article belongs to the Section Water Erosion and Sediment Transport)

Abstract

:
Rainfall intensity, grass coverage, and slope are key factors controlling runoff and soil erosion processes. However, the coupled analysis and interactive effects of erosion factors under vegetation influence remain at the stage of mechanistic exploration and qualitative research. This study conducted artificial rainfall simulation experiments to compare and analyze runoff and sediment yield patterns on loess slopes to address this issue. The results showed that the impact of rainfall intensity, grass coverage, and slope on total runoff and sediment yield on slopes is the result of multiple factors acting together. The contribution rate of rainfall intensity to the 15 min runoff yield and total runoff yield during different rainfall periods ranged from 56.40% to 94.87% and 58.36% to 77.87%, respectively. The contribution rate of rainfall intensity to the 15 min sediment yield and total sediment yield ranged from 29.62% to 90.92% and 41.81% to 55.07%, respectively. The effect of slope on runoff and sediment yield variation was relatively smaller. The contribution rate of slope to the 15 min runoff yield and total runoff yield ranged from 0.99% to 21.36% and 0.52% to 13.54%, respectively, while its contribution rate to the 15 min sediment yield and total sediment yield ranged from 1.73% to 36.05% and 10.10% to 16.34%, respectively. For grass coverage of 0% and 30%, runoff was primarily controlled by rainfall intensity and slope, whereas for 40% and 50% grass coverage, runoff was mainly influenced by rainfall intensity. For grass coverage of 0%, 30%, and 40%, sediment yield was primarily controlled by rainfall intensity and slope, while for 50% grass coverage, sediment yield was influenced by rainfall intensity, slope, and the rainfall intensity–slope interaction.

1. Introduction

Soil erosion refers to the comprehensive processes of destruction, detachment, transport, and deposition of soil, soil parent material, and other surface components under the influence of precipitation, surface runoff, and subsurface runoff. It is one of the most severe ecological and environmental challenges globally [1,2], often leading to significant soil degradation and posing serious threats to food security, ecological stability, and socio-economic development [3,4,5]. Investigating the relationships between factors such as rainfall intensity, vegetation cover, slope, and slope runoff-sediment yield dynamics constitutes a critical focus in understanding soil erosion mechanisms [6,7].
Rainfall serves as the direct driving force of soil erosion [8], and its impacts are primarily manifested in four aspects: 1. Rainfall intensity and volume determine runoff generation, providing the initial kinetic energy for slope soil erosion [9]. 2. Raindrop impact disperses soil particles through splash effects, supplying sediment sources for erosion [10]. 3. Raindrop-induced turbulence enhances runoff’s sediment transport capacity by increasing flow turbulence [11]. 4. Rainfall intensity critically influences the formation of soil surface crusts. These crusts reduce infiltration, amplify runoff, and subsequently intensify soil detachment and scouring [12]. Lu et al. [13] conducted indoor simulation experiments and found that for every 0.5 mm/min increase in rainfall intensity, the runoff and sediment yield on a loess slope increased by 43.77% and 7.45%, respectively. Liu et al. [14] demonstrated that as rainfall intensity increases, slope runoff and sediment yield also increase.
However, the magnitude of runoff and sediment yield is not only influenced by rainfall intensity but also regulated by slope [15,16]. Slope plays a significant role in the soil erosion process, affecting soil permeability [17] and soil stability [18] on slopes. Su et al. [19] conducted simulated rainfall experiments to reveal the complex relationship between runoff erosion and slope. They found that total runoff increased with slope, while total runoff and sediment yield exhibited a quadratic relationship with slope. Bai et al. [20] also performed simulated rainfall experiments and observed that total runoff decreased as slope increased, primarily due to the reduction in rainfall-receiving area caused by steeper slopes. Additionally, they noted that steeper slopes are more prone to rill erosion, leading to higher sediment yields.
Vegetation cover is recognized as an effective strategy for reducing soil erosion [21,22,23]. At the vegetation canopy level, the canopy primarily influences soil erosion by intercepting rainfall and reducing raindrop kinetic energy [24]. This includes redistributing rainfall through the canopy, reducing the amount of rainfall available for runoff, altering raindrop size and terminal velocity, and modifying raindrop kinetic energy [25,26]. At the near-surface level, vegetation mainly weakens rainfall intensity, reduces runoff potential, increases surface roughness, diminishes the scouring capacity of slope flow, and delays runoff [27]. At the root level, vegetation improves soil properties, enhances soil infiltration, stabilizes soil through root systems, and increases erosion resistance [28,29]. Yan et al. [30] conducted water-scouring experiments and found that as vegetation cover increased, runoff shear stress exhibited an exponential increase, while runoff velocity showed a linear decrease. Chen et al. [31] performed simulated rainfall experiments and discovered that vegetation, through the combined effects of aboveground canopy and root systems, could reduce runoff velocity, increase slope resistance, and thereby regulate slope erosion processes.
Soil erosion is a time-varying process controlled by rainfall and surface runoff. Researchers have conducted extensive studies on the mechanisms of the erosion process and the regulation of water and sediment changes by vegetation, achieving fruitful results [32,33,34]. Current studies primarily focus on the independent effects of single factors, such as rainfall intensity, vegetation coverage, or slope, while the coupling analysis and interactive effects of influencing factors under vegetation coverage remain at the stage of mechanistic exploration and qualitative research. Although some studies have demonstrated the overall inhibitory effect of vegetation on erosion [35], the dynamic changes in the contribution rates of various influencing factors and their interactions to runoff and sediment yield across different rainfall erosion stages under varying vegetation coverage conditions have not been fully quantified. Clarifying the roles and contributions of different influencing factors at various stages of slope erosion under different vegetation coverage conditions is crucial for a deeper understanding of the complex erosion processes under vegetation coverage and for the development of erosion models.
In light of this, this study investigates the effects of grass coverage, rainfall intensity, and slope on the runoff and sediment yield processes on loess slopes through simulated rainfall experiments. It quantifies the contributions of influencing factors and their interactions to runoff and sediment yield at different rainfall erosion stages under vegetation coverage, aiming to provide theoretical support and practical guidance for soil erosion control in the Loess Plateau.

2. Materials and Methods

2.1. Experimental Materials

The experiment was conducted at the Yellow River Water Resources Research Institute’s Model Yellow River Test Base. The simulated rainfall equipment was modified from a side-spray rainfall device, capable of simulating rainfall intensity ranging from 30 to 180 mm·h−1. The soil erosion simulation model for the experiment was a soil tray with an adjustable slope ranging from 0° to 30°, with dimensions of 5 m × 1 m × 0.6 m. The steel tray’s bottom is drilled with 5 mm diameter permeable holes to ensure the free infiltration of soil water. The experimental soil was sourced from the surface loess of the Mangshan region in Gongyi City, Henan Province, located in the third subzone of the Loess Plateau. The grass strip chosen for the experiment was 6 cm tall Kentucky bluegrass (Poa pratensis). Kentucky bluegrass is an annual or winter annual grass in the Poaceae family, preferring warm, dry environments. It is drought-resistant, shade-tolerant, and cold-resistant, with a well-developed root system, strong reproductive and regenerative abilities. The mechanical composition of the soil particles can be referenced from Zhang et al. [36] for the simulated rainfall experiment soil.

2.2. Experimental Design

The air-dried soil samples were sieved through a 10 mm mesh to remove weeds and stones. To ensure the permeability of the soil, a 10 cm thick layer of coarse sand was laid at the bottom of the steel tray. A layered filling and compaction method was used to add the soil, with each layer having a thickness of 10 cm. Based on field surveys of loess slopes under cultivation and abandoned land, the soil bulk density was controlled to be around 1.15 g/cm3. During the soil filling process, care was taken to compact the surroundings to avoid gaps between the soil and the side walls. The grass strips were placed into the soil tray, and the experimental soil was added in layers. Special attention was given to ensure a tight contact between the grass strips and the experimental soil during the filling process. Based on the local vegetation coverage characteristics [37], the grass coverage in the soil trays were set at 0% (bare slope), 30%, 40%, and 50%. The 30%, 40%, and 50% grass coverage conditions were achieved by uniformly arranging five experimental grass strips, each measuring 0.3 m, 0.4 m, and 0.5 m, respectively, on a 5 m slope.
Pre-rainfall was applied to the soil tray with a rainfall intensity of 30 mm·h−1 to bring the initial soil moisture content to approximately 20–25%. Afterward, the rainfall intensity was calibrated and adjusted to the required levels for the experiment. Soil erosion on the Loess Plateau is mainly caused by a few brief, intense rainstorms. Considering the climatic characteristics of the study area and previous research findings [38,39,40], three rainfall intensities (80, 100, and 120 mm/h) were selected for the experiments. According to the standard for short-duration, high-intensity erosive rainfall on the Loess Plateau [41], the rainfall duration (measured from the onset of runoff) was set at 60 min. A new soil flume was used for each rainfall event to ensure consistent initial slope conditions. The study area is located in the hilly and gully region of the Loess Plateau. Literature reviews and field observations indicate that most hills in the region have slopes ranging from 10° to 25° [41,42,43]. Therefore, the experimental slope were set at 10°, 15°, 20°, and 25°. The experimental design is shown in Table 1 (24 different conditions in total), with each rainfall event repeated three times.

2.3. Data Collection

After runoff generation on the slope, sediment samples were collected from the runoff using buckets at the outlet of the experimental tray. The sampling interval was set to 2–4 min, with each sample being collected for 1 min (for the first 10 samples, every 2 min; for the last 10 samples, every 4 min). After each rainfall event, sample data were measured. The total runoff yield collected in each bucket over 1 min was measured, with an accuracy of 0.5 L. The sediment samples in each bucket were then oven-dried and weighed to determine the sediment yield over 1 min, with an accuracy of 0.01 g.

2.4. Data Processing

OriginPro 2022 was used to plot the changes in runoff and sediment yield over time under different conditions. Based on the variation characteristics of runoff and sediment yield during the rainfall process and the readability of the charts, data analysis was performed at 15 min intervals. Excel was used to calculate the runoff and sediment yield for the time periods 0–15 min, 15–30 min, 30–45 min, and 45–60 min, as well as the total runoff and sediment yield for the rainfall duration of 0–15 min, 0–30 min, 0–45 min, and 0–60 min. Minitab 19 was used to analyze the main effects of various factors on the 15 min runoff and sediment yield and the total runoff and sediment yield during different periods (the main effect refers to examining the effect of a single independent variable on the dependent variable while averaging out the effects of other independent variables) [44]. SPSS 27 was used for multiple regression analysis to explore the interactions among various factors. SPSS software was used for analysis of variance (ANOVA), and the contribution rate ( P F ) of each factor was calculated using Formula (1) [44,45]:
P F = S S F ( D O F F × V E r ) S S T × 100
In the formula, P F represents the contribution rate of the factor (%). S S F is the III-type sum of squares of the factor. D O F F is the degrees of freedom of the factor. V E r is the sum of squares of the error. S S T is the total sum of squares of the deviation. During the analysis of variance, statistical analysis software can directly calculate the values for S S F , D O F F , V E r , and S S T .

3. Results

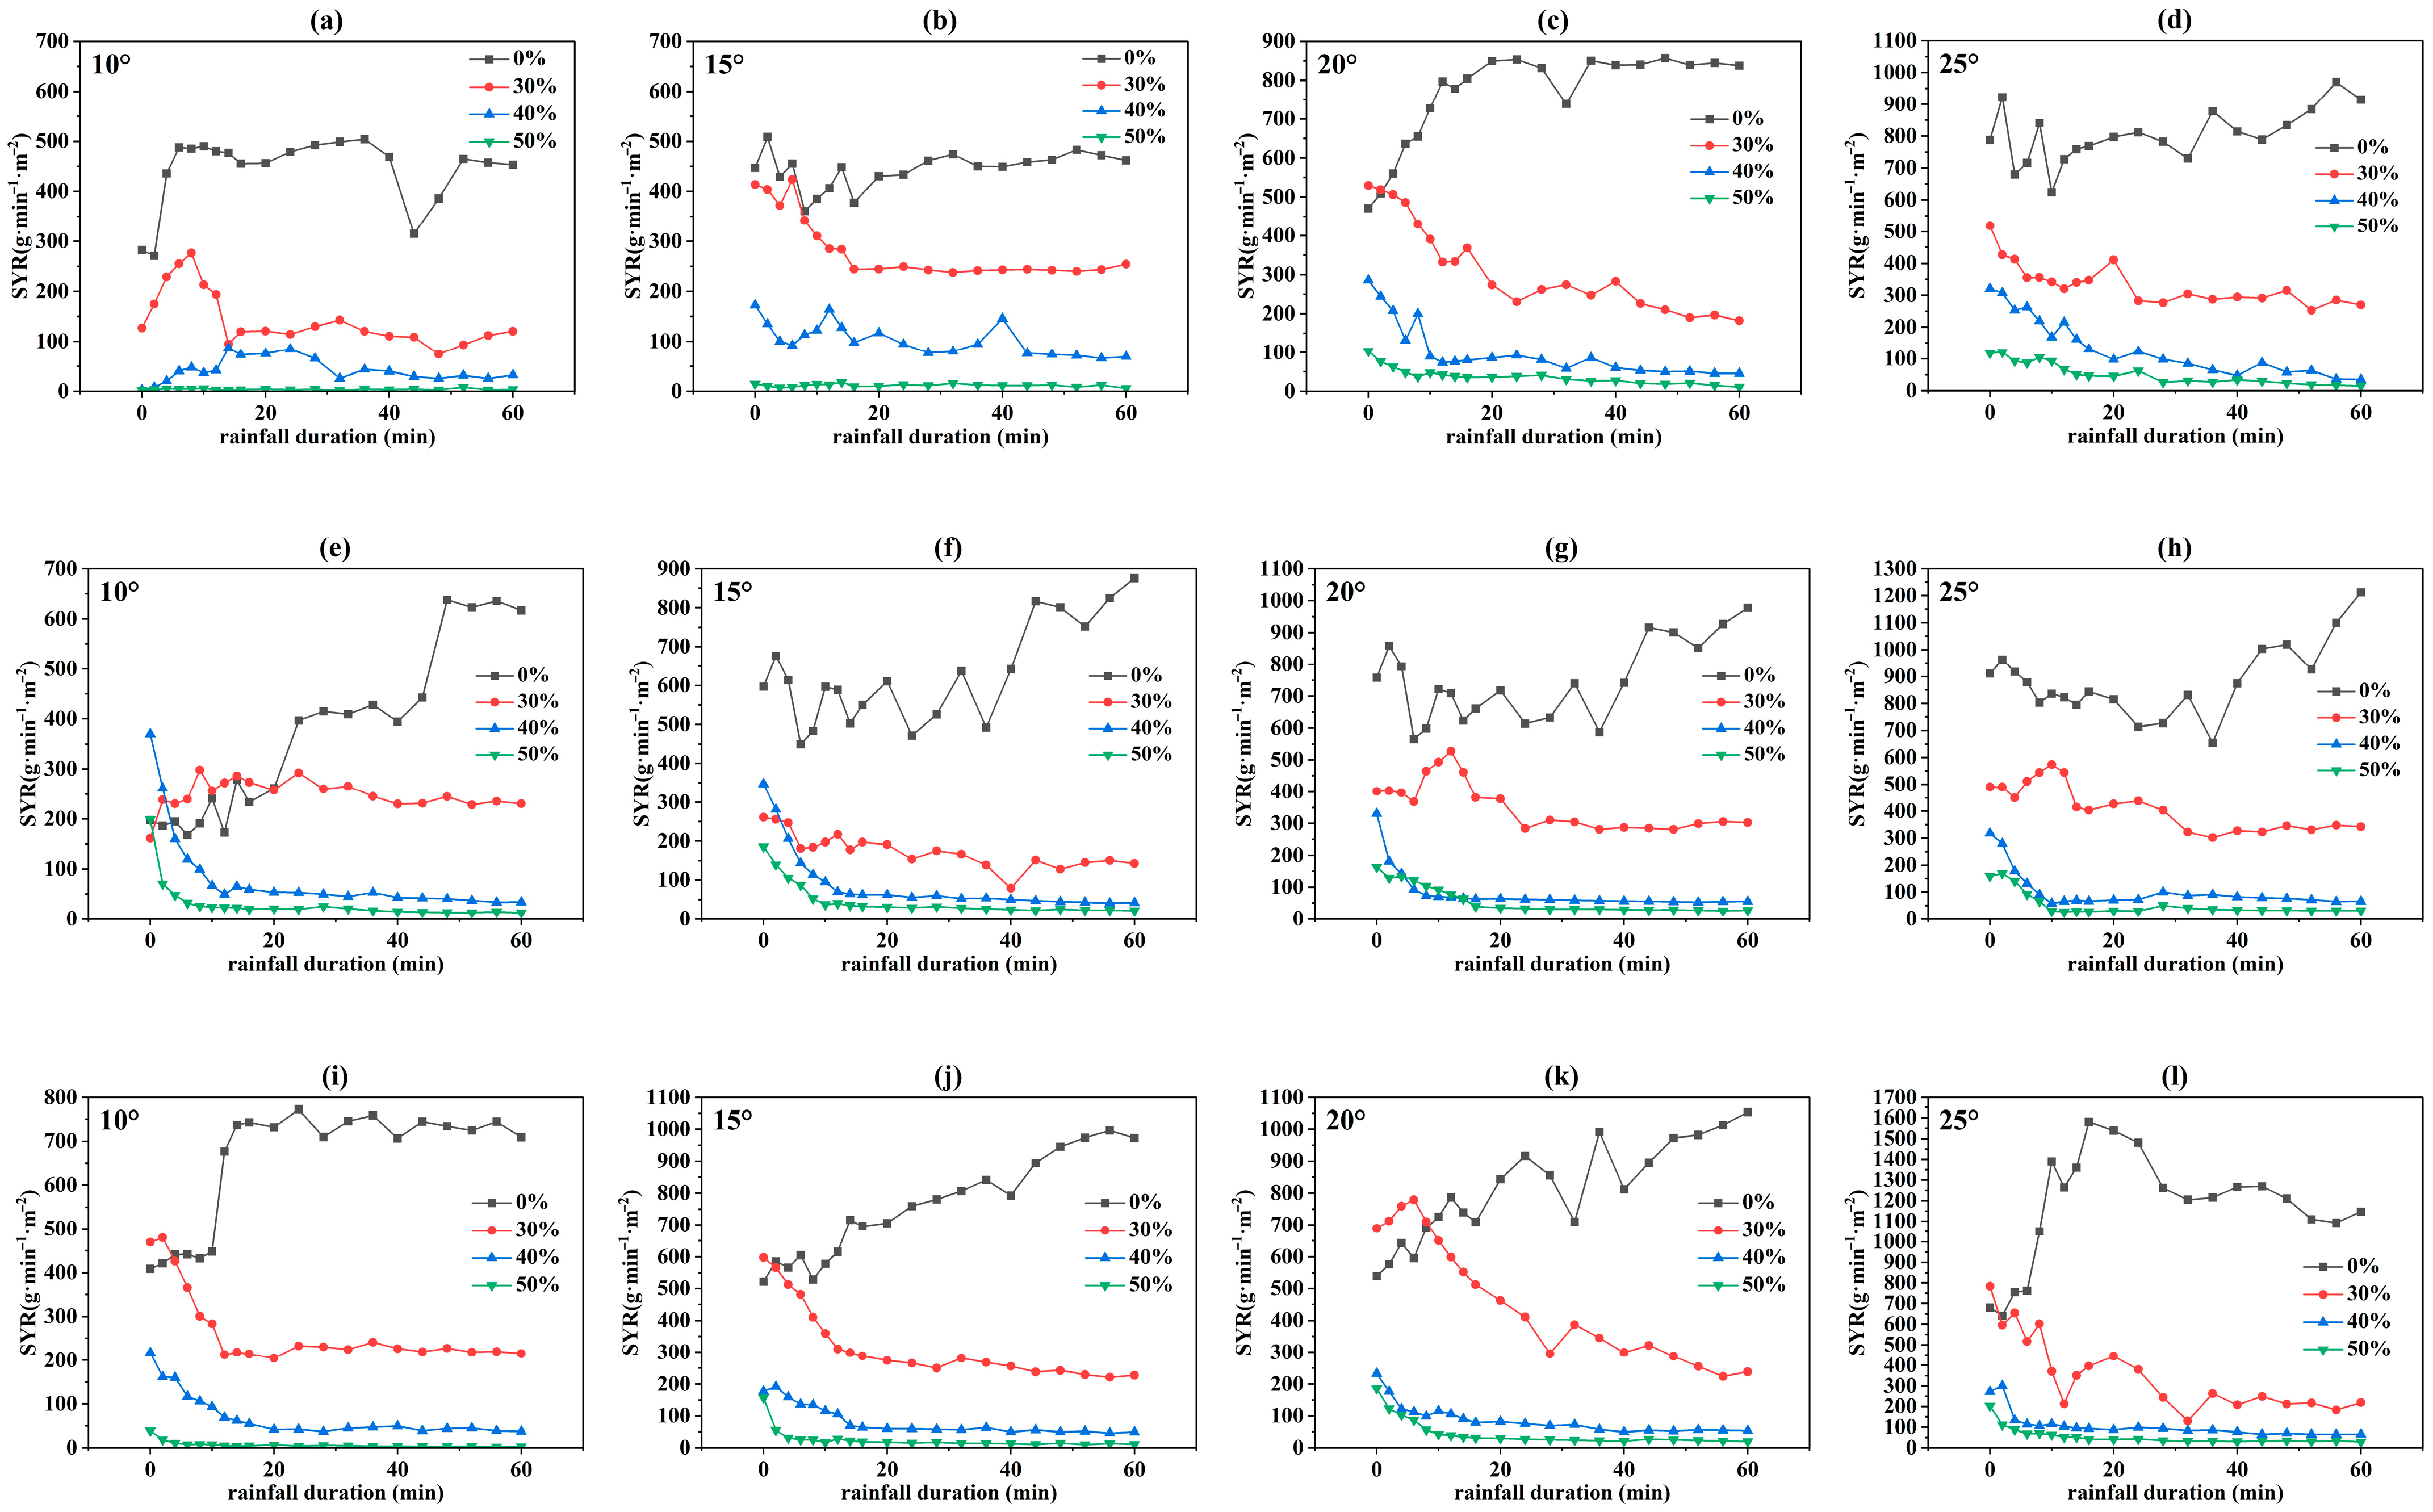
3.1. Characteristics of Runoff and Sediment Yield on Loess Slope Under Different Conditions

The variation trend of runoff rate with rainfall duration under different conditions is shown in Figure 1. After runoff occurs on the slope, the unit-width runoff rate (UWRR) increases rapidly at first and then gradually stabilizes or slowly increases as rainfall continues. This is similar to previous studies conducted on loess slopes [11,14]. Higher rainfall intensity leads to greater rainfall amounts. The impact of raindrops on the soil gradually forms a soil crust, reducing soil infiltration capacity. As a result, more rainfall is converted into runoff, increasing the UWRR and shortening the time required to reach a stable rate. As grass coverage increases, runoff resistance also increases. The root system of the grass improves soil structure and enhances infiltration capacity [46], leading to a decrease in the UWRR. Under the conditions of fixed rainfall intensity and slope length, the UWRR is primarily influenced by the hydraulic slope. A steeper slope increases the conversion of gravitational potential energy into kinetic energy, resulting in a higher runoff rate and a greater stable UWRR.
The variation trend of sediment yield rate over time under different conditions is shown in Figure 2. After the onset of sediment production, the sediment yield rate (SYR) on grass-covered slopes generally exhibits a rapid initial increase, followed by a gradual decline, and then gradually stabilizing as rainfall continues (the reason why the initial rapid increase in SYR cannot be observed in many scenarios in Figure 2 is that under high rainfall intensity, SYR reaches its peak within 2 to 4 min after the initiation of slope runoff). This trend can be attributed to the following factors: In the early stages of rainfall, abundant loose soil particles on the slope result in a high erosion rate. However, as these loose particles are gradually depleted, two key mechanisms contribute to the decline and stabilization of the sediment yield rate. First, soil pores become progressively filled, leading to the formation of soil crusts that reduce soil erodibility. Second, vegetation cover enhances soil stability, impeding sediment transport by runoff, while the presence of shallow overland flow reduces the detachment of soil particles by raindrop impact, ultimately leading to a stable sediment transport capacity of the runoff [47]. On the bare slope, the SYR initially increases sharply and then either gradually stabilizes or exhibits fluctuating increases as rainfall continues. The fluctuations in sediment yield rate are likely due to the development of rills under high-intensity rainfall, where soil crusts are continuously disrupted and reformed, altering the sediment transport dynamics.
Higher rainfall intensity results in stronger raindrop splash erosion, higher runoff velocity, and greater shear force, all of which contribute to increased SYR. Throughout the entire process, the SYR is highest under a rainfall intensity of 120 mm·h−1 and lowest under 80 mm·h−1. Conversely, greater vegetation cover enhances soil stability and increases the resistance of surface runoff, leading to higher surface roughness, reduced sediment transport capacity of shallow overland flow, and lower sediment yield rates. The SYR also increases with slope [48] because steeper slope reduce soil stability, enhance runoff shear stress, facilitate soil particle detachment, and promote rill erosion, resulting in higher sediment production.

3.2. Effect and Contribution Rates of Rainfall Intensity, Grass Coverage, and Slope on Runoff Production

3.2.1. Main Effects of Rainfall Intensity, Grass Coverage, and Slope on Runoff Yield

Figure 3 illustrates the main effect of rainfall intensity, grass coverage, and slope on the 15 min runoff yield at different time intervals during the slope erosion process. Higher rainfall intensity leads to a greater 15 min runoff yield at all time intervals. Compared to 80 mm·h−1 rainfall intensity, the 15 min runoff yield increases by 21.76–28.98% at 100 mm·h−1 and by 49.03–53.93% at 120 mm·h−1. As grass coverage increases, the 15 min runoff yield decreases across all time intervals, demonstrating the runoff reduction effect of vegetation on slopes. For the 15 min runoff yield, the runoff reduction benefits of grass coverage rates of 30%, 40%, and 50% compared to the bare slope were 35.02–36.82%, 36.85–39.41%, and 39.37–41.79%, respectively. An increase in slope results in a gradual increase in 15 min runoff yield. Compared to a 10° slope, the 15 min runoff yield increases by 4.50–11.17% at 15°, 5.15–12.31% at 20°, and 16.97–25.69% at 25°.
Figure 4 shows the main effects of rainfall intensity, grass coverage, and slope on the total runoff yield over different time periods. Higher rainfall intensity results in greater total runoff yield across all time periods. As the rainfall duration increases, the rate of increase in runoff yield becomes more pronounced, with the difference in total runoff yield between adjacent durations remaining nearly constant. Compared to a rainfall intensity of 80 mm·h−1, the total runoff yield increases by 25.40–28.98% at 100 mm·h−1 and by 49.52–51.08% at 120 mm·h−1. Greater grass coverage reduces total runoff yield across all time periods. For the total runoff yield, the runoff reduction benefits of grass coverage rates of 30%, 40%, and 50% compared to the bare slope were 35.02–36.09%, 36.85–38.32%, and 40.55–41.79%, respectively. As slope increases, total runoff yield shows a slight upward trend. The increase in runoff yield is more pronounced at steeper slope. Compared to a 10° slope, total runoff yield increases by 6.50–8.00% at 15°, 6.58–11.17% at 20°, and 17.30–20.39% at 25°.

3.2.2. Interaction Effects of Rainfall Intensity, Grass Coverage, and Slope on Runoff Yield

Following the interaction analysis method used by Li et al. [49], multiple regression analysis was conducted using the regression analysis module in SPSS to examine the relationships between total runoff yield (TRY) and rainfall intensity (R), grass coverage (G), and slope (S), as well as their interaction terms: the rainfall intensity–grass coverage interaction (RG), the rainfall intensity–slope interaction (RS), the grass coverage–slope interaction (GS), and the rainfall intensity–grass coverage–slope interaction (RGS). This analysis aimed to explore the interactive effects of rainfall intensity, grass coverage, and slope on runoff yield. The fitted equation is as follows:
T R Y = 0.667 R 0.251 G + 0.439 S 0.106 G S 0.514 R G S
( R = 0.960 , n = 48 )
The F-test for the fitted regression equation (Equation (2)) reached an extremely significant level (p < 0.01), with all parameter t-tests attaining statistical significance at p < 0.05.
Equation (2) represents a standardized regression model developed after eliminating dimensional influences, describing the relationship between total runoff yield and rainfall intensity, slope, and grass coverage. The regression analysis indicated that both rainfall intensity and slope exerted positive effects on runoff generation, whereas grass coverage, the grass coverage–slope interaction, and the rainfall intensity–grass coverage–slope interaction exhibited negative effects. The finding suggest that the total runoff yield is governed by the combined effects of multiple factors rather than individual factors acting independently.

3.2.3. Contribution Rates of Rainfall Intensity and Slope to Runoff Yield Under Different Grass Coverage

As demonstrated in Equation (2), rainfall intensity and slope exhibited positive effects on slope runoff generation, whereas vegetation coverage showed a negative effect. When the positive effects of rainfall intensity and slope interacted with the negative effect of vegetation coverage, the combined interactions resulted in mutual masking and superposition of the relative contributions of individual factors to runoff generation. This masking phenomenon is not conducive to distinguishing the specific contribution of each factor to runoff yield. Therefore, this study investigates the contributions of rainfall intensity and slope to the runoff generation process under varying grass coverage conditions. To quantify the contribution rates of influencing factors to the slope runoff process, this study employed SPSS variance analysis and Formula (1) to calculate the contribution rates of rainfall intensity, slope, and their interaction to 15 min runoff yield and total runoff yield (0–60 min) under different grass coverage.
During rainfall events, the significance and contribution rates of rainfall intensity, slope, and their interaction to runoff yield variation under different grass coverage are presented in Table 2. According to the variance analysis, rainfall intensity has a highly significant effect on slope runoff yield under all grass coverage conditions (p < 0.001). Except for the case of 50% grass coverage in the 0–60 min period, slope also has a significant effect on runoff yield (p < 0.05). As shown in Table 2, rainfall intensity consistently exhibits the highest contribution rate to runoff yield across different rainfall duration, but the specific contribution rate varies by rainfall stage. For 15 min runoff yield, under 0% and 40% grass coverage, the contribution rate of rainfall intensity first increases and then decreases over time. Under 30% grass coverage, the contribution rate fluctuates over time, reaching its maximum at 30–45 min. Under 50% grass coverage, the contribution rate gradually increases with rainfall duration, peaking at 45–60 min. For total runoff yield (0–60 min), with increasing grass coverage, the contribution rate of rainfall intensity to runoff yield first increases and then decreases, reaching its maximum at 40% grass coverage.
The contribution rate of slope to runoff yield varies more complexly with different grass coverage. For 15 min runoff yield, under 0% grass coverage, the contribution rate of slope gradually decreases as rainfall continues. Under 30% and 40% grass coverage, the contribution rate of slope gradually increases with rainfall duration. Under 50% grass coverage, the contribution rate fluctuates, reaching its maximum during the 0–15 min period. For total runoff yield (0–60 min), as grass coverage increases, the contribution rate of slope to runoff yield shows a gradual decrease. The contribution rate of the rainfall intensity–slope interaction to runoff yield is relatively small. For 15 min runoff yield, the contribution rate generally exhibits a decreasing-then-increasing trend as rainfall progresses. At 0% grass coverage (0–60 min) and 40% grass coverage (30–45 min), the contribution rate of the rainfall intensity–slope interaction is negative, indicating that the interaction’s effect is masked by other factors and cannot be fully reflected. Under 50% grass coverage, the contribution rate of the rainfall intensity–slope interaction reaches its maximum (19.12%) during the 0–15 min period. The error term contribution rate for 15 min runoff yield shows a decreasing trend over time. However, for total runoff yield, the error term contributes significantly, reaching its highest value (32.56%) under 50% grass coverage.

3.3. Effect and Contribution Rates of Rainfall Intensity, Grass Coverage, and Slope on Sediment Yield

3.3.1. Main Effects of Rainfall Intensity, Grass Coverage, and Slope on Sediment Yield

Figure 5 presents the main effects of rainfall intensity, grass coverage, and slope on 15 min sediment yield at different rainfall durations. With increasing rainfall intensity, 15 min sediment yield shows a consistent increasing trend across all time periods. Compared to a rainfall intensity of 80 mm·h−1, sediment yield increases by 5.39–32.77% at 100 mm·h−1 and by 22.59–41.92% at 120 mm·h−1. As grass coverage increases, sediment yield decreases progressively, demonstrating the sediment-reduction effect of grass coverage on slope erosion. The greatest reduction in sediment yield occurs when grass coverage increases from 30% to 40%, while the reduction is smallest when increasing from 40% to 50%. For the 15 min sediment yield, the sediment reduction benefits of grass coverage rates of 30%, 40%, and 50% compared to the bare slope were 32.21–65.35%, 75.85–93.88%, and 89.51–97.83%, respectively. With increasing slope, sediment yield exhibits a rising trend. Compared to a 10° slope, 15 min sediment yield increases by 14.52–43.83% at 15°, 60.77–87.57% at 20°, and 82.96–111.57% at 25°.
Figure 6 presents the main effects of rainfall intensity, grass coverage, and slope on total sediment yield across different rainfall duration. At a given rainfall duration, total sediment yield increases with increasing rainfall intensity. Compared to a rainfall intensity of 80 mm·h−1, total sediment yield increases by 5.67–17.53% at 100 mm·h−1 and by 22.59–29.56% at 120 mm·h−1. With increasing grass coverage, total sediment yield gradually decreases across different rainfall duration, indicating the erosion-reducing effect of vegetation. For the total sediment yield, the sediment reduction benefits of grass coverage rates of 30%, 40%, and 50% compared to the bare slope were 32.21–54.61%, 75.85–88.47%, and 89.51–95.54%, respectively. As slope increases, total sediment yield shows an increasing trend across all rainfall duration. Compared to a 10° slope, total sediment yield increases by 27.33–43.83% at 15°, 68.90–87.57% at 20°, and 93.77–111.57% at 25°. Additionally, as slope increases, the differences in total sediment yield between different rainfall duration become more pronounced.

3.3.2. Interaction Effects of Rainfall Intensity, Grass Coverage, and Slope on Sediment Yield

Following the interaction analysis method used by Li et al. [49], multiple regression analysis was conducted using the regression analysis module in SPSS to examine the relationships between total sediment yield (TSY) and rainfall intensity (R), grass coverage (G), and slope (S), as well as their interaction terms: the rainfall intensity–grass coverage interaction (RG), the rainfall intensity–slope interaction (RS), the grass coverage–slope interaction (GS), and the rainfall intensity–grass coverage–slope interaction (RGS). This analysis aimed to explore the interactive effects of rainfall intensity, grass coverage, and slope on sediment yield. The fitted equation is as follows:
T S Y = 0.332 R 0.435 G + 0.205 S + 0.137 R S 0.577 R G S
( R = 0.933 , n = 48 )
The F-test for the fitted regression equation (Equation (3)) reached an extremely significant level (p < 0.01), with all parameter t-tests attaining statistical significance at p < 0.05.
Equation (3) represents a standardized regression model developed after eliminating dimensional influences, describing the relationship between total sediment yield and rainfall intensity, slope, and grass coverage. The regression analysis indicated that rainfall intensity, slope and the rainfall intensity–slope interaction exerted positive effects on sediment generation, whereas grass coverage and the rainfall intensity–grass coverage–slope interaction exhibited negative effects. The finding suggest that the total sediment yield is governed by the combined effects of multiple factors rather than individual factors acting independently.

3.3.3. Contribution Rates of Rainfall Intensity and Slope to Sediment Yield Under Different Grass Coverage

As demonstrated in Equation (3), rainfall intensity and slope exhibited positive effects on slope sediment generation, whereas vegetation coverage showed a negative effect. When the positive effects of rainfall intensity and slope interacted with the negative effect of vegetation coverage, the combined interactions resulted in mutual masking and superposition of the relative contributions of individual factors to sediment generation. This masking phenomenon is not conducive to distinguishing the specific contribution of each factor to sediment yield. Therefore, this study investigates the contributions of rainfall intensity and slope to the sediment generation process under varying grass coverage conditions. The significance and contribution rates of rainfall intensity, slope, and their interaction on sediment yield during rainfall are analyzed in Table 3. Variance analysis indicates that rainfall intensity has a highly significant effect on sediment yield (p < 0.001), while slope also has a significant effect (p < 0.01). For 15 min sediment yield, at 0% grass coverage, the contribution rate of rainfall intensity to sediment yield gradually increases as rainfall progresses. At 30% and 40% grass coverage, the contribution rate of rainfall intensity first increases and then decreases, reaching its peak at 15–30 min. At 50% grass coverage, the contribution rate of rainfall intensity gradually decreases over time. For total sediment yield (0–60 min), as grass coverage increases, the contribution rate of rainfall intensity to sediment yield gradually decreases over the rainfall duration. The highest contribution rate of rainfall intensity occurs at 0% grass coverage.
The contribution rate of slope to sediment yield varies with different grass coverage. For 15 min sediment yield, at 0% grass coverage, the contribution rate of slope gradually decreases as rainfall progresses. At 30%, 40%, and 50% grass coverage, the contribution rate of slope first increases and then decreases, reaching its peak at 15–30 min, 30–45 min, and 30–45 min, respectively. For total sediment yield (0–60 min), as grass coverage increases, the contribution rate of slope gradually decreases. The interaction between rainfall intensity and slope also plays a non-negligible role. For 15 min sediment yield, at 0%, 30%, and 50% grass coverage, the contribution rate of the rainfall intensity–slope interaction first decreases and then increases over time. At 0% grass coverage, at 30–45 min, the contribution rate becomes negative, indicating that the interaction effect is largely overshadowed by other factors. At 40% grass coverage, the contribution rate first increases and then decreases. At 50% grass coverage, the highest contribution rate occurs at 45–60 min, reaching 16.95%. For total sediment yield, as grass coverage increases, the contribution rate of the rainfall intensity–slope interaction also gradually increases. The error term has a relatively large contribution to sediment yield. At 50% grass coverage, the highest error term contribution rate occurs at 45–60 min, reaching 38.60%.

4. Discussion

Rainfall is the prerequisite for runoff generation on slopes. As shown in Table 2, rainfall intensity has the greatest impact on slope runoff generation under any grass coverage condition. This is basically consistent with the existing research results [14,47,50,51]. For instance, Liu et al. [14] quantified the contributions of slope length, slope, and rainfall intensity to the runoff process. Among them, the rainfall intensity has the greatest impact on the unit-width runoff rate, with a contribution rate of 49.8%. Che et al. [51] studied the contributions of slope and rainfall intensity to runoff yield under two treatments of cover and bare land and found that under heavy rain conditions, rainfall intensity has the greatest impact on slope runoff. Among them, under a rainfall intensity of 94 mm/h, the contribution rate of rainfall intensity was 81.51%; under a rainfall intensity of 125 mm/h, the contribution rate of rainfall intensity was 82.84%.
The following is a discussion on the mechanisms by which various factors influence the slope runoff process. Under different grass coverage conditions, the contribution rate of rainfall intensity to 15 min runoff yield generally first increases and then decreases over time. When grass coverage is 0%, 30%, and 40%, the contribution rate peaks at 30–45 min. This pattern may be attributed to the three-phase process of slope runoff generation: Initial phase: Low runoff generation with a rapid increase. Middle phase: Fluctuations with a gradual increase. Late phase: Slight decrease or relative stabilization. At the onset of rainfall, most of the precipitation is absorbed by the soil, resulting in limited runoff generation. As rainfall continues, the soil aggregate structure deteriorates, causing particle dispersion and movement, which gradually blocks soil pores, leading to reduced porosity and infiltration capacity. Consequently, surface runoff increases rapidly. With further rainfall, soil moisture content continues to rise, further reducing infiltration capacity, causing a gradual increase in surface runoff. Eventually, the slope reaches a stable infiltration rate, and the conversion rate of rainfall to runoff stabilizes, which is consistent with the experimental findings of Dai et al. [52]. When the grass coverage is 50%, the contribution rate peaks at 45–60 min, which can be attributed to the fact that runoff generation on the slope fluctuates and rises slowly during the middle to late stages of rainfall. The contribution rate of slope to 15 min runoff yield shows no clear pattern. As slope increases, the effective rainfall-receiving area of the soil flume decreases, while runoff velocity along the slope increases. For total runoff yield, the contribution rate of rainfall intensity increases with grass coverage, whereas the contribution rate of slope decreases. This may be explained as follows: Rainfall intensity increases total runoff yield by increasing precipitation, which is independent of grass coverage changes. Grass coverage can only intercept rainfall, thereby reducing net surface precipitation, but the intercepted water has a limited impact on total runoff yield over the entire rainfall event. The effective rainfall-receiving area of the soil flume changes only with slope and is not affected by grass coverage. A steeper slope results in higher runoff velocity, reducing infiltration time and thereby generating more runoff. With increasing grass coverage, soil infiltration capacity improves, and surface roughness increases, leading to reduced runoff velocity and prolonged infiltration time. This enhances infiltration on vegetated slopes and reduces total runoff generation. The reduction in infiltration time caused by slope increase is partially offset by the prolonged infiltration time due to grass coverage, resulting in a decrease in the contribution rate of slope to total runoff and a relative increase in the contribution rate of rainfall intensity. According to Table 2, for grass coverage of 0% and 30%, runoff was primarily controlled by rainfall intensity and slope, whereas for 40% and 50% grass coverage, runoff was mainly influenced by rainfall intensity. Comparing runoff responses to influencing factors at different rainfall duration under the same grass coverage condition and at the same duration under different grass coverage conditions, it was found that runoff at different stages under the same grass coverage condition is more sensitive to changes in influencing factors.
Runoff is the external driving force of soil erosion. As shown in Table 3, except for the period with 50% grass coverage, rainfall intensity has the greatest impact on slope sediment yield, with a contribution rate ranging from 29.62% to 90.92%. This is similar to the results of previous studies. For instance, Huo et al. [53] found that in the process of slope soil erosion under experimental conditions, rainfall intensity is the most important influencing factor, followed by rainfall amount, while slope has the least impact on sediment yield. Cao et al. [54] found that the contribution rates of various influencing factors to the total soil erosion in 60 min of rainfall were as follows: rainfall intensity (52.20%) > slope (17.40%) > sand layer thickness (6.92%).
The following is a discussion on the mechanisms by which various factors influence slope erosion process. Throughout the rainfall process, the variation in sediment yield and the changing contributions of influencing factors reflect the evolution of erosion on loess slopes [44]. For bare slopes, the contribution of rainfall intensity to 15 min sediment yield gradually increases with rainfall duration. This is due to the high erodibility, loose structure, and high porosity of loess soil. Under high-intensity rainfall, raindrop impact causes splash erosion, while surface runoff detaches and transports soil particles, promoting the development of rill erosion. Consequently, sediment yield continuously increases with prolonged rainfall. However, as soil dispersion and transport gradually clog soil pores, a surface crust forms [55], slowing the rate of sediment yield increase. Conversely, the contribution of slope to 15 min sediment yield gradually decreases with increasing rainfall duration. As grass coverage increases, both runoff yield and velocity decrease, reducing the scouring force of runoff on the slope surface and thereby weakening its ability to transport and detach soil particles [56], mitigating soil erosion. Grass coverage protects the soil through canopy interception and coverage at the plant base, reducing raindrop-induced splash erosion and minimizing rill formation. Additionally, plant roots enhance soil aggregation, increase aggregate stability, and improve soil resistance to erosion. Consequently, for slopes with 30% and 40% grass coverage, the contribution of rainfall intensity to 15 min sediment yield initially increases and then decreases with rainfall duration. This trend may be attributed to the abundance of loose soil particles in the early stages of rainfall, leading to a rapid increase in runoff velocity and sediment detachment. However, due to the protective effect of vegetation and the gradual formation of soil crusts, sediment yield subsequently decreases rapidly. As runoff velocity stabilizes and soil crust formation continues, sediment yield declines gradually or remains stable. For 50% grass coverage, sediment yield rapidly decreases within the first 10 min and then stabilizes, with the contribution of rainfall intensity to 15 min sediment yield peaking between 0 and 15 min. Slope exerts a significant influence on sediment yield; as slope steepness increases, soil stability decreases [57], runoff velocity increases, and soil particles are more easily detached by runoff, leading to intensified rill erosion. At 50% grass coverage, the contribution of slope to 15 min sediment yield reaches a maximum of 36.05% between 30 and 45 min. As grass coverage increases, the influence of slope on sediment yield gradually strengthens. Regarding total sediment yield, as grass coverage increases, the contribution of rainfall intensity decreases, while the contributions of slope and the rainfall intensity–slope interaction increase. This may be because, under low vegetation cover, rainfall intensity is the dominant controlling factor, as unprotected soil is more susceptible to erosion under heavy rainfall. With increasing grass coverage, vegetation reduces the direct impact of rainfall on slope erosion, thereby amplifying the relative influence of slope and the rainfall intensity–slope interaction. As shown in Table 3, for grass coverage of 0%, 30%, and 40%, sediment yield was primarily controlled by rainfall intensity and slope, while for 50% grass coverage, sediment yield was influenced by rainfall intensity, slope, and the rainfall intensity–slope interaction.
In the process of quantifying the contributions of factors and their interactions under the influence of vegetation to runoff and soil erosion at different stages of rainfall erosion, the error term has a relatively large contribution rate to slope runoff and sediment yield. Therefore, the issue of error in such studies is crucial. The following is a discussion on the possible sources of error and their mechanisms. Firstly, one source of error may be the instability of rainfall. We calculated the rainfall intensity based on a constant rain rate. However, the precision of the rainfall intensity simulated by the rainfall simulator is only about 80%, which makes the rainfall from the simulator have a certain degree of non-uniformity. This can cause the runoff and sediment yield from the slope to fluctuate, sometimes high and sometimes low, leading to errors that affect the validation and evaluation of the simulation results. Secondly, another source of error may be the differences in soil structure among different soil flumes (such as soil porosity). Although we strictly followed the layered soil filling and compaction, there are still minor differences in soil structure (such as soil porosity) among different soil flumes. These differences may lead to different runoff and sediment yield responses among the soil flumes, increasing the variability of the results and affecting the accuracy of the calculation of the contribution rates of rainfall intensity and slope in the analysis of variance. Additionally, the variability in initial soil moisture content may also be a source of error. Although a pre-rainfall test was conducted to control the initial soil moisture content to be basically consistent, there are still some differences. Under the same rainfall intensity and slope conditions, areas with higher initial moisture content may generate runoff more quickly and have a greater sediment yield, thereby affecting the accurate assessment of the contribution rates of rainfall intensity and slope.
This study, through simulated rainfall experiments with controlled factors, investigated the effects of rainfall intensity, grass coverage, and slope on the runoff and soil erosion processes on loess slopes. However, the experimental setup of simulated rainfall cannot fully replicate the complex natural conditions (such as longer-duration rainfall events, and rainfall events with alternating strong and weak intensities). Therefore, the results obtained from simulated rainfall experiments need further research and validation when applied to practical production. Under the experimental conditions of this study, the sampling density of runoff sediment obtained through time-weighted sampling is relatively low, which may result in failure to fully capture the peak of sediment yield during rainfall. In light of this, future research can consider adopting flow-weighted sampling to collect samples so as to obtain more representative samples throughout the entire rainfall process. Although this study has analyzed the effects of grass coverage, rainfall intensity, and slope on the soil erosion process on loess slopes, it did not consider the effects of slope length changes and root density on the erosion process. Future research will incorporate experimental designs that include slope length and root density to further investigate runoff and sediment yield patterns on loess slope.

5. Conclusions

This study analyzed the effects of rainfall intensity, grass coverage, and slope on runoff and sediment yield on slopes through artificial rainfall simulation experiments. The main effects and interaction effects of different influencing factors on runoff and sediment yield under various rainfall duration were explored, and the contribution rate of the influencing factors of the downhill surface erosion process of different grass coverage was clarified. The main conclusions are as follows:
(1)
The impact of rainfall intensity, grass coverage, and slope on total runoff and sediment yield on slopes is the result of multiple factors acting together. According to the interaction analysis method, the interaction effects of rainfall intensity, grass coverage, and slope are different on the slope total runoff yield and total sediment yield.
(2)
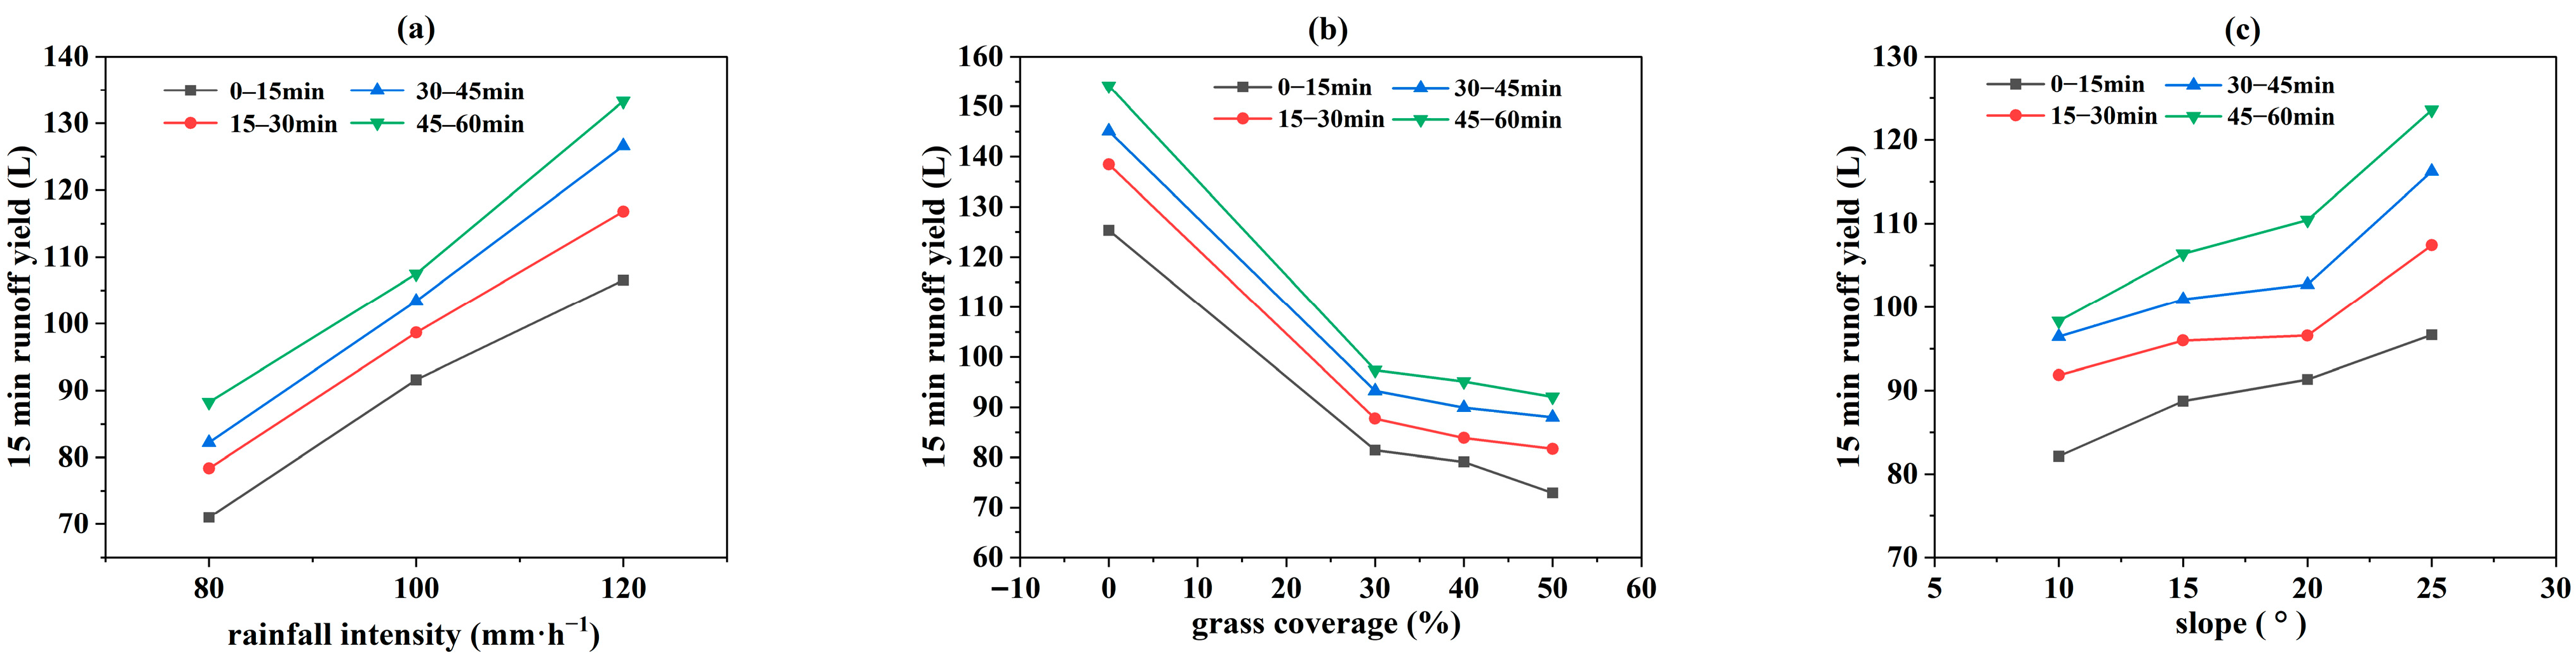
Rainfall intensity significantly affects runoff variation across different grass coverage (p < 0.001). For grass coverage of 0% and 30%, runoff was primarily controlled by rainfall intensity and slope, whereas for 40% and 50% grass coverage, runoff was mainly influenced by rainfall intensity. The contribution of rainfall intensity to 15 min runoff yield and total runoff yield ranged from 56.40% to 94.87% and 58.36% to 77.87%, respectively. The effect of slope on runoff variation was relatively minor, with contributions of 0.99% to 21.36% for 15 min runoff yield and 0.52% to 13.54% for total runoff yield. As grass coverage increased, the contribution of slope to total runoff yield showed a decreasing trend.
(3)
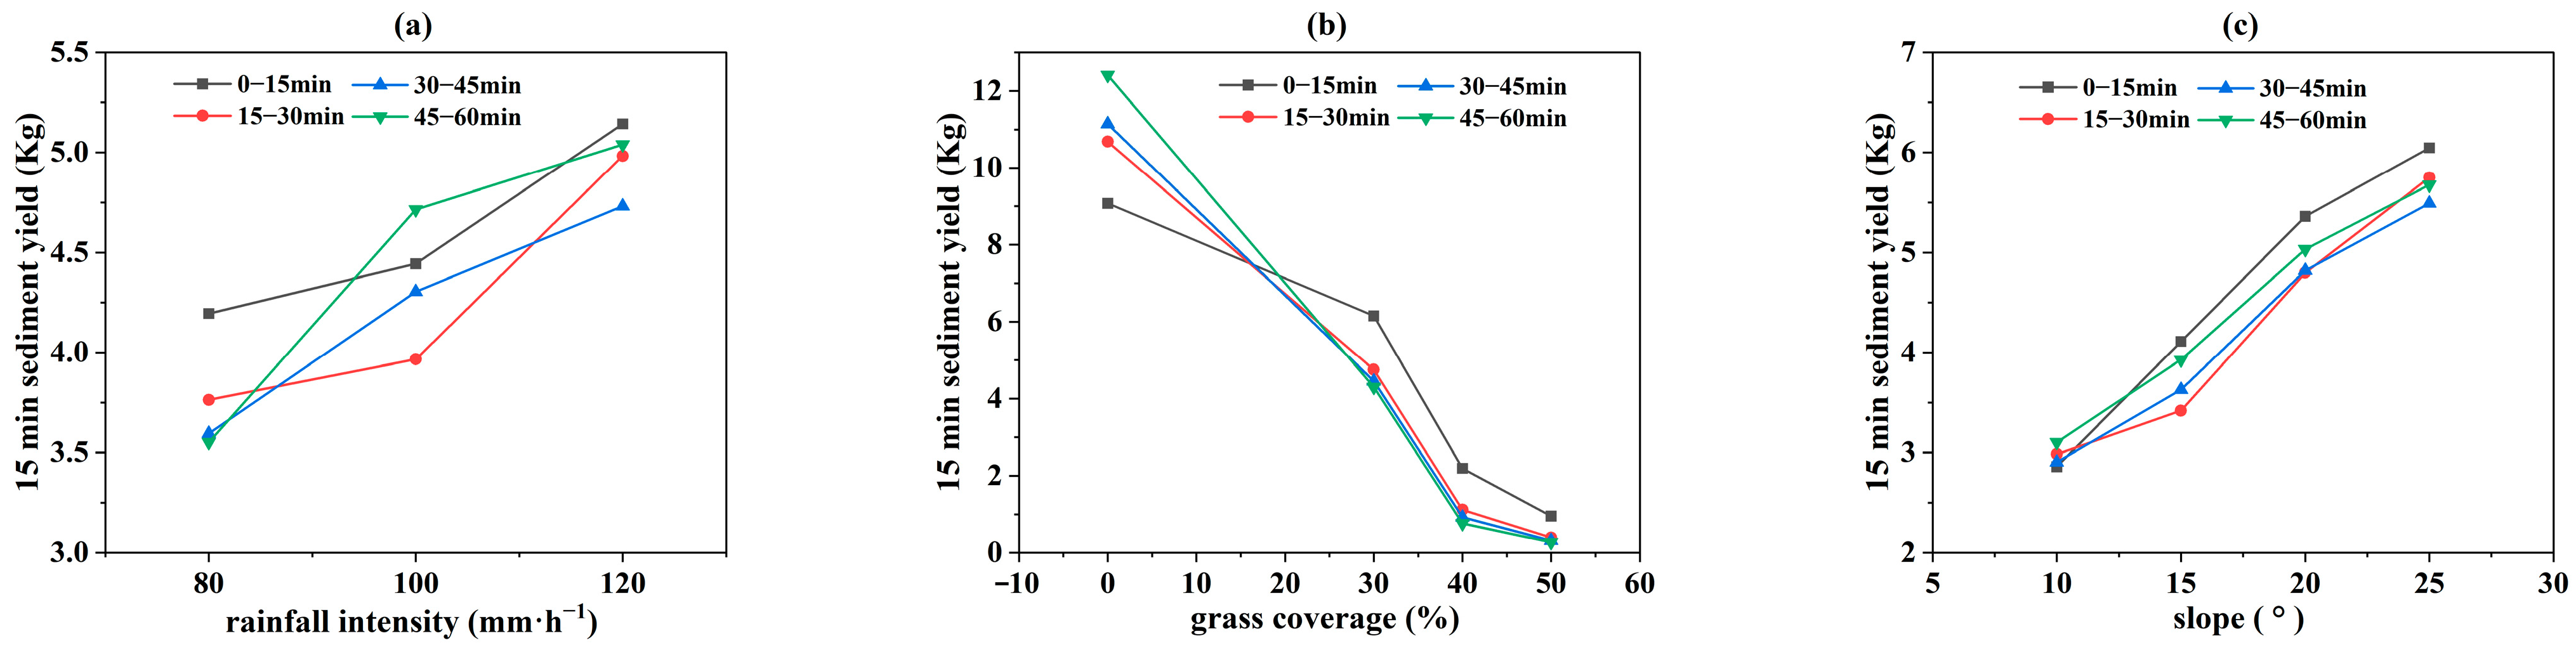
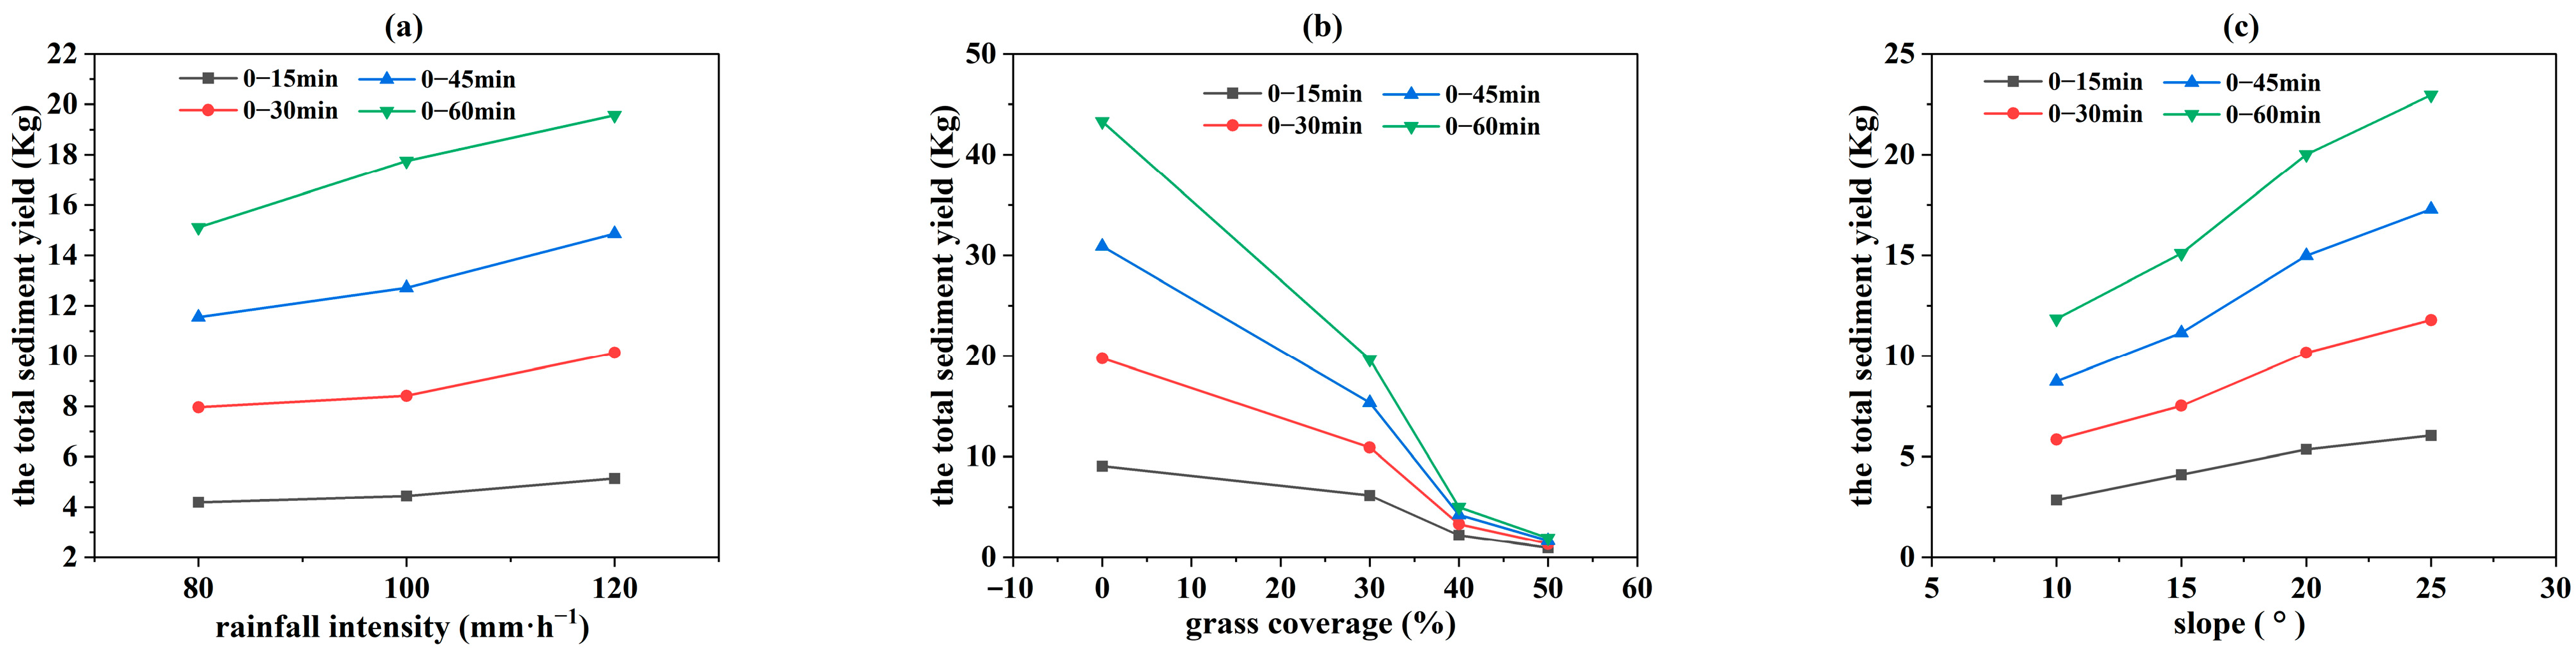
Rainfall intensity had a significant impact on sediment yield across different grass coverage (p < 0.001), while slope also significantly influenced sediment yield (p < 0.01). For grass coverage of 0%, 30%, and 40%, sediment yield was primarily controlled by rainfall intensity and slope, while for 50% grass coverage, sediment yield was influenced by rainfall intensity, slope, and the rainfall intensity–slope interaction. The contribution of rainfall intensity to 15 min sediment yield and total sediment yield ranged from 29.62% to 90.92% and 41.81% to 55.07%, respectively. The contribution of slope to 15 min sediment yield and total sediment yield ranged from 1.73% to 36.05% and 10.10% to 16.34%, respectively. As grass coverage increased, the contribution of slope to total sediment yield exhibited an increasing trend.
(4)
The effects of rainfall intensity and slope on runoff and sediment yield varied across different time periods under different grass coverage. With increasing grass coverage, the influence of the rainfall intensity–slope interaction on runoff and sediment yield generally increased, particularly in relation to sediment yield. The contribution of the rainfall intensity–slope interaction to 15 min sediment yield and total sediment yield ranged from −1.69% to 16.95% and 0.14% to 8.97%, respectively.

Author Contributions

Overall design, Z.H.; methodology, G.Y. and S.H.; software, Z.H. and R.Z.; formal analysis, S.H. and H.T.; writing—original draft preparation, G.Y.; writing—review and editing, Z.H. All authors have read and agreed to the published version of the manuscript.

Funding

Open Project of the Key Laboratory of Soil and Water Conservation on the Loess Plateau, Ministry of Water Resources (WSCLP202201); National Natural Science Foundation of China (U214320029); the Natural Science Foundation of Henan Province (252300420859).

Data Availability Statement

Data available on request due to privacy: the data presented in this study are available on request from the corresponding author.

Acknowledgments

We would like to express our respect and gratitude to the anonymous reviewers and editors for their professional comments and suggestions.

Conflicts of Interest

The authors declare no conflicts of interest.

Abbreviations

The following abbreviations are used in this manuscript:
UWRRthe unit-width runoff rate
SYRthe sediment yield rate

References

  1. Omidvar, E.; Hajizadeh, Z.; Ghasemieh, H. Sediment yield, runoff and hydraulic characteristics in straw and rock fragment covers. Soil. Tillage Res. 2019, 194, 104324. [Google Scholar] [CrossRef]
  2. Yu, Y.; Zhao, W.; Martinez-Murillo, J.F.; Pereira, P. Loess Plateau: From degradation to restoration. Sci. Total Environ. 2020, 738, 140206. [Google Scholar] [CrossRef] [PubMed]
  3. Wang, J.; Lu, P.; Valente, D.; Petrosillo, I.; Babu, S.; Xu, S.; Li, C.; Huang, D.; Liu, M. Analysis of soil erosion characteristics in small watershed of the loess tableland Plateau of China. Ecolo Indic. 2022, 137, 108765. [Google Scholar] [CrossRef]
  4. Borrelli, P.; Robinson, D.A.; Panagos, P.; Lugato, E.; Yang, J.E.; Alewell, C.; Wuepper, D.; Montanarella, L.; Ballabio, C. Land use and climate change impacts on global soil erosion by water (2015–2070). Proc. Natl. Acad. Sci. USA 2020, 117, 21994–22001. [Google Scholar] [CrossRef]
  5. Nguyen, T.T.; Grote, U.; Neubacher, F.; Rahut, D.B.; Do, M.H.; Paudel, G.P. Security risks from climate change and environmental degradation: Implications for sustainable land use transformation in the Global South. Sustainability 2023, 63, 101322. [Google Scholar] [CrossRef]
  6. Yu, X.; Bi, H. Soil and Water Conservation; China Forestry Press: Beijing, China, 2013. [Google Scholar]
  7. Wei, S.; Zhang, K.; Liu, C.; Cen, Y.; Xia, J. Effects of different vegetation components on soil erosion and response to rainfall intensity under simulated rainfall. Catena 2024, 235, 107652. [Google Scholar] [CrossRef]
  8. Assouline, S.; Ben-Hur, M. Effects of rainfall intensity and slope gradient on the dynamics of interrill erosion during soil surface sealing. Catena 2006, 66, 211–220. [Google Scholar] [CrossRef]
  9. Serrano-Muela, M.P.; Nadal-Romero, E.; Lana-Renault, N.; González-Hidalgo, J.C.; López-Moreno, J.I.; Beguería, S.; Sanjuan, Y.; García-Ruiz, J.M. An exceptional rainfall event in the central western Pyrenees: Spatial patterns in discharge and impact. Land Degrad. Dev. 2015, 26, 249–262. [Google Scholar] [CrossRef]
  10. Rachman, A.; Anderson, S.H.; Gantzer, C.J.; Thompson, A.L. Influence of long-term cropping systems on soil physical properties related to soil erodibility. Soil Sci. Soc. Am. J. 2003, 67, 637–644. [Google Scholar]
  11. Shen, H.; Zheng, F.; Wen, L.; Han, Y.; Hu, W. Impacts of rainfall intensity and slope gradient on rill erosion processes at loessial hillslope. Soil Tillage Res. 2016, 155, 429–436. [Google Scholar] [CrossRef]
  12. Feng, X.; Vico, G.; Porporato, A. On the effects of seasonality on soil water balance and plant growth. Water Resour. Res. 2012, 48, W05543. [Google Scholar] [CrossRef]
  13. Lu, K.; Li, Z.; Zhang, X.; Yu, G. Experimental Study on Law of Runoff-Erosion-Sediment Yield Under Indoor Simulated Rainfall Condition. J. Soil Water Conserv. 2011, 25, 6–9. [Google Scholar]
  14. Liu, R.; Yu, X.; Cai, Q.; Sun, L.; Fang, H.; Jia, G.; He, J. Erosion process of loess slope and influencing factors in the loess hilly-gully region, China. Chin. J. Appl. Ecol. 2021, 32, 2886–2894. [Google Scholar]
  15. Lin, Q.; Xu, Q.; Wu, F.; Li, T. Effects of wheat in regulating runoff and sediment on different slope gradients and under different rainfall intensity. Catena 2019, 183, 104196. [Google Scholar] [CrossRef]
  16. Ran, Q.; Wang, F.; Gao, J. Modelling Effects of Rainfall Patterns on Runoff Generation and Soil Erosion Processes on slope. Water 2019, 11, 2221. [Google Scholar] [CrossRef]
  17. Zhu, P.; Zhang, G.; Wang, C.; Chen, S.; Wan, Y. Variation in soil infiltration properties under different land use/cover in the black soil region of Northeast China. Int. Soil Water Conserv. Res. 2024, 12, 379–387. [Google Scholar] [CrossRef]
  18. Quan, X.; He, J.; Cai, Q.; Sun, L.; Li, X.; Wang, S. Soil erosion and deposition characteristics of slope surfaces for two loess soils using indoor simulated rainfall experiment. Soil Tillage Res. 2020, 204, 104714. [Google Scholar] [CrossRef]
  19. Su, Y.; Li, P.; Ren, Z.; Xiao, L.; Wang, T.; Zhang, J.; Liu, Z. Effect of Slope Gradient on the Process of Runoff and Sediment Yield and Water Sediment Relation on the Loess Slope. Res. Soil Water Conserv. 2020, 27, 118–122. [Google Scholar]
  20. Bai, Y.; He, J.; Sun, L.; Tian, L.; Cai, Q.; Wang, M. Analysis of slope erosion characteristics and physical meaning interpretation for two typical loess. Sci. Soil Water Conserv. 2024, 22, 36–45. [Google Scholar]
  21. Zhao, J.; Wei, W.; Duan, X. Response of the runoff and sediment process on loess slope to the vertical structure changes of three shrub and grass vegetations under simulated rainfall. Acta Ecol. Sin. 2021, 41, 8602–8611. [Google Scholar]
  22. Zhang, L.; Jia, G.; Lv, X.; Lei, Z.; Liu, R.; Zhang, X. Research of Soil Erosion Thresholds on the Lower slope of Different Vegetation Cover in Typical Areas of Loess Plateau. J. Soil Water Conserv. 2023, 37, 187–198. [Google Scholar]
  23. Liu, R.; Thomas, B.W.; Shi, X.; Zhang, X.; Wang, Z.; Zhang, Y. Effects of ground cover management on improving water and soil conservation in tree crop systems: A meta-analysis. Catena 2021, 199, 105085. [Google Scholar] [CrossRef]
  24. Zore, A.; Bezak, N.; Šraj, M. The influence of rainfall interception on the erosive power of raindrops under the birch tree. J. Hydrol. 2022, 613, 128478. [Google Scholar] [CrossRef]
  25. Geißler, C.; Nadrowski, K.; Kühn, P.; Baruffol, M.; Bruelheide, H.; Schmid, B.; Scholten, T. Kinetic energy of throughfall in subtropical forests of SE China–effects of tree canopy structure, functional traits, and biodiversity. PLoS ONE 2013, 8, e49618. [Google Scholar] [CrossRef]
  26. Reid, L.M.; Lewis, J. Rates, timing, and mechanisms of rainfall interception loss in a coastal redwood forest. J. Hydrol. 2009, 375, 459–470. [Google Scholar] [CrossRef]
  27. Li, J.; Li, L.; Wang, W.; Kang, H.; Guo, M.; Huang, J.; Wang, Y.; Lou, Y.; Tong, X.; Nie, H. Hydrological and erosion responses of steep spoil heaps to taproot and fibrous root grasses under simulated rainfalls. J. Hydrol. 2023, 618, 129169. [Google Scholar] [CrossRef]
  28. Wang, B.; Zheng, F.; Guan, Y. Improved USLE-K factor prediction: A case study on water erosion areas in China. Int. Soil Water Conserv. 2016, 4, 168–176. [Google Scholar] [CrossRef]
  29. Mei, X.; Zhu, Q.; Ma, L.; Zhang, D.; Wang, Y.; Hao, W. Effect of stand origin and slope position on infiltration pattern and preferential flow on a Loess hillslope. Land Degrad. Dev. 2018, 29, 1353–1365. [Google Scholar] [CrossRef]
  30. Yan, S.; Zhu, B.; Bian, H. Variation characteristics of flow length of grass slope under different grass strip positions. Trans. Chin. Soc. Agric. Eng. 2021, 37, 116–123. [Google Scholar]
  31. Chen, H.; Wang, D.; Cui, Q.; Wang, B.; Li, J.; Li, Z. Effects of canopy and root of grassland vegetation on erosion processes of the Loess Plateau. Acta Ecol. Sin. 2024, 44, 6841–6853. [Google Scholar]
  32. Han, D.; Deng, J.; Gu, C.; Mu, X.; Gao, P.; Gao, J. Effect of shrub-grass vegetation coverage and slope gradient on runoff and sediment yield under simulated rainfall. Int. J. Sediment Res. 2021, 36, 29–37. [Google Scholar] [CrossRef]
  33. El-Hassanin, A.S.; Labib, T.M.; Gaber, E.I. Effect of vegetation cover and land slope on runoff and soil losses from the watersheds of Burundi. Agric. Ecosyst. Environ. 1993, 43, 301–308. [Google Scholar] [CrossRef]
  34. Shi, P.; Li, P.; Li, Z.; Sun, J.; Wang, D.; Min, Z. Effects of grass vegetation coverage and position on runoff and sediment yields on the slope of Loess Plateau, China. Agric. Water Manag. 2022, 259, 107231. [Google Scholar] [CrossRef]
  35. Nearing, M.; Jetten, V.; Baffaut, C.; Cerdan, O.; Couturier, A.; Hernandez, M.; Le Bissonnais, Y.; Nichols, M.; Nunes, J.; Renschler, C.; et al. Modeling response of soil erosion and runoff to changes in precipitation and cover. Catena 2005, 61, 131–154. [Google Scholar] [CrossRef]
  36. Zhang, P.; Yao, W.; Tang, H.; Xiao, P. Rill morphology change and its effect on erosion and sediment yield on loess slope. Trans. Chin. Soc. Agric. Eng. 2018, 34, 114–119. [Google Scholar]
  37. Lv, X.; Zuo, Z.; Sun, J.; Ni, Y.; Wang, Z. Climatic and human-related indicators and their implications for evapotranspiration management in a watershed of Loess Plateau, China. Ecol. Indic. 2019, 101, 143–149. [Google Scholar] [CrossRef]
  38. Zhou, P.; Wang, Z. A study on rainstorm causing soil erosion in the loess plateau. J. Soil Water Conserv. 1992, 6, 1–5. [Google Scholar]
  39. Sun, R.; Ma, L.; Zhang, S.; Yu, Y.; Shen, M.; Zhang, H.; Wang, D.; Yang, Y.; Zhang, J.; Zhang, Y.; et al. Study on Landscape Patches Influencing Hillslope Erosion Processes and Flow Hydrodynamics in the Loess Plateau of Western Shanxi Province, China. Water 2020, 12, 3201. [Google Scholar] [CrossRef]
  40. Qin, W.; Guo, Q.; Cao, W.; Yin, Z.; Yan, Q.; Shan, Z.; Zheng, F. A new RUSLE slope length factor and its application to soil erosion assessment in a Loess Plateau watershed. Soil Tillage Res. 2018, 182, 10–24. [Google Scholar] [CrossRef]
  41. Zhou, P.; Wang, Z. Soil erosion storm rainfall standard in the Loess Plateau. J. Soil. Water Conserv. 1987, 7, 38–44. [Google Scholar]
  42. The State Council. Regulations on Soil and Water Conservation Work; The State Council: Beijing, China, 1982. [Google Scholar]
  43. Yang, Y.F.; Wang, B.; Wang, G.L.; Li, Z.S. Ecological regionalization and overview of the Loess Plateau. Acta Ecol. Sin. 2019, 39, 7389–7397. [Google Scholar]
  44. Cao, X.; Xie, L.; Zhang, F.; Yang, M.; Li, Z. Quantifying the contributions of sand layer characteristic to variations of runoff and sediment yields from sand-covered loess slope during simulated rainfall. Acta Geogr. Sin. 2019, 74, 128–140. [Google Scholar]
  45. Aber, S.; Salari, D.; Parsa, M.R. Employing the Taguchi method to obtain the optimum conditions of coagulation–flocculation process in tannery wastewater treatment. Chem. Eng. J. 2010, 162, 127–134. [Google Scholar] [CrossRef]
  46. Papanicolaou, A.N.; Abban, B.K.B.; Dermisis, D.C.; Giannopoulos, C.P.; Flanagan, D.C.; Frankenberger, J.R.; Wacha, K.M. Flow resistance interactions on hillslopes with heterogeneous attributes: Effects on runoff hydrograph characteristics. Water Resour. Res. 2018, 54, 359–380. [Google Scholar] [CrossRef]
  47. Tian, P.; Qiu, H.; Feng, Y.; Wu, H.; Wu, T.; Liu, M. Effects of Rainfall Intensity and Slope Gradient on Runoff and Sediment Production and Erosion Dynamic Process on Red Soil Slope. Res. Soil Water Conserv. 2020, 27, 106997. [Google Scholar]
  48. Nang, Y.W.; Onodera, S.I.; Wang, K.; Shimizu, Y.; Saito, M. Slope gradient effects on sediment yield of different land cover and soil types. Water 2024, 16, 1419. [Google Scholar] [CrossRef]
  49. Li, J.; Cai, Q.; Sun, L.; Chen, J. Analysis of interaction effects of rainfall intensity, slope degree and slope length on rill erosion. Sci. Soil Water Conserv. 2011, 9, 8–13. [Google Scholar]
  50. Zhai, S. Research on Effect of the Slope Planting Grass to Soil Erosion Process in Purple Soil Region. Master’s Thesis, Fujian Normal University, Fujian, China, 2016. [Google Scholar]
  51. Che, M. Effects of Different Rainfall Intensities and Slope Gradients on Water Conservation of Straw Mulch. Master’s Thesis, Sichuan Agricultural University, Sichuan, China, 2016. [Google Scholar]
  52. Dai, J.; Zha, X.; Huang, S.; Chen, S.; Zhai, S.; Wang, L.; Liu, C. Effects of Slope Gradients on Erosion Under Different Vegetation Coverage on Purple Slopes. J. Soil Water Conserv. 2017, 31, 33–38. [Google Scholar]
  53. Huo, Y.; Bi, H.; Zhu, Y.; Wang, X.; Cai, Z.; Hai, X. Erosion process and its affecting factors of southern typical clay slope under simulated rainfall condition. J. Soil Water Conserv. 2015, 29, 23–26. [Google Scholar]
  54. Cao, X. Simulation Study on Soil Erosion Process of the Sand-Covered Loess Slope. Master’s Thesis, University of Chinese Academy of Sciences, Beijing, China, 2019. [Google Scholar]
  55. Tuo, D.; Xu, M.; Zheng, S.; Li, Q. Sediment-yielding process and its mechanisms of slope erosion in wind-water erosion criss cross region of Loess Plateau, Northwest China. Chin. J. Appl. Ecol. 2012, 23, 3281–3287. [Google Scholar]
  56. He, J.; Li, X.; Cai, Q.; Sun, L.; Wang, S. Experimental study on soil erosion characteristics and spatial variation of runoff velocity on typical loess slopes. Geogr. Res. 2022, 41, 1327–1337. [Google Scholar]
  57. Römkens, M.J.; Helming, K.; Prasad, S.N. Soil erosion under different rainfall intensities, surface roughness, and soil water regimes. Catena 2002, 46, 103–123. [Google Scholar] [CrossRef]
Figure 1. Variation of the unit-width runoff rate (UWRR) with rainfall duration under different rainfall intensity, grass coverage, and slope. Note: groups (ad) are the experiments conducted under a rainfall intensity of 80 mm·h−1; groups (eh) are the experiments conducted under a rainfall intensity of 100 mm·h−1; groups (il) are the experiments conducted under a rainfall intensity of 120 mm·h−1.
Water 17 01194 g001
Figure 2. Variation of the sediment yield rate (SYR) with rainfall duration under different rainfall intensity, grass coverage, and slope. Note: groups (ad) are the experiments conducted under a rainfall intensity of 80 mm·h−1; groups (eh) are the experiments conducted under a rainfall intensity of 100 mm·h−1; groups (il) are the experiments conducted under a rainfall intensity of 120 mm·h−1.
Water 17 01194 g002
Figure 3. Main effects of rainfall intensity, grass coverage, and slope on the 15 min runoff yield at different rainfall duration. Note: (a) is the main effect plot of rainfall intensity on 15 min runoff yield; (b) is the main effect plot of grass coverage on 15 min runoff yield; (c) is the main effect plot of slope on 15 min runoff yield.
Water 17 01194 g003
Figure 4. Main effects of rainfall intensity, grass coverage, and slope on total runoff yield across different rainfall duration. Note: (a) is the main effect plot of rainfall intensity on total runoff yield; (b) is the main effect plot of grass coverage on total runoff yield; (c) is the main effect plot of slope on total runoff yield.
Water 17 01194 g004
Figure 5. Main effects of rainfall intensity, grass coverage, and slope on 15 min sediment yield under different rainfall duration. Note: (a) is the main effect plot of rainfall intensity on 15 min sediment yield; (b) is the main effect plot of grass coverage on 15 min sediment yield; (c) is the main effect plot of slope on 15 min sediment yield.
Water 17 01194 g005
Figure 6. Main effects of rainfall intensity, grass coverage, and slope on total sediment yield under different rainfall duration. Note: (a) is the main effect plot of rainfall intensity on total sediment yield; (b) is the main effect plot of grass coverage on total sediment yield; (c) is the main effect plot of slope on total sediment yield.
Water 17 01194 g006
Table 1. Experimental design.
Rainfall Intensity (mm·h−1)Grass Coverage (%)Slope (°)
80030405010152025
100030405010152025
120030405010152025
Table 2. Significance and contribution rates of factors influencing runoff yield at different rainfall stages based on variance analysis.
Grass Coverage
(%)
Time Period (min)Rainfall Intensity (mm·h−1)Slope (°)InteractionError
Sig P F Sig P F Sig P F P F
00–150.000 ***56.40.000 ***21.360.000 ***5.1917.05
15–300.000 ***73.890.000 ***18.40.2290.47.31
30–450.000 ***79.870.000 ***11.920.001 **2.795.42
45–600.000 ***72.790.000 ***7.360.000 ***10.459.4
0–600.000 ***58.360.000 ***13.540.735−0.2828.38
300–150.000 ***78.270.000 ***4.540.000 ***6.6910.5
15–300.000 ***78.210.000 ***8.130.038 *2.2311.43
30–450.000 ***82.610.000 ***12.960.003 **1.253.18
45–600.000 ***72.40.000 ***20.980.000 ***4.012.61
0–600.000 ***70.530.000 ***7.450.000 ***2.6919.33
400–150.000 ***77.520.013 *1.090.000 ***9.2512.14
15–300.000 ***90.350.019 *1.220.028 *1.526.91
30–450.000 ***93.060.000 ***3.010.000 ***1.971.96
45–600.000 ***89.990.000 ***6.930.000 ***1.531.55
0–600.000 ***77.870.000 ***2.140.000 ***1.6418.35
500–150.000 ***63.880.000 ***5.290.000 ***19.1211.71
15–300.000 ***73.730.000 **7.10.000 ***11.487.69
30–450.000 ***93.540.019 *0.990.558−0.135.60
45–600.000 ***94.870.000 ***3.140.001 **0.671.32
0–600.000 ***62.320.0850.520.000 ***3.632.56
Note: *** indicates p < 0.001, ** indicates p < 0.01, and * indicates p < 0.05.
Table 3. Significance and contribution rates of influencing factors on sediment yield at different rainfall durations based on variance analysis.
Grass Coverage
(%)
Time Period (min)Rainfall Intensity (mm·h−1)Slope (°)InteractionError
Sig P F Sig P F Sig P F P F
00–150.000 ***47.060.000 ***24.730.000 ***10.4817.73
15–300.000 ***62.750.000 ***20.670.014 *3.5313.05
30–450.000 ***78.700.001 **5.950.967−1.6917.04
45–600.000 ***90.920.000 ***1.730.000 ***4.662.69
0–600.000 ***55.070.000 ***10.100.3290.1434.69
300–150.000 ***48.640.000 ***13.140.003 **5.4832.74
15–300.000 ***76.530.000 ***15.280.011 *1.856.34
30–450.000 ***70.740.000 ***10.760.000 ***13.425.08
45–600.000 ***73.050.000 ***10.570.000 ***15.680.70
0–600.000 ***54.130.000 ***10.870.000 ***2.9232.08
400–150.000 ***50.970.000 ***14.190.1341.8333.01
15–300.000 ***73.630.000 ***13.590.000 ***5.047.74
30–450.000 ***70.270.000 ***17.300.000 ***8.124.31
45–600.000 ***62.330.000 ***14.620.000 ***7.1415.91
0–600.000 ***50.850.000 ***12.910.002 **3.0033.24
500–150.000 ***51.290.000 ***16.700.000 ***16.1115.90
15–300.000 ***36.470.000 ***29.680.01 *7.7726.08
30–450.000 ***34.230.000 ***36.050.000 ***11.8817.84
45–600.000 ***29.620.000 ***14.830.000 ***16.9538.60
0–600.000 ***41.810.000 ***16.340.000 ***8.9732.88
Note: *** indicates p < 0.001, ** indicates p < 0.01, and * indicates p < 0.05.
Disclaimer/Publisher’s Note: The statements, opinions and data contained in all publications are solely those of the individual author(s) and contributor(s) and not of MDPI and/or the editor(s). MDPI and/or the editor(s) disclaim responsibility for any injury to people or property resulting from any ideas, methods, instructions or products referred to in the content.

