Abstract
Visible-near infrared (Vis-NIR) and mid-infrared (MIR) spectroscopy are increasingly being used for the fast determination of soil properties. The aim of this study was (i) to test the use of MIR spectra (Agilent 4300 FTIR Handheld spectrometer) for the prediction of soil properties and (ii) to compare the prediction performances of MIR spectra and Vis-NIR (ASD FieldSpecPro) spectra; the Vis-NIR data were adopted from a previous study. Both the MIR and Vis-NIR spectra were coupled with partial least squares regression, different pre-processing techniques, and the same 114 soil samples, collected from the agricultural land located between boreal forests and semi-arid steppe belts (Kastanozems). The prediction accuracy (R2 = 0.70–0.99) of both techniques was similar for most of the soil properties assessed. However, (i) the MIR spectra were superior for estimating CaCO3, pH, SOC, sand, Ca, Mg, Cd, Fe, Mn, and Pb. (ii) The Vis-NIR spectra provided better results for silt, clay, and K, and (iii) the hygroscopic water content, Cu, P, and Zn were poorly predicted by both methods. The importance of the applied pre-processing techniques was evident, and among others, the first derivative spectra produced more reliable predictions for 11 of the 17 soil properties analyzed. The spectrally active CaCO3 had a dominant contribution in the MIR predictions of spectrally inactive soil properties, followed by SOC and Fe, whereas particle sizes and hygroscopic water content appeared as confounding factors. The estimation of spectrally inactive soil properties was carried out by considering their secondary correlation with carbonates, clay minerals, and organic matter. The soil information covered by the MIR spectra was more meaningful than that covered by the Vis-NIR spectra, while both displayed similar capturing mechanisms. Both the MIR and Vis-NIR spectra seized the same soil information, which may appear as a limiting factor for combining both spectral ranges. The interpretation of MIR spectra allowed us to differentiate non-carbonated and carbonated samples corresponding to carbonate leaching and accumulation zones associated with topography and land use. The prediction capability of the MIR spectra and the content of nutrient elements was highly related to soil-forming factors in the study area, which highlights the importance of local (site-specific) prediction models.
1. Introduction
Over the last few decades, spectroscopic methods, in combination with different modeling approaches, have gained a high level of relevance for soil analysis (quality, fertility, and pollution), as well as for the monitoring of soils and environmental processes [1,2]. Traditionally, soil analyses have involved wet chemical methods with solution extraction and laboratory-based instruments. However, worldwide, there has been a shift towards using proximal sensing techniques such as X-ray fluorescence (XRF), visible-near infrared (Vis-NIR), and mid-infrared (MIR) spectroscopic analyses. Laboratory and in situ (benchtop and portative) techniques may significantly reduce costs, allowing for the sampling of environmental impacts and improving the speed of analyses [3,4,5,6]. Vis-NIR spectroscopy (400–2500 nm) has been more widely used compared to MIR (2500–25,000 nm) or FTIR spectroscopy (Fourier Transform Infrared spectroscopy; ~400–8000 nm) [4,7].
1.1. The Use of Spectroscopy to Predict Soil Properties
Numerous studies have shown the relevance of the Vis-NIR, MIR, and XRF techniques in different applications, such as soil organic carbon (SOC) inventories, land surveys, digital soil mapping, site-specific evaluation (precision agriculture), and the classification of soil attributes at different scales and in various climatic regions [1,8,9,10,11,12]. For example, XRF, Vis-NIR, and MIR measurements were compared to analyze the texture, SOC, salinity, lime content, and gypsum content of 300 soil samples from the arid region of Iran [13]. In this study, differences in soil texture and chemistry were found, causing differences in the spectral behavior of the soils in saline and non-saline areas: (i) the Vis-NIR spectra showed superior results for forecasting soil texture compared to the MIR spectra or XRF data, whereas the SOC prediction results based on the MIR spectra were better; (ii) all approaches could successfully predict lime content but not gypsum content, and (iii) Vis-NIR and MIR, in combination with XRF, could accurately predict salinity [13]. McCarty and Reeves (2006) [14] tested the capacities of NIR and MIR spectra in a field landscape-scale evaluation of loam soil fertility indicators (SOC; total N; pH; texture; and Mehlich-I Ca, Mg, K, and P) using 544 soil samples from a humid region of USA. Although the MIR spectra largely performed better calibrations than the NIR spectra, both methods produced good results for total N, SOC, and texture, whereas varying extents of accuracy were found for pH, Ca, K, and Mg. The calibration for P was not robust [14].
Recent studies have reported more accurate estimations of frequently used soil properties (e.g., texture, SOC, pH) with MIR spectroscopy coupled with regression models or machine learning approaches compared to Vis-NIR spectroscopy [8,15,16,17,18]. These results were related to the greater information content of the MIR spectra on the overall chemical soil profile, encompassing fundamental vibrations of both organic and mineral components (e.g., organic matter, clay mineralogy), while Vis-NIR spectra mainly cover features related to implication and grouping bands of fundamental vibrations [19,20,21,22]. The noted features make the MIR spectra easily identifiable in view of the absorption bands of the components presented. Hence, the information content of MIR spectra is potentially capable of providing more precise and targeted spectral inferences of a broad variety of soils at various scales [3,20,23]. The effectiveness of using FTIR spectra with the DRIFT (diffuse reflectance infrared Fourier transform) sampling procedure was evaluated and recommended as well suited for soil analysis [7,22,24]. Also, the fusion of Vis-NIR and MIR spectra at a local or regional scale may considerably improve the accuracy of predictions of soil properties [18,25,26].
As stated in recent studies, uncertainties in MIR and Vis-NIR predictions are attributed to factors such as the modeling approach used, the number of samples, scale, specific soil properties, the sampling method used, and the quality of spectral data (device capability). Therefore, it is still challenging to obtain accurate estimates of all soil properties by spectroscopy, particularly for the soil characteristics that do not show direct spectral responses or are only weakly correlated with the spectra [19,27]. In addition, soil spectra are complex, and absorbance in the MIR or Vis-NIR range is simultaneously influenced by many soil components (e.g., spectrally active soil properties such as moisture, organic matter, carbonates, clay mineralogy, salinity, etc.), and modeling may not provide stable predictions of soil properties. This effect is even more convoluted when a large variety of soil properties is evaluated on a regional or global scale [23,28,29]. Despite this, the development of local calibration models coupled with newly introduced devices (with different sampling techniques) retain their theoretical and practical importance in view of uncertainties in calibration models at various scales. As Vis-NIR and MIR studies may yield similar (e.g., SOC, CaCO3) or inconsistent prediction results, particularly for nutrients and heavy metals, the advancement of local calibration models for the prediction of soil properties in the absence of direct spectral responses is still promising [2,5,30,31]. In this context, our primary objective was to test the performance of a recently introduced commercial device, the Agilent 4300 Handheld FTIR spectrometer, in predicting a range of soil properties in a mountainous agricultural land.
1.2. A Brief Review on the Use of Handheld MIR-FTIR
Most of the soil spectroscopic studies in the literature have focused on laboratory benchtop devices rather than portative spectrometers with in situ measurement capacities [32,33]. Therefore, a special emphasis has been paid to the comparative evaluation of alternative devices (e.g., handheld vs. benchtop, in situ vs. laboratory) coupled with different modeling approaches [15].
Hutengs et al. [34] assessed the performance of MIR spectra recorded via FTIR spectroscopy (Agilent 4300 Handheld; Agilent Technologies, Santa Clara, CA, USA) compared with spectra recorded via a benchtop (Bruker Tensor 27; Bruker Optik GmbH, Ettlingen, Germany) instrument for predicting total N, SOC, pH, sand, and clay contents in German soils (40 soil samples with limited heterogeneity from a Saxon basin). These techniques were evaluated in terms of measurement noise and spectral quality, as well as the accuracy of PLSR (partial least squares regression) calibrations. The measurements and multivariate calibrations with the FTIR handheld apparatus yielded good or somewhat better results than the benchtop Bruker instrument set with a DRIFT accomplice. The authors suggested that FTIR portable devices are a viable alternative for laboratory benchtop measurements and proposed that they hold greater potential for on-site field applications [34]. Correspondingly, Vohland et al. [18] compared the accuracy of the same handheld FTIR device with a portable Vis-NIR spectrometer for SOC quantification on a regional scale. With a focus on various approaches of fusing FTIR and Vis-NIR spectral data, the study showed that FTIR outperformed Vis-NIR spectroscopy in both field and laboratory determinations of SOC. For regional scale analysis, the authors suggested specific approaches associated with the use of homogeneous groups of heterogeneous data sets [18].
Pätzold et al. [35] compared a benchtop FTIR instrument (Bruker Tensor 27; 586 samples) and portable Vis–NIR (AgriSpecPro; Analytical Spectral Devices Inc.; Boulder, CO, USA, 477 samples) spectra for the prediction of available P in topsoil samples of loess from various fields at six locations in Germany. The overall calibration yielded satisfactory model performances for both the FTIR (coefficient of determination, R2 = 0.72) and Vis-NIR (R2 = 0.70) data. However, the former yielded better results for local calibrations, while the model partly failed on independent test data for overall predictions. In another study [36], a portable FTIR device (Agilent 4300 Handheld) was compared with a benchtop alternative (Bruker Tensor 27) to predict extractable hot water, total OC, and N in 45 soil organic amendments by employing a Support Vector Machine (SVM) combined with spectral pre-processing techniques. For both devices, model validation yielded reliable predictions (R2 = 0.49−0.93). However, the authors underlined that the SVM was a critical part of the process as the auto-correlation, large variation, and non-linearity of the analyzed parameters did not allow for the use of linear types of calibrations [36].
The feasibility of a handheld FTIR device was evaluated to predict P content and P buffering index for Australian soils, and its performance was compared with a benchtop spectrometer [37]. Both methods produced similar calibration accuracies; however, coupling with PLSR allowed for close estimations of the P buffering index, and poor modeling results were achieved for the plant-available P content [37]. Laboratory and in situ MIR spectroscopy were applied to examine the soil properties (SOC, total nitrogen, texture, pH) of 150 local and 300 regional soil samples from loess sites in Germany [38]. The models based on laboratory data outperformed the field-based models since the field data were found to be affected by soil moisture and tillage effects. The incorporation of local soil data into regional calibrations and increasing the quantity of regional samples in the calibrations significantly improved the performances of the models [1,28,38].
In summary, both MIR and Vis-NIR measurements are exposed to soil-, data acquisition-, and device-related limitations that lead to decreased performance in terms of prediction accuracy, particularly for the assessment of soil nutrients [1,19,29]. Since, due to this uncertainty or low accuracy, it was challenging for the authors of [9,19,27] to gain insights into the specific soil nutrients extracted in Mehlich 3 solution, as well the used devices, they chose to evaluate the prediction mechanisms at field-scale with local calibration for different soil properties, including essential Mehlich 3 available nutrients. Moreover, to the best of our knowledge, predicting spectrally inactive soil properties, particularly those of available macro- and micro-nutrients extracted using the Mehlich 3 extractant [27], using Vis-NIR or MIR-FTIR portable spectrometers has not been well studied in highland regions, and thus, carrying out this task was the core goal of this study.
The main objectives of this study were (i) to test the performance of a MIR-FTIR portable spectrometer (Agilent 4300 Handheld; Agilent Technologies, Santa Clara, CA, USA) in predicting soil properties in a heterogeneous mountainous agricultural land and (ii) to compare the prediction competence and mechanisms of MIR spectra with those of Vis-NIR spectra. For this purpose, the results regarding Vis-NIR spectral predictions were adopted from our previous study [27]. Both MIR-FTIR and Vis-NIR spectra were coupled with PLSR (partial least squares regression) and different pre-processing techniques with the same sample set collected from the test area. To avoid the inclusion of redundant information, only the results of the Vis-NIR predictions were adopted in this study.
2. Materials and Methods
2.1. Study Area and Soil Sampling
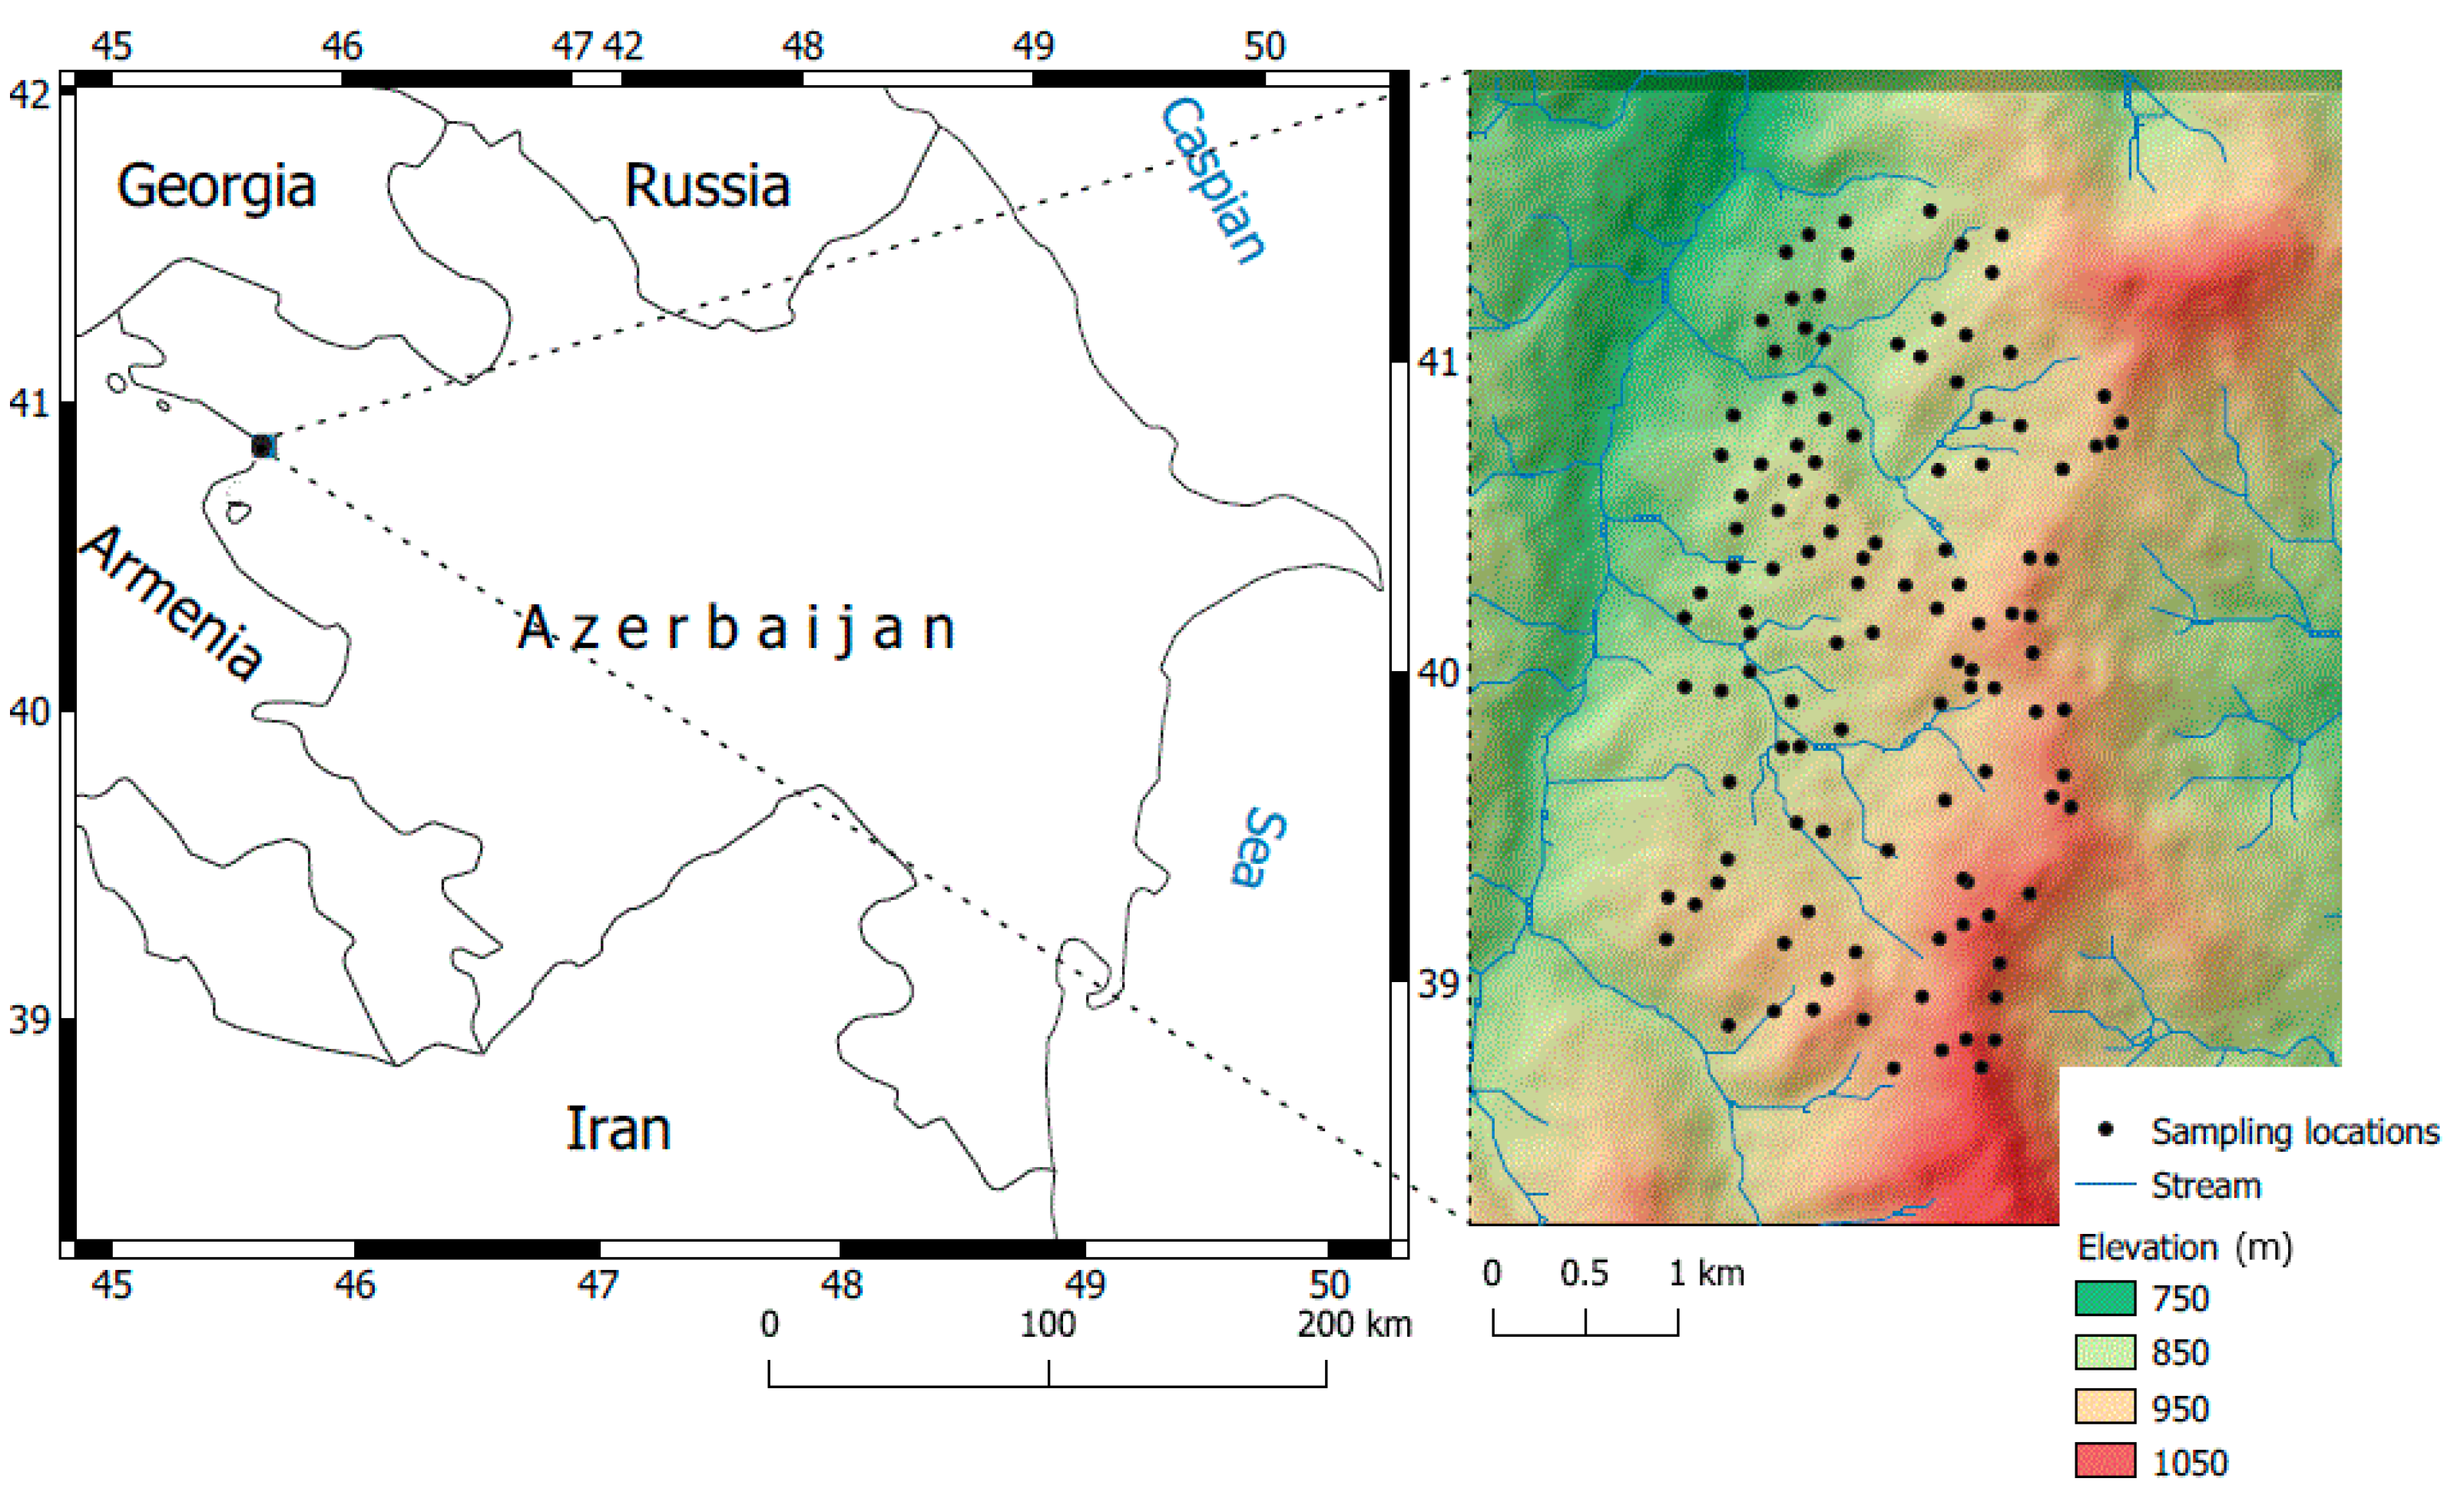
Our research was conducted in the foothill belt of the Caucasus Mountains in Azerbaijan, located between 45.6201° to 45.6401° E and 40.8401° to 40.8701° N. This area is used for agricultural purposes at elevations ranging from 750 to 1020 m (Figure 1). The total precipitation and annual average air temperature are 570 mm and 10.2 °C, respectively. The typical Mediterranean climate encompassing the whole Caucasus region leads to mild and dry winters. Geographically, the study area is related to the transition zone from the semi-arid step zone to the mountainous moderate climate zone. The typical soil moisture regime is xeric, and the dominating soil group is Kastonozem, according to the WRB (World Reference Base) for Soil Resources [39].
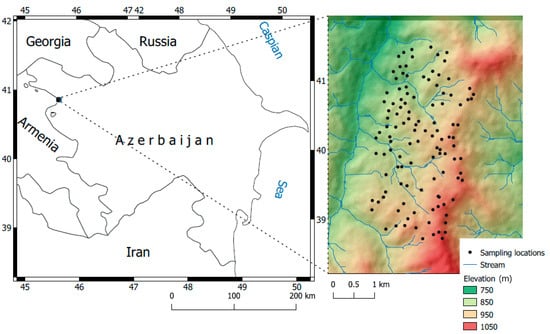
Figure 1.
Location of the study area (Source: Digital Elevation Model, NASA JPL, 2013 [40]).
The studied highland zone has considerable diversity (geological and hydrological setting) in terms of parent materials and rock types. It is characterized by lower Cretaceous and upper Jurassic tonalities and quartz diorites. The spatial distribution of the parent material is topography-dependent. The predominating sedimentary rocks are exposed to sorting depending on slope, aspect, and elevation. Thus, the coarse parent materials and outcrops of bedrocks are typical at high altitudes, while carbonate-rich diluvial sediments dominate in the foot slopes. The foothill and higher-altitude areas are characterized by gentle and steep slopes, respectively. Therefore, soil degradation and erosion are typical occurrences in the area, and they are related to slope conditions, precipitation, and land use intensity. The main land use types are pastures, hayfields, and croplands. The typical crop types are cereals and potatoes, and conventional farming practices and monoculture management techniques are used. Frequently, local shrubby lands are used as permanent pastures [41].
Due to the variations in geological settings, topography, and land use history, the properties of the soil in the area are highly variable. Soil sampling (114 samples), considering the heterogeneity of the terrain, was conducted in an area spanning 520 hectares (1 sample per 5 hectares: each sample consisted of 3 samples taken every 100 m2) as carried out in [41,42]. The sample locations were irregularly (randomly) chosen and exhibited variations in geological substrate, topography, land use, and the erosive condition of the land soil system [35]. A GPS (Garmin Map 62s) was used to fix the terrestrial coordinates of the samples. The samples (~2 kg) were collected from the upper horizon (0–15 cm). The samples were air-dried, milled, and sieved (<2 mm sieve size) in the laboratory. All samples were separated into two parts for chemical analyses and spectral measurements.
2.2. Chemical Analyses
In this study, we concentrated on soil properties that are crucial for agricultural management in terms of soil quality, fertility, and functionality [27]. The soil samples were tested for SOC content using the Walkley–Black method [43], and for their CaCO3 content, the samples were tested using the pressure calcimeter method [44]. Soil particle sizes (clay, silt, and sand) were determined by the hydrometer method [45]. pH values were measured both in deionized water and potassium chloride with a soil-to-solution ratio of 1:1. Because the determination of clay mineralogy is time-consuming and expensive, clay activity (cation exchange capacity, CEC/Clay) was used as an indicator of the mineralogy. The selection of this approach was also supported by its relation to mid-infrared spectral information: the CEC/Clay ratio was strongly predicted (R2 = 0.86) based on MIR diffuse reflectance spectra in [46].
The determination of the concentrations of Ca, Mg, K, Cd, Cu, Fe, Mn, P, Zn, and Pb was based on the Mehlich 3 procedure [47]. The soil samples were digested by the Mehlich 3 extractant and then determined by Atomic Absorption Spectroscopy (AAS) (Thermo Scientific ICE 3000 Series, Pittsburgh, PA, USA). The cations Ca, Mg, and K were also extracted by Mehlich 3 and Ammonium Acetate and then measured via inductively coupled plasma optical emission spectroscopy (ICP-OES, Spectro GmbH, Kleve, Germany) for validation purposes. The CEC was determined as a sum of exchangeable cations. The detection limits were estimated as three times the standard deviation of 20 replicate measurements of the blank. The concentrations of standard solution were (i) 0, 5, 10, 25, 50, and 100 mg dm−3 for Ca, Mg, K, and P; (ii) 0, 0.5, 1.0, 2.0, 3.0, 4.0, 5.0, and 10.0 mg dm−3 for Cu, Zn, Mn, Cd, and Pb; and (iii) 0, 0.5, 1.0, 2.5, 5.0, 10.0, 25.0, 50.0, and 100.0 mg dm−3 for Fe [41]. For Ca, Mg, and K, AVS—Titrinorm 1000 mg dm−3 ± 0.2% VWR Chemicals; for PO43−, 10 g dm−3 Fixanal (Fluka analytical); for Cu, Zn, and Mn, 1000 mg dm−3 ± 4 mg dm−3 Fixanal (Fluka analytical); for Fe, 999 mg/dm−3 ± 4 mg dm−3 Fixanal (Fluka analytical); for Pb and Cd, 1 g dm−3 ± 5 mg dm−3 Fixanal [48].
To characterize the samples in terms of the spatial variability of their physical and chemical properties, the mean, minimum, maximum, median, standard deviation (SD), and the coefficient of variation (CV) were calculated and interpreted. The CV values were classified as small (<20%), moderate (20–50%), and large (>50%) [49]. When the tested soil properties did not show a normal distribution pattern, Spearman’s Rho correlation coefficients (r) were utilized to characterize the relations between them, with the values being classified into the following categories: very weak (0.00 < r < 0.19), weak (0.20 < r < 0.39), moderate (0.40 < r < 0.59), strong (0.60 < r < 0.79), and very strong, (0.80 < r < 1.00) [50]. Histograms were used to visualize the distribution patterns of basic soil properties; their relation to the elevation was displayed by grouping the soil samples by three elevation levels. Visualization and statistical analyses were conducted in the R (2023.06.0) project software environment [51].
2.3. Mid-Infrared Reflectance Measurements and Pre-Processing of Spectra
For the spectral measurements, the dried and homogenized soil samples were placed into Petri dishes (10 cm in diameter and 1.5 cm in depth). DRIFT spectra were obtained using the Agilent 4300 Handheld FTIR device set with a diffuse reflectance interface. The detector of the instrument covers a spectral range between 5000 and 650 cm−1 with a spectral resolution of 8 cm−1. For each soil sample, three spectra were recorded, for which mean spectra were calculated afterwards. Spectral pre-processing techniques were used to (i) remove signal noise and accentuate absorption features and (ii) advance mineral identification and increase the accuracy of the predictions [52]. For this purpose, Savitzky–Golay (SG) smoothing [53], multiplicative scatter correction (MSC) [54], continuum removal [55], standard normal variate (SNV) [56], first and second derivatives [55], and de-trending and absorbance (Ab) [56] techniques were used to test a variety of pre-processed spectra to find reliable prediction models.
SG smoothing is capable of reducing noise by fitting a smooth polynomial to a local region of data points within the spectrum. The polynomial acts as a low-pass filter, effectively removing high-frequency noise while retaining the overall shape of the spectrum. Moreover, SG smoothing maintains important spectral features, such as maxima and minima, without significant distortion and controls the size of the smoothing window and the degree of the polynomial used for fitting. This approach followed the one adopted in our previous study, in which a large variety of techniques with diverse moving window sizes and gaps, as well as diverse segment sizes for the derivatives, were tested and ranked [57]. The pre-processing of the spectral data was carried out using the “prospectr” package [58] in the R project software environment [51].
2.4. Partial Least Squares Regression Model Calibration and Validation
For model calibration, partial least squares regression (PLSR) coupled with different pre-processing techniques was tested [16,59,60]. PLSR considers the correlation between the soil properties and spectral data to create a predictive model. The PLSR algorithm compresses the spectral data to few non-correlated latent variables (i.e., linear combinations of the original spectral variables). The latent components capture the maximum number of variances in the spectral data while also being strongly correlated with the predicted soil properties. Thus, the algorithms find the best linear combination of the spectral variables and the optimal relations between the soil properties and spectral data with the minimum prediction error.
Models were calibrated based on the different pre-processed spectra using all samples. Then, leave-one-out cross-validation was applied to establish the optimal pre-processing technique for each of the 17 soil properties analyzed [3]. The selection of the best models was based on the greatest R2 and the lowest RMSE of the cross-validated predictions. The number of factors (NF) was chosen based on the smallest RMSE and AIC (Akaike Information Criterion) [61,62]. The cross-validation predictions served to find the optimal pre-processing technique by involving all samples due to the heterogeneity of the studied area. The number of factors was defined based on the RMSE and AIC values, which were consistent in all cases. Models were calibrated and validated using 75% (88 samples) and 25% (26 samples) of the randomly selected samples, respectively. The evaluation of the performance (quality) of the models was based on R2, RMSE, and RPD values [63]. Prediction quality was classified based on the RPD values, and the following categories were used: very poor (RPD < 1.0); poor (1.0 < RPD < 1.4); fair (1.4 < RPD < 1.8); good (1.8 < RPD < 2.0); very good (2.0 < RPD < 2.5); and excellent (RPD > 2.5). PLSR modeling was conducted using the “pls” package [64] in the R project software environment [51].
The MIR-FTIR predictions (i) were tested for SOC, pH, sand, silt, clay, water content, carbonate (CaCO3), and available nutrients extracted by the Mehlich 3 extractant (K, Mg, Ca, P, Fe, Mn, Cd, Pb, Cu, and Zn), and the results (ii) were compared with Vis-NIR results of the same sample set from a previous study [57] to assess the potential of spectral data fusion and for the quantification of the key properties of the soil at a relatively larger scale.
2.5. Spectra Characterization and Analysis of Prediction Mechanisms
To better understand and visualize the spectral variability associated with the variability of basic soil properties (CaCO3, SOC, sand, silt and clay), the smoothed DRIFT spectra of all samples were plotted and color coded in accordance with the contents of their respective soil properties following the approaches used in similar studies [22,24]. Two representative individual spectra (the samples with maximum CaCO3 and SOC contents) were presented to characterize the spectral variation linked to carbonates and organic matter. To specify the impacts of carbonates, organic matter, elevation (topography), and land use practices on MIR spectra variability, the spectra were divided into the following representative groups: CaCO3: <2, 2–4, 4–6, 6–8, and >8%; SOC: <2, 2–4, 4–6, and >6%; elevation: <800, 800–1000, and >1000 m. The following land use abbreviations were used: A—arable, H—hay land, P—pasture, S—shrubland. Afterwards, the spectra of each group were averaged, and the resulting single spectra were used to evaluate the contribution of these factors.
To elucidate the primary prediction mechanisms for the tested soil properties, the commonly used PCA approach was applied; this approach involved the consideration of the internal correlation between the spectrally active and inactive properties [65,66]. To study the information content of the MIR spectral data and its relation to the tested soil properties, (i) the spectral data were first involved in the PCA, and the first two principal components (PC1 and PC2) were selected as the factors signifying the spectral data; (ii) sample-wise scores were exposed to an additional PCA, together with the soil properties, and the variables were auto-scaled to generate correlation loading plots. Correspondingly, spectral data and soil properties were plotted against F1 and F2 principal factors in a two-dimensional space. The comparative location of all variables in the loading space was used to understand the specificity of the underlying prediction mechanisms.
The partial correlation analysis that involved considering the Spearman’s Rho correlations between PC1 and soil properties was repeated by controlling each of the basic soil properties separately or in combination while considering the significance levels [67]. This approach served to evaluate the input of spectrally active soil properties on the prediction quality of spectrally inactive soil properties [27].
The interpretation of the spectra was mainly based on existing studies for characterizing important wavelengths through spectral features such as the absorption features of mineral components and organic matter [68]. Furthermore, the optimal pre-processed spectra were color coded, according to their correlation coefficients (for each wavelength), with the soil properties (CaCO3, SOC and clay) to visualize and differentiate the best correlated wavelength regions. The correlation analyses and spectra visualizations were performed using the core and ggplot2 package in the R (2023.06.0) project software environment [51].
3. Results
3.1. Soil Characteristics and Reference Data
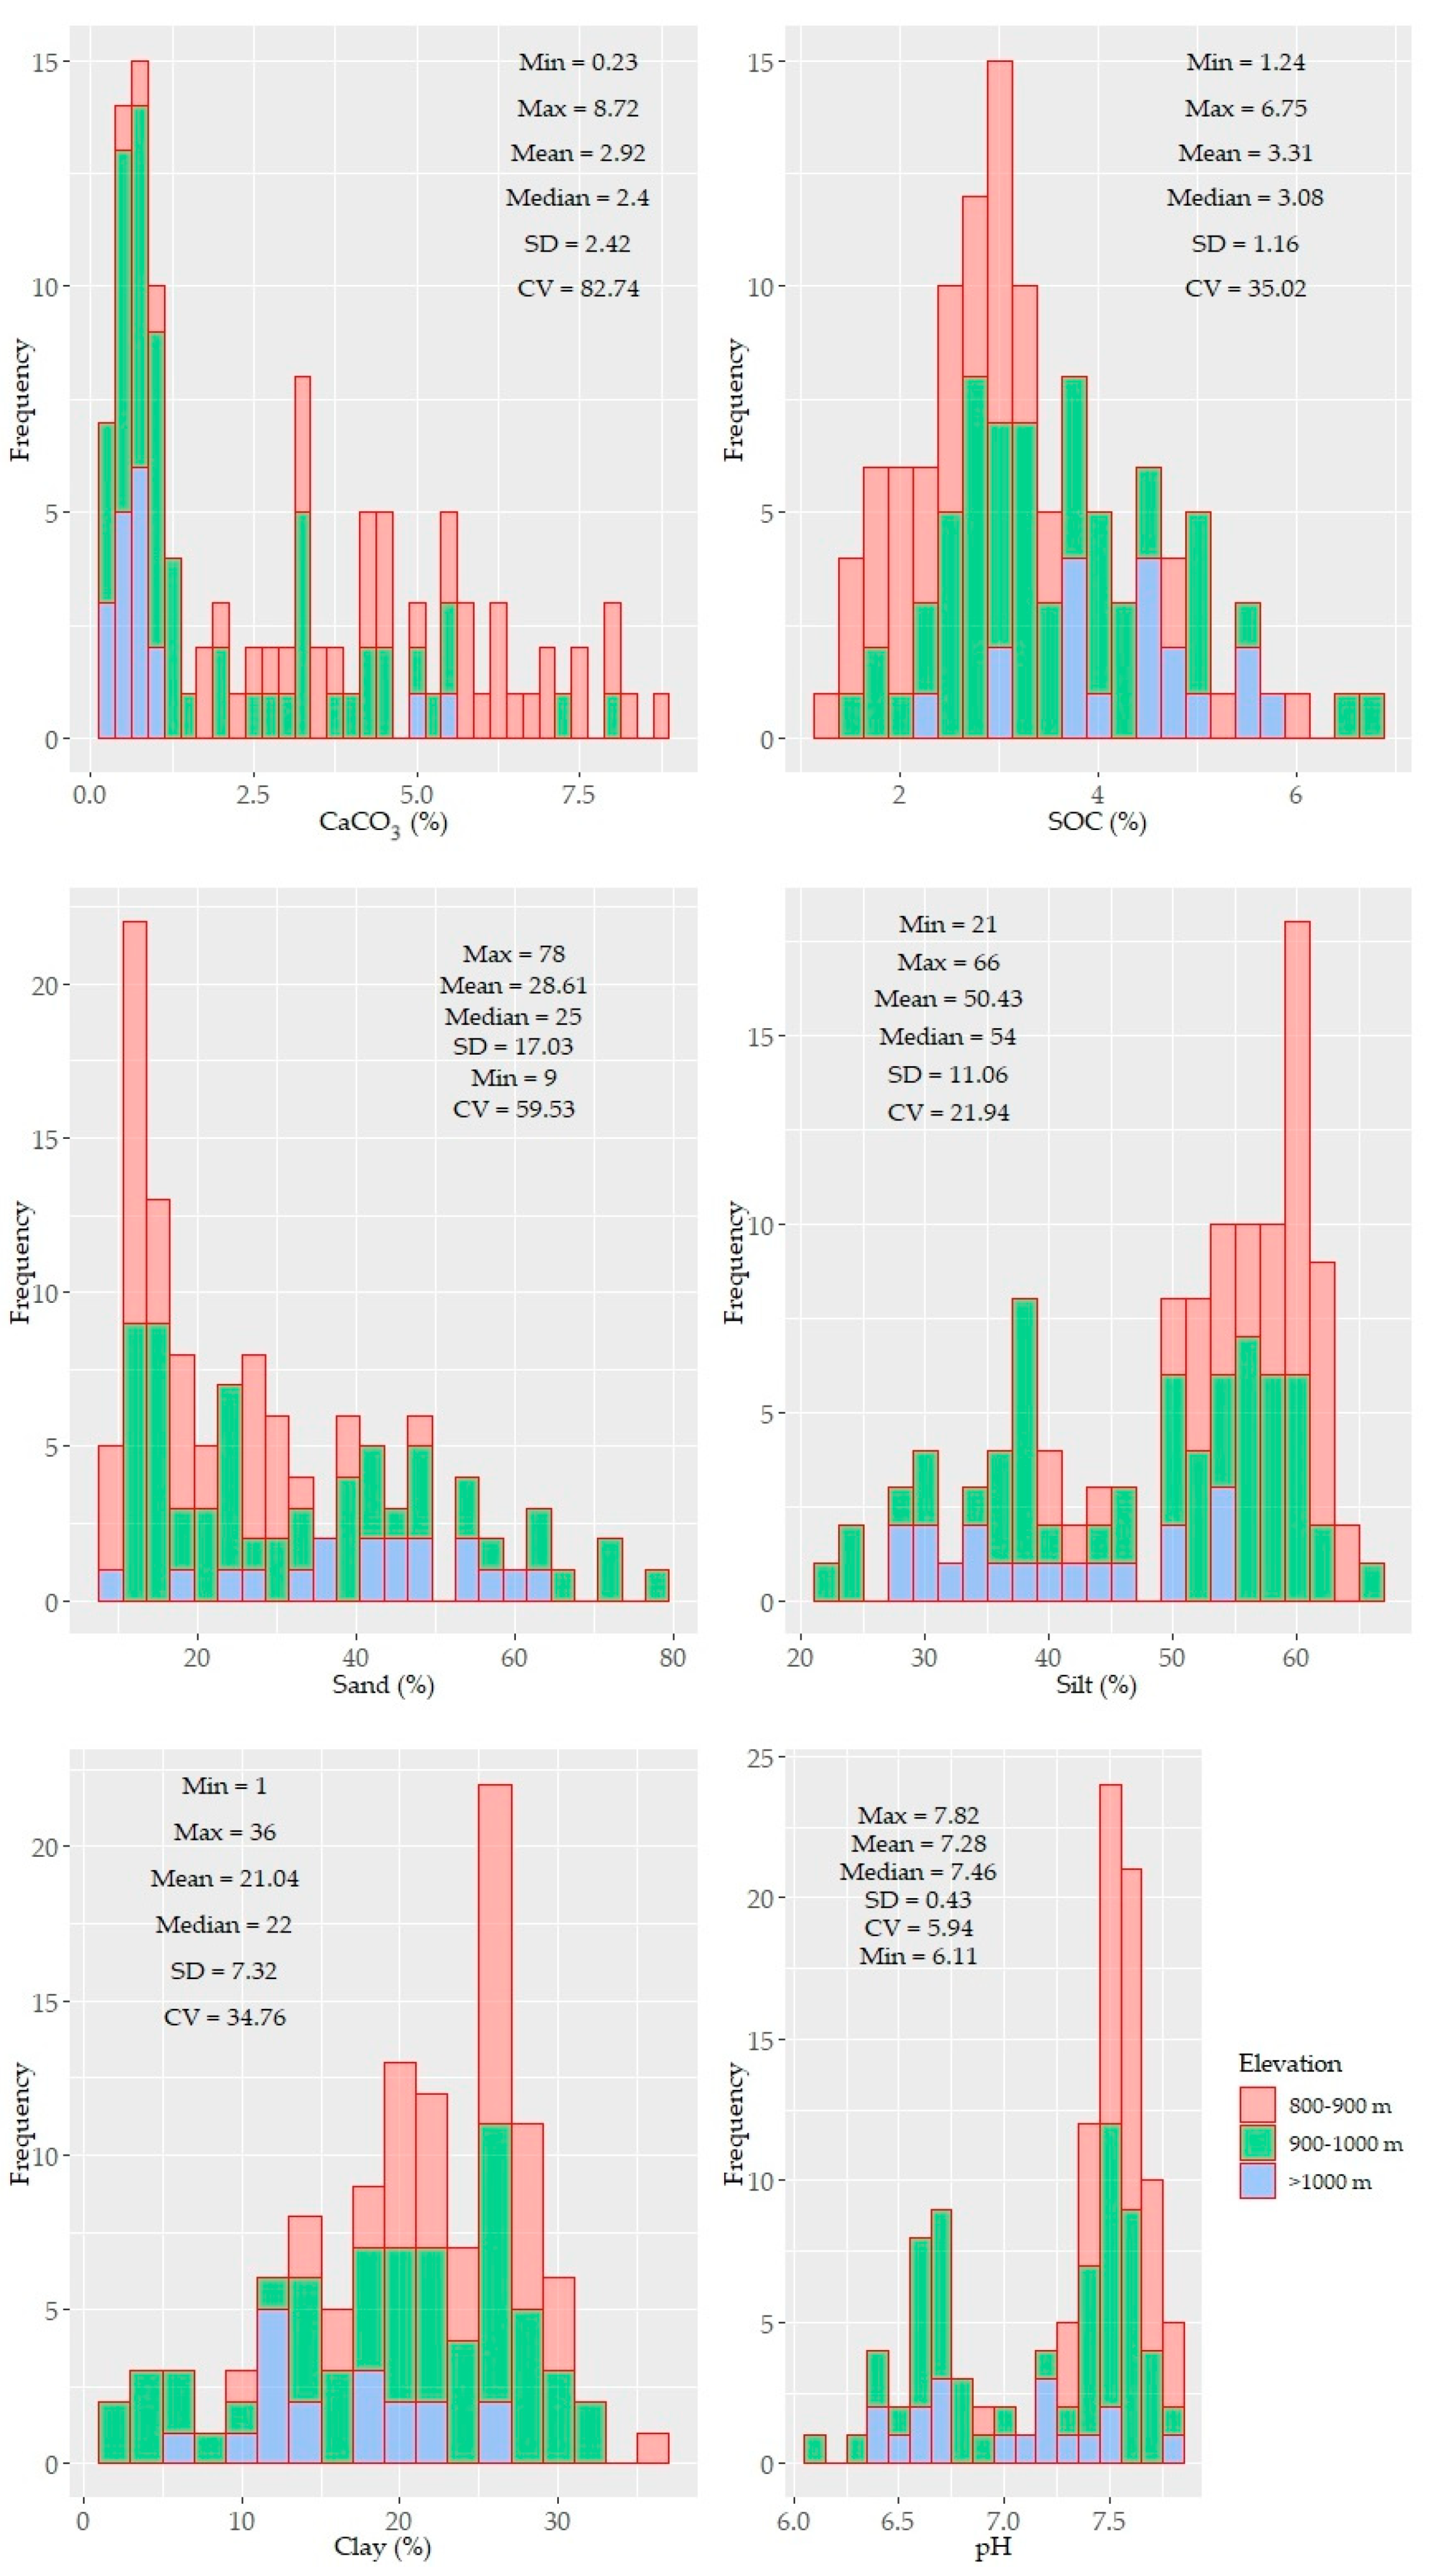
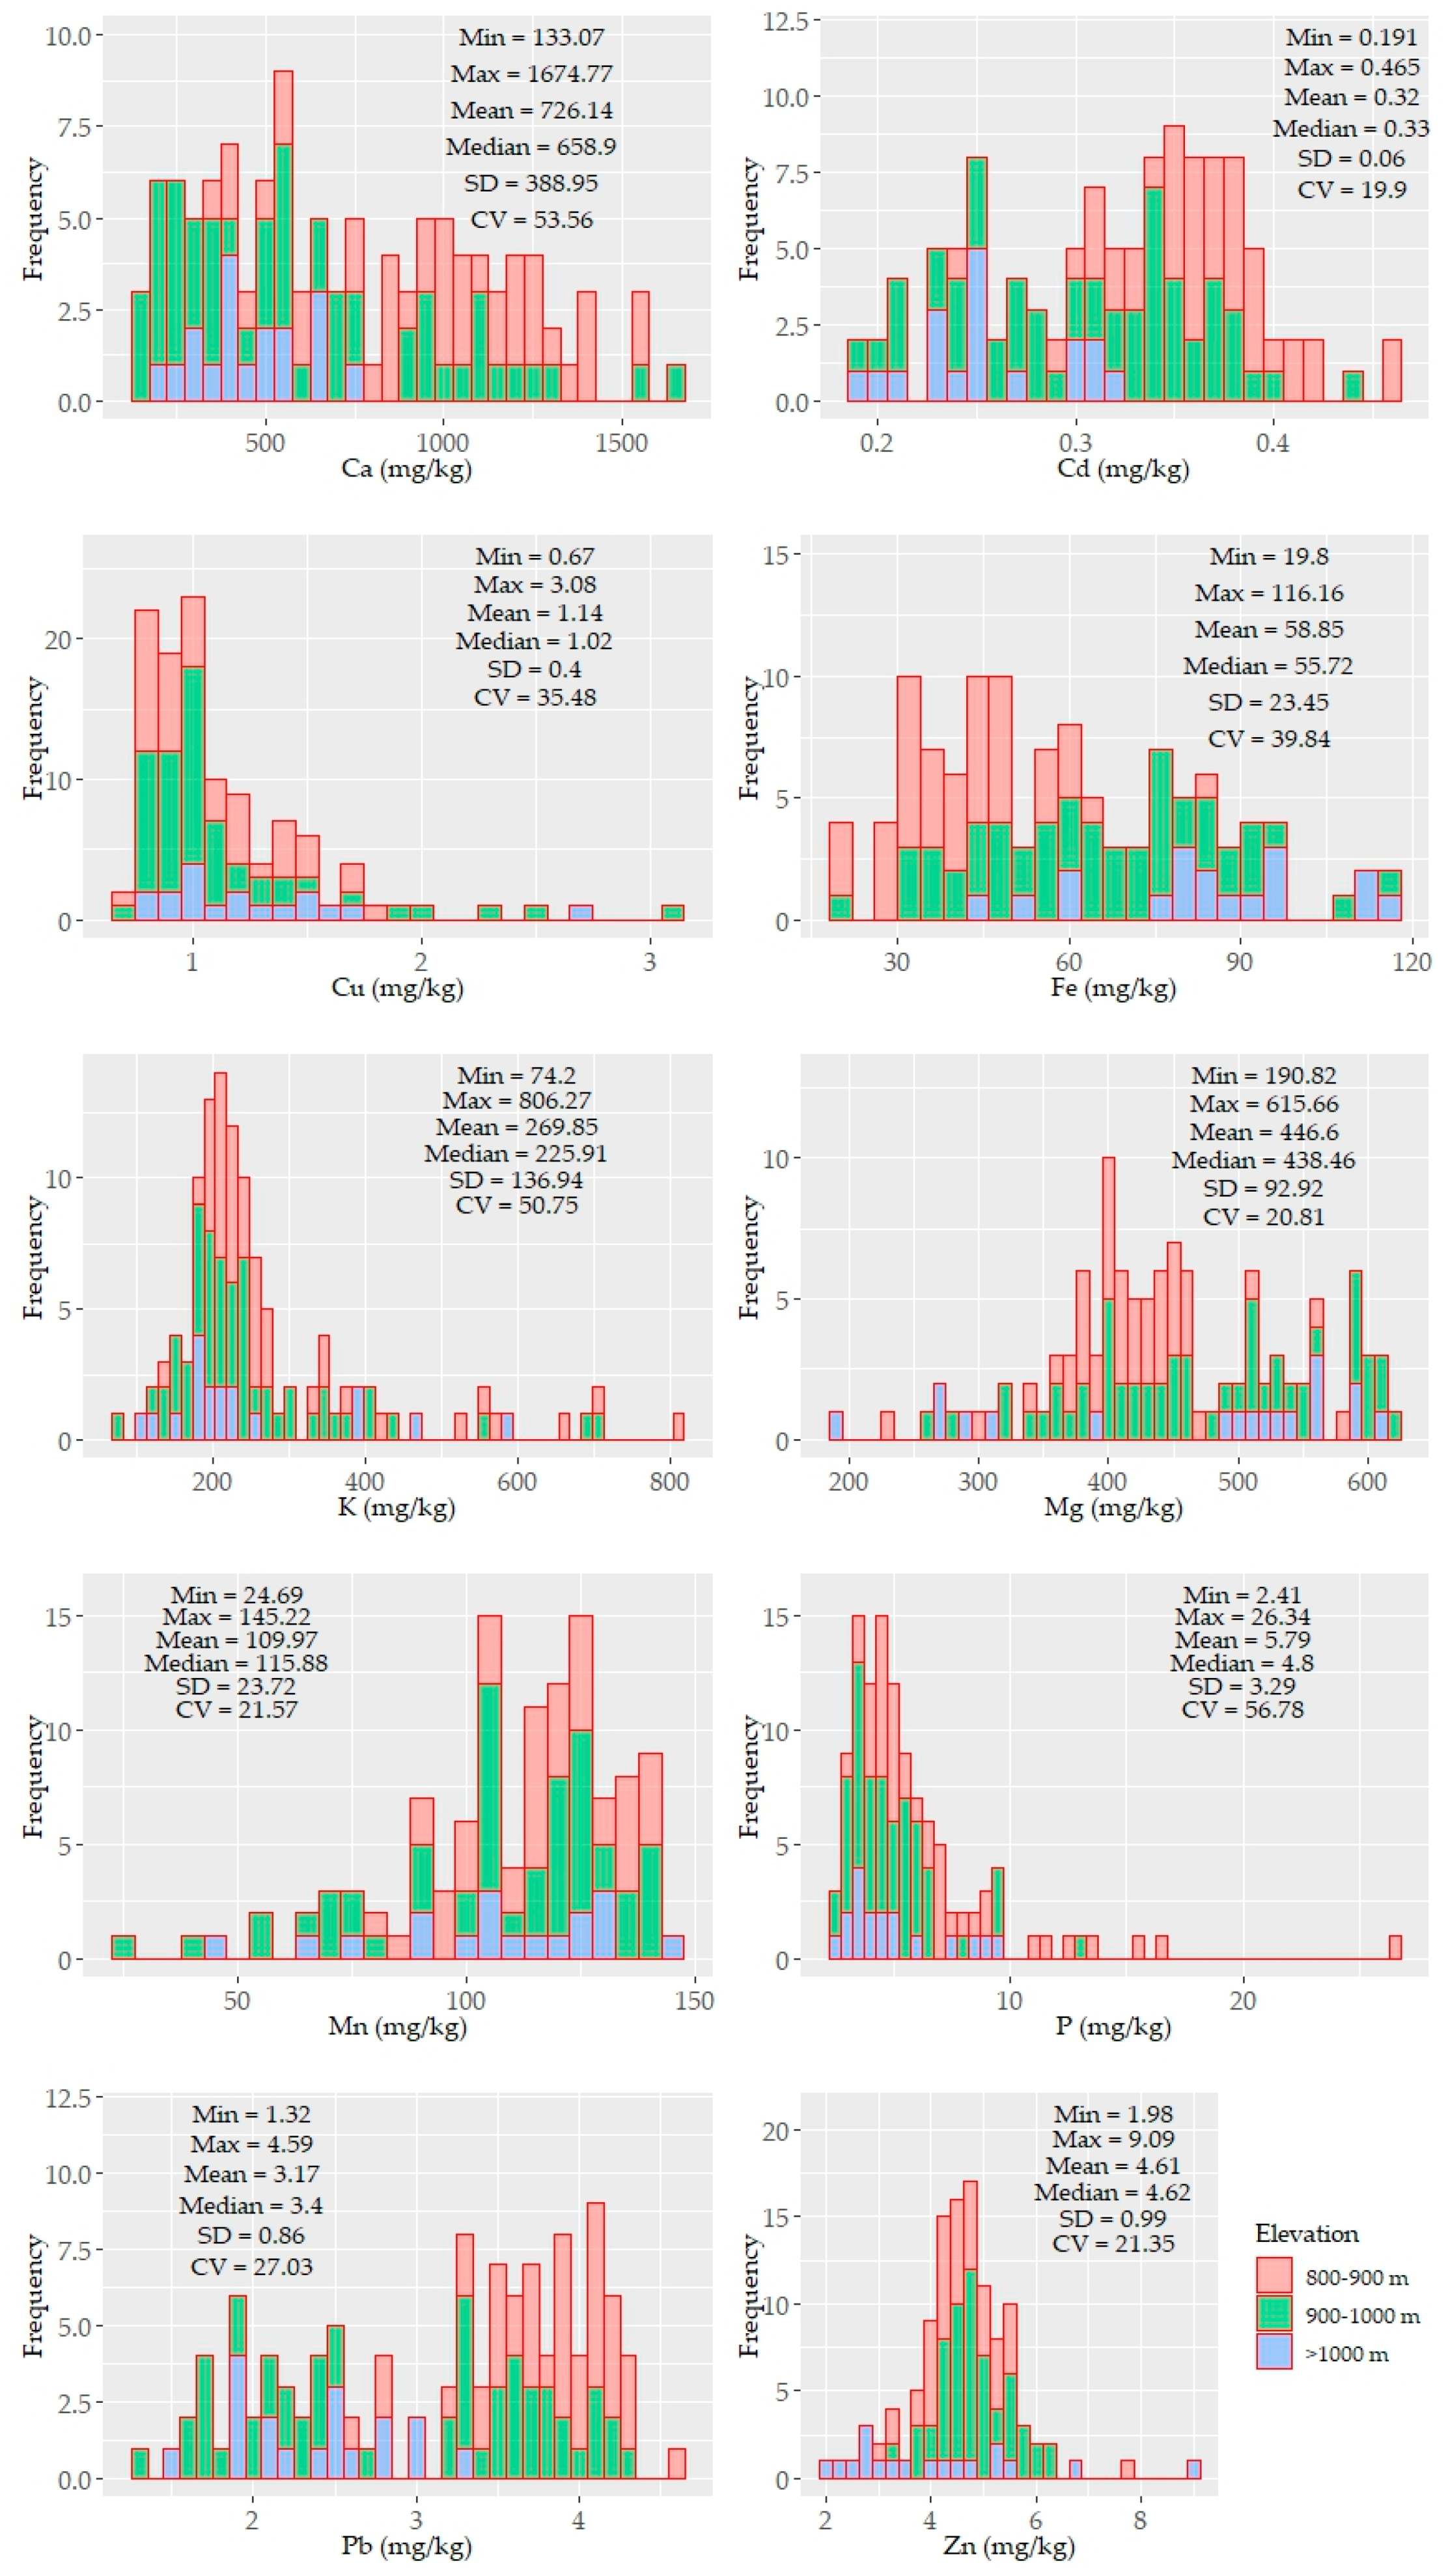
Histograms and descriptive statistics of the soil properties are shown in Figure 2. Some of the parameters were unimodal, while others were bimodal yet not normally distributed. The distribution pattern of CaCO3, SOC, particle sizes, and pH showed an elevation-dependent variability (i.e., higher contents of CaCO3 were found at low elevations, and higher SOC contents were found at high elevations) (Figure 2).
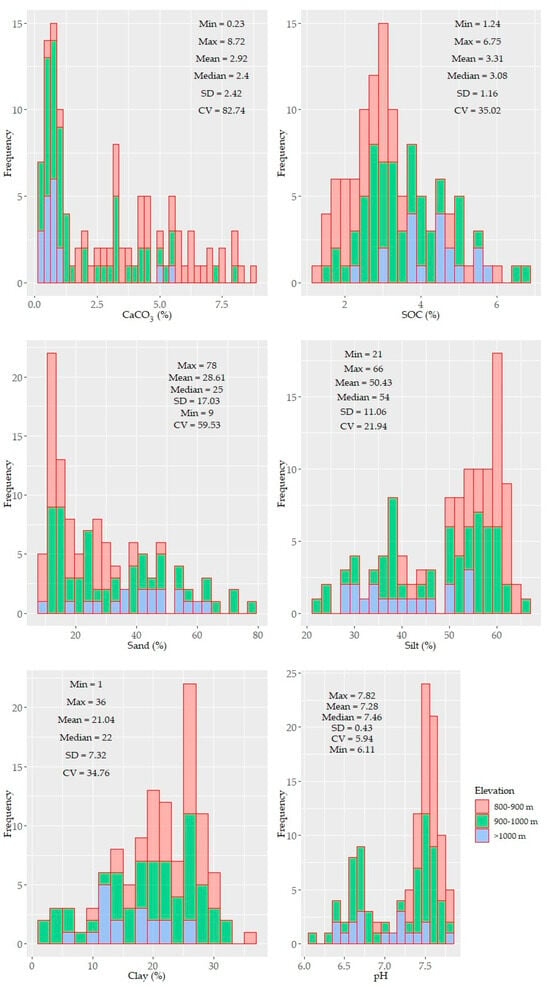
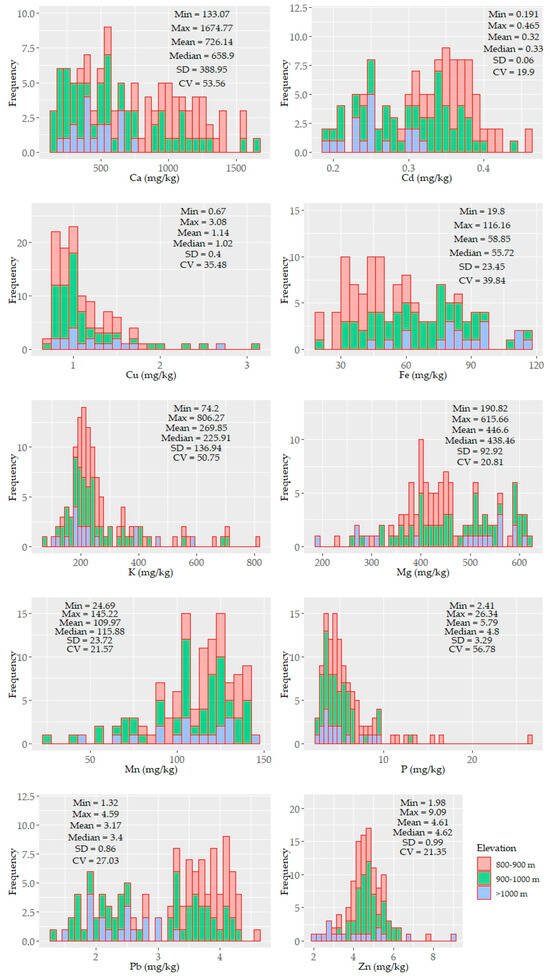
Figure 2.
Histograms and descriptive statistics of the tested soil properties (n = 114). The values of the soil properties were color coded in accordance with three elevation levels: 800–900, 900–1000, >1000 m.
The SOC and clay contents showed left and right unimodal distributions, respectively. Other soil properties (e.g., CaCO3, sand, silt, and micronutrients) were characterized by bimodal or skewed distributions. CaCO3 displayed the largest variability (~84%) with a mean value of 2.91%. The underlying distribution pattern of CaCO3 was followed by the soil reaction (pH) with a small variability, ranging from moderately acidic to slightly alkaline. The SOC and clay content showed moderate variability (~35%) with means of 3.41% and 21%, respectively. The soil texture of the study area was mostly silty clay and silty clay loam and partly clay loam. In some samples (under shrub), clay content was less than 10%. Similar to CaCO3, the sand, silt, Ca, K, and P contents were also characterized by a larger variability (≥50%). The other nutrient elements were moderately variable (20–40%). The means of the nutrients content followed the following sequence: Ca > Mg > K > Mn > Fe > P > Zn > Pb > Cu > Cd; their variation followed a different order: P > Ca > K > Fe > Cu > Pb > Mn > Mg >Zn > Cd (Figure 2).
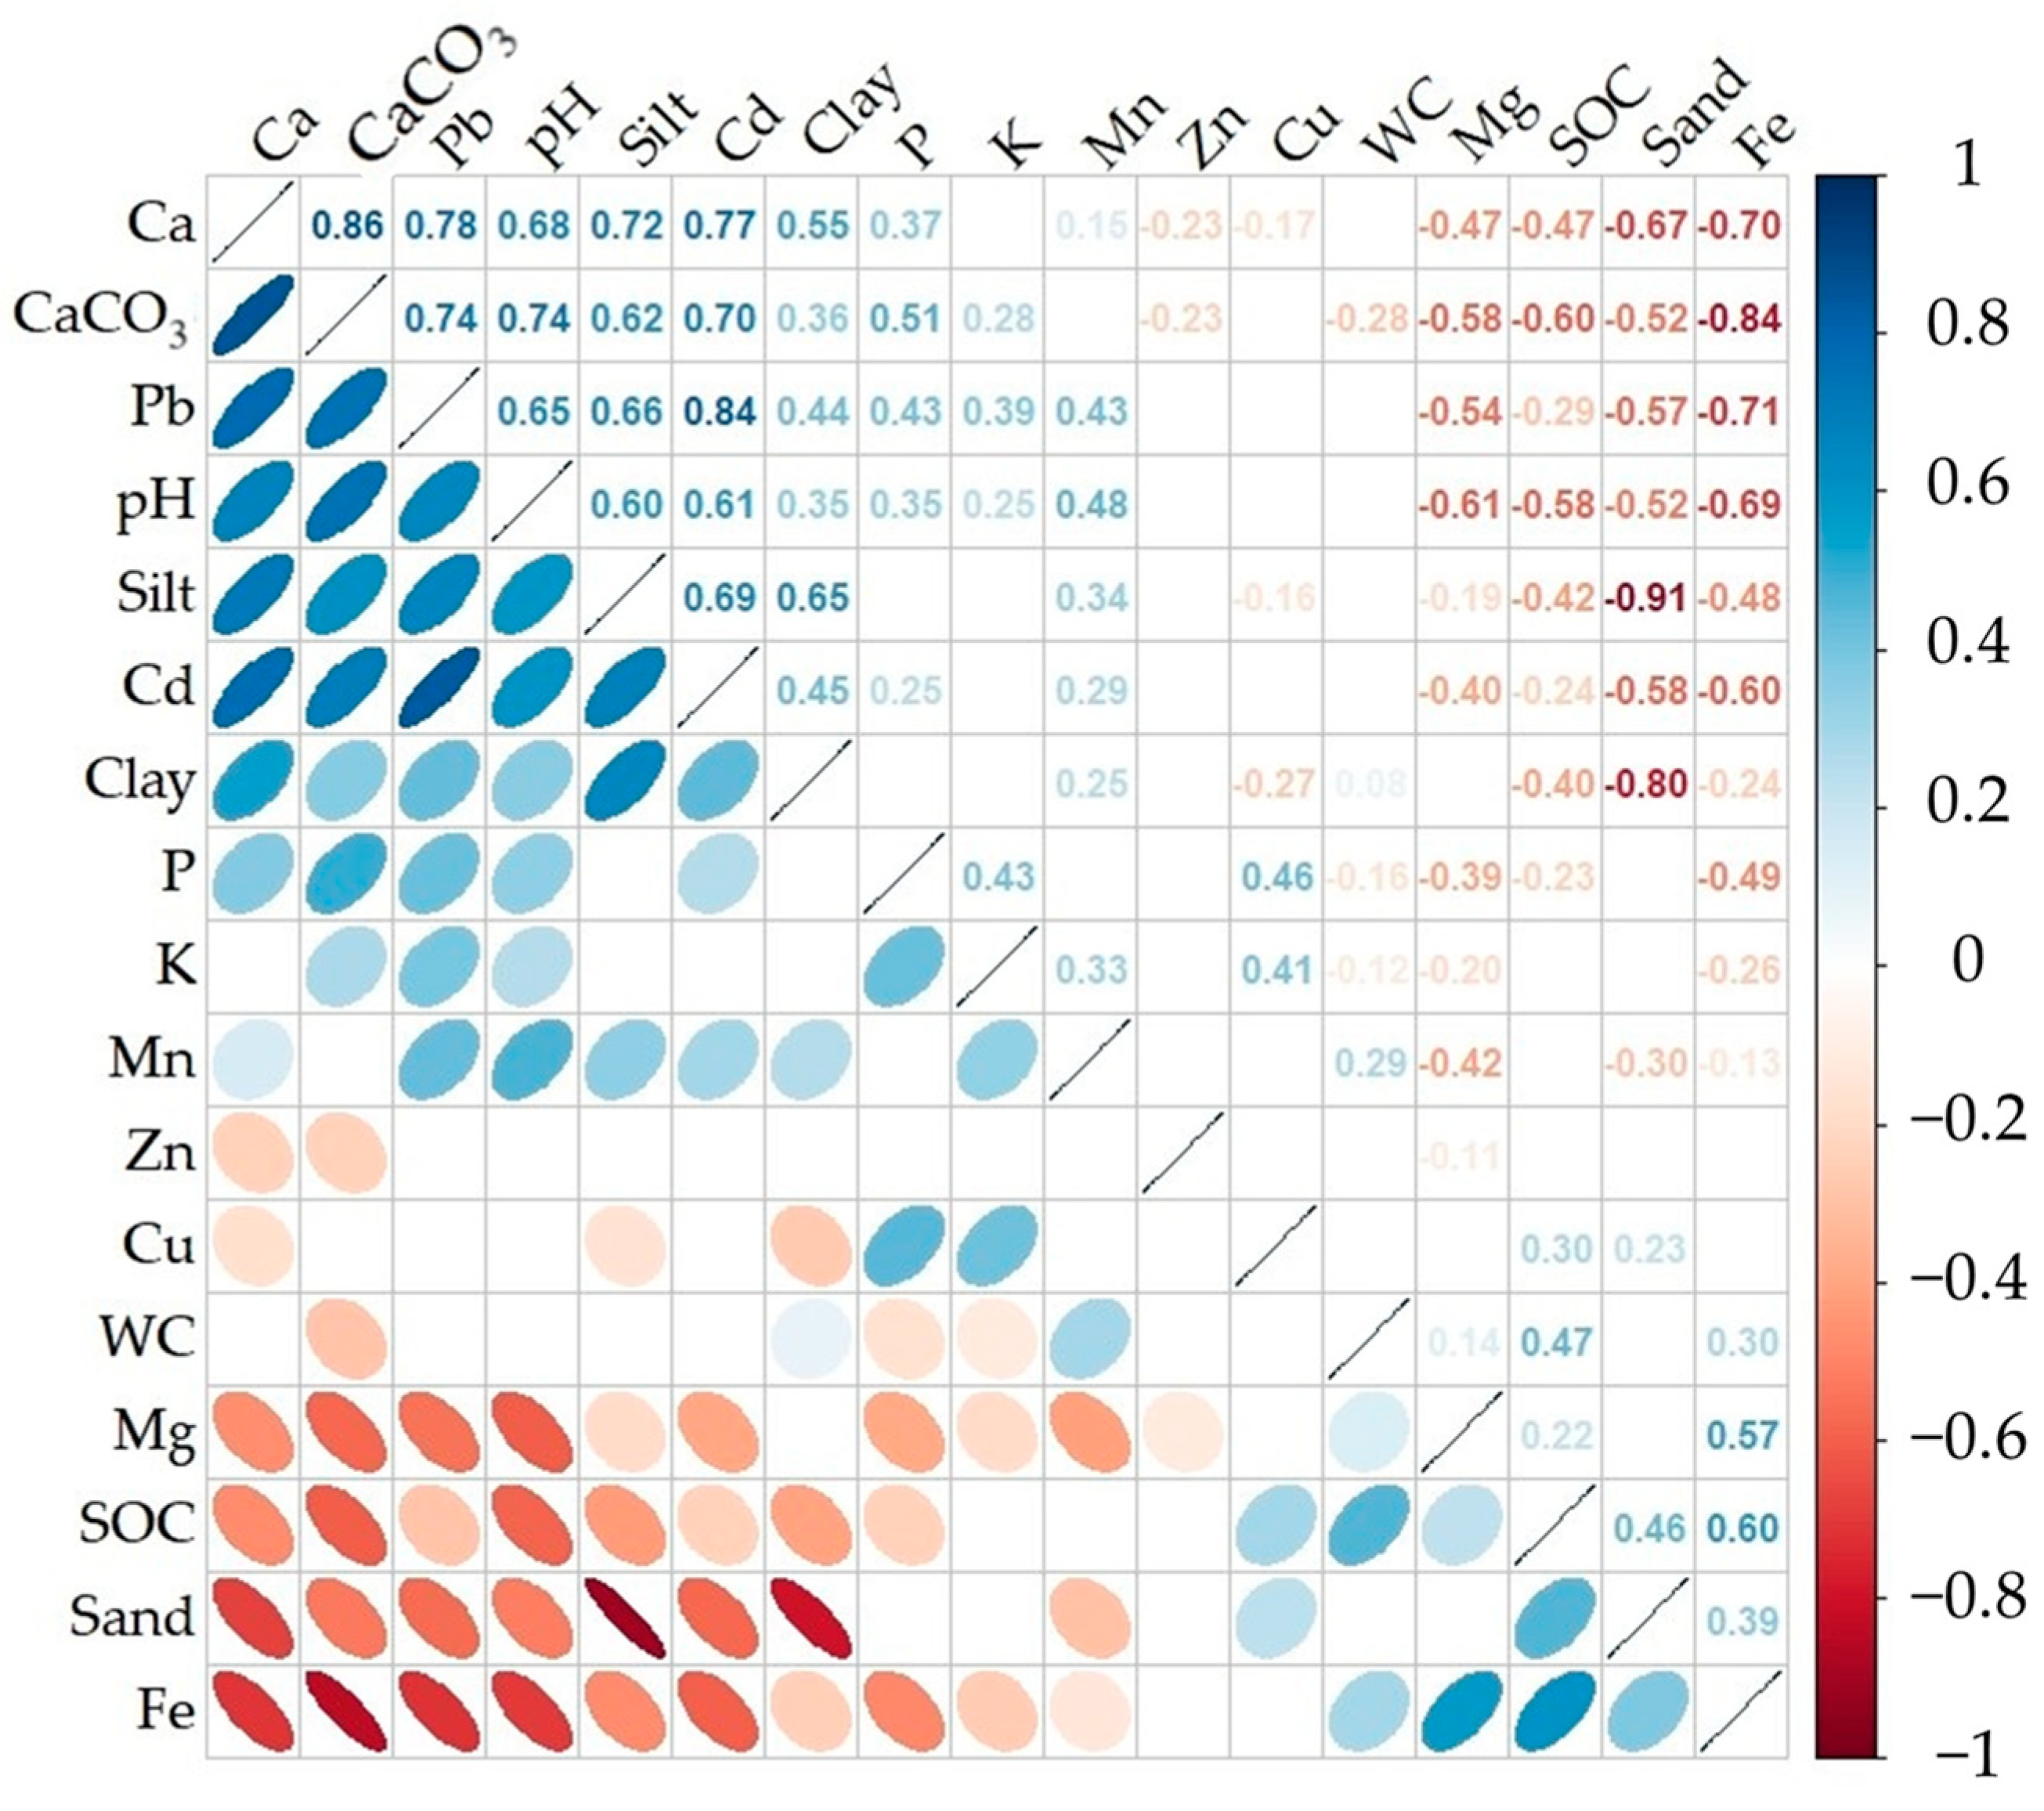
The correlation matrix for the studied soil properties is presented in Figure 3. Significant correlations were found (r = 0.3–0.91, r ≥ 0.4 for half of pairs) between most soil parameters. CaCO3 was found to be significantly correlated with the majority of the soil properties analyzed (excluding Mn and Cu). These relations could be divided into two groups (descending order): (i) positive (Ca, pH, Pb, Cd, silt, P, clay, and K) and (ii) negative (Fe, SOC, Mg, sand, and Zn). Very strong (r > 0.8), strong (r = 0.6–0.8), and moderate (r = 0.5–0.6) negative correlations between CaCO3 and Ca, CaCO3 and pH, Cd, Pb, silt, and CaCO3 and Fe, SOC, sand, Mg content, respectively, were noted (Figure 3). A group of nutrient elements (Ca, Mg, Cd, Fe, and Pb) displayed significant and greater correlations with the basic properties, whereas the other elements (P, Cu, K, Zn, and Mn) mainly exhibited weaker yet significant correlations (Figure 3). As is obvious from the summarized relations, Fe and Mg showed a negative reliance on pH and CaCO3, whereas Pb and Cd showed a strong positive reliance on pH and CaCO3. Meanwhile, high correlations were marked between some nutrients in the soil matrix, including the following: Ca and Cd, Cd and Pb, Ca and Pb, and Fe and Mg. Based on their interrelationships, the analyzed properties can be formally divided into two groups: (i) the first one includes CaCO3, silt, clay, pH, and their dependent elements (Ca, K, P, Cd, Pb, and Mn), and (ii) the second group includes SOC, Fe, sand, and Mg, Cu, Zn, and the second group has intricate relations between elements because of their weaker relationships with others.
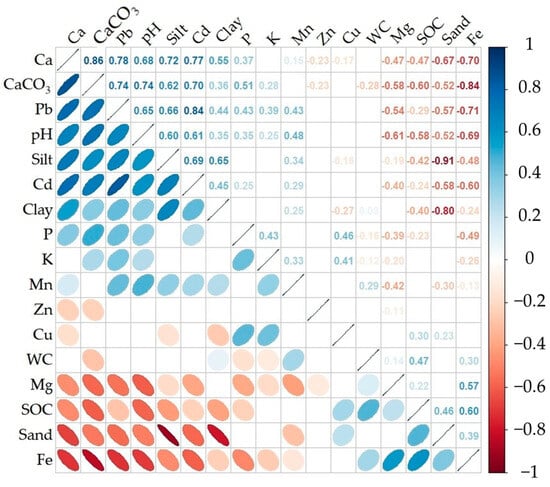
Figure 3.
The Spearman’s Rho correlation coefficients between the tested soil constituents (blank cells stand for insignificant correlations at the level of p ≤ 0.05; n = 114).
3.2. Influence of Spectral Pre-Processing Methods on the PLSR Model Calibration
Multiple pre-processing techniques were applied in a cross-validation set-up involving all samples to identify the best method for estimating each soil constituent. The PLSR modeling results of the cross-validation, calibration, and independent validation are summarized in Table 1, where the results of the Vis-NIR approach for the same sample set were adopted from our previous study [41].

Table 1.
Optimal pre-processing methods for each soil property and statistics of cross-validation, calibration, and validation predictions.
A significant impact of the pre-processing method was noted compared to the predictions based on the raw spectra. The first derivative spectra (D1) produced more reliable predictions for 11 of the 17 soil properties, including CaCO3, SOC, Fe, silt, pH, Ca, Cu, K, Mn, and Pb (Table 1). For the sand and clay predictions, the Savitzki–Golay smoothing (SG) provided more accurate predictions. Multiplicative scatter correction (MSC), standard normal variate (SNV), squared root of the spectra (SqR), and absorbance spectra (Ab) were established as the optimal pre-processing techniques for Mg, WC, P, and Cd, respectively (Table 1). Ranking the applied pre-processing methods based on the cross-validation predictions, the models were excellent for CaCO3, Ca, and SOC; very good for silt, sand, Fe, and Pb; good for pH, Cd, and Mg; and fair for clay, WC, K, and Mn. However, P, Mg, and Zn were weakly predicted (Table 1).
The models were again calibrated (75% of samples) and validated (25% of samples), and significant alterations appeared between the statistics of the cross-validation, calibration, and validation for some soil properties. These effects, especially the low RPD values for several soil properties, could be related to the statistics of the subsets [18]. Thus, based on the independent validation statistics, considerable improvements were noted for pH, Cd, Mg, Mn, P, and Zn; the models shifted from good to very good or from poor to fair, whereas inverse cases occurred for Fe and WC. Overall, the predictions for all soil properties were reliable, with a wide range of validation subsets (poor to excellent): R2 = 0.48 (WC) = 0.99 (CaCO3) and RPD = 1.12–6.47 (Table 1).
3.3. Spectral Soil Properties
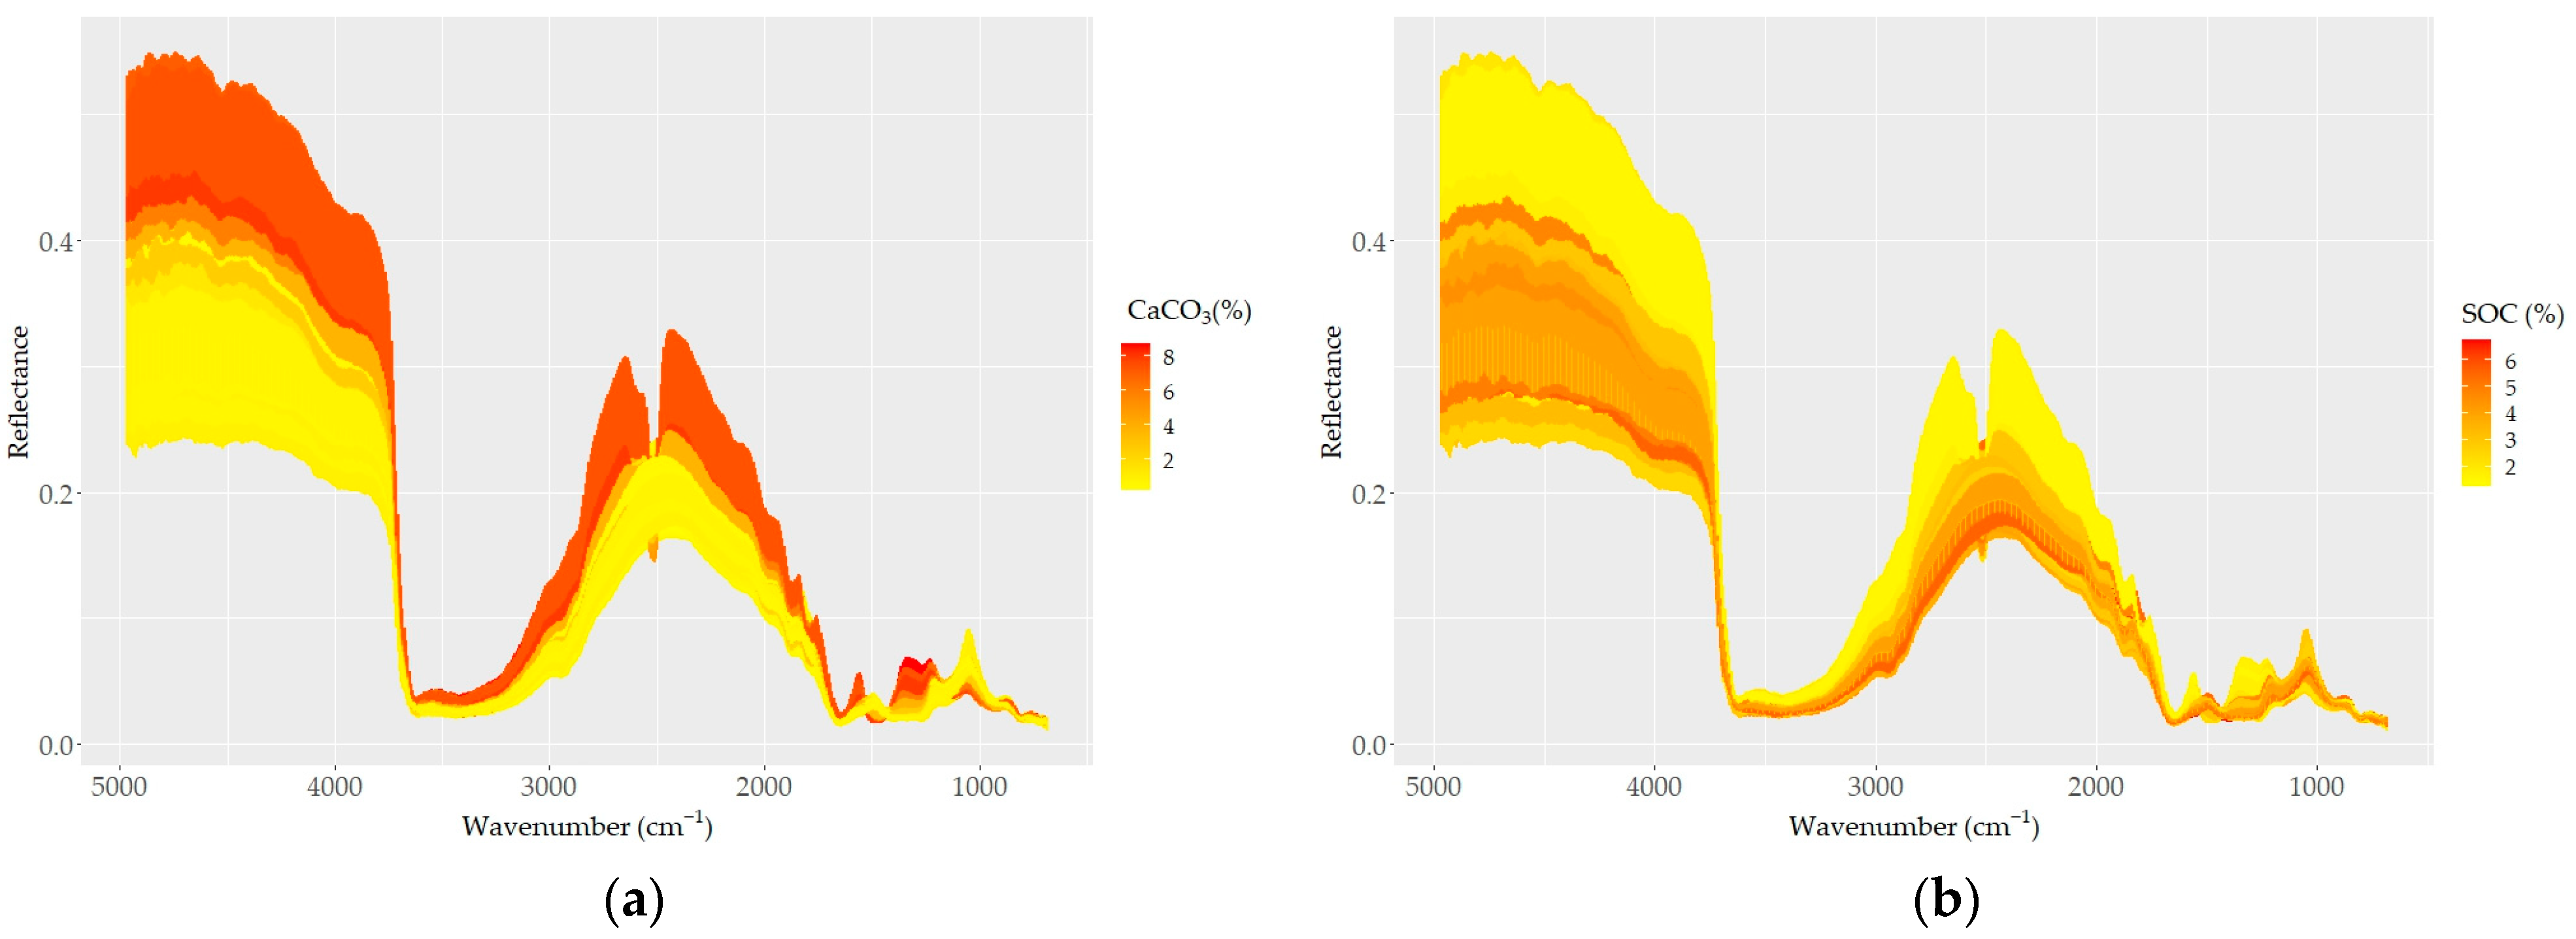
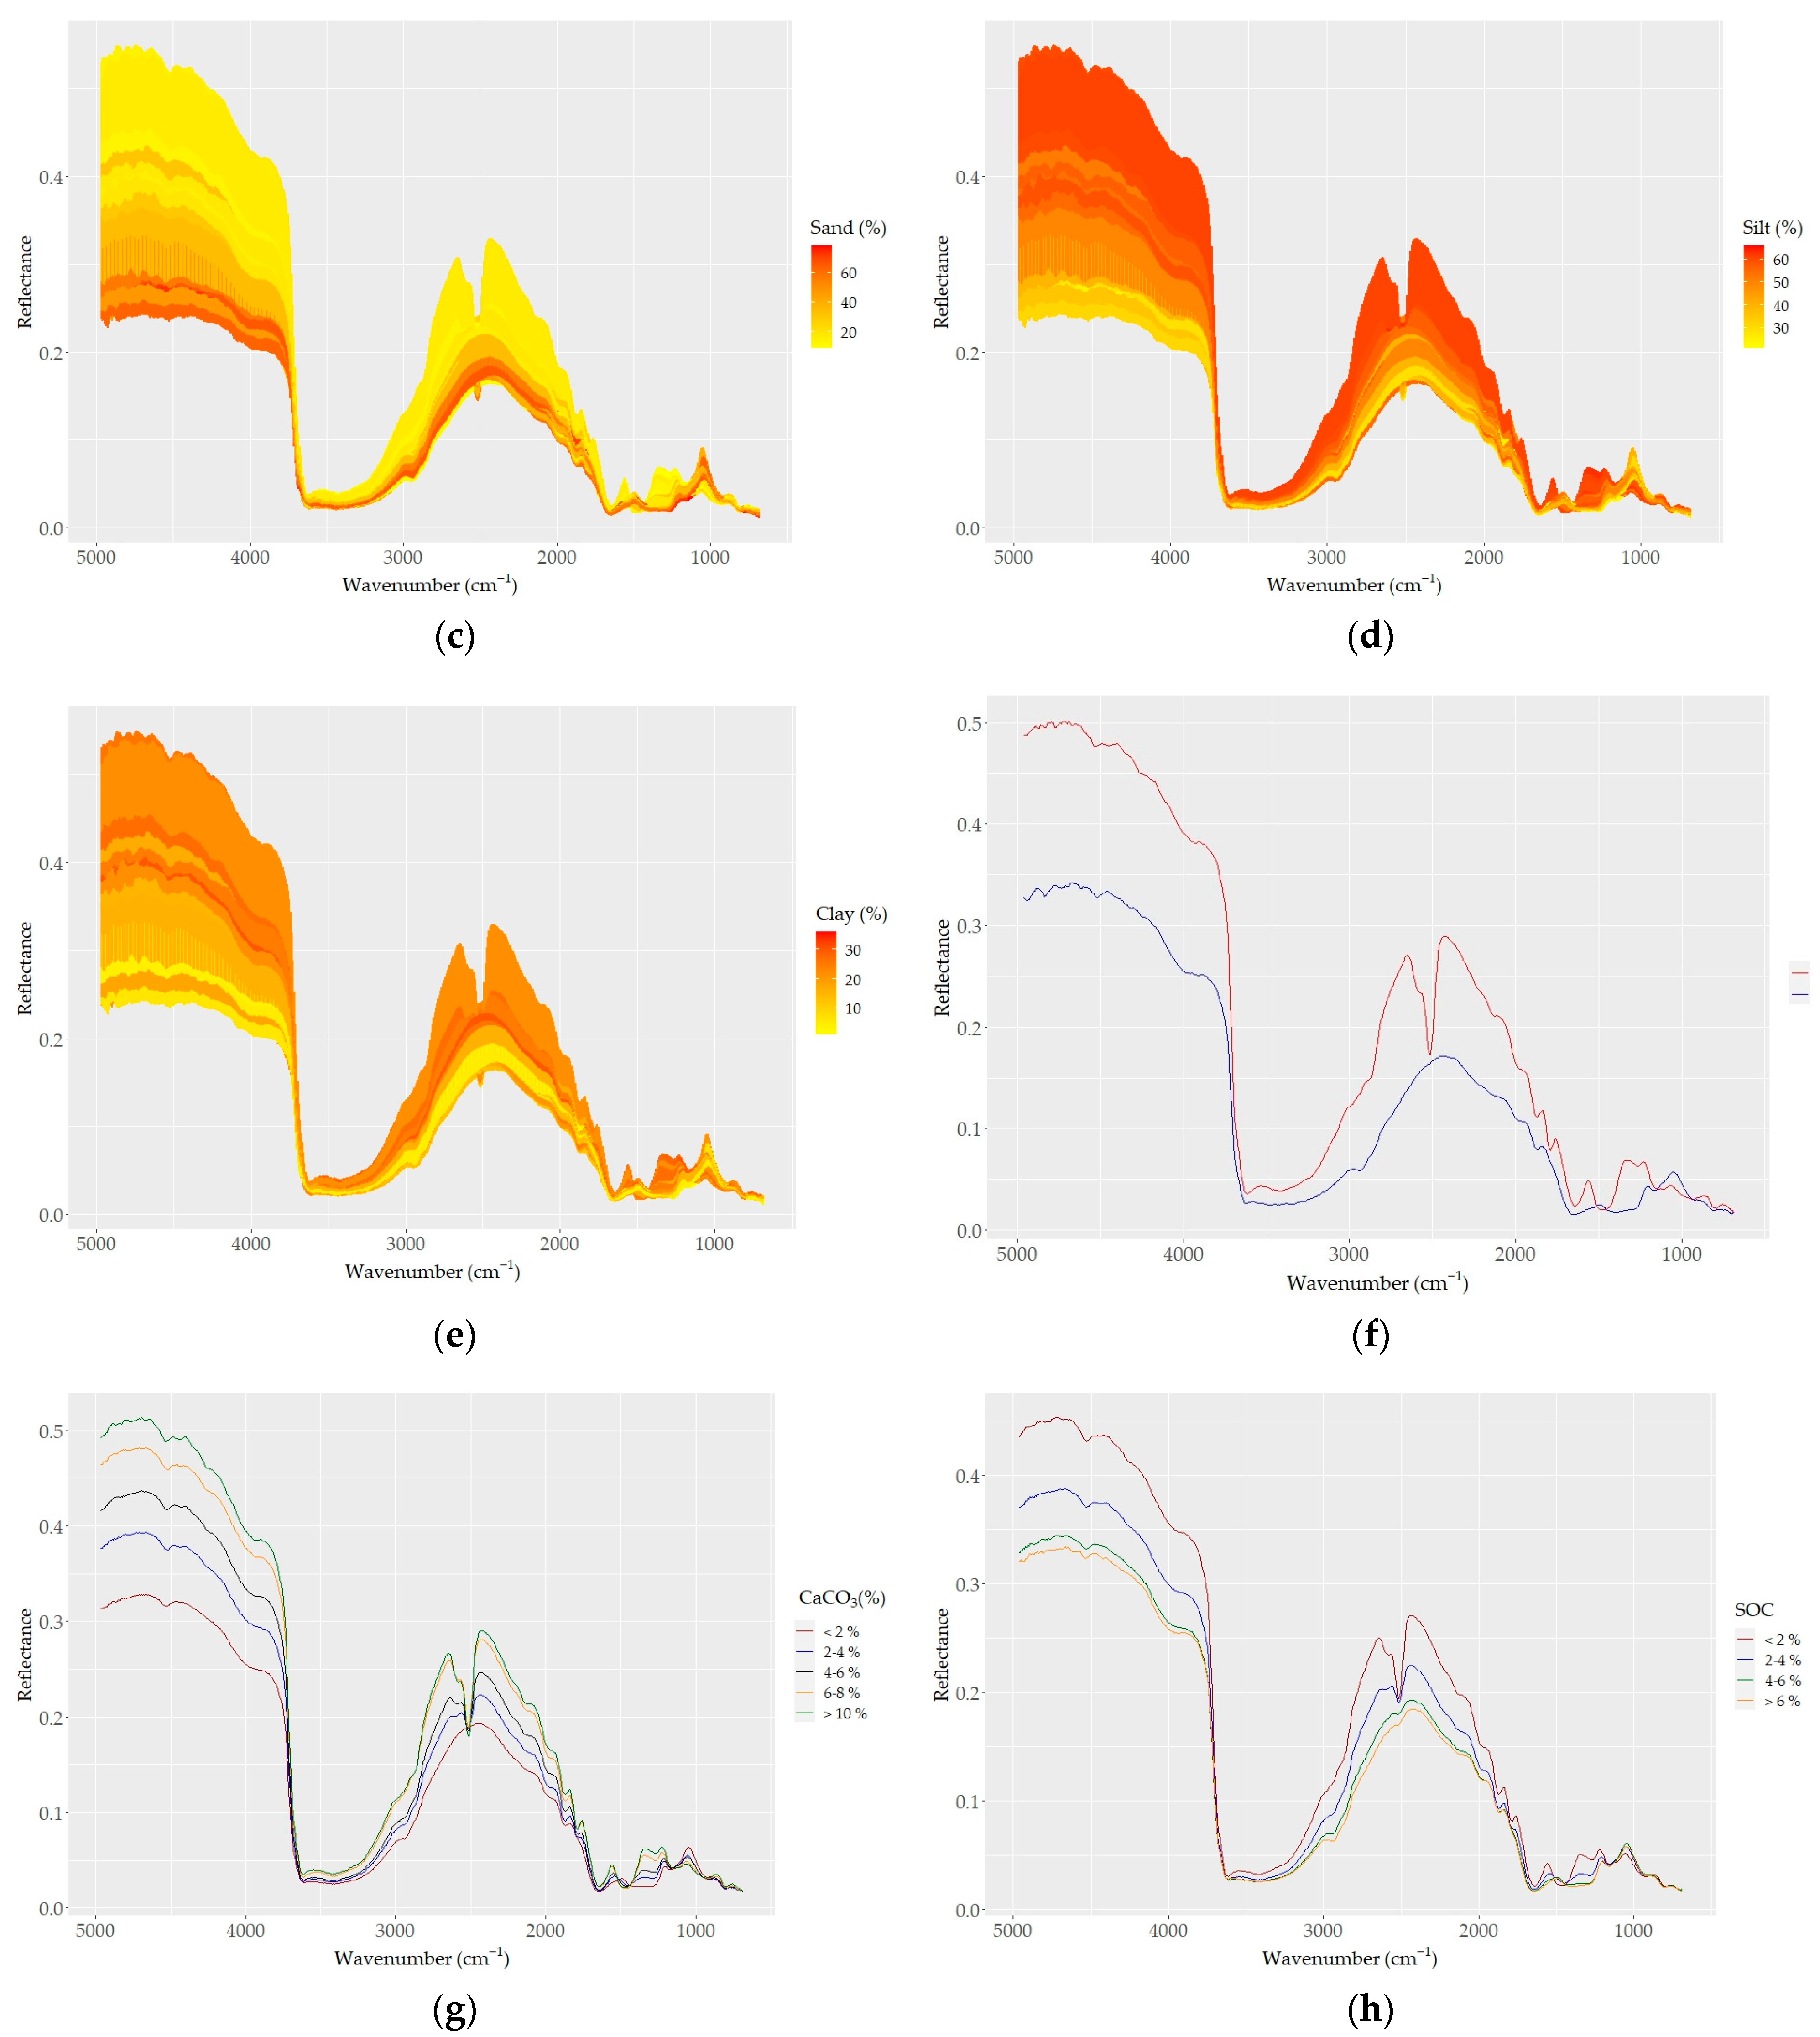
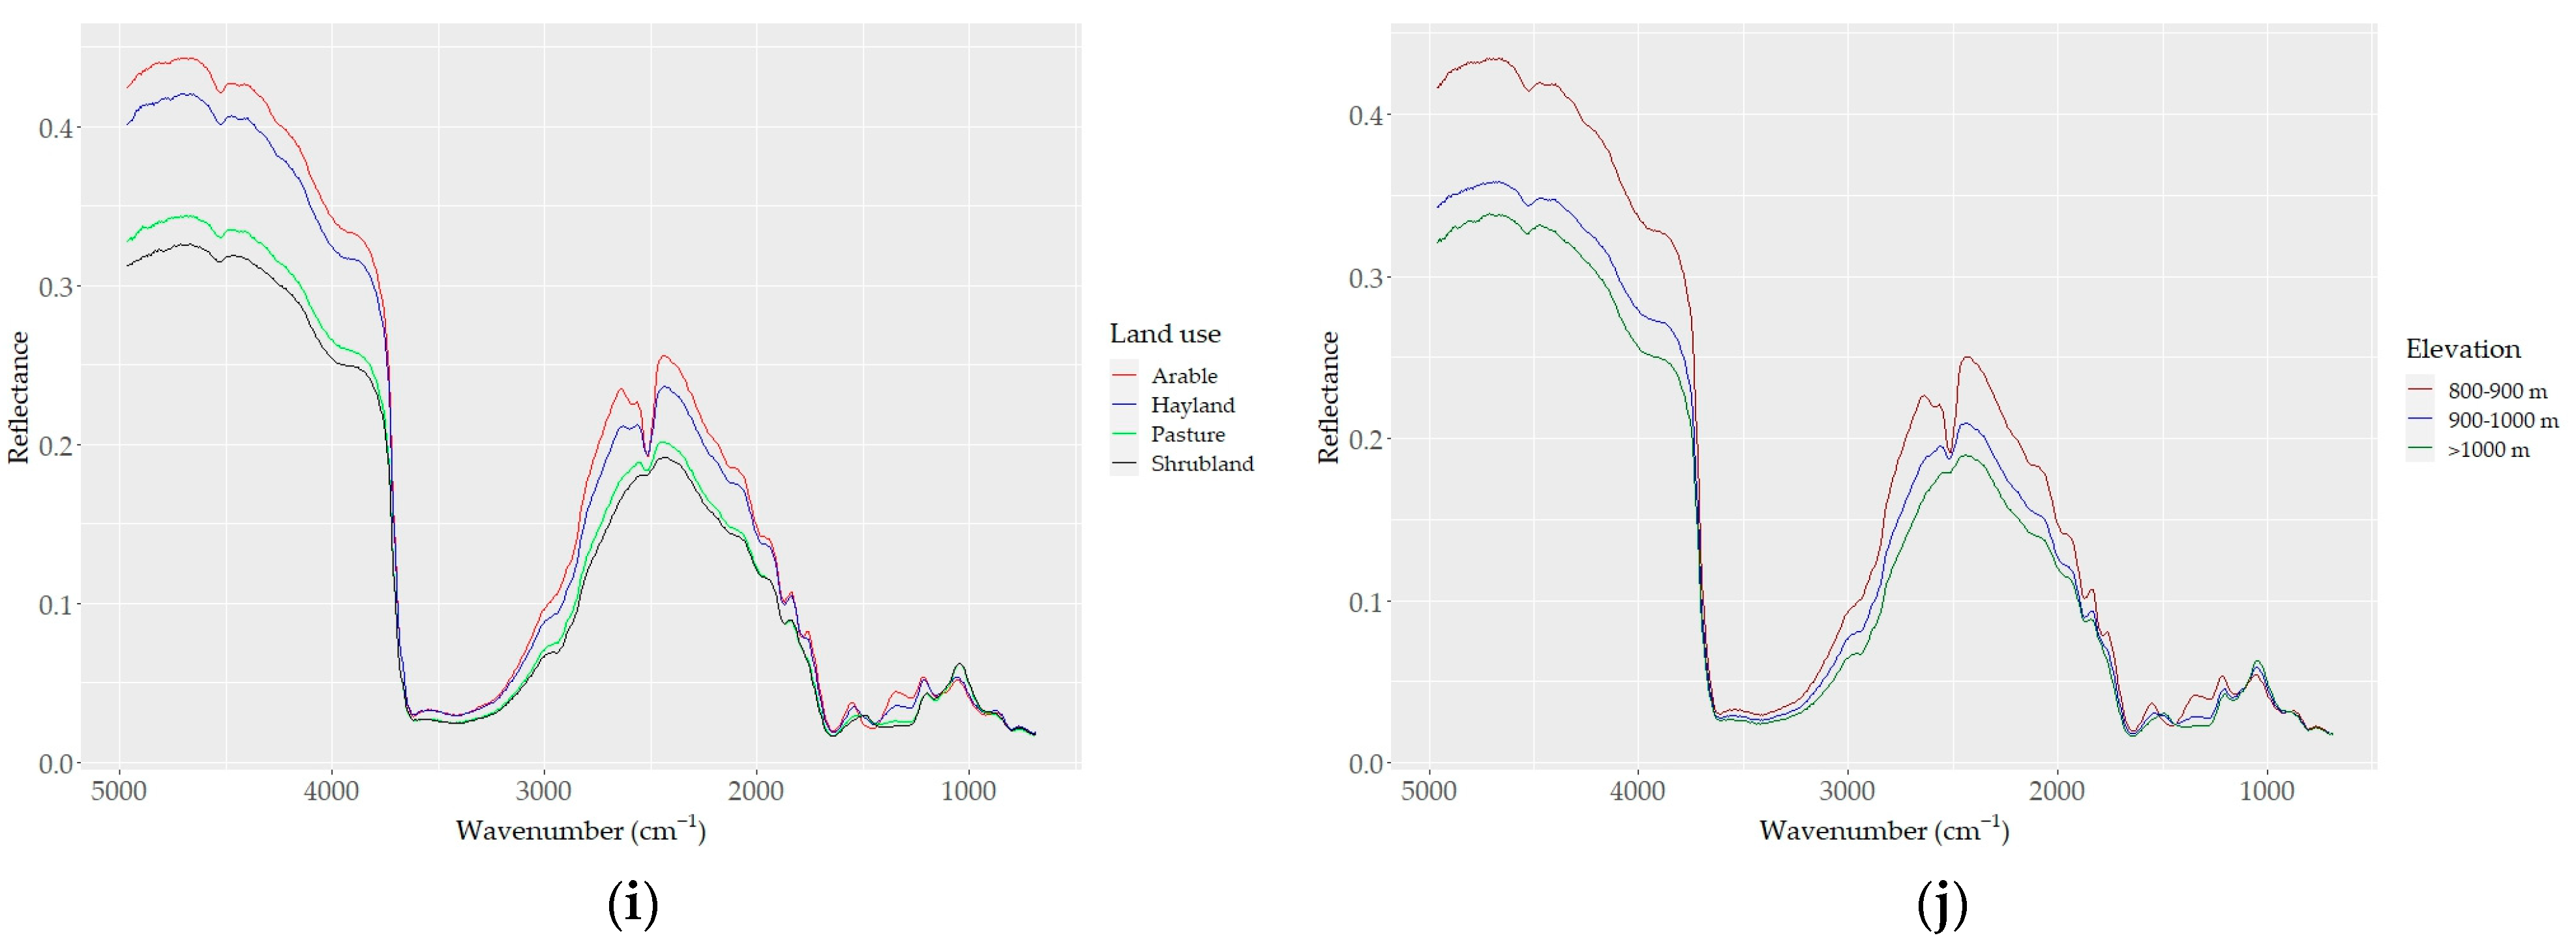
The sample spectra showed higher reflectance and larger variability in shorter wavelength regions (e.g., 5000–4200 cm−1) compared to longer wavelength regions (4200–650 cm−1), where a higher optical density and number of absorption peaks were apparent (Figure 4). The most remarkable steep-sided feature typical in all spectra was observed at around 3625 cm−1 and may be related to the elongating of OH groups in the 2:1 layer. The MIR spectra of all samples, as well the averaged spectra, captured the variability found in the soil chemical data. The averaged spectra with different contents of CaCO3 and SOC, as well with different elevations and land use types, allowed us to differentiate apparent spectral manifestations (Figure 4). The CaCO3 and SOC contents caused variations in spectral reflectance intensity and absorption features; samples containing higher CaCO3 contents showed higher reflectance intensity and absorption features at corresponding spectral bands (Figure 4a–f). A strong absorption feature appeared at 2520 cm−1, and the depth and width of the absorption feature dramatically changed according to the CaCO3 content; the feature was replaced with convex shape for samples with lower contents of CaCO3 (< ~2%) (Figure 4f,g). However, with increasing CaCO3 content, the absorption features showed a pronounced increase in the concave features.
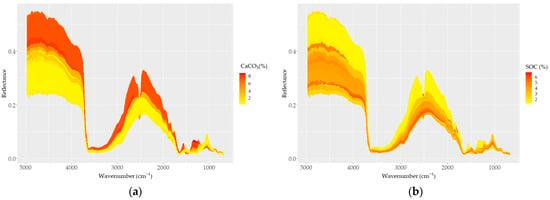
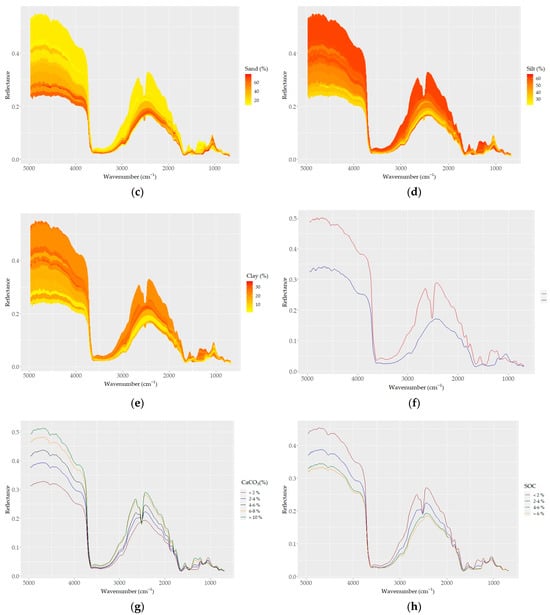
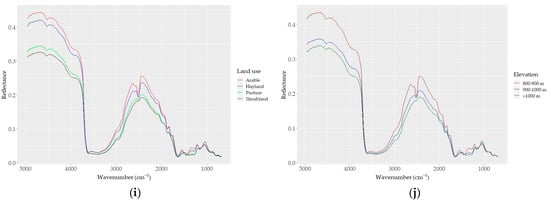
Figure 4.
DRIFT color-coded spectra of all samples (a–e) based on basic soil properties: (a) CaCO3, (b) SOC, (c) sand, (d) silt, and (e) clay contents. (f) Spectra of samples with the highest CaCO3 (red) and SOC (blue) contents; (g–j) samples grouped based on (g) five levels of CaCO3; (h) four levels of SOC; (i) four types of land use; and (j) three levels of elevation.
Based on the effect of CaCO3 on their reflectance, the soil spectra can be divided into two groups: (i) carbonated (CaCO3 > 2%) and (ii) non (low)-carbonated soils (CaCO3 < 2%). High reflectance and a strong absorption band centered around 2520 cm−1 were typical for the carbonated soils. The non-carbonated soils were characterized by an inverse spectral behavior, low reflectance, and a lack of the absorption band centered at 2520 cm−1 (Figure 4g). The absorption depth increased distinctively with increasing amounts of CaCO3 at 2520 cm−1; overall, the absorption feature covered a region from ~2400 to ~2600 cm−1. Apart from the two differentiated main spectral features, the carbonated soils appeared with absorption bands evident at 1500 and 1100 cm−1, which were not present in the non (low)-carbonated soils. Based on the heterogeneity of the structure of soil organic matter, four groups of SOC spectra showed apparent variability; the spectra of soils with high SOC contents were low in reflectance across the whole wavelength range, and samples containing lower SOC contents showed stronger reflectance intensity values (Figure 4b–h).
The effect of the sand content on soil reflectance was also evident in its relations to SOC and CaCO3. As sand was positively and negatively correlated with SOC and CaCO3, respectively, the spectra of high-sand-content samples showed low reflectance (Figure 4c). The effect of clay and silt contents on the soil reflectance was similar to that of CaCO3: the higher the clay and silt contents, the higher the reflectance (Figure 4d,e). Both the color-coded and averaged spectra allowed for the discrimination of the spectral features associated with clay minerals between 3700 and 3600 cm−1 and 2000 and 1790 cm−1, as well as the discrimination of the spectral features associated with silicates between 1280 and 1070 cm−1 (mostly quartz; Si–O and silicate, respectively). Furthermore, the absorption bands of organic matter were also evident (aliphatic C–H elongating bands at 2960 cm−1 and 2870 cm−1; amide I and II bands in the region between 1640 and 1400 cm−1).
3.4. Prediction Mechanism
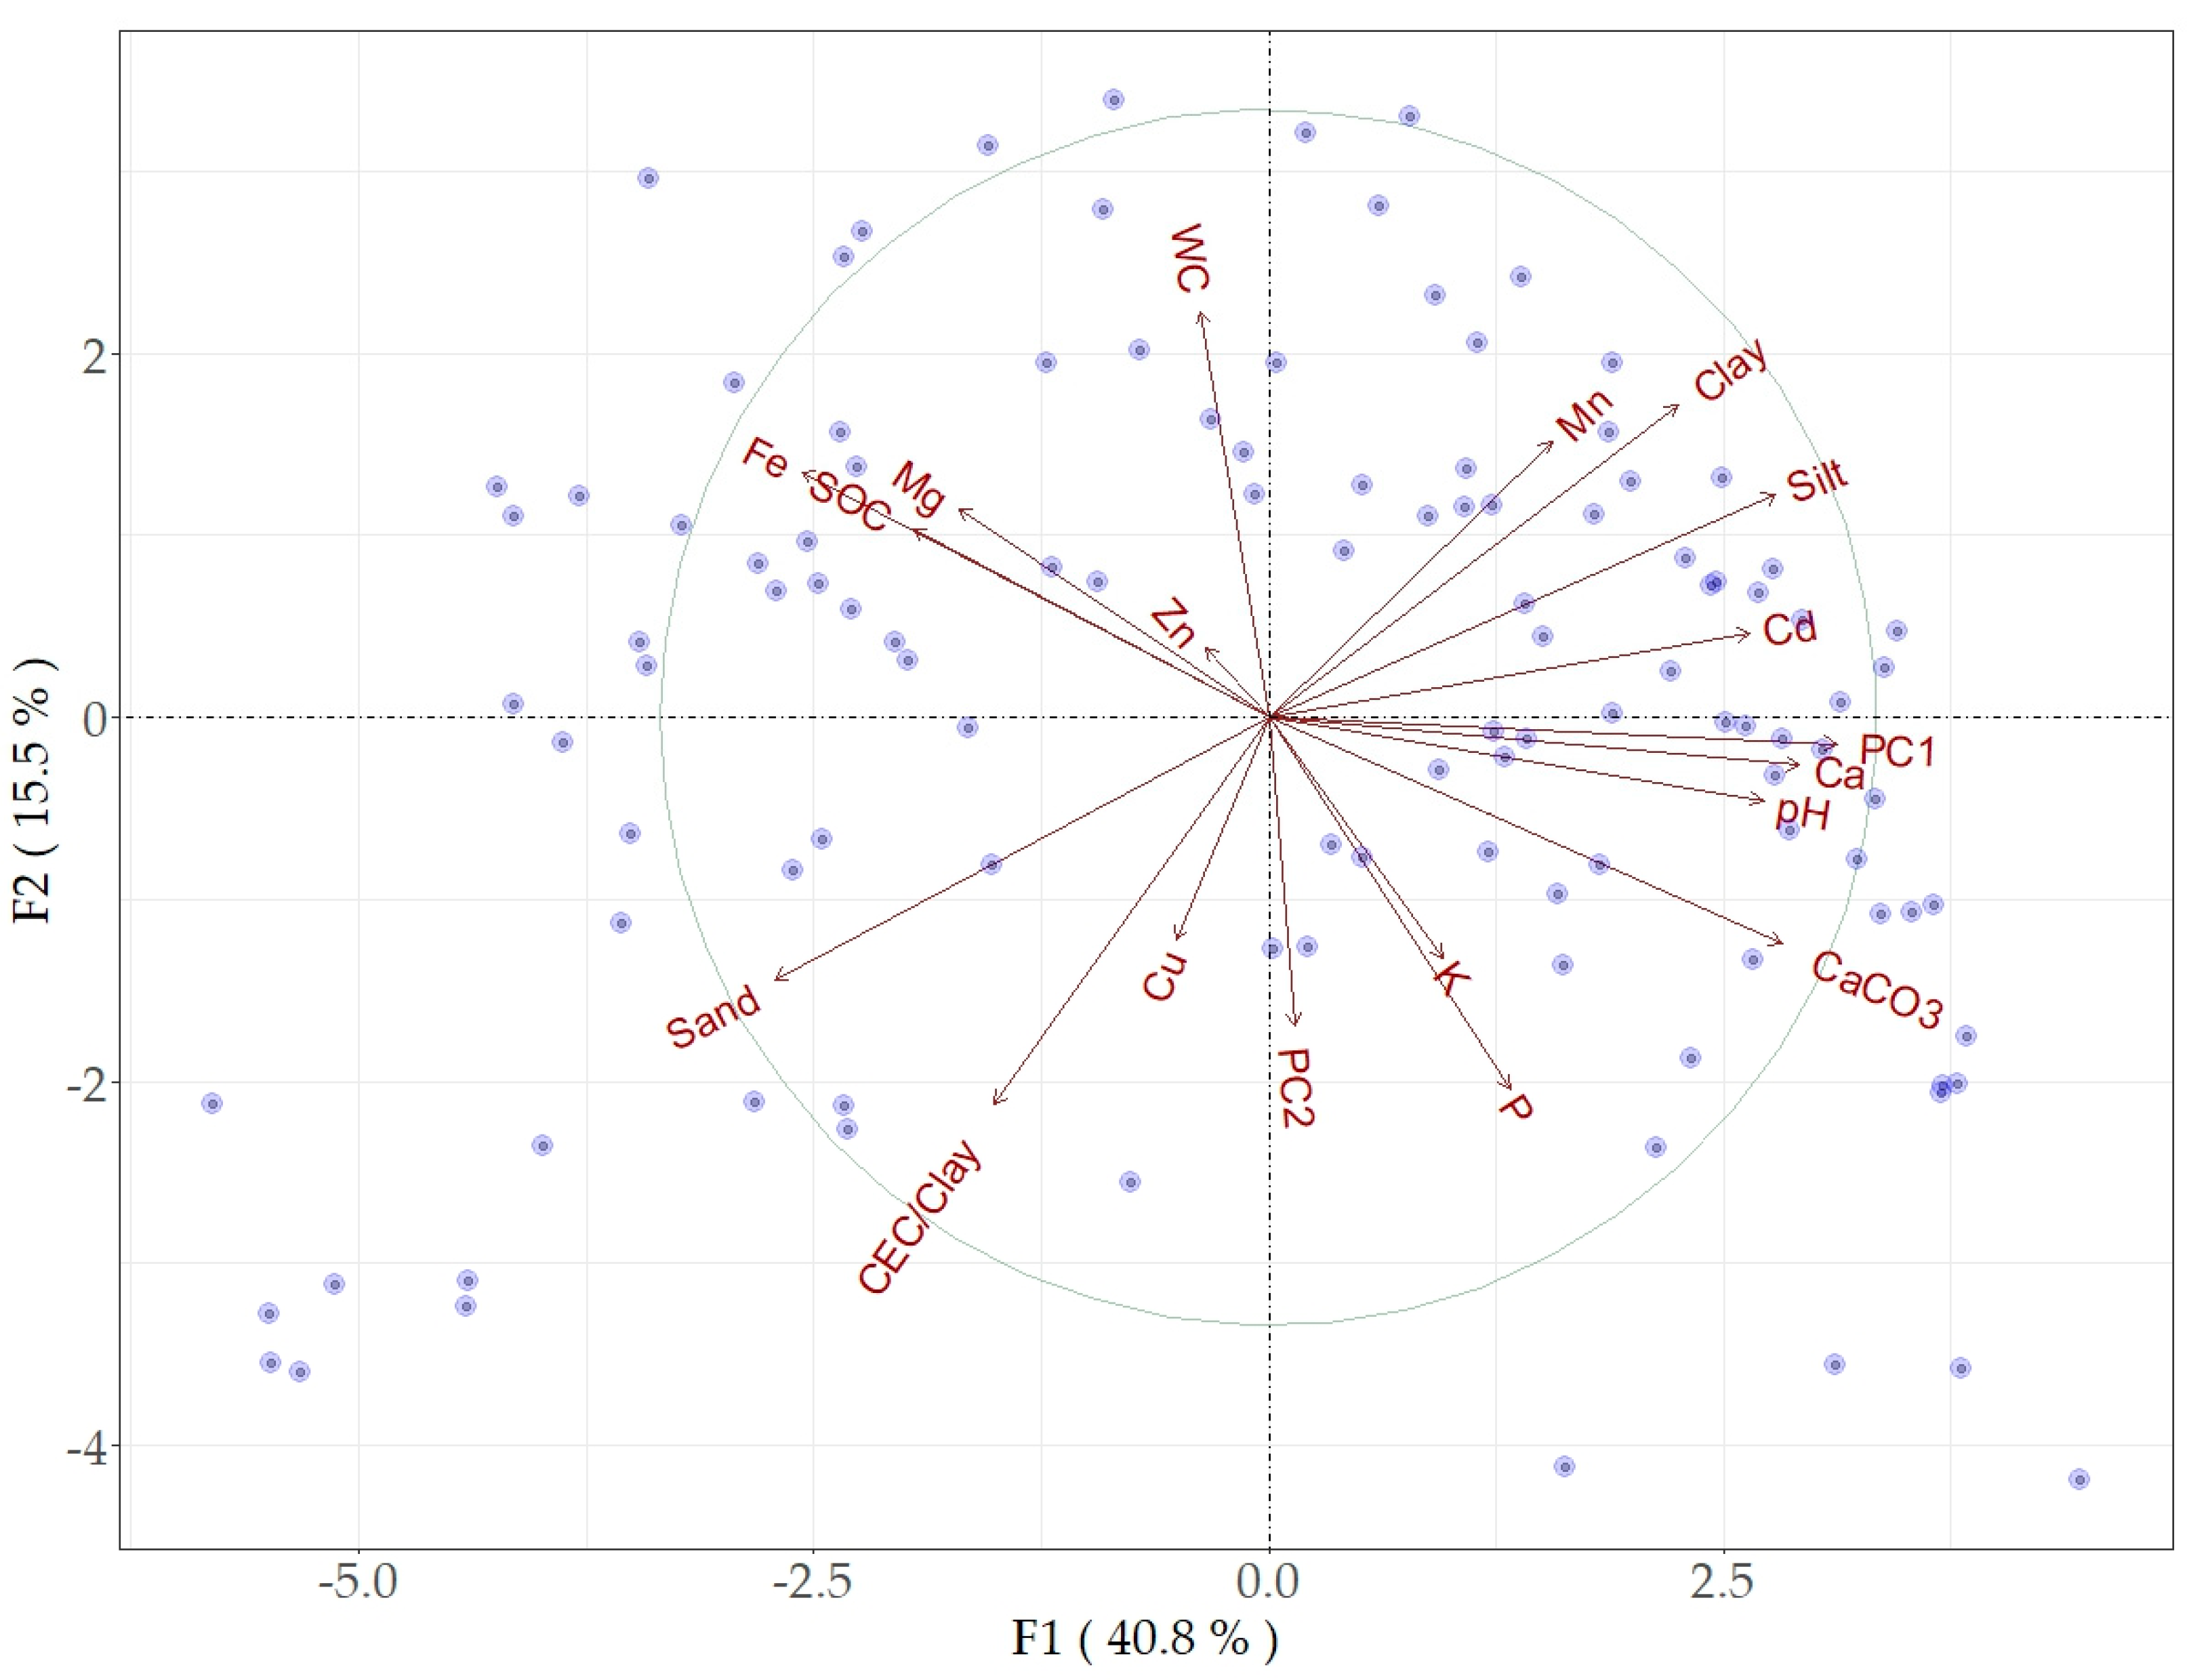
The PCA of the original spectral data, as well as the PCA of the first two principal components, provided a valuable insight into the relations between the spectral data and soil properties. The PCA analysis of the spectral data and soil properties produced a highly discriminating pattern with considerable orthogonality. Almost 90% of the variance of the initial spectral data was explained by PC1 and PC2. The first two components (F1 and F2) accounted for approximately 57% of the total variability (Figure 5). Most of soil properties (CaCO3, clay, silt, pH, Ca, Pb, Cd, and Mn) were associated with PC1, while SOC, Fe, Mg, and Zn showed inverse relation with both PC1 and PC2. The sand, CEC/clay, and Cu contents showed specific orthogonality with other soil properties due to the relations between particle sizes, SOC, and CEC/Clay. WC was inversely related to PC2 and showed orthogonality with most soil properties. All soil properties, except Zn, were nearly proportional to the variability involved in PC1. The pattern of sample distribution far from the biplot origin could be linked to significant variability and performance quality (Figure 5).
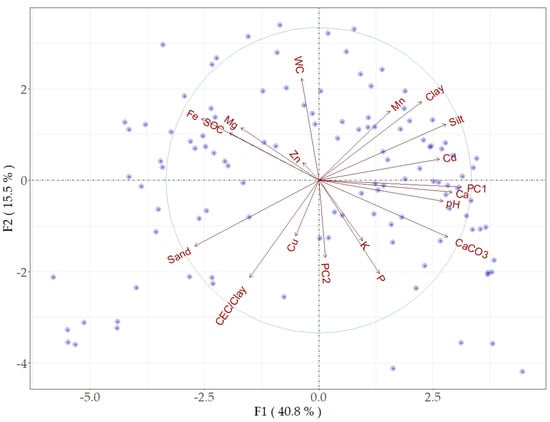
Figure 5.
Biplot of PCA F1 and F2 factors based on soil properties and the first two principal components (PC1 and PC2) of the spectral reflectance data.
Unlike our PCA, the partial correlation analysis, which aimed to estimate the contribution of spectrally active soil properties on the strength of the correlation between PC1 and the soil properties (with controlling basic soil properties) was appropriate for evaluating the prediction mechanisms within the MIR data. PC1, representing the spectral data, was significantly correlated (r = −0.25–0.78) with all soil properties except Cu, Mn, and Zn (Table 2). As CaCO3 was controlled, the correlation coefficients between the spectral data and soil properties were substantially decreased, indicating its dominant contribution compared to others. The correlation between PC1 and SOC, pH, Fe, WC, and P became insignificant, while others remained significant (Table 2). When the particle sizes were controlled, the correlations between PC1 and WC, Mg, and P were increased. The SOC and Fe showed substantial effects on WC and Mn and notable effects on other soil properties. Controlling the WC led to results that appeared to be different from those of other spectrally active elements (CaCO3, particle sizes, Fe, and SOC); the correlation coefficients between PC1 and clay, silt, sand, Ca, Cd, and Pb were increased, and between PC1 and Mn, they changed from being insignificant (r = 0.16) to significant (r = 0.25). The simultaneous control of CaCO3, clay, and Fe incisively decreased the relations between PC1 and the soil properties. Except for K, the relations of all nutrient elements with the spectral data changed from weak, moderate, or strong significant correlations to insignificant or weak correlations (silt and sand) (Table 2).

Table 2.
Spearman’s Rho correlation coefficients between the first principal component (PC1) of the soil reflectance spectra and soil properties (first row) and the partial correlation coefficients when controlling the basic soil properties. The upper and lower parts of the table are related to the correlations between the spectrally active soil properties and macronutrients and micronutrients, respectively.
4. Discussion
4.1. Soil Characteristics
Although the study site was not remarkably large (520 ha), the tested soil properties were found to have a wide range of variability and distribution patterns. The correlations found between the soil properties, as well as between CaCO3 and other soil properties (Figure 2, Table 2), reflected the typical and complex soil-forming nature of a highland agriculture area associated with natural processes at various scales, such as weathering; changes in organic matter compounds; oxidation, reduction, and leaching; and ion binding to mineral surfaces [19,27,41,57]. With a bimodal distribution and the largest variability, the CaCO3 content was also strongly related to the apparent effects of elevation, slope, and their interaction on parent materials through weathering. The noted distribution characteristics of the soil properties were well reflected in the histograms and MIR spectra; the contents of CaCO3 and SOC, particle sizes, and pH yielded concordant patterns with elevation. Although the pH was impacted by CaCO3, its variability in the study area was relatively small, indicating a smooth continuous pattern (Figure 2). Our previous study in the same test area achieved the successful mapping of basic soil properties based on hybrid spatial models; the soil properties, particularly CaCO3, were significantly correlated with topographic variables and showed elevation-dependent spatial patterns [41,57] that were also shaped by land use intensity [27], as apparent in Figure 4g–j. The SOC content showed a more continuous variability (~35%), and the spectra of the grouped SOC samples showed a clear pattern (Figure 4b,h). However, in a study conducted in the semi-arid region of NW Spain, the SOC prediction performance was mostly determined by climate or soil water availability, while the land use and nature of parent material played a secondary role. As it appears from an earlier study [41], the combined effect of topography, elevation, and land use on SOC distribution was important in the studied land, since the test area was not comparable with the NW Spain region.
Attributed to an increase in precipitation or a decrease in calcareous parent material with elevation, the study area can be conditionally divided into two subzones: (i) the carbonate leaching and (ii) carbonate accumulation zones. The accumulation zone is limited to areas below ~900 m, whereas the areas above this elevation include mountainous deciduous forests where the soil moisture regime limits the carbonate accumulation within the topsoil [27]. As differentiated above, the two subzones, associated with the distribution of quarts bedrock at higher elevations and calcareous parent material at low elevations, may provide an improved understanding of the differences in soil properties and their relations. The sand content increased, while the CaCO3 content decreased with elevation. Consequently, the positive correlations between (i) sand, Fe, and SOC and (ii) CaCO3, silt, and clay appeared as co-variables connected to the soil-forming condition in the study area. Both the silt and clay contents were inversely related to SOC. The noted relations imply how elevation and land use (e.g., Figure 4g–j), as well as linked clay mineralogy, soil texture, and other soil properties (e.g., Fe, CaCO3, and pH), may control the SOC content [27,29]. Similar to CaCO3, the large variation in the Ca content (54%) was associated with its origin (i.e., calcareous parent material) (Figure 2 and Figure 3). Contrary to other nutrients with moderate variations (20–40%), the macro-nutrient elements K and P were largely variable (~50%), which is presumably related to N fertilization practices in cultivated fields as opposed to non-fertilized shrublands or pastures. The large variation in macro- and micro-nutrient contents could be related to differences in the elevation, as well as their sensitivity to the natural and land management processes and mechanisms of bonding to soil particles and organic matter [19,23,29,41].
As one of the main driving factors for soil-forming processes in the investigated area, CaCO3 was found to be strongly correlated with most of the soil properties, being positively with Ca, pH, Pb, Cd, silt, P, clay, and K, and it was negativity associated negatively with Fe, SOC, Mg, sand, and Zn (Figure 3). The strong correlations of CaCO3 with Ca (r = 0.86), SOC (r = −0.60), and pH (r = 0.74) confirm that CaCO3 is acting as the main source of electrolytes and Ca. This connection may affect (i) the interactions between SOC, cations, and minerals (e.g., Al-, Fe-, Mn-oxides; polyvalent cations, phyllosilicate clays; carbonates); (ii) the saturation of the clay and silt fraction with SOC as well as the SOC content by forming a stable complex with humic substances and mediating microbial communities; and (iii) soil pH by attaching Ca to soil particles and replacing the acid ion [69]. The found relations further imply that the mobility or availability of the nutrients were reliant on pH, SOC, and salinity (CaCO3), since the effect of pH on SOC can be mediated by Fe and Ca (CaCO3). In addition, strong correlations between some nutrients (Ca and Cd, Cd and Pb, Ca and Pb, and Fe and Mg) displayed a very close occurrence of these couples in the soil matrix (Figure 2).
In conclusion, the relations between soil properties as well their distribution patterns supported the role of the underlying calcareous parent material as the main source of allied soil properties and processes. The spreading nature and availability of nutrient elements is attributed to the variation in basic soil properties such as texture, CaCO3 (mostly) and pH, and SOC, along with co-occurring metals that can reliably act as predictive factors [19,29,70]. Moreover, the impact of small CaCO3 contents (e.g., electrolyte and Ca sources and pH changer) on soil bio- and geochemistry is still not fully understood in highland soils and needs increased attention for the monitoring of land and soil quality and degradation [69,71].
4.2. Model Performance
For predicting soil constituents, different pre-processing techniques were tested, and an optimal approach was found, the first derivate (D1) technique, which enhanced the important absorbance features of specific soil characteristics. All of the soil properties except for sand, clay, WC, Mg, Cd, and P (11 out of 17) were predicted more reliably with D1 than others (Table 1). The selected models based on MIR spectra used fewer factors compared to the Vis-NIR models, indicating that MIR spectra can capture more suitable information for predicting these parameters. This is related to the fact that the stronger occurrence of spectral bands, as well as the specificity of the absorption features in MIR spectra, captures more meaningful information and produces better predictions [72].
The modeling results indicated that D1 could be considered as a recommendable pre-processing technique in the study based on MIR-FTIR and VIS-NIR spectra as well [41]. This was presumably the reason why SG was found as an optimal technique only for the prediction of clay and sand in this study, while SG smoothing combined with the D1 technique was the optimal pre-processing technique for predicting fractions of soil organic matter and SOC both in Vis-NIR and MIR spectra ranges [73]. Also, using similar pre-processed MIR spectra, the reliable predictions of hot and total water extractable carbon and N content in the 45 soil amendments were obtained [36]. This study also highlighted the importance of the contribution of the chemical composition of organic matter or amendments and the contribution of particle size distribution to the prediction processes.
The MSC pre-processed spectra were found to provide the best results for the prediction of Mg in this study. This was likely due to its capability to enhance spectral data by reducing scattering effects caused by variations in sample thickness, particle size, and other factors. Analogous to MSC, the SNV method enhanced spectral data by removing variations induced by baseline shifts and particle sizes. The SNV pre-processing improved the prediction of WC, one of the poorly predicted soil properties [4,9].
The results regarding the MIR and Vis-NIR predictions, particularly for Ca, pH, CaCO3, and Fe, were in line with other studies and highlighted the capabilities of non-destructive FTIR spectroscopy as a time-saving and alternate approach for predicting a range of key soil properties [4,9,18,23,24,29]. Seybold et al. [29] effectively predicted different chemical and physical soil properties using MIR spectra coupled with PLSR for A and B horizons in Mollisols from central USA using an MIR spectral library. The prediction accuracy obtained in our study was in line with the prediction accuracy obtained by the authors of [29] for the SOC (R2 = 0.97; RMSE = 0.23), CaCO3 (R2 = 0.99, RMSE = 0.78), and clay contents (R2 =0.95, RMSE = 2.4) and pH (R2 = 0.53 and RMSE = 0.53) of the samples taken from A horizon. On the basis of USDA MIR (FTIR) spectral library data (~45.000 samples, 119 soil properties—physical, chemical, and biological), it was found that using MIR spectra (spectral range 600–7500 cm−1; PLSR, SG smoothing, and SNV transformation) could lead to the prediction of 50 soil properties with high accuracy and 44 properties with satisfactory accuracy, including some properties of Mehlich 3 macro- and micro-nutrients [9].
Thus, the MIR spectra were superior for estimating CaCO3, pH, SOC, sand, Ca, Mg, Cd, Fe, Mn, and Pb; however, Vis-NIR spectra gave better estimations for silt, clay, and K. Greenberg et al. [38] compared laboratory versus in situ Vis-NIR and MIR (Agilent 4300 Handheld FTIR) spectroscopy for the prediction of various soil properties (238 samples of Luvisols). In general, the accuracy of both Vis-NIR devices was comparable or slightly better than both MIR devices for sand, silt, and clay. In a measurement set-up similar to the one used in our study, Vohland et al. [18] compared the accuracy of the Agilent Handheld 4300 FTIR spectrometer and a portable Vis-NIR spectrometer for SOC quantification on a regional scale. The authors found that the FTIR data outclassed the Vis-NIR data in both laboratory and field conditions [18].
4.3. Prediction Mechanism
4.3.1. Correlation Patterns
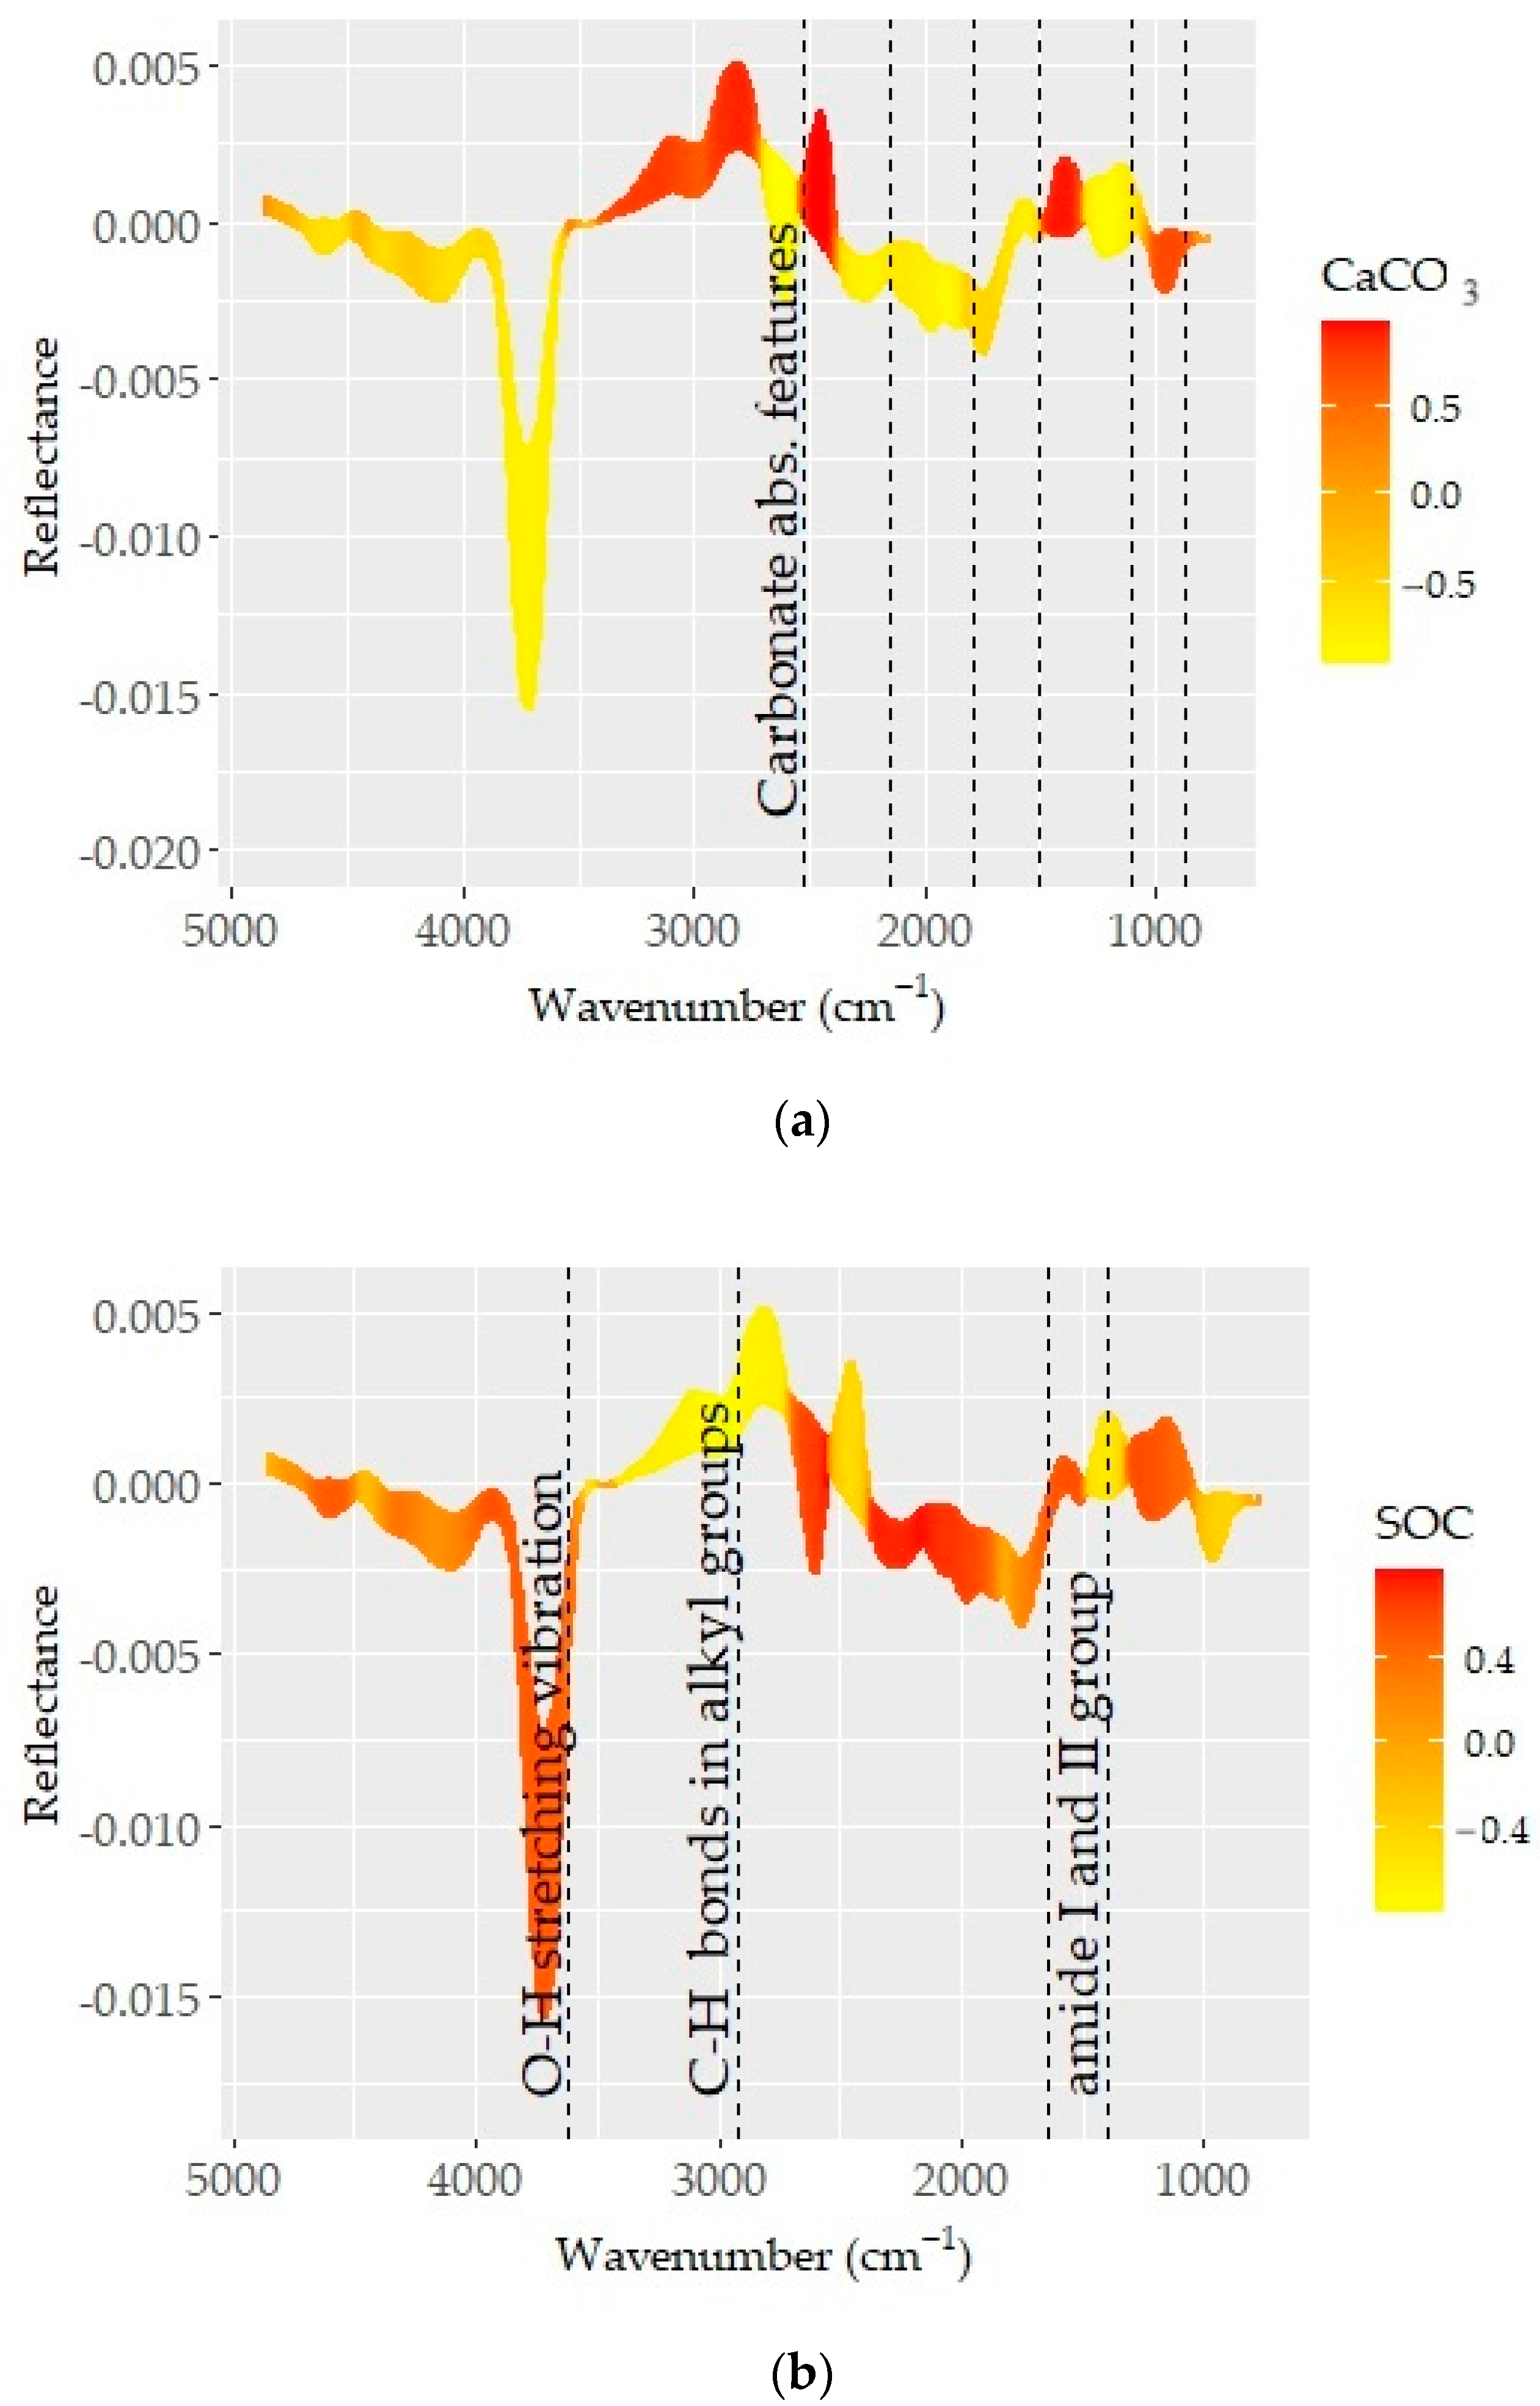
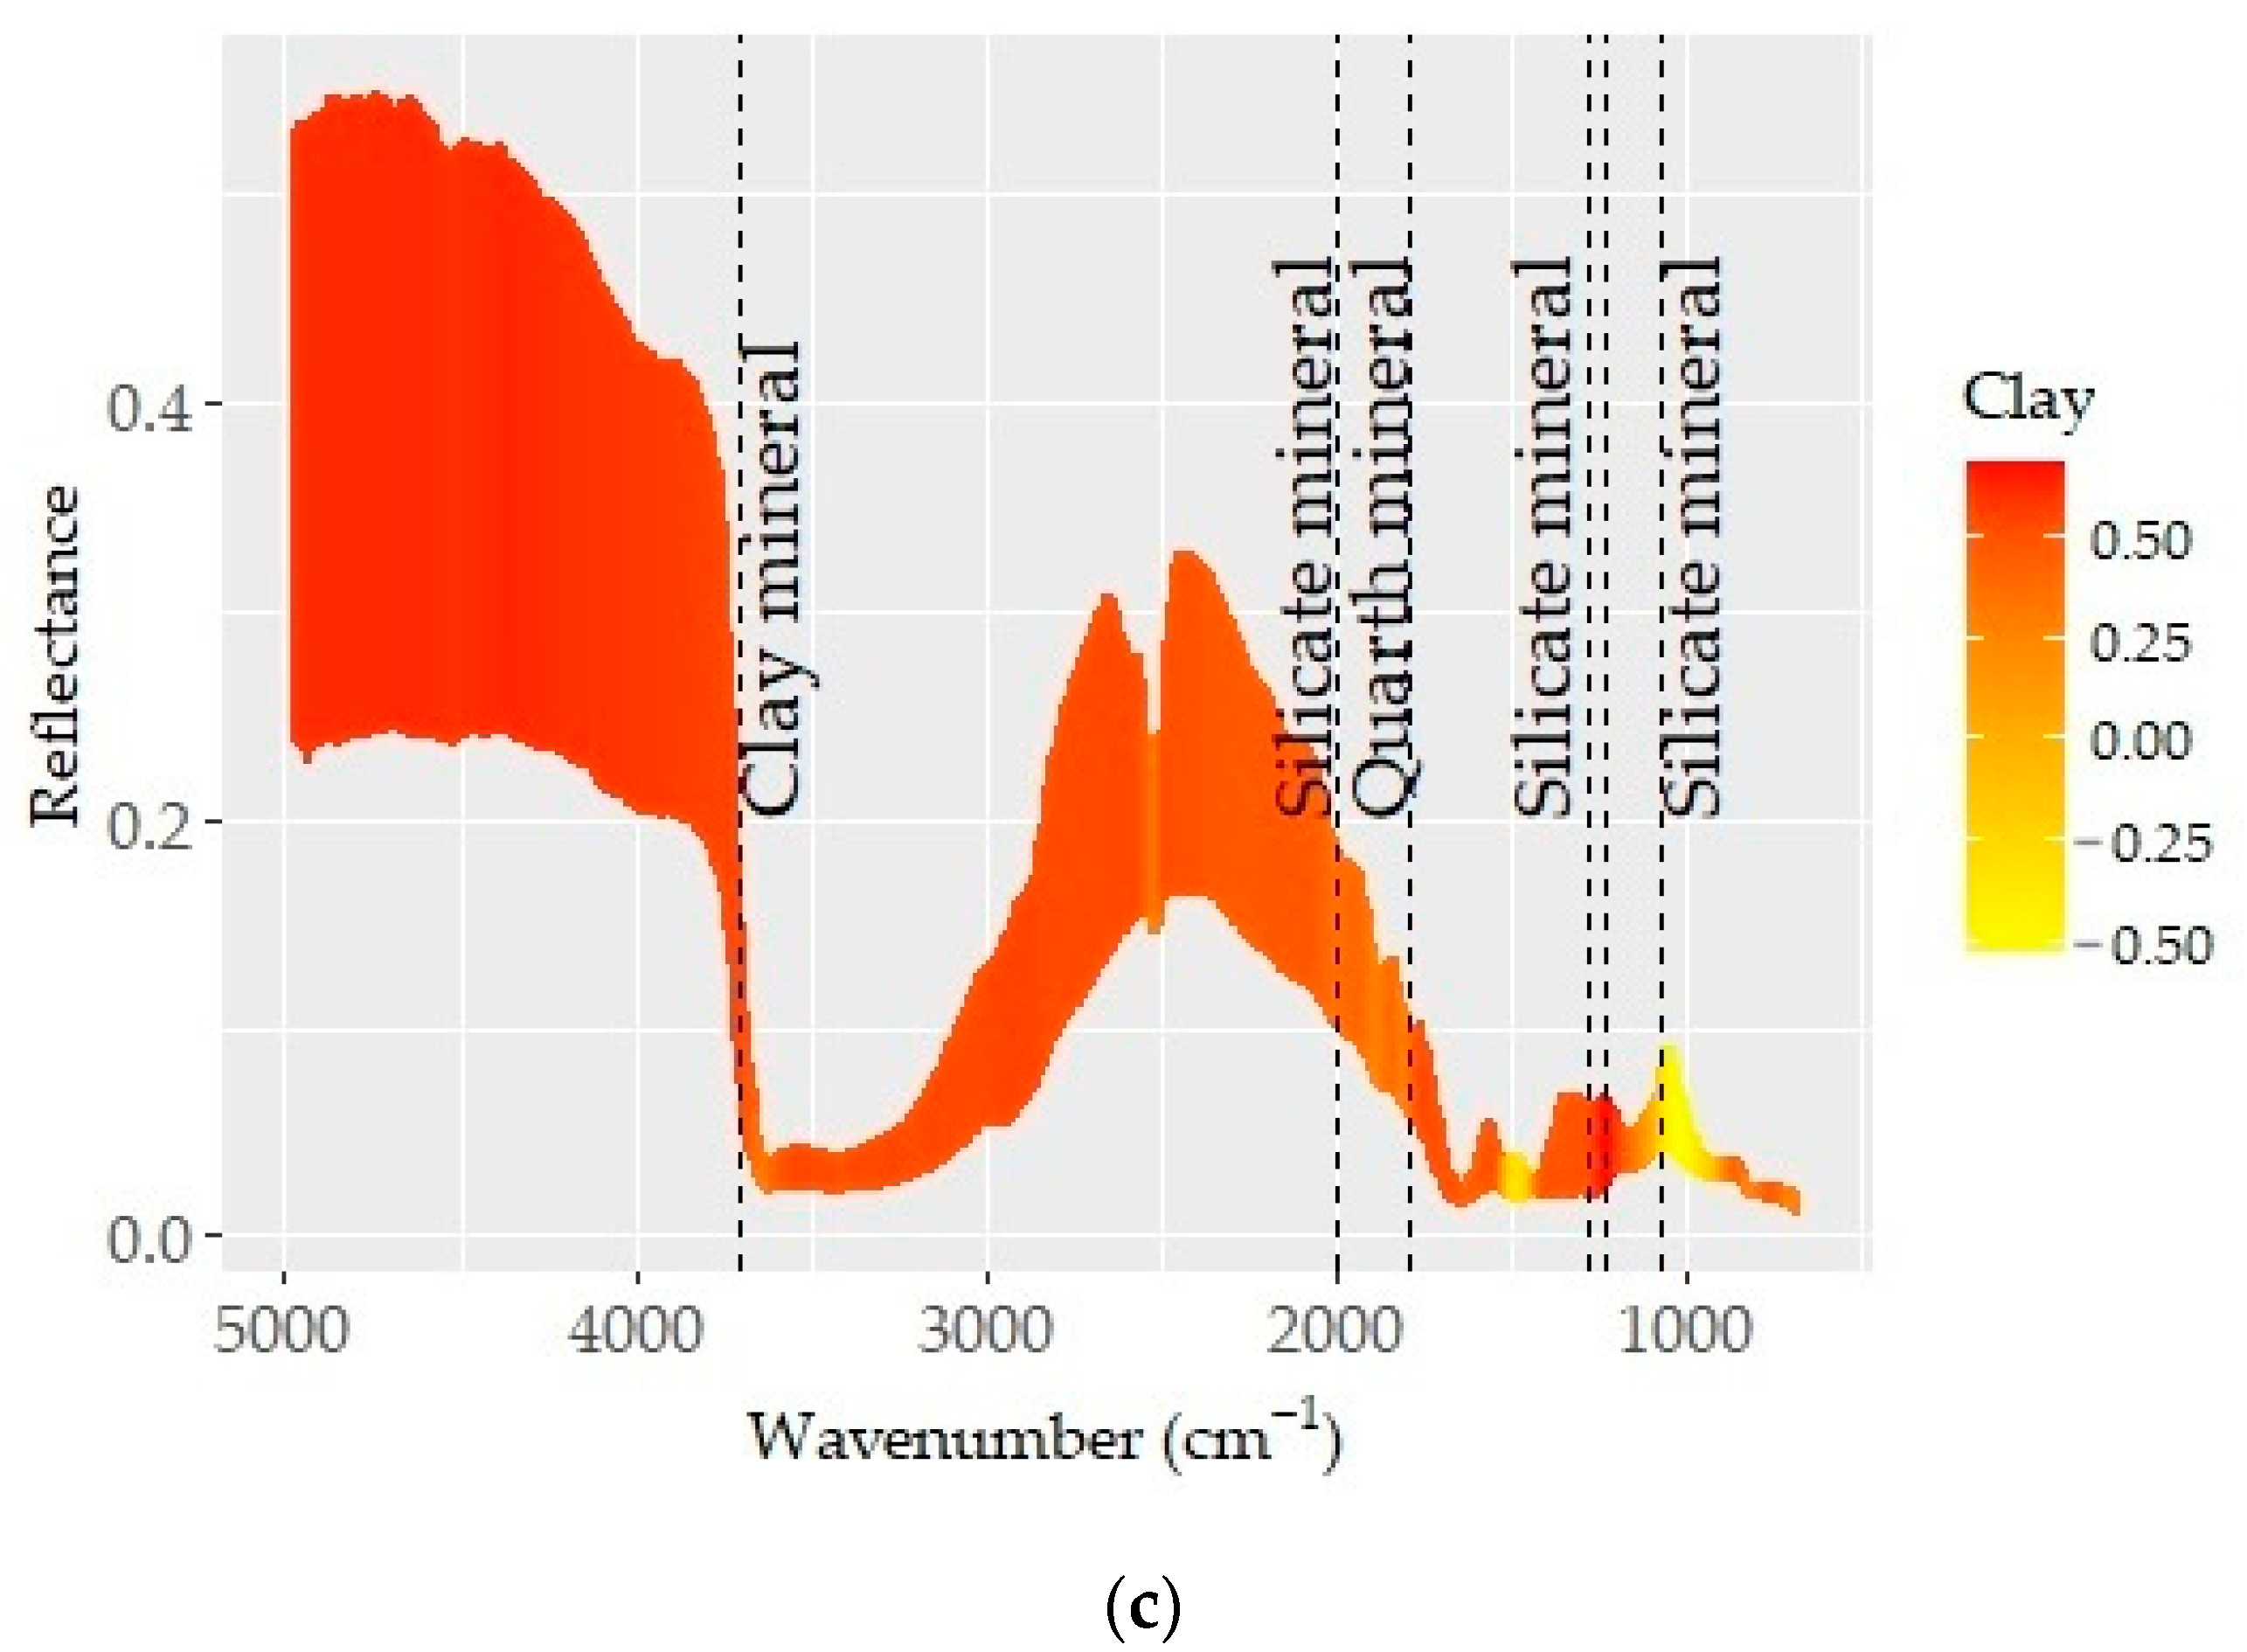
The pre-processed spectra which provided the best predictions for CaCO3, SOC, and clay are presented in Figure 6. Known absorption bands (dashed vertical lines) were plotted on the spectra to obtain insights into the underlying prediction mechanisms. The spectra (color coded based on the correlation between spectra and soil property) showed varying correlation patterns across the MIR region. Those acute changes in correlation patterns were attributed to the absorption features of organic matter and minerals and considerably contributed to prediction quality [72,74].
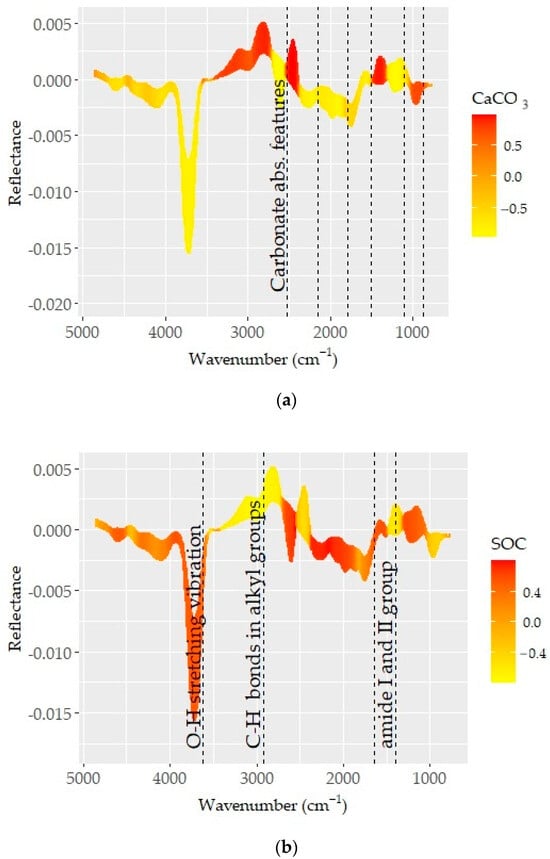
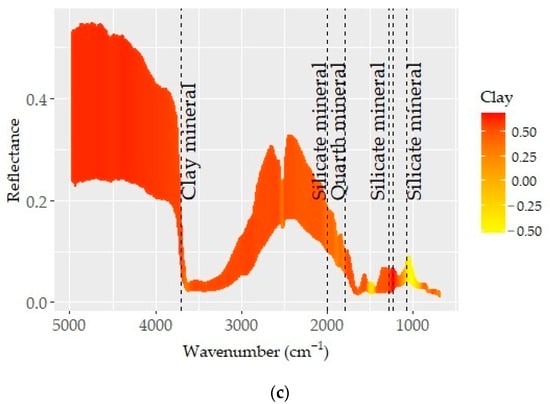
Figure 6.
Optimal pre-processing spectra color coded based on the correlation coefficients between spectra values and respective soil properties: (a) CaCO3, (b) SOC, and (c) clay. The dashed lines represent the absorption feature bands of mineral and organic elements.
The correlation pattern with D1 spectra showed a number of absorption features of carbonates and strong occurrences at 714, 850, 870, 1796, 2150, and 2520 cm−1 (Figure 6a). These recognized features are in agreement with those determined in recent studies [72,74]. As reported in recent studies, carbonates have a strong effect on soil brightness and variations in reflectance, and the absorption features associated with the CaCO3 content are of importance in predictions [72]. Therefore, carbonate content was one of the basic soil properties that can be ideally predicted using MIR spectra. Excellent model performance was achieved for CaCO3 prediction over an extensive chemical and geographic diversity of soils from central USA or throughout the USA using an MIR spectroscopy library [29,75].
The conformity between reflectance and the CaCO3 content (Figure 4a) or the correlation patterns, associated with spectrally active soil properties at ~1500 cm−1, was related to carbonate (calcite and dolomite) features (Figure 6). The appearance of the band in the spectra of all samples and its consistency with CaCO3 content, and consequently the correlation pattern between them, confirmed the presence of direct relations. Moreover, carbonate minerals are known to be absorbed in regions near 880 and 700 cm-l, which are slightly visible in the spectra and may overlap with weak bands in the 920–600 cm−1 wavelength range, associated with different aluminosilicate layer substitutions found in smectites and illites. This aspect is further complicated with O–Si–O stretching and bending frequencies at 1080, 800–780, and 700 cm-l since they are among the foremost leading bands, often covering other bands in their respective regions [76].
The relations between D1 spectra and SOC content showed varying correlation pat-terns in the given MIR spectral range (Figure 6b). Except for CaCO3, the spectra showed overlapping features for all spectrally active soil properties in the longer wavelength region. These aspects were linked to a series of absorption bands induced by organic matter, clay minerals, and silicates [7,74,77]. The consecutive correlation trend for SOC and CaCO3 was shown between wavelengths of ~3400 and 1500 cm−1 (Figure 6a,b). This region is linked to the bonds within organic molecules (e.g., aliphatic hydrocarbons, carboxylic acid, amides, and some phosphorus and sulfur compounds) [68]. Although the mineral gibbsite and the N–H bond allied features existed at ~3530, 3450, and 3385 cm−1, the correlation pattern associated with SOC and CaCO3 was not obvious. However, spectral features associated with the C–H bonds of alkyl groups were evident at ~2925 and 2850 cm−1 [68]. The spectral variability observed at around 3625 cm−1 (min. in reflectance) was also connected to the stretching vibration of the O–H bond. Both organic components (carboxyl, amide, and others with C=O, C≡O, and C–H bonds) and quartz, kaolinite, and silicate minerals have overlying features between wavelengths of ~2000 and 1500 cm−1 [68].
The correlation outlines appearing in the region of 3400–1500 cm−1 were more complex and coincided with variations in the SOC and CaCO3 contents (Figure 4 and Figure 6). A consistent trend from low to high CaCO3 or SOC contents was linked to the role of their respective absorption bands. In general, the region was low in reflectance, with several discernible minima being observed at various points (~1300, 1120, 1162, 1074–1048, 1100, 1150, 1110, 1020, 950–915, 815–800, 730–673, 500–480, 430 cm−1), likely associated with clay minerals such as kaolinite, illite, and smectite and some amounts of silica [70,71,72,73]. The fingerprint region (1500–600 cm−1) corresponded predominantly to silicate features (1300, 1230, and 955 cm−1) and was unique and distinct in terms of reflectance and spectral features [68].
Despite the above-noted overlapping features, most studies have successfully predicted SOC content as well its fractions. For example, Rial et al. [10] analyzed the SOC content of 216 topsoil samples from six land use types in a temperate subtropical region in NW Spain and received a greater predictive result (R2 = 0.88, RMSE = 2.14, RPD = 3.14) at 1697 cm−1 of the FTIR (ATR) spectra. Knox et al. [73] successfully modeled four soil carbon fractions of six soil types (1014 samples) from humid subtropical regions by applying PLSR and Random Forests with MIR (1666–25,000 nm) and Vis-NIR (350–2500 nm) spectroscopy. The authors concluded that the wavelengths contributing the most to the individual models were located above 2000 nm. However, models for predicting SOC content from MIR data developed in different countries or climatic regions (soil types) may show strong variations in prediction accuracies (60−2084 samples, R2 = 0.73−0.94; RPD = 1.7−4.1) [10].
4.3.2. Principal Component Analysis
The MIR PC1 showed a better correspondence to CaCO3, Ca, Cd, Pb, and pH, while PC2 showed orthogonality with most soil properties, and Fe, SOC, Mg, and Zn appeared as an associated group. The same trend was found for the Vis-NIR PC1 [27]. However, compared with MIR PC2, the Vis-NIR PC2 showed less correspondence to soil properties for the same sample set. These results verified that using the same soil information (sample set) for both MIR and Vis-NIR spectra may appear as a limiting factor for combining both spectral ranges [18]. The value of WC as well as soil fertility elements (K and P) was considerably decoupled from PC1 and PC2 due to their weak relations to the soil properties; they were ultimately predicted with low accuracy. The soil properties that showed a better correspondence to PC1 and PC2 coincided with better estimates, and vice versa; this trend is in line with recent studies [26,33,35].
Neither MIR nor Vis-NIR was able to predict reasonable total P content, whether in laboratory or in situ conditions, in a typical black soil area in China since there was no sensitive band in both spectral ranges [33]. However, Pätzold et al. [35] obtained significantly better calibration models for plant-available P using MIR and Vis-NIR spectra (R2 = 0.70 and 0.72, and RPD = 1.8 and 1.9, respectively). Moreover, although the local Vis-NIR models produced better results (R2 ≤ 0.93 and RPD ≤ 3.8), the overall model designed to predict P (on independent test data) still partly failed. The relative performances of single spectra (Vis-NIR and MIR) and three fusion approaches were evaluated to predict total and available nutrients (N, P, and K). The MIR spectra were the best for predicting total K, while the fusion methods were more effective for predicting total and available N. Neither single models nor their fusion gave reliable predictions of total P, available N, and K [26].
4.3.3. Partial Correlation Analysis
Based on the results of our partial correlation analysis, particle sizes and hygroscopic WC appeared as confounding factors limiting the prediction accuracy. An increase in the correlations between the MIR spectra (PC1) and soil properties (particle sizes, Cd, Mn, and Pb) occurred once the WC was controlled (Table 2). Thus, our partial correlation analysis found that the impediment resulting from soil water also occurs at the hygroscopic WC level. An inversion of spectral signatures across the fundamental water absorption bands occurs as moisture contents increases [28]. This effect was related to the change in the ratio of the diffuse reflectance of the soil matrix, which leads to a decline in net absorption [78]. The noted impact of WC on soil spectra and prediction quality can be explained by the contribution of soil type or particle size and its distribution [28].
The impediment arising from soil moisture content in the MIR predictions was supported by the findings of other studies, such as [32]. This study used MIR spectral data (Agilent 4300 handheld FTIR device) collected at different moisture contents to evaluate the feasibility of using the MIR instrument in situ applications (i.e., for the prediction of pH and organic matter and lime requirement). The organic matter content and lime requirement were successfully predicted by using specific correction spectra while underlining the impact of moisture content on soil spectra; even below permanent wilting point, large peaks complicated the detection of necessary small variations. It was concluded that the spectra are sensitive to organic matter in regions which are not adversely influenced by the presence of water [32]. This feature could be related to the quality of SOC predictions made by mostly using MIR data [27].
The effect of variable moisture content on soil spectra in both the MIR-FTIR and Vis-NIR regions and the spectral estimation models for the SOC and clay contents showed that the MIR spectra were more impacted by soil moisture than the Vis-NIR spectra [28]. Even moderate moisture contents can distort the overall shape of the MIR reflectance curve. The threshold moisture levels are texture dependent; the clayey soil was less influenced than the coarse-textured sandy soils. Also, using the optimal fusion approach did not notably improve the prediction quality of the studied soil properties [28]. However, the evaluation of the prediction mechanisms of the soil properties and benefits of model fusion, carried out by measuring MIR and XRF spectra in field conditions, showed the superiority of MIR and XRF for organic soil properties (SOC and N) and particle sizes, respectively [25].
5. Conclusions
This study tested the performance of MIR spectra recorded using a recently introduced portable MIR−FTIR spectrometer (Agilent 4300 Handheld spectrometer) for predicting a range of soil properties and compared the prediction accuracy and mechanisms to Vis-NIR spectra with the same sample set. The techniques were compared for 17 soil properties (CaCO3, pH, SOC, sand, silt, clay, water content, Ca, Mg, K, Cd, Cu, Fe, Mn, P, Pb, and Zn) of 114 topsoil samples collected from a mountainous agricultural area in the Caucasus Mountains. The prediction accuracy values of both techniques were similar for most of the soil properties (R2 = 0.70–0.99): (i) the MIR spectra were superior in predicting CaCO3, pH, SOC, sand, Ca, Cd, Fe, Mg, Mn, and Pb, while Vis-NIR spectra provided better estimates for silt, clay, and K, and (ii) the hygroscopic water content, Cu, P, and Zn were poorly predicted by both techniques. The substantial contribution of different spectral pre-processing procedures was evident; the D1 (the first derivative) spectra produced the most robust predictions for 11 soil properties. The spectrally active soil properties (CaCO3, SOC, and particle sizes) had a significant and varying effect on the relationships between the soil properties and spectral information. The CaCO3 had the most dominant effect on the MIR predictions, followed by SOC and Fe, whereas particle sizes and hygroscopic water content served as confounding factors. The MIR and Vis-NIR spectra capture same soil information via mechanism and content, which may appear as a limiting factor for combining both spectral ranges. The carbonate leaching and accumulation zones, associated with topography and land use/management, were separated based on the relationships between soil properties and spectral information. The content of nutrient elements was highly related to the nature of the soil-forming processes and parent materials presented in the study area. These relations also concerned the prediction capability of the MIR-FTIR technique and supported the vibrant role of soil-forming factors, which may hint at the importance of local prediction models. MIR spectroscopy was found to be an effective method for soil quality evaluation under heterogeneous land use and soil-forming conditions. Estimations of spectrally inactive soil properties in similar highland regions could be achieved due to their indirect correlation with carbonates, clay minerals, and organic matter and assist in integrating local models to regional scale. Further studies are needed to test the potential of using MIR spectroscopy coupled with different modeling approaches to support creating a national spectral library for soil monitoring and sustainable agriculture.
Author Contributions
Conceptualization, E.M., M.D. and C.G.; methodology, E.M., M.D. and A.I.M.; spectral measurements: E.M. and M.D.; software, E.M.; validation, E.M. and C.G.; formal analysis, M.D., C.G. and A.I.M.; investigation, E.M.; resources, M.D. and C.G.; data curation, E.M.; writing—original draft preparation, E.M., A.I.M., M.D. and C.G.; writing—review and editing, E.M., A.I.M., M.D. and C.G.; visualization, E.M.; supervision, C.G.; project administration, M.D. and E.M.; funding acquisition, E.M. and C.G. All authors have read and agreed to the published version of the manuscript.
Funding
This research was partly funded by the Islamic Development Bank, Merit Scholarship Program for High Technology, grant number 36/11209317.
Institutional Review Board Statement
Not applicable.
Informed Consent Statement
Not applicable.
Data Availability Statement
Data is contained within the article.
Acknowledgments
The provision of the Agilent FTIR 4300 handheld spectrometer by the SphereOptics GmbH is greatly acknowledged. The support provided by Adam Mickiewicz University in Poznan and Poznan University of Life Sciences for the laboratory testing of the soil samples is appreciated.
Conflicts of Interest
The authors declare no conflicts of interest.
References
- Viscarra Rossel, R.A.; Behrens, T.; Ben-Dor, E.; Brown, D.J.; Demattê, J.A.M.; Shepherd, K.D.; Shi, B.; Stenberg, A.; Stevens, V.; Adamchuk, H.; et al. A global spectral library to characterize the world’s soil. Earth-Sci. Rev. 2016, 155, 198–230. [Google Scholar] [CrossRef]
- Viscarra Rossel, R.A.; Behrens, T.; Ben- Dor, E.; Chabrillat, S.; Demattê, J.A.M.; Ge, Y.; Gomez, C.; Guerrero, C.; Peng, Y.; Ramirez Lopez, L.; et al. Diffuse reflectance spectroscopy for estimating soil properties: A technology for the 21st century. Eur. J. Soil Sci. 2022, 73, e13271. [Google Scholar] [CrossRef]
- Viscarra Rossel, R.A.; Walvoort, D.J.J.; McBratney, A.B.; Janik, L.J.; Skjemstad, J.O. Visible, Near-Infrared, Mid-Infrared or Combined Diffuse Reflectance Spectroscopy for Simultaneous Assessment of Various Soil Properties. Geoderma 2006, 131, 59–75. [Google Scholar] [CrossRef]
- Haghi, R.K.; Pérez-Fernández, E.; Robertson, A.H.J. Prediction of various soil properties for a national spatial dataset of Scottish soils based on four different chemometric approaches: A comparison of near infrared and mid-infrared spectroscopy. Geoderma 2021, 396, 115071. [Google Scholar] [CrossRef]
- Terra, F.S.; Demattê, J.A.M.; Viscarra Rossel, R. Spectral libraries for quantitative analyses of tropical Brazilian soils: Comparing vis-NIR and mid-IR reflectance data. Geoderma 2015, 255–256, 81–93. [Google Scholar] [CrossRef]
- Weindorf, D.C.; Bakr, N.; Zhu, Y.D. Advances in portable X-ray fluorescence (PXRF) for environmental, pedological, and agronomic applications. Adv. Agron. 2014, 128, 1–45. [Google Scholar] [CrossRef]
- Parikh, S.J.; Goyne, K.W.; Margenot, A.J.; Mukome, F.N.D.; Calder’on, F.J. Soil Chemical Insights Provided through Vibrational Spectroscopy. In Advances in Agronomy; Sparks, D.L., Ed.; Academic Press: Burlington, MA, USA, 2014; Volume 126, pp. 1–148. [Google Scholar] [CrossRef]
- Bellon-Maurel, V.; McBratney, A. Near-infrared (NIR) and mid-infrared (MIR) spectroscopic techniques for assessing the amount of carbon stock in soils—Critical review and research perspectives. Soil Biol. Biochem. 2011, 43, 1398–1410. [Google Scholar] [CrossRef]
- Ng, W.; Minasny, B.; Jeon, H.S.; McBratney, A. Mid-infrared spectroscopy for accurate measurement of an extensive set of soil properties for assessing soil functions. Soil Secur. 2022, 6, 100043. [Google Scholar] [CrossRef]
- Rial, M.; Cortizas, A.M.; Rodríguez-Lado, L. Mapping soil organic carbon content using spectroscopic and environmental data: A case study in acidic soils from NW Spain. Sci. Total Environ. 2016, 539, 26–35. [Google Scholar] [CrossRef]
- Sanderman, J.; Savage, K.; Dangal, S.R.S. Mid-infrared spectroscopy for prediction of soil health indicators in the United States. Soil Sci. Soc. Am. J. 2020, 84, 251–261. [Google Scholar] [CrossRef]
- Vasques, G.M.; Demattê, J.A.M.; Viscarra Rossel, R.A.; Ramírez-López, L.; Terra, F.S. Soil classification using visible/near-infrared diffuse reflectance spectra from multiple depths. Geoderma 2014, 223–225, 73–78. [Google Scholar] [CrossRef]
- Naimi, S.; Ayoubi, S.; Di Loreto, L.A.; Dematte, J.A.M. Quantification of some intrinsic soil properties using proximal sensing in arid lands: Application of Vis-NIR, MIR and pXRF spectroscopy. Geoderma Reg. 2022, 28, e00484. [Google Scholar] [CrossRef]
- McCarty, G.W.; Reeves, J.B. III. Comparison of near infrared and mid infrared diffuse reflectance spectroscopy for field-scale measurement of soil fertility parameters. Soil Sci. 2006, 171, 94–102. [Google Scholar] [CrossRef]
- Hutengs, C.; Seidel, M.; Oertel, F.; Ludwig, B.; Vohland, M. In situ and laboratory soil spectroscopy with portable visible-to-near-infrared and mid-infrared instruments for the assessment of organic carbon in soils. Geoderma 2019, 355, 113900. [Google Scholar] [CrossRef]
- Ludwig, B.; Murugan, R.; Parama, V.R.R.; Vohland, M. Accuracy of estimating soil properties with mid-infrared spectroscopy: Implications of different chemometric approaches and software packages related to calibration sample size. Soil Sci. Soc. Am. J. 2019, 83, 1542–1552. [Google Scholar] [CrossRef]
- Riedel, F.; Denk, M.; Müller, I.; Barth, N.; Gläßer, C. Prediction of soil parameters using the spectral range between 350 and 15,000nm: A case study based on the Permanent Soil Monitoring Program in Saxony, Germany. Geoderma 2018, 315, 188–198. [Google Scholar] [CrossRef]
- Vohland, M.; Ludwig, B.; Seidel, M.; Hutengs, C. Quantification of soil organic carbon at regional scale: Benefits of fusing vis-NIR and MIR diffuse reflectance data are greater for in situ than for laboratory-based modelling approaches. Geoderma 2022, 405, 115426. [Google Scholar] [CrossRef]
- Ng, W.; Minasny, B.; Montazerolghaem, M.; Padarian, J.; Ferguson, R.; Bailey, S.; McBratney, A.B. Convolutional neural network for simultaneous prediction of several soil properties using visible/near-infrared, mid-infrared, and their combined spectra. Geoderma 2019, 352, 251–267. [Google Scholar] [CrossRef]
- Soriano-Disla, J.M.; Janik, L.J.; Rossel, R.A.V.; Macdonald, L.M.; Laughli, M.J. The performance of visible, near-, and mid-infrared reflectance spectroscopy for prediction of soil physical, chemical, and biological properties. Appl. Spectrosc. Rev. 2014, 49, 139–186. [Google Scholar] [CrossRef]
- Stenberg, B.; Viscarra Rossel, R.A.; Mouazen, A.M.; Wetterlind, J. 2010. Visible and near infrared spectroscopy in soil science. In Advances in Agronomy; Sparks, D.L., Ed.; Academic Press: Burlington, MA, USA, 2010; Volume 107, pp. 163–215. [Google Scholar]
- Vohland, M.; Ludwig, M.; Thiele-Bruhn, S.; Ludwig, B. Determination of soil properties with visible to near- and mid-infrared spectroscopy: Effects of spectral variable selection. Geoderma 2014, 223–225, 88–96. [Google Scholar] [CrossRef]
- Baumann, P.; Helfenstein, A.; Gubler, A.; Keller, A.; Meuli, R.G.; Wächter, D.; Lee, J.; Viscarra Rossel, R.; Six, J. Developing the Swiss mid-infrared soil spectral library for local estimation and monitoring. Soil 2021, 7, 525–546. [Google Scholar] [CrossRef]
- Margenot, A.J.; Calderón, F.J.; Goyne, K.W.; Mukome, F.N.D.; Parikh, S.J. IR Spectroscopy, Soil Analysis Applications. In Encyclopedia of Spectroscopy and Spectrometry, 3rd ed.; Lindon, J.C., Tranter, G.E., Koppenaal, D., Eds.; Academic Press: Cambridge, MA, USA, 2017; pp. 448–454. [Google Scholar]
- Greenberg, I.; Vohland, M.; Seidel, M.; Hutengs, C.; Bezard, R.; Ludwig, B. Evaluation of mid-infrared and X-ray fluorescence data fusion approaches for prediction of soil properties at the field scale. Sensors 2023, 23, 662. [Google Scholar] [CrossRef]
- Li, X.; Pan, W.; Li, D.; Gao, W.; Zeng, R.; Zheng, G.; Cai, K.; Zeng, Y.; Jiang, C. Can fusion of vis-NIR and MIR spectra at three levels improve the prediction accuracy of soil nutrients? Geoderma 2024, 41, 116754. [Google Scholar] [CrossRef]
- Mammadov, E.; Denk, M.; Riedel, F.; Kazmierowski, C.; Lewinska, K.; Łukowiak, R.; Grzebisz, W.; Mamedov, A.I.; Glaesser, C. Determination of Mehlich 3 Extractable Elements with Visible and Near Infrared Spectroscopy in a Mountainous Agricultural Land, the Caucasus Mountains. Land 2022, 11, 363. [Google Scholar] [CrossRef]
- Seidel, M.; Vohland, V.; Greenberg, I.; Ludwig, B.; Ortner, M.; Thiele-Bruhn, S.; Hutengs, C. Soil moisture effects on predictive VNIR and MIR modeling of soil organic carbon and clay content. Geoderma 2022, 427, 116103. [Google Scholar] [CrossRef]
- Seybold, C.A.; Ferguson, R.; Wysocki, D.; Bailey, S.; Anderson, J.; Nester, B.; Schoeneberger, P.; Wills, S.; Libohova, Z.; Hoover, D.; et al. Application of mid-infrared spectroscopy in soil survey. Soil Sci. Soc. Am. J. 2019, 83, 1746–1759. [Google Scholar] [CrossRef]
- Breure, T.S.; Prout, J.M.; Haefele, S.M.; Milne, A.E.; Hannam, J.A.; Moreno-Rojas, S.; Corstanje, R. Comparing the effect of different sample conditions and spectral libraries on the prediction accuracy of soil properties from near- and mid-infrared spectra at the field-scale. Soil Tillage Res. 2022, 215, 105196. [Google Scholar] [CrossRef] [PubMed]
- Dong, Y.W.; Yang, S.Q.; Xu, C.Y.; Li, Y.Z.; Bai, W.; Fan, Z.N.; Wang, Y.N.; Li, Q.Z. Determination of soil parameters in apple-growing regions by near- and mid-infrared spectroscopy. Pedosphere 2011, 21, 591–602. [Google Scholar] [CrossRef]
- Metzger, K.; Zhang, C.; Daly, K. From benchtop to handheld MIR for soil analysis: Predicting lime requirement and organic matter in agricultural soils. Biosyst. Eng. 2021, 204, 257–269. [Google Scholar] [CrossRef]
- Yin, J.; Shi, Z.; Li, B.; Sun, F.; Miao, T.; Shi, Z.; Chen, S.; Yang, M.; Ji, W. Prediction of soil properties in a field in typical black soil areas using in situ MIR spectra and its comparison with vis-NIR spectra. Remote Sens. 2023, 15, 2053. [Google Scholar] [CrossRef]
- Hutengs, C.; Ludwig, B.; Jung, A.; Eisele, A.; Vohland, M. Comparison of Portable and Bench-Top Spectrometers for Mid-Infrared Diffuse Reflectance Measurements of Soils. Sensors 2018, 18, 993. [Google Scholar] [CrossRef] [PubMed]
- Pätzold, S.; Leenen, M.; Frizen, P.; Heggemann, T.; Wagner, P.; Rodionov, A. Predicting plant available phosphorus using infrared spectroscopy with consideration for future mobile sensing applications in precision farming. Precis. Agric. 2020, 21, 737–761. [Google Scholar] [CrossRef]
- Wehrle, R.G.; Welp, S. Pätzold. Total and hot-water extractable organic carbon and nitrogen in organic soil amendments: Their prediction using portable mid-infrared spectroscopy with support vector machines. Agronomy 2021, 11, 659. [Google Scholar] [CrossRef]
- Forrester, S.T.; Janik, L.J.; Soriano-Disla, J.M.; Mason, S.; Burkitt, L.; Moody, P.; Gourley, C.J.P.; McLaughlin, M.J. Use of handheld mid-infrared spectroscopy and partial least-squares regression for the prediction of the phosphorus buffering index in Australian soils. Soil Res. 2015, 53, 67. [Google Scholar] [CrossRef]
- Greenberg, I.; Seidel, M.; Vohland, M.; Ludwig, B. Performance of field-scale lab vs in situ visible/near- and mid-infrared spectroscopy for estimation of soil properties. Eur. J. Soil Sci. 2021, 73, e13180. [Google Scholar] [CrossRef]
- IUSS Working Group WRB. World reference base for soil resources 2014, update 2015. In International Soil Classification System for Naming Soils and Creating Legends for Soil Maps. World Soil Resource Reports No. 106; FAO: Rome, Italy, 2015; p. 239. [Google Scholar]
- NASA JPL. NASA Shuttle Radar Topography Mission Global 1 arc Second [Data Set]. NASA EOSDIS Land Processes Distributed Active Archive Center. 2013. Available online: https://lpdaac.usgs.gov/products/srtmgl1v003/ (accessed on 11 July 2018). [CrossRef]
- Mammadov, E.; Nowosad, J.; Glaesser, C. Estimation and mapping of surface soil properties in the Caucasus Mountains, Azerbaijan using high-resolution remote sensing data. Geoderma Reg. 2021, 26, e00411. [Google Scholar] [CrossRef]
- Burt, R. (Ed.) Soil Survey Staff, Soil Survey Field and Laboratory Methods Manual, Soil Survey Investigations Report No. 51; Version 2.0.; U.S. Department of Agriculture, Natural Resources Conservation Service: Redmond, OR, USA, 2014; 487p.
- Nelson, D.; Sommers, L. Total Carbon, Organic Carbon, and Organic Matter. In Methods of Soil Analysis, 2nd ed.; Part 2; Sparks, D.L., Ed.; American Society of Agronomy/Soil Science Society of America: Madison, WI, USA, 1996; pp. 961–1010. [Google Scholar]
- Sparks, D.L.; Fendorf, S.E.; Toner, C.V.; Carski, T.H. Kinetic Methods and Measurements. In Methods of Soil Analysis; Part 3—Chemical Methods; Sparks, D.L., Ed.; SSSA Book Series: Madison, WI, USA, 1996; pp. 1275–1307. [Google Scholar]
- Gee, G.; Bauder, J. Physical and Mineralogical Methods: Particle-Size Analysis. In Methods of Soil Analysis, 2nd ed.; Agronomy Monograph, Part 1; Klute, A., Ed.; American Society of Agronomy/Soil Science Society of America: Madison, WI, USA, 1986; pp. 383–411. [Google Scholar]
- Bloesch, P.M. Prediction of the CEC to clay ratio using mid-infrared spectroscopy. Soil Res. 2012, 50, 1–6. [Google Scholar] [CrossRef]
- Mehlich, A. Mehlich 3 soil test extractant: A modification of Mehlich 2 extractant. Commun. Soil Sci. Plant Anal. 2008, 15, 1409–1416. [Google Scholar] [CrossRef]
- Zbíral, J. Determination of Plant-Available Micronutrients by the Mehlich 3 Soil Extractant–a Proposal of Critical Values. Plant Soil Environ. 2016, 62, 527–531. [Google Scholar] [CrossRef]
- Ameyan, O. Surface soil variability of a map unit on Niger river alluvium. Soil Sci. Soc. Am. J. 1984, 50, 1289–1293. [Google Scholar] [CrossRef]
- Evans, J. Straightforward Statistics for the Behavioral Sciences; Brooks/Cole Publishing: Pacific Grove, CA, USA, 1996; 600p. [Google Scholar]
- R Development Core Team. R: A Language and Environment for Statistical Computing; R Foundation for Statistical Computing: Vienna, Austria, 2019; Available online: https://www.cran.r-project.org (accessed on 1 November 2021).
- Tian, Y.; Zhang, J.; Yao, X.; Cao, W.; Zhu, Y. Laboratory assessment of three quantitative methods for estimating the organic matter content of soils in China based on visible/near-infrared reflectance spectra. Geoderma 2013, 202, 161–170. [Google Scholar] [CrossRef]
- Savitzky, A.; Golay, M. Smoothing and differentiation of data by simplified least squares procedures. Anal. Chem. 1964, 36, 1627–1639. [Google Scholar] [CrossRef]
- Geladi, P.; McDougall, D.; Martens, H. Linearization and scatter correction for near infrared reflectance spectra of meat. Appl. Spectrosc. 1985, 39, 491–500. [Google Scholar] [CrossRef]
- Clark, R.; Roush, T. Reflectance spectroscopy quantitative analysis techniques for remote sensing applications. J. Geophys. Res. 1984, 89, 6329–6340. [Google Scholar] [CrossRef]
- Barnes, R.; Dhanoa, M.; Lister, S. Standard normal variate transformation and de-trending of near-infrared diffuse reflectance spectra. Appl. Spectrosc. 1989, 43, 772–777. [Google Scholar] [CrossRef]
- Mammadov, E.; Denk, M.; Riedel, F.; Lewinska, K.; Ka´zmierowski, C.; Glaesser, C. Visible and Near-Infrared Reflectance Spectroscopy for assessment of soil properties in the Caucasus Mountains, Azerbaijan. Commun. Soil Sci. Plant Anal. 2020, 51, 2111–2136. [Google Scholar] [CrossRef]
- Stevens, A.; Ramirez-Lopez, L. An Introduction to the Prospectr Package in R. Available online: https://CRAN.R-project.org/package=prospectr/vignettes/prospectr.html (accessed on 9 June 2014).
- Geladi, P.; Kowalski, B. Partial least-squares regression: A tutorial. Anal. Chimica. Acta. 1986, 185, 1–17. [Google Scholar] [CrossRef]
- Wold, S.; Eriksson, L.; Trygg, J.; Kettaneh, N. The PLS Method—Partial Least Squares Projections to Latent Structures—And Its Applications in Industrial RDP (Research, Development, and Production); Technical Report for PLS in Industrial RPD (Research, Development, and Production); Umea University: Umeå, Sweden, 2004; pp. 1–44. [Google Scholar]
- Efron, B.; Tibshir, R. An Introduction to the Bootstrap; Chapman Hall/CRC Press: Boca Raton, FL, USA, 1994; 430p. [Google Scholar]
- Akaike, H. Akaike’s Information Criterion. In International Encyclopedia of Statistical Science; Lovric, M., Ed.; Springer: Berlin/Heidelberg, Germany, 2011; pp. 25–29. [Google Scholar]
- Williams, P. Near-Infrared Technology in the Agricultural and Food Industries; Williams, P., Norris, K., Eds.; American Association of Cereal Chemists: Saint Paul, MN, USA, 2001; pp. 35–55. [Google Scholar]
- Mevik, B.; Wehrens, R. The pls package: Principal component and partial least squares regression in R. J. Stat. Softw. 2007, 18, 1–24. [Google Scholar] [CrossRef]
- Wang, J.J.; Cui, L.J.; Gao, W.X.; Shi, T.Z.; Chen, Y.Y.; Gao, Y. Prediction of low heavy metal concentrations in agricultural soils using visible and near-infrared reflectance spectroscopy. Geoderma 2014, 216, 1–9. [Google Scholar] [CrossRef]
- Wu, Y.; Chen, J.; Ji, J.; Gong, P.; Liao, Q.; Tian, Q.; Ma, H. A mechanism study of reflectance spectroscopy for investigating heavy metals in soils. Soil Sci. Soc. Am. J. 2007, 71, 918–926. [Google Scholar] [CrossRef]
- Cheng, H.; Shen, R.; Chen, Y.; Wan, Q.; Shi, T.; Wang, J.; Wan, Y.; Hong, Y.; Li, X. Estimating heavy metal concentrations in suburban soils with reflectance spectroscopy. Geoderma 2019, 336, 59–67. [Google Scholar] [CrossRef]
- Stuart, B. Infrared Spectroscopy: Fundamentals and Applications; John Wiley & Sons Ltd.: West Sussex, UK, 2004. [Google Scholar]
- Rowley, M.C.; Grand, S.; Verrecchia, E.P. Calcium—Mediated stabilization of soil organic carbon. Biogeochemistry 2018, 137, 27–49. [Google Scholar] [CrossRef]
- Golia, E.E.; Diakoloukas, V. Soil parameters affecting the levels of potentially harmful metals in Thessaly area, Greece: A robust quadratic regression approach of soil pollution prediction. Environ. Sci. Pollut. Res. 2021, 29, 29544–29561. [Google Scholar] [CrossRef]
- Mamedov, A.I.; Tsunekawa, A.; Tsubo, M.; Fujimaki, H.; Kawai, T.; Kebede, B.; Mulualem, T.; Abebe, G.; Wubet, A.; Levy, G.J. Soil structure stability under different land uses in association with polyacrylamide effects. Sustainability 2021, 13, 1407. [Google Scholar] [CrossRef]
- Asgari, N.; Ayoubi, S.; Demattê, J.A.M.; Dotto, A.C. Carbonates and organic matter in soils characterized by reflected energy from 350–25000 nm wavelength. J. Mt. Sci. 2020, 17, 1636–1651. [Google Scholar] [CrossRef]
- Knox, N.M.; Grunwald, S.; McDowell, M.L.; Bruland, G.L.; Myers, D.B.; Harris, W.G. Modelling soil carbon fractions with visible near-infrared (VNIR) and mid-infrared (MIR) spectroscopy. Geoderma 2015, 239–240, 229–239. [Google Scholar] [CrossRef]
- Tatzber, M.; Mutsch, F.; Mentler, A.; Leitgeb, E.; Englisch, M.; Gerzabek, M.H. Determination of Organic and Inorganic Carbon in Forest Soil Samples by Mid-Infrared Spectroscopy and Partial Least Squares Regression. Appl. Spectrosc. 2010, 64, 1167–1175. [Google Scholar] [CrossRef]
- Comstock, J.P.; Sherpa, S.R.; Ferguson, R.; Bailey, S.; Beem-Miller, J.P.; Lin, F.; Wolfe, D.W. Carbonate determination in soils by mid-IR spectroscopy with regional and continental scale models. PLoS ONE 2019, 14, e0210235. [Google Scholar] [CrossRef]
- Nguyen, T.T.; Janik, L.J.; Raupach, M. Diffuse reflectance infrared Fourier transform (DRIFT) spectroscopy in soil studies. Aust. J. Soil Res. 1991, 29, 49–67. [Google Scholar] [CrossRef]
- Silvero, N.E.Q.; Di Raimo, D.L.; Pereira, G.S.; de Magalhães, L.P.; Terra, F.S.; Dassan, M.A.; Salazar, D.F.U.; Demattê, J.A.M. Effects of water, organic matter, and iron forms in mid-IR spectra of soils: Assessments from laboratory to satellite-simulated data. Geoderma 2020, 375, 114480. [Google Scholar] [CrossRef]
- Janik, L.J.; Soriano-Disla, J.M.; Forrester, S.T.; McLaughlin, M.J. Moisture effects on diffuse reflection infrared spectra of contrasting minerals and soils: A mechanistic interpretation. Vib. Spectrosc. 2016, 86, 244–252. [Google Scholar] [CrossRef]
Disclaimer/Publisher’s Note: The statements, opinions and data contained in all publications are solely those of the individual author(s) and contributor(s) and not of MDPI and/or the editor(s). MDPI and/or the editor(s) disclaim responsibility for any injury to people or property resulting from any ideas, methods, instructions or products referred to in the content. |
© 2024 by the authors. Licensee MDPI, Basel, Switzerland. This article is an open access article distributed under the terms and conditions of the Creative Commons Attribution (CC BY) license (https://creativecommons.org/licenses/by/4.0/).

