Article

Evaluating the Landscape and Ecological Aspects of Urban Planning in Byblos: A Multi-Faceted Approach to Assessing Urban Forests

1
Landscape and Territory Planning Department, Lebanese University, Beirut P.O. Box 6573, Lebanon
2
School of Architecture and Built Environment, Faculty of Engineering, Queensland University of Technology, Brisbane, QLD 4000, Australia
*
Author to whom correspondence should be addressed.
Land 2024, 13(4), 464; https://doi.org/10.3390/land13040464
Submission received: 29 February 2024 / Revised: 26 March 2024 / Accepted: 29 March 2024 / Published: 5 April 2024

Abstract

:
Byblos, designated as a UNESCO World Heritage site, stands as one of Lebanon’s most ancient urban centers, known for its expansive green spaces. However, ongoing urbanization threatens these valuable areas. This study uses a multi-faceted approach to evaluate the structure and landscape attributes of Byblos’ urban and peri-urban forests (UPFs). Landscape canopy cover, diversity indices, forest structure, and a silhouette perceptual test were assessed across 24 streets in the city center, residential zones, and areas with heavy vehicular traffic. Findings reveal that 28% of Byblos’ canopy cover is concentrated mostly in the northeastern region. Native tree species account for 30% of the total, and a notable variation in tree diversity exists among different land-use types (Shannon diversity index (H) was 1.02 for the city center, 1.35 for residential streets, and 0.64 for vehicular areas). Additionally, a normal J-shaped distribution of tree diameters was identified across all street types. This study highlights a correlation between tree silhouettes and visual preferences, with densely spreading canopies being favored. Residential trees demonstrate the highest structural diversity and varied blossoming seasons. This research represents the first investigation into the current state of urban forestry in Byblos and offers recommendations for sustainable management and planning strategies.

1. Introduction

Nowadays, more than half of the world’s population already lives in cities, and this proportion is anticipated to rise to 70% by 2050 [1]. Rural–urban migration resulted in rapid urbanization, and people began settling in the cities and their surroundings. This increased the number of surfaces made of asphalt and other hard materials [2], which had a severe impact on natural ecosystems and might have even led to a radical loss in these ecosystems [1,3]. Although urban spaces cover only 2% of the surface of the earth, they emit considerable amounts of greenhouse gases and more than 70% of global CO2 emissions; this is due to the heavy use of fossil fuels for transportation, heating, etc. [1,4].
To effectively address urban challenges, urban and peri-urban forests (UPF) can play a vital role in promoting the sustainability and livability of future cities. Specifically, preserving and advancing urban and peri-urban forests, as well as fostering the sustainable provision of ecosystem services (ES) from UPFs, are critical to ensuring the well-being of present and future generations [5]. In this context, the preservation and enhancement of urban nature are critical for ensuring urban dwellers’ health and improving their general quality of life [5,6], as well as ensuring the integrated and systematic management of trees in urban and peri-urban areas, maximizing their contribution to the physiological, sociological, and economic well-being of urban society [7]. Rooted in North America with a rich history spanning over four decades, the concept of UPFs gained momentum in the United States during the 1970s as environmental concerns intensified [8].
The advantages of UPFs are well-documented, with studies demonstrating their ability to improve air quality, regulate temperature, and mitigate noise pollution [9,10,11]. These benefits translate into tangible improvements in human health, reducing respiratory problems, cardiovascular risks, and psychophysiological stress levels [12]. Moreover, UPF and afforestation projects enhance the overall quality of life by creating aesthetically pleasing spaces that foster social interaction, recreation, and a sense of community [13,14].
The economic benefits of UPFs are equally compelling. Studies have shown that UPFs can increase residential property values, boost tourism, and attract businesses, leading to job creation and economic growth [14]. Additionally, UPFs can reduce an area’s overall energy demand by providing shade and insulation, and lowering heating and cooling demands [15,16].
Despite the wealth of evidence supporting the benefits of UPFs, most studies have focused on cities in the Global North [17]. In the Global South, particularly in the Middle East and North Africa (MENA) region, where climate change is exacerbating existing challenges such as rising temperatures, prolonged droughts, and increasing urbanization, UPF research is relatively limited.
The MENA region is particularly vulnerable to the impacts of climate change, with scarce water resources facing additional strain from population growth, socioeconomic development, and urbanization [18]. These factors pose serious risks to lives, biodiversity, financial stability, and human security. It is expected that the challenges will worsen in the future, especially since the MENA region is one of the regions most vulnerable to climate change impacts [19].
Recognizing the urgency of the situation, countries in the MENA region have initiated several UPF projects, drawing inspiration from successful initiatives elsewhere. A 2016 report by The Nature Conservancy, a prominent US environmental NGO, highlighted the role of urban tree planting in reducing air pollution and heat stress. This report has spurred several UPF projects in the MENA region, with one of the most ambitious being Saudi Arabia’s Riyadh Green Plan. This visionary initiative, aligned with Vision 2030, aims to plant 7.5 million trees in the capital, transforming it into a sustainable and livable city [20].
Apart from various urban forestry projects in the MENA/NENA region, Lebanon stands out as a country with a limited number of studies on urban forestry planning [21]. According to a UN-Habitat report [22], Lebanon’s cities are experiencing a population surge, leading to haphazard and unregulated urban sprawl. This has resulted in additional environmental issues, including shrinking green spaces, water contamination, car-centric transportation, and reliance on non-renewable energy sources. Additionally, climate change has yet to receive the attention it deserves from Lebanon’s national authorities. While its effects may seem mild, Lebanon is witnessing longer, hotter summers; decreased winter snowfall; and dwindling water resources—clear indications of climate change’s social and environmental ramifications [23]. To address these concerns, a sustainable environmental solution is imperative. While a few UPF projects have been implemented in Beirut, such as the Beirut River Forest, they have not been fully completed.
Several cities need to enhance their urban forestry planning in this context. For instance, Byblos, one of Lebanon’s most captivating cities and the world’s oldest continuously inhabited city listed on the UNESCO World Heritage List, faces numerous challenges. This mesmerizing town boasts a rich tapestry of cultural and natural features, including coastlines, beaches, agricultural lands, and orchards, contributing significantly to its allure and defining its landmarks [24]. However, Byblos’s topography has undergone significant alterations over time, with the city expanding eastward up the hills in an uncontrolled manner, neglecting the precious green spaces that once dotted its landscape [24]. Consequently, only one large green area in the north of the city has been preserved. This neglect has led to a loss of biodiversity and the emergence of pressing issues such as waste and sewage contamination of rivers and aquifers, flooding, and wastewater.
Furthermore, Byblos faces microclimate challenges due to its growing tourism sector and economic importance. Despite a doubling in visitor numbers over the last decade, the city lacks adequate public spaces for rest and exploration, leaving visitors uncomfortable during hot days and pushing residents to rely on cars for transportation, thereby severing their connection with nature.
Recognizing the scarcity of studies in this area, this research aims to fill the gap by focusing on the following objectives:
  • Understand the ecological characteristics that contribute to the diversity and resilience of Byblos’s ecology.
  • Analyze the landscape components that influence the visual guidance and aesthetic value of Byblos.
  • Develop recommendations for the implementation of a UPF project in Byblos that aligns with urban forestry principles and the city’s identity.

2. Materials and Methods

2.1. Site Analysis

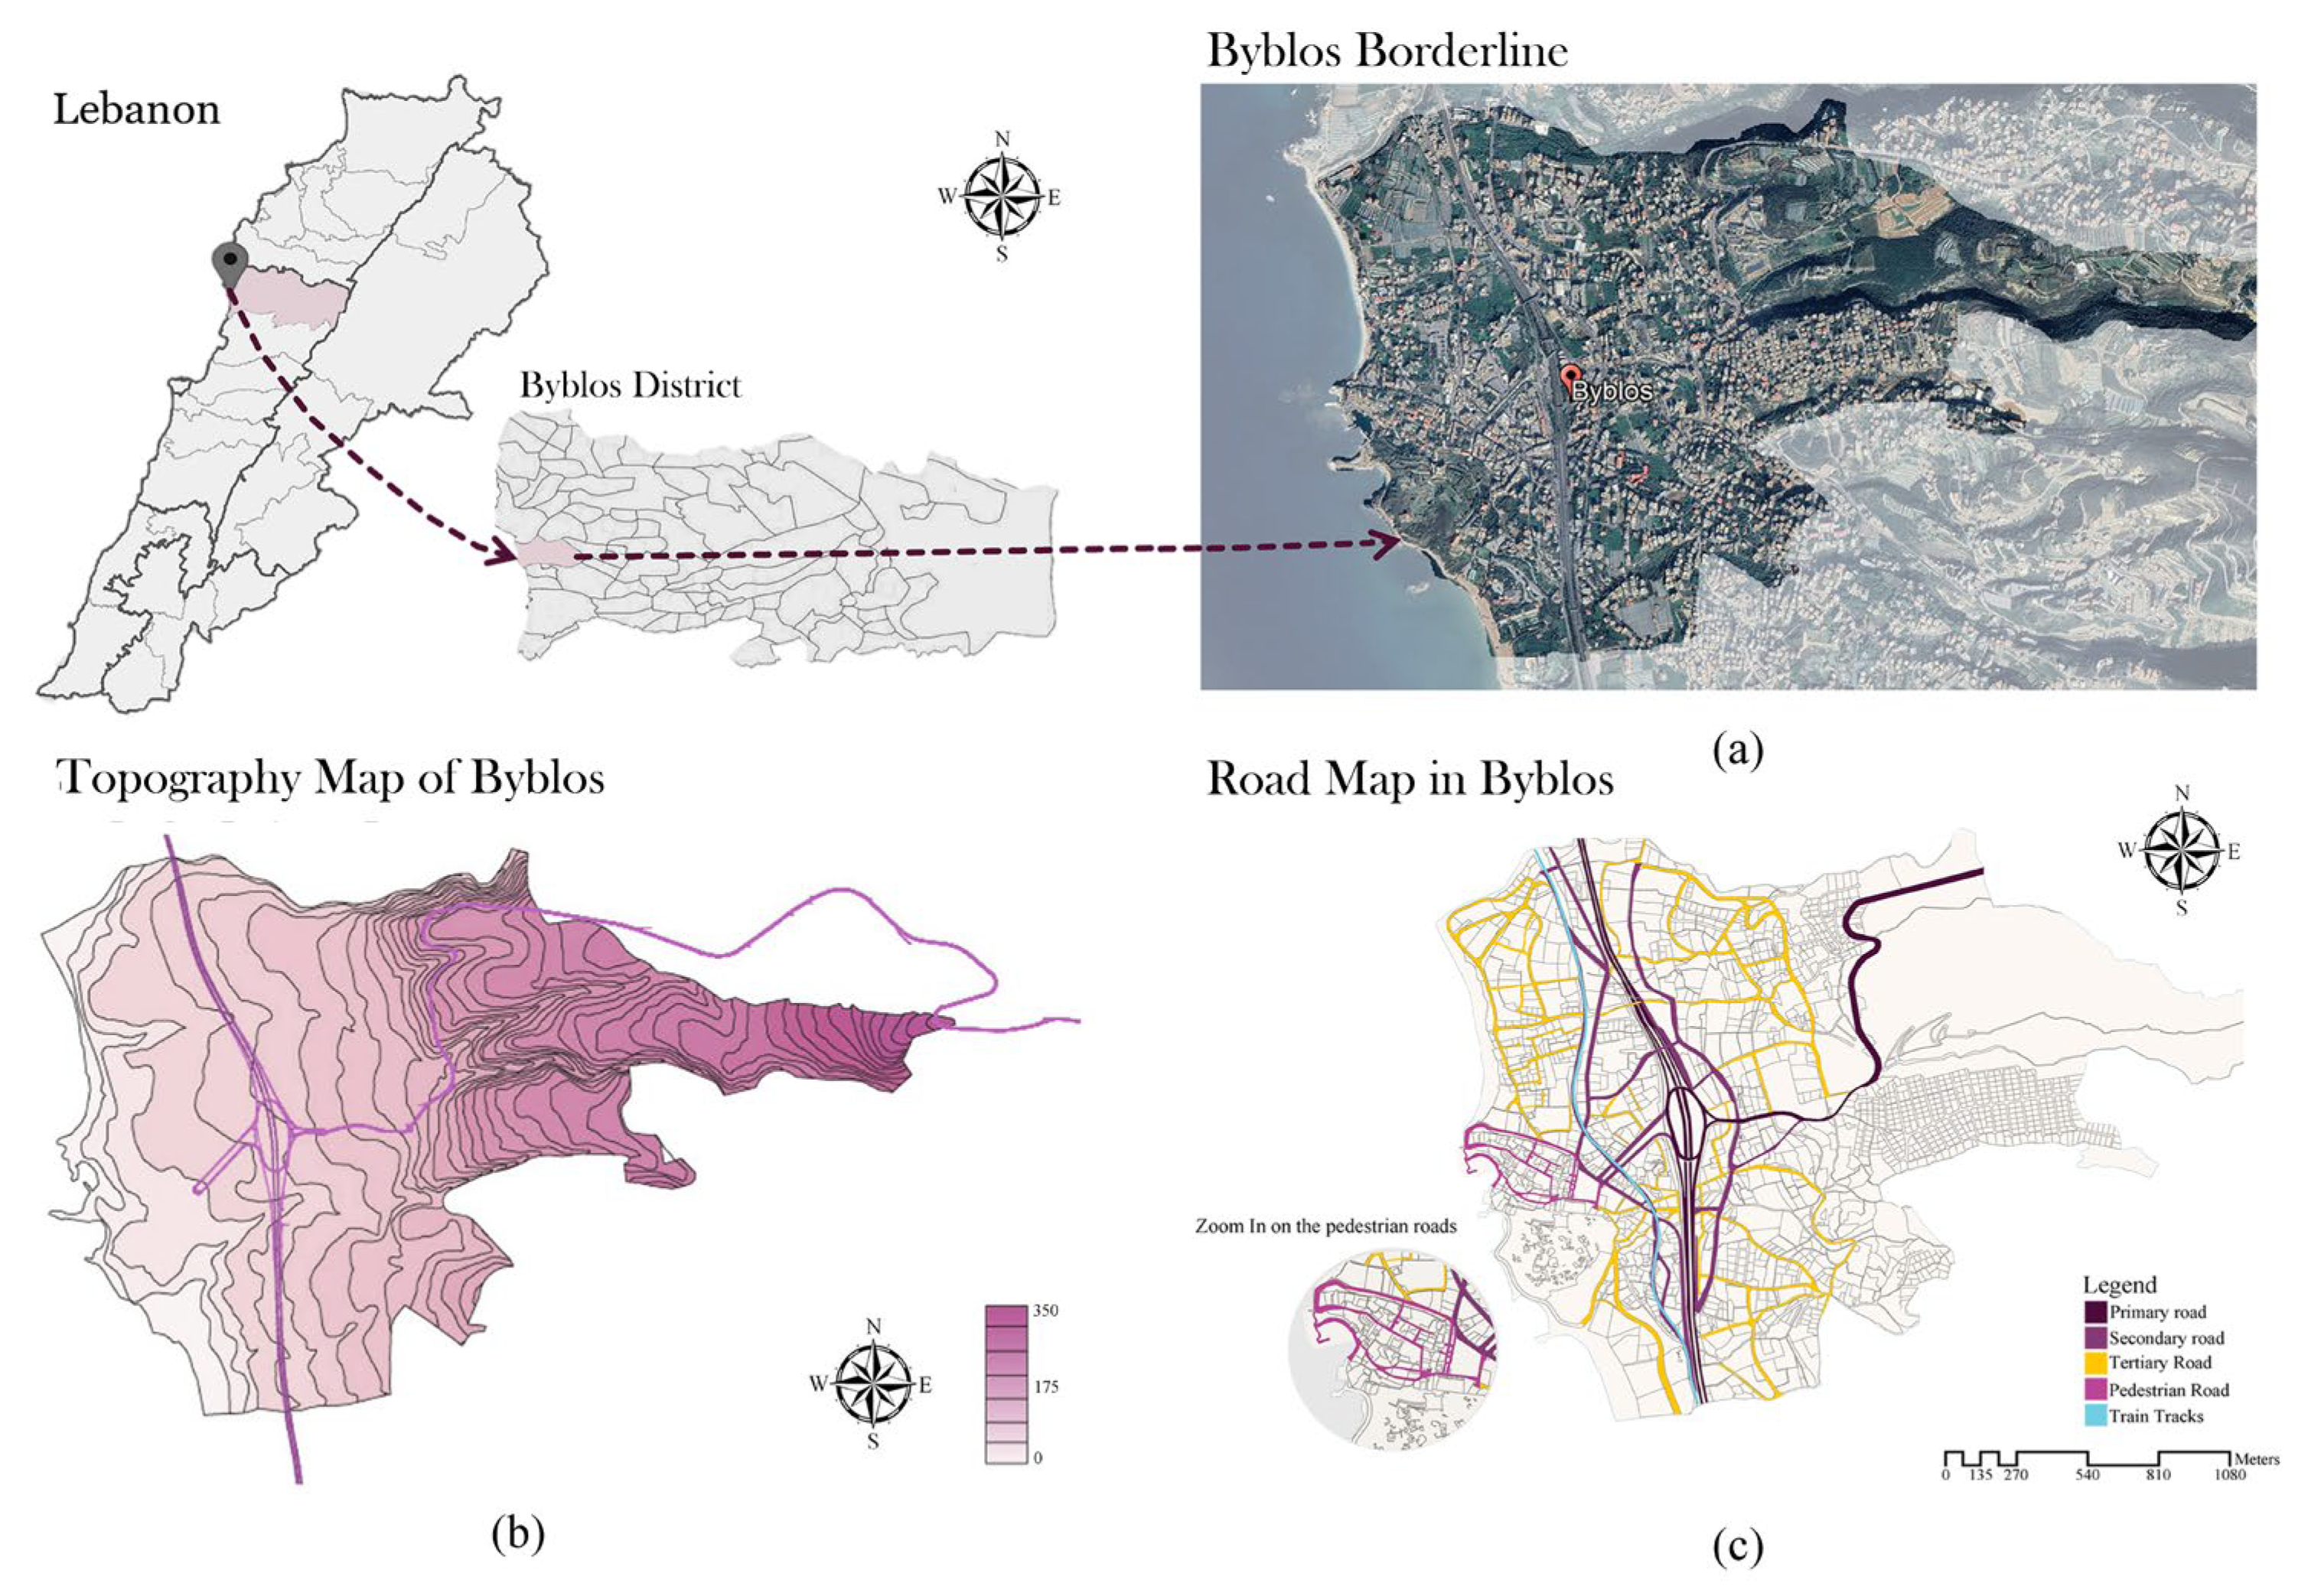
2.1.1. Overview of Byblos

The city is part of the Byblos district, which consists of 84 towns, and is surrounded by Hboub, Edde, Amchit, Qartaboun, and Blat. The city’s area is around 8 km2. Since Byblos is situated next to the sea, its altitude ranges between 0 m and 350 m (Figure 1).
As one of the oldest continuously inhabited villages in the East, dating back more than 7000 years, Byblos has many hidden layers that offer great knowledge about its historical story and the footprint of every civilization that lived there—whether Romans, Greeks, Persians, or others [25]. The cultural heritage embedded in this city not only made it a pole of attraction in Lebanon but also contributed to it being registered on the UNESCO World Heritage List in 1984, as it fits three of their criteria: Criterion (iii): Byblos bears exceptional testimony to the beginnings of Phoenician civilization; Criterion (iv): In existence since the Bronze Age, Byblos provides one of the primary examples of urban organization in the Mediterranean world; and Criterion (vi): Byblos is directly and tangibly associated with the history of the diffusion of the Phoenician alphabet (on which humanity is still largely dependent today), with the inscriptions of Ahiram, Yehimilk, Elibaal and Shaphatbaal. The city is located midway between Beirut and Tripoli, which makes it easily accessible for tourists, visitors, and residents. Its location next to the Mediterranean Sea adds even more touristic value to the site. Figure 1 shows the road map of Byblos; however, the core part of the old city of Byblos is only open to pedestrians, specifically at night, to preserve its enchanting spirit.

2.1.2. Urban Development in Byblos

Byblos, originally a small coastal village, has grown over time to become a vibrant hub of residential, archaeological, and tourist activity. As the city’s economic and tourist appeal has increased, its infrastructure has adapted to accommodate growth while preserving the value of its historical landmarks. Byblos is now a thriving destination for regional and international visitors, with residential areas expanding to the city’s eastern region, while the western part is primarily used for agricultural and tourist purposes.

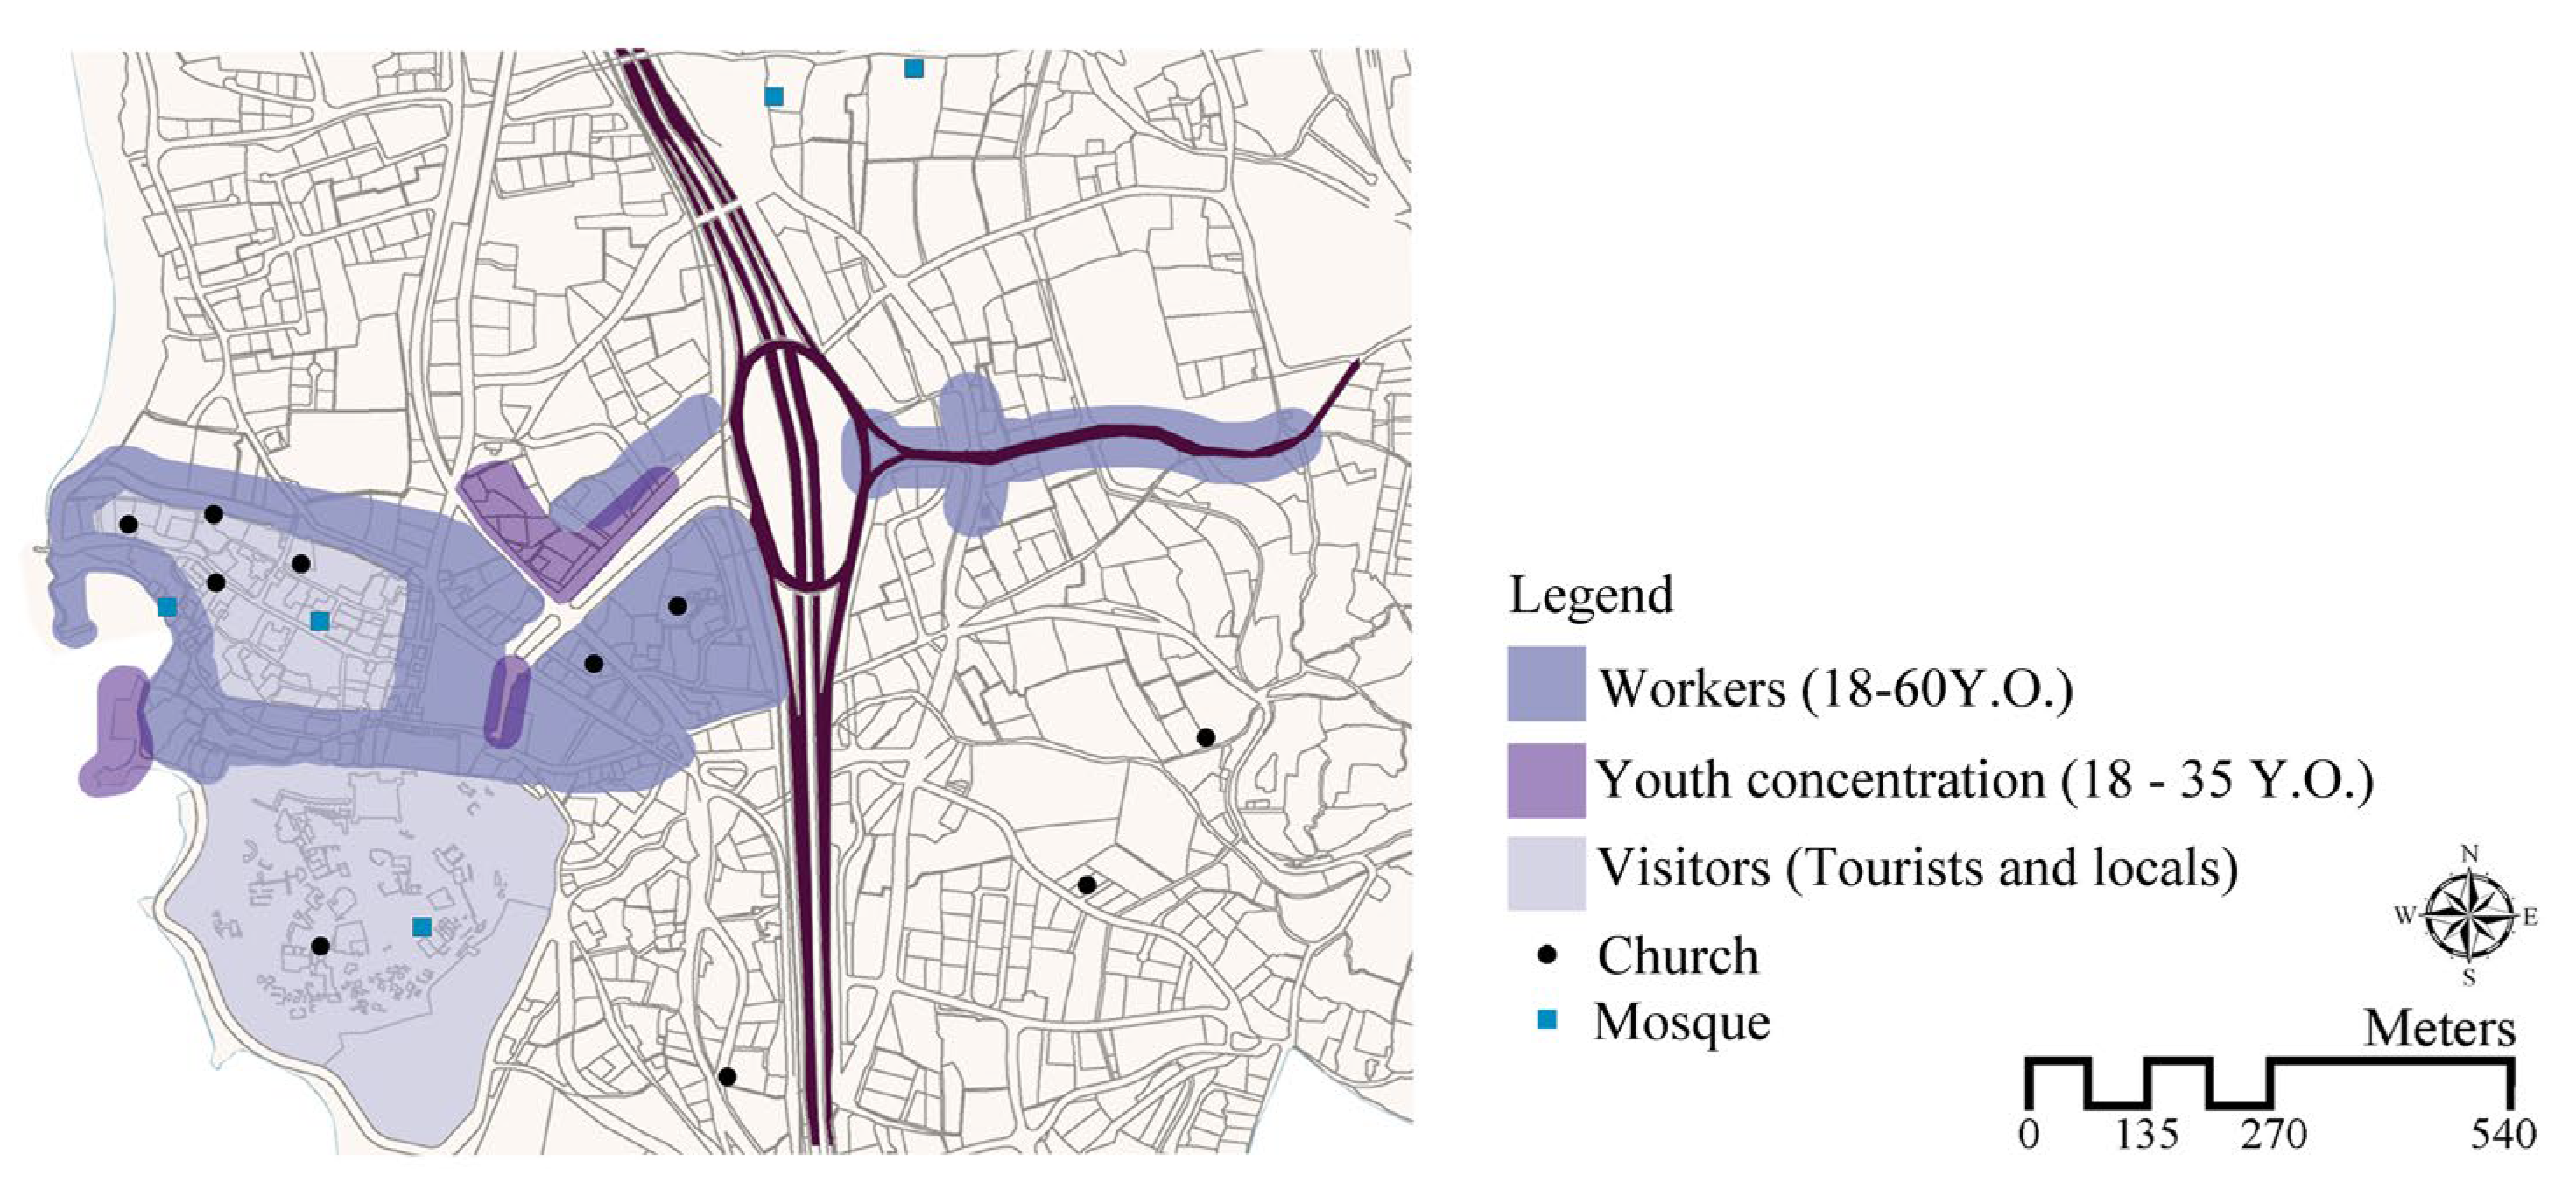
2.1.3. Demographical and Social Aspects in the City of Byblos

Byblos is renowned for its harmonious coexistence of multiple religions, particularly between Christians and Muslims. Boasting a population of roughly 40,000, Byblos is home to 28,486 Lebanese residents [26]. The remaining residents are comprised of Armenian, Syrian, and other nationalities. Social groups within Byblos are situated in social nodes located throughout the old city and a small area in the east. Workers can be found in commercial areas, while the younger demographic and tourists can be found frequenting the old port, souks, and restaurant-lined streets [24,26] (Figure 2).

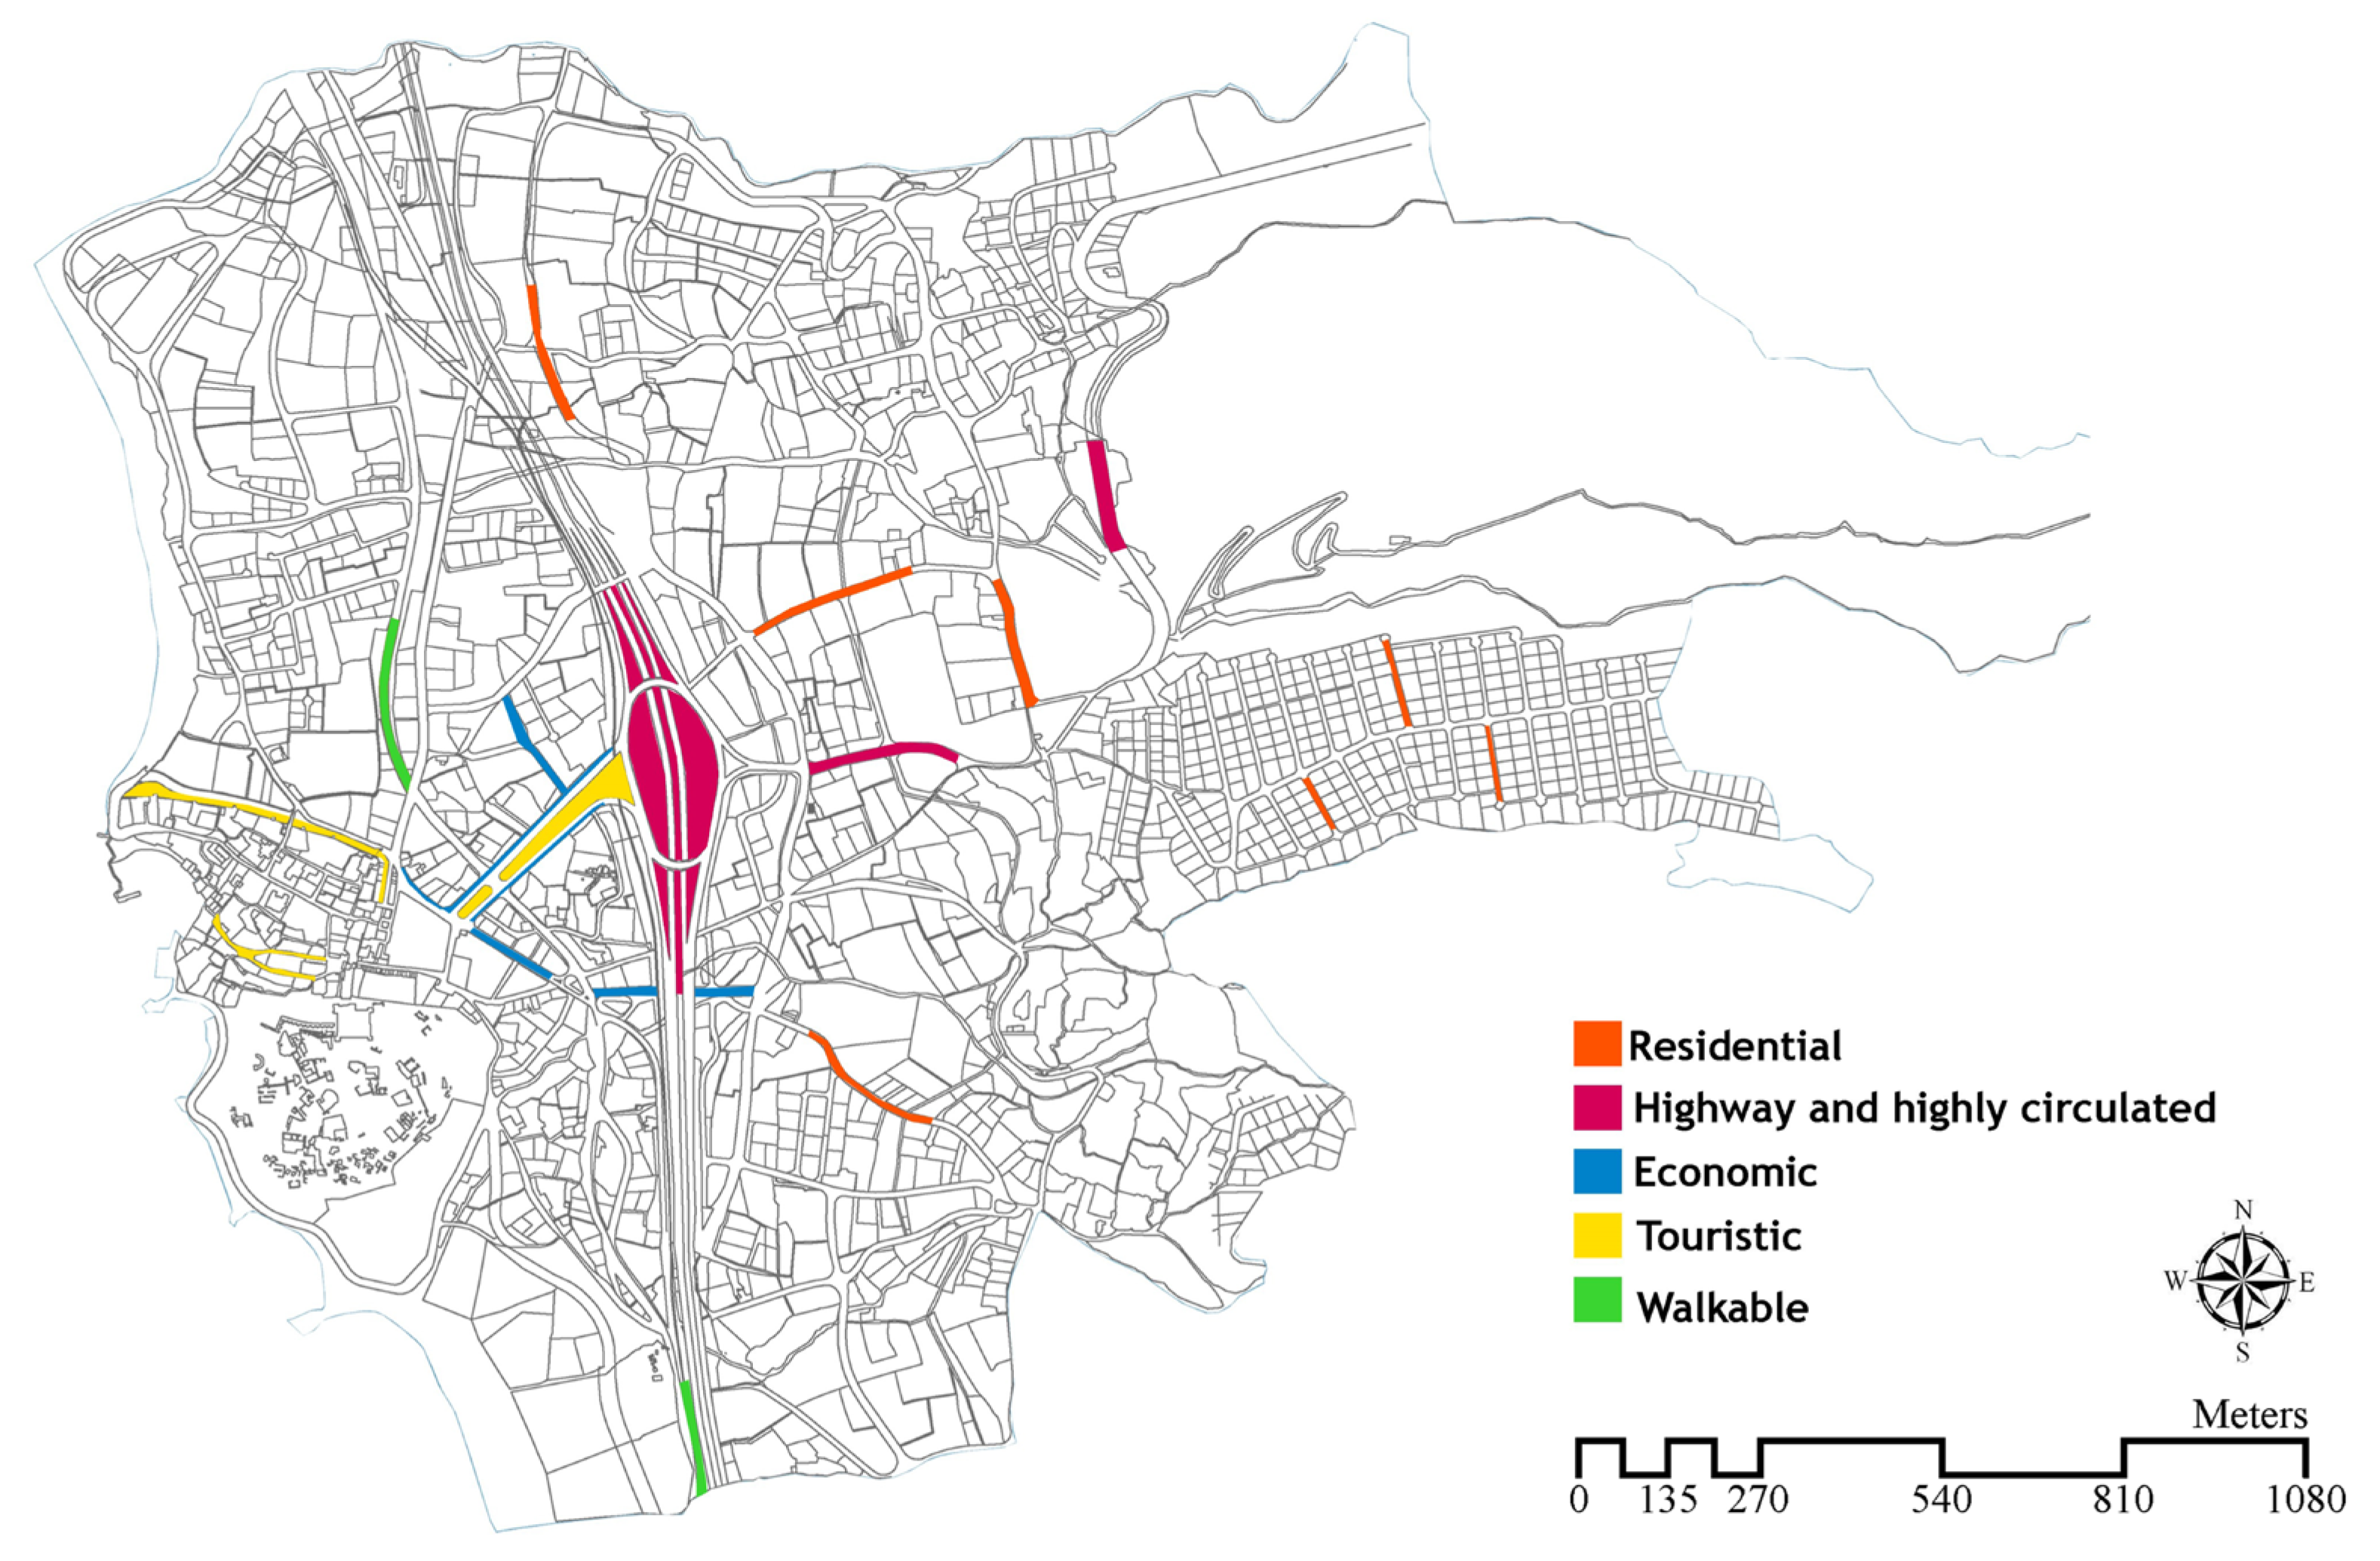
2.1.4. Byblos Landscape Assets
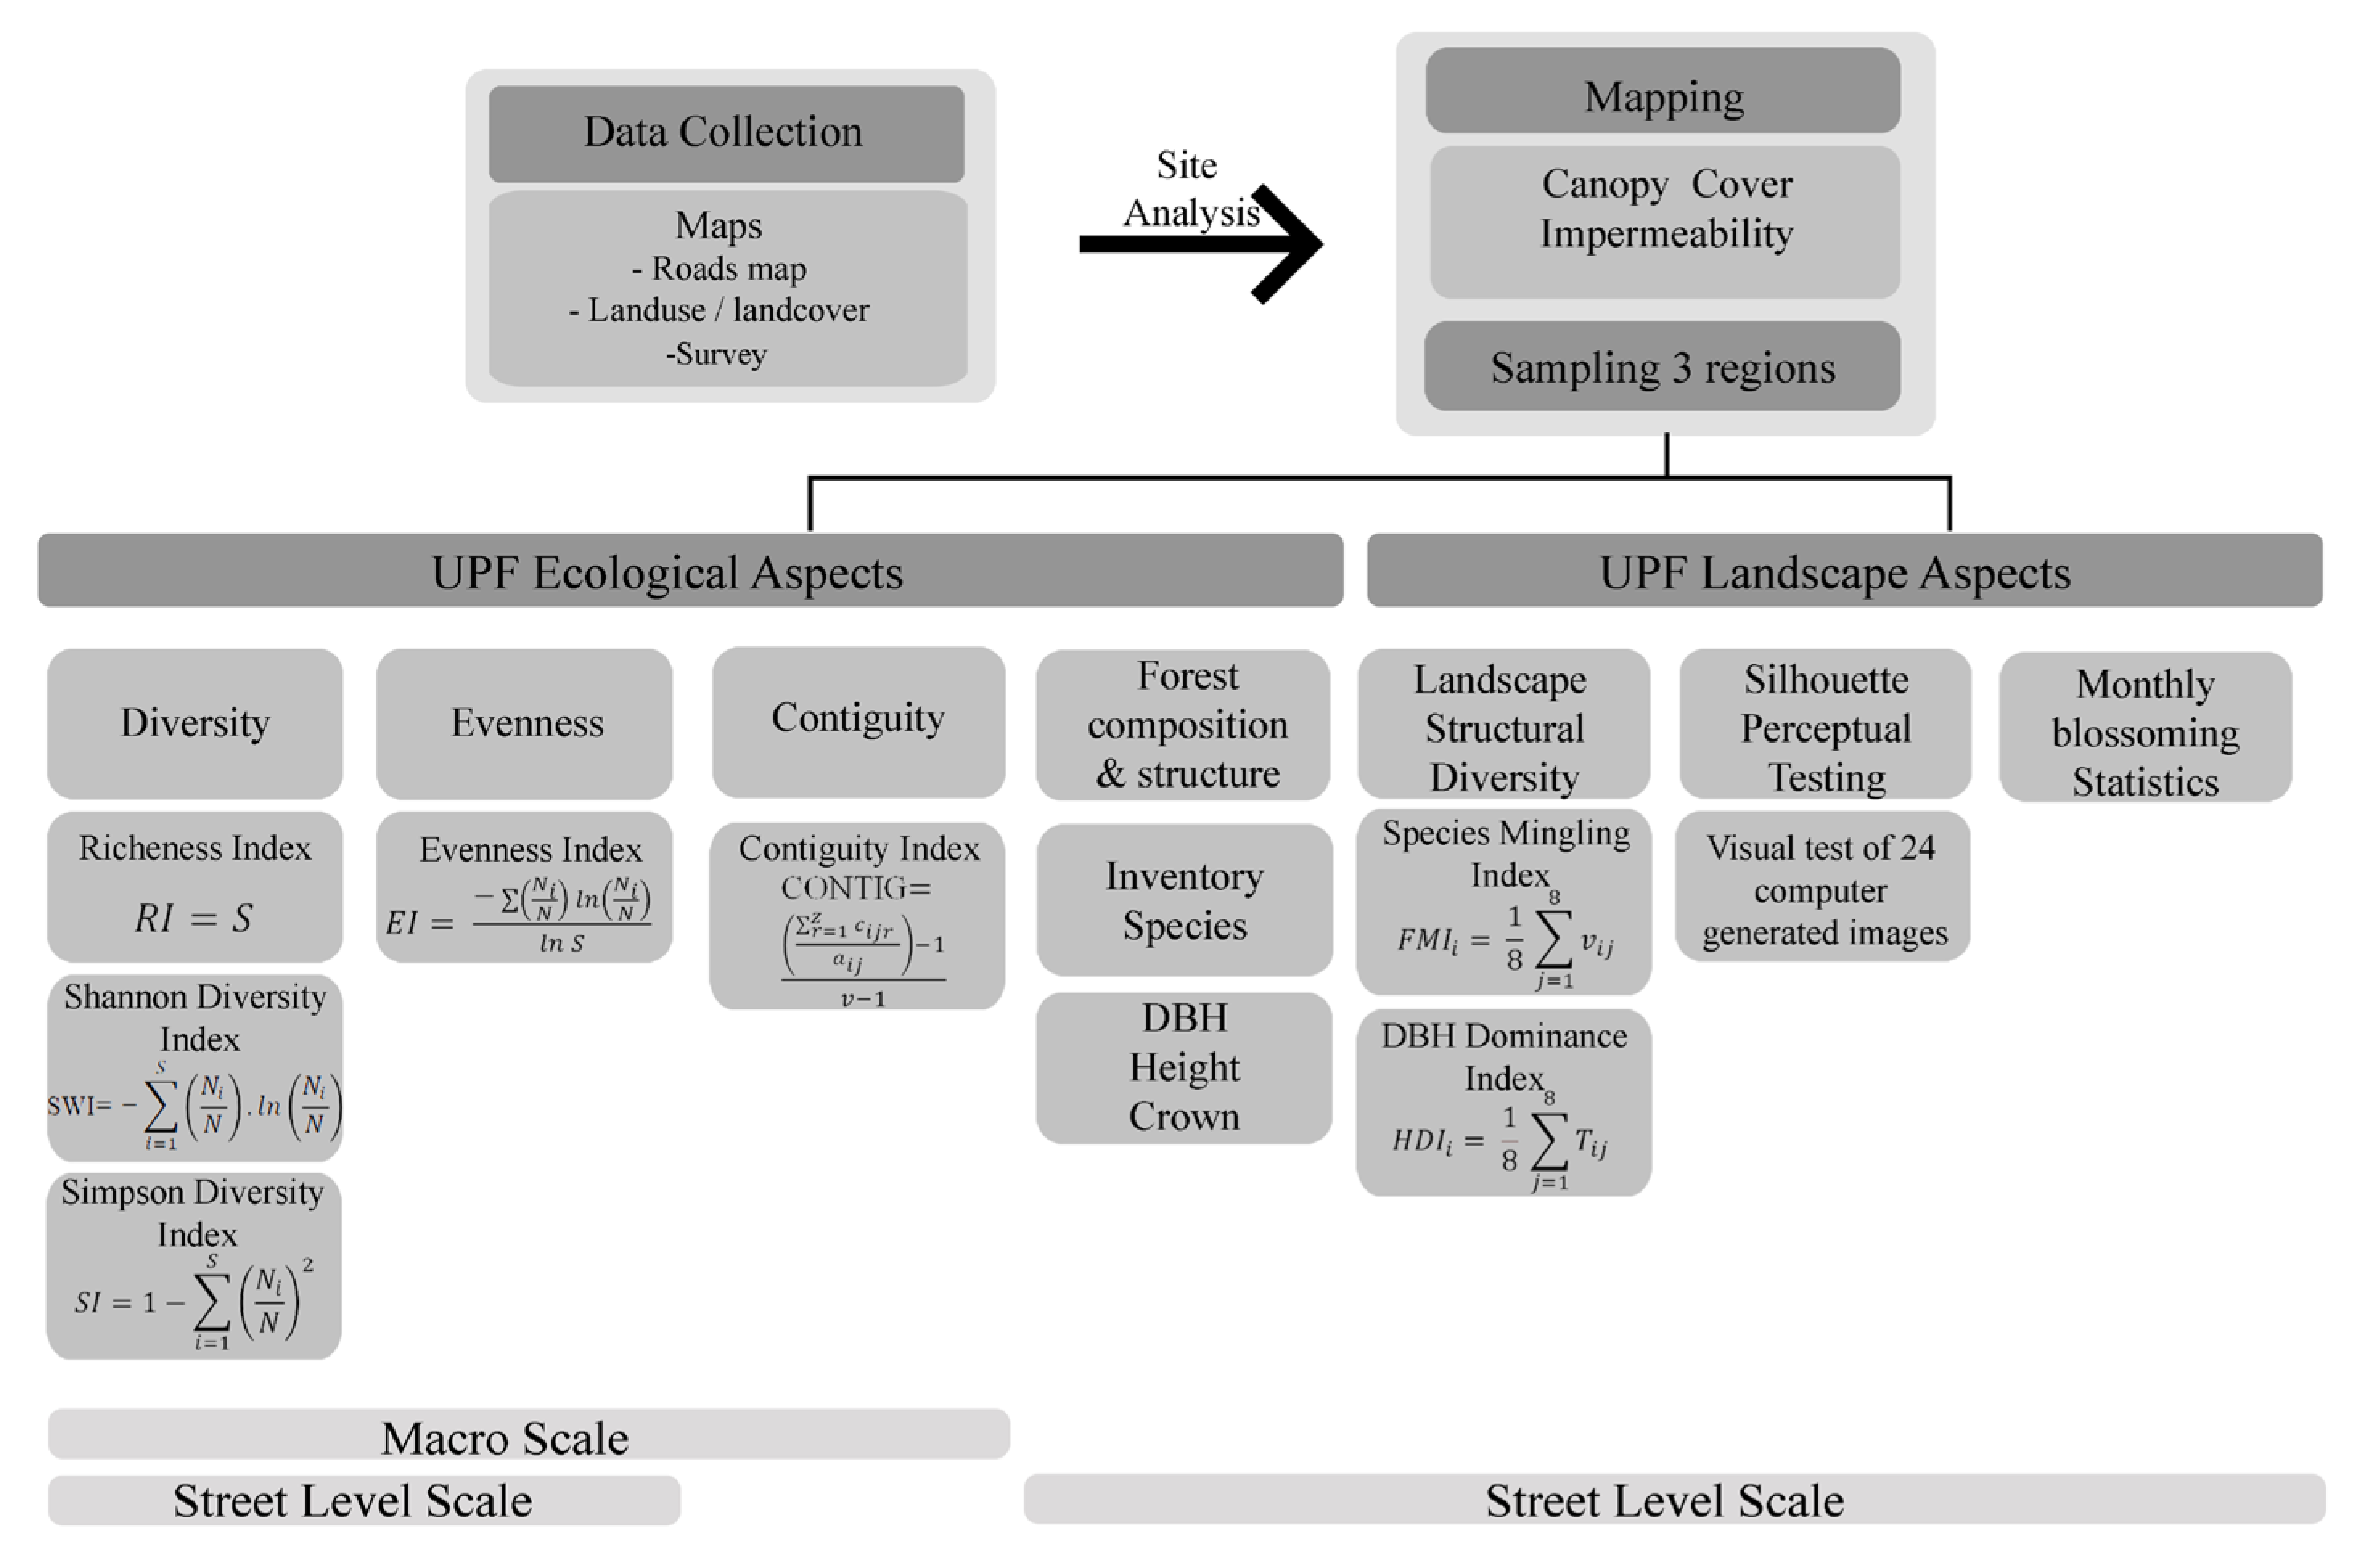
Byblos boasts a rich and varied landscape, encompassing a diverse coastline, river valleys, beaches, fertile orchards, and thriving agricultural areas. The city’s natural heritage is a source of great pride for its residents [24]. Moreover, the municipality of Byblos reported Al Chamiye Beach as a pristine coastal reserve of remarkable ecological importance, captivated many scholars by its vibrant biodiversity. The abundance of life in Byblos extends from the shoreline to its rolling hills, where a vast expanse of woodland is nestled in the northeast of the city.

2.2. Methodology

The research comprised two stages: an initial macro-scale phase aimed at evaluating the canopy forest and diversity of the urban forest in Byblos, followed by a micro-scale phase focused on appraising the structural and aesthetic features of the urban forest, as shown in the methodology framework (Figure 3).
A random-sample point analysis conducted with i-Tree Canopy was employed at the macro-scale level to assess tree canopy cover in Byblos. This analysis, along with Land Use Land Cover (LULC) maps from the National Council for Scientific Research–Lebanon CNRS (2022) [27], were used to quantify fragmented and intact green spaces and calculate the urban area’s permeability. Tree species richness, diversity, and connectivity metrics were computed via Fragstats software version 4.2, employing rasterized land-cover and land-use maps sourced from CNRS 2022.
On a street scale, to assess the tree composition and structure, twenty-four streets were selected for sampling, across the city center (nine streets), residentially (eight streets), and on vehicular streets (seven streets). The selection criteria were established on the parameters of usage, visitor frequency, and the expression of Byblos’s identity. Streets were categorized based on their functional utility, prioritizing those exhibiting the highest visitor rates and symbolic significance to Byblos. The sampled streets are highlighted in Figure 4.

2.3. Forest Landscape Ecological Values

Ecological characteristics of the species were assessed according to their importance in providing better biodiversity and fostering urban resiliency.
The diversity index was assessed since species diversity is critical in promoting a healthy and resilient urban forest. Moreover, urban tree diversity gives urban forests the capacity to react to current and upcoming pressures and threats. Thus, the indexes of diversity are the richness index (RI), the Shannon–Wiener index (SWI), and the Simpson index (SI), as used in previous studies [28,29].
R I = S
S W I = - i = 1 S N i N · ln N i N
S I = 1 i = 1 S N i N 2
where RI is the richness index, S is the number of species present, N i is the number of trees of a specific species, and N is the total number of trees present.
The second index used is the evenness index, which provides valuable information about the stability of the ecosystem and the distribution of the species.
E I = - N i N ln N i N ln S
With
N = i = 1 S N i
where EI is the evenness index, S is the number of species present, N i is the number of trees of a specific species, while N is the total number of trees present.
All the ecological indicators were also applied via Fragstats software version 4.2, to assess them all over Byblos.

2.4. Forest Composition and Structure

During the field visits, a tree inventory of the streets of Byblos was carried out. Tree measurements, such as DBH (diameter at breast height), height, and crown area, were gathered for trees that could be seen by visitors along the sampled streets. DBH was measured using a measuring tape and projecting the sampled points from the periphery of the canopy to detect its area, and the height was assessed by using the GLOBE Observer app. These measurements were sorted into four categories (as shown in Table 1) to gain insight into the types and distribution of trees. Evaluating the existing trees is an important aspect of assessing UPFs, so it is essential to understand the composition of the site and the condition of its trees. During the field visits, measures of DBH, height, and crown area were performed on trees that were visible to the visitors, whether they were directly on the sidewalks or a few meters away [30].

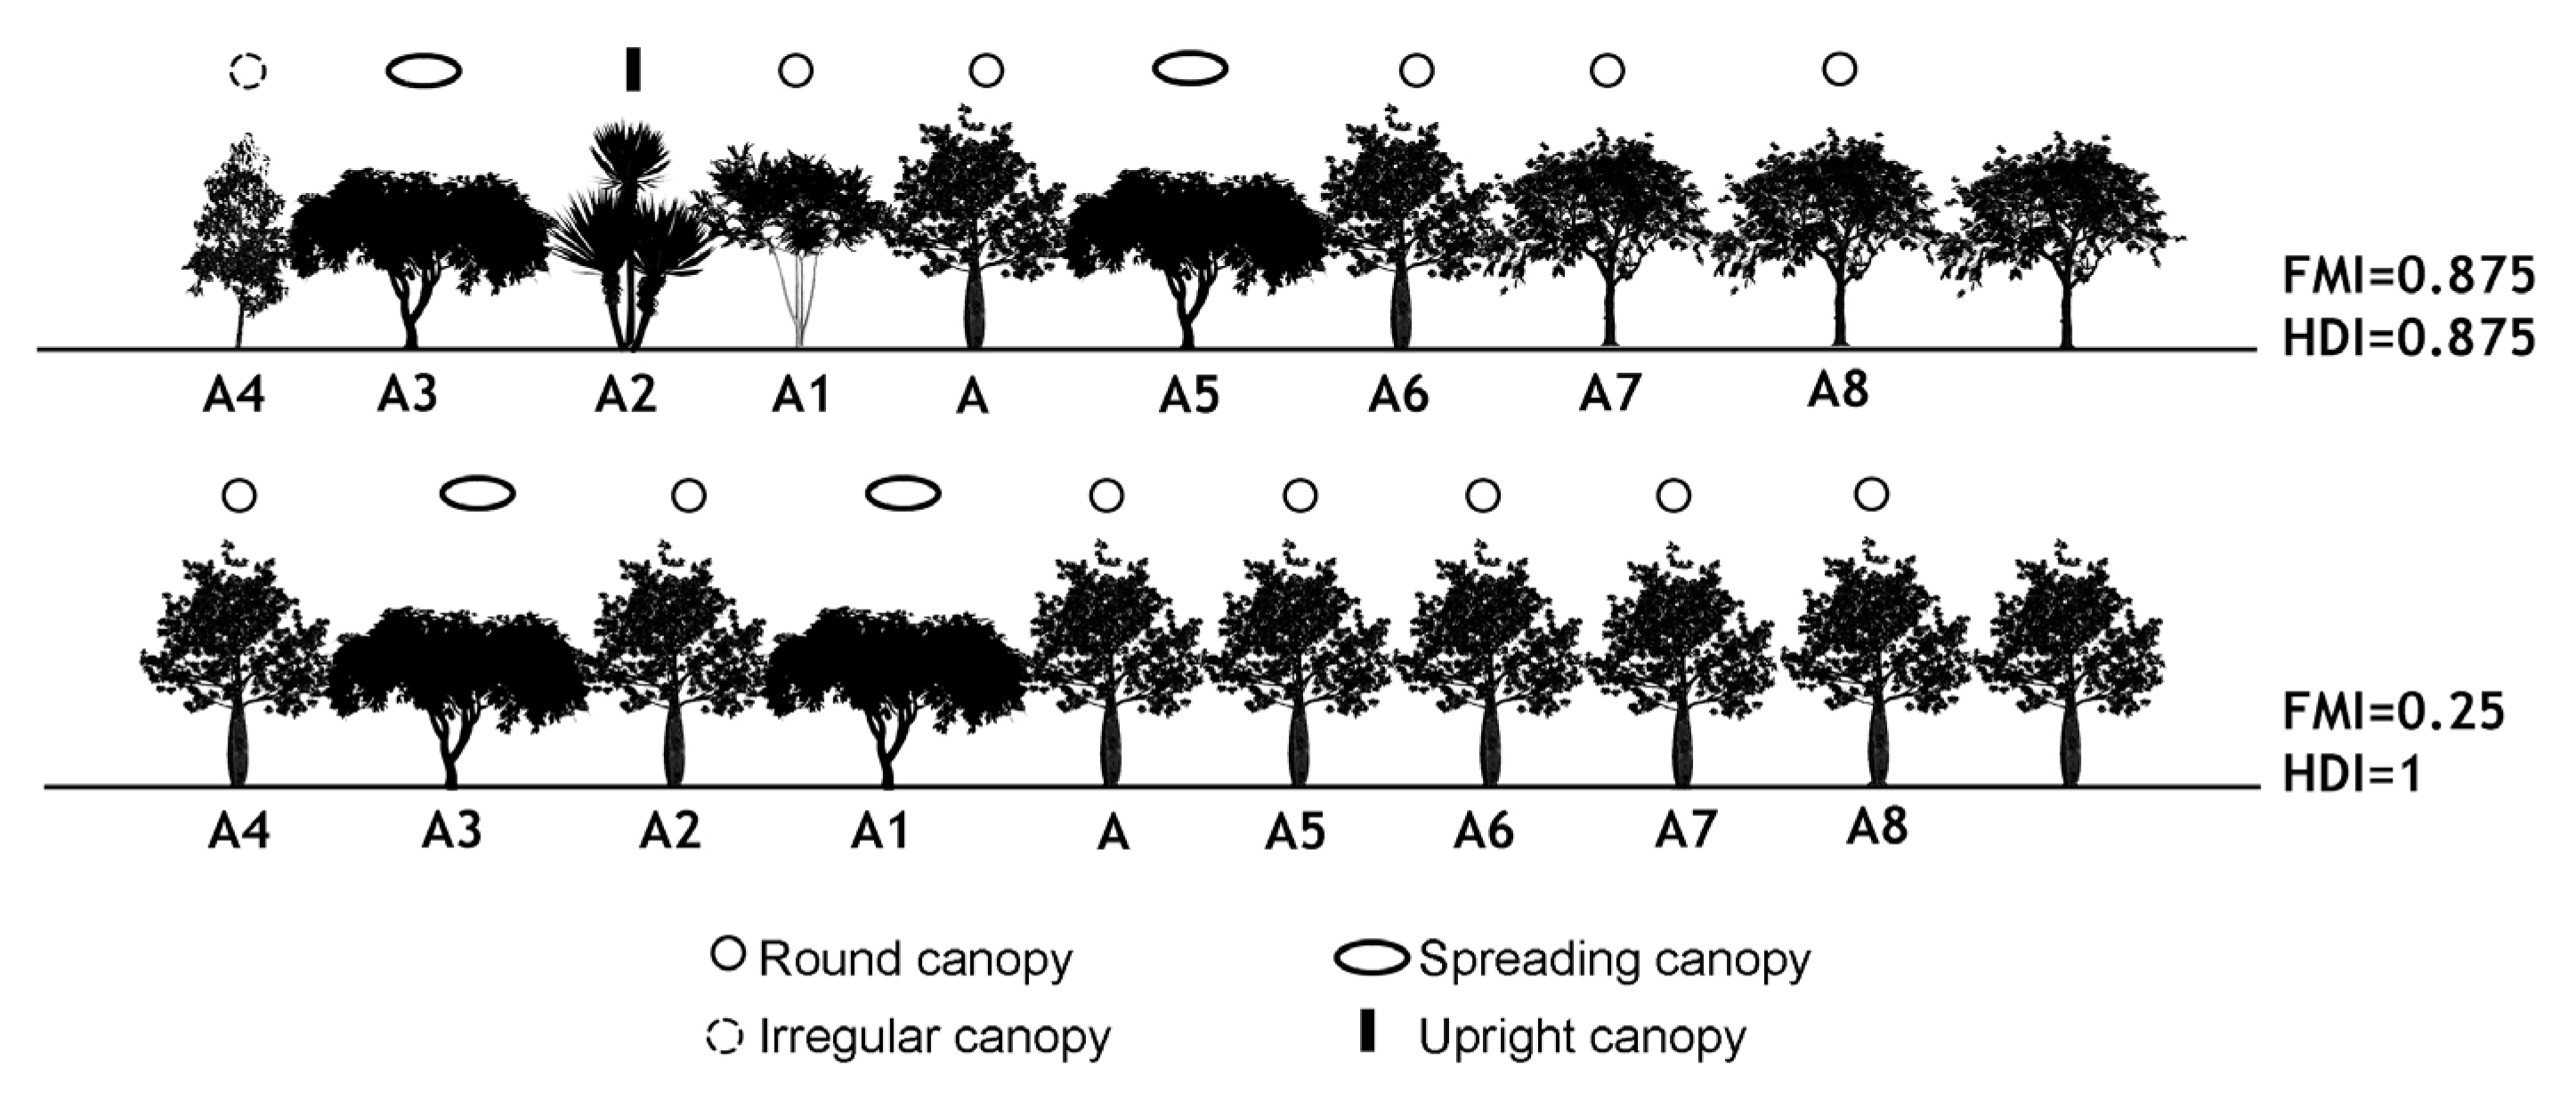
2.5. Landscape Structural Diversity

By assessing the structural diversity of trees on selected streets, we aimed to comprehend the complexity and diversity of the urban forest in Jbeil, as it is linked to emotional responses to the landscape. The indexes used are the form mingling index (FMI), which describes the diversity of the form of neighbor trees compared to the reference tree, and the height dominance index (HDI), which is useful for describing the dominance of the height of the reference tree compared to the eight closest neighboring trees. These indexes were calculated based on eight neighboring trees that were the closest to the reference tree, instead of four neighboring trees, due to the long streets and the abundance of trees [31,32].
The form mingling index:
F M I i = 1 n   j = 1 n v i j
where FMI is the form mingling index, i is the reference tree, and j refers to the closest trees. When the neighbor j is not the same species as the reference tree i, then v j = 1; otherwise, v j = 0 . The interpretation of the FMI values is as follows: no mixture (FMI = 0); low mixture (FMI = 0.25); medium mixture (FMI = 0.50); high mixture (FMI = 0.75); and complete mixture (FMI = 1.00).
The height dominance index:
H D I i = 1 n   j = 1 n T i j
where HDI is the height dominance index, i is the reference tree, and j refers to the closest trees. When the neighbor j is different than the reference tree i, then T j = 1; otherwise,   T j = 0 . The interpretation of the U values is as follows: predominant (HDI = 0); subdominant (HDI = 0.25); medium (HDI = 0.50); disadvantaged (HDI = 0.75); and absolutely disadvantaged (HDI = 1.00). The trees on the streets were represented visually and grouped by a minimum of 5 trees and a maximum of 13. The tree in the middle is considered the reference tree, and the calculations of the form mingling index and height dominance index were applied. Figure 5 shows how this was represented.

2.6. Silhouette and Perceptual Testing

A survey combining verbal questioning and landscape profile photographs (26 photos) was conducted in Byblos to understand forest landscape preferences in both the core and peri-urban areas. One hundred people, including residents and visitors, participated in the survey. The survey adopted a random sampling methodology to ensure a representative sample of the Byblos population. This approach included residents of Byblos alongside visitors, encompassing a broad age range from 18 to 64 years and older. This strategy aimed to capture the perspectives of various generations within the Byblos community. To ensure accessibility, those unfamiliar with technology were surveyed in person, while others completed the survey online. Moreover, 46% of the participants in this survey were residents of Byblos, while the rest were visitors, tourists, or workers from the neighboring villages. Regarding gender distribution, 52% of the participants identified as female, and the remaining 48% identified as male.
On the perceptual testing level, the landscape sceneries were evaluated through visual representation so we could determine the silhouette value of the landscape [32]. Landscape sceneries were shown to volunteers to assess their aesthetic quality. The landscape sceneries were representations of the sampled streets; the silhouette of the trees was used and classed in the same order as reality; and all sceneries were in black and white to encourage people to focus on the shapes of the trees, as tree colors are known to cause differences in perception [33]. After explaining the aesthetic function and the silhouette effect to the volunteers, they were asked to rank the silhouette effect using a 10-point scoring system. As for the silhouette value, Excel software version 2403 was used for statistical analysis to assess the scores given by the participants for each landscape scenery. Once the silhouette scores were calculated, a correlation test took place between the silhouette, FMI, HDI, and FMI + HDI.

3. Results

3.1. Canopy Cover

Byblos’s canopy cover ranges from 28% to 30%, as estimated by the ArcGIS 10.8 application (Figure 6), with an i-Tree Canopy rating of 27.63 ± 1.58 SE. The northeast and east areas of the city have the highest amount of canopy cover. On the other hand, the residential area situated in the western part of the city only has 11% coverage. In terms of impermeability, approximately 71% of the area in Byblos is covered by both continuous and discontinuous urban fabric. The majority of the impermeable surface is located in the west, southwest, east, and southeast regions of the city.

3.2. Forest Landscape Ecological Values

The Shannon diversity index represented a value of SWI = 2.05, while the Simpson diversity index scored SI = 0.75 and the evenness index scored EI = 0.66. Among all surveyed areas, residential streets exhibited the highest diversity, as indicated by values of 5.75 for the richness index (RI), 1.35 for the Simpson diversity index (SWI), and 0.66 for the Shannon diversity index (SI). Additionally, residential streets attained the maximum evenness with an evenness index (EI) value of 0.8. Comparatively, the city center streets demonstrated slightly lower richness (RI = 5.56) than residential streets, and there were notable distinctions in the diversity indexes of Shannon (0.95) and Simpson (0.47). The evenness index for city center streets was recorded as EI = 0.56. Conversely, the thoroughfares with vehicular streets exhibited the lowest values across all four indexes (Table 2). The contiguity results indicated that, with the exception of the clear mixed wooded lands (0.4) and the clear broadleaved wooded land (0.28), all classes demonstrated high values.

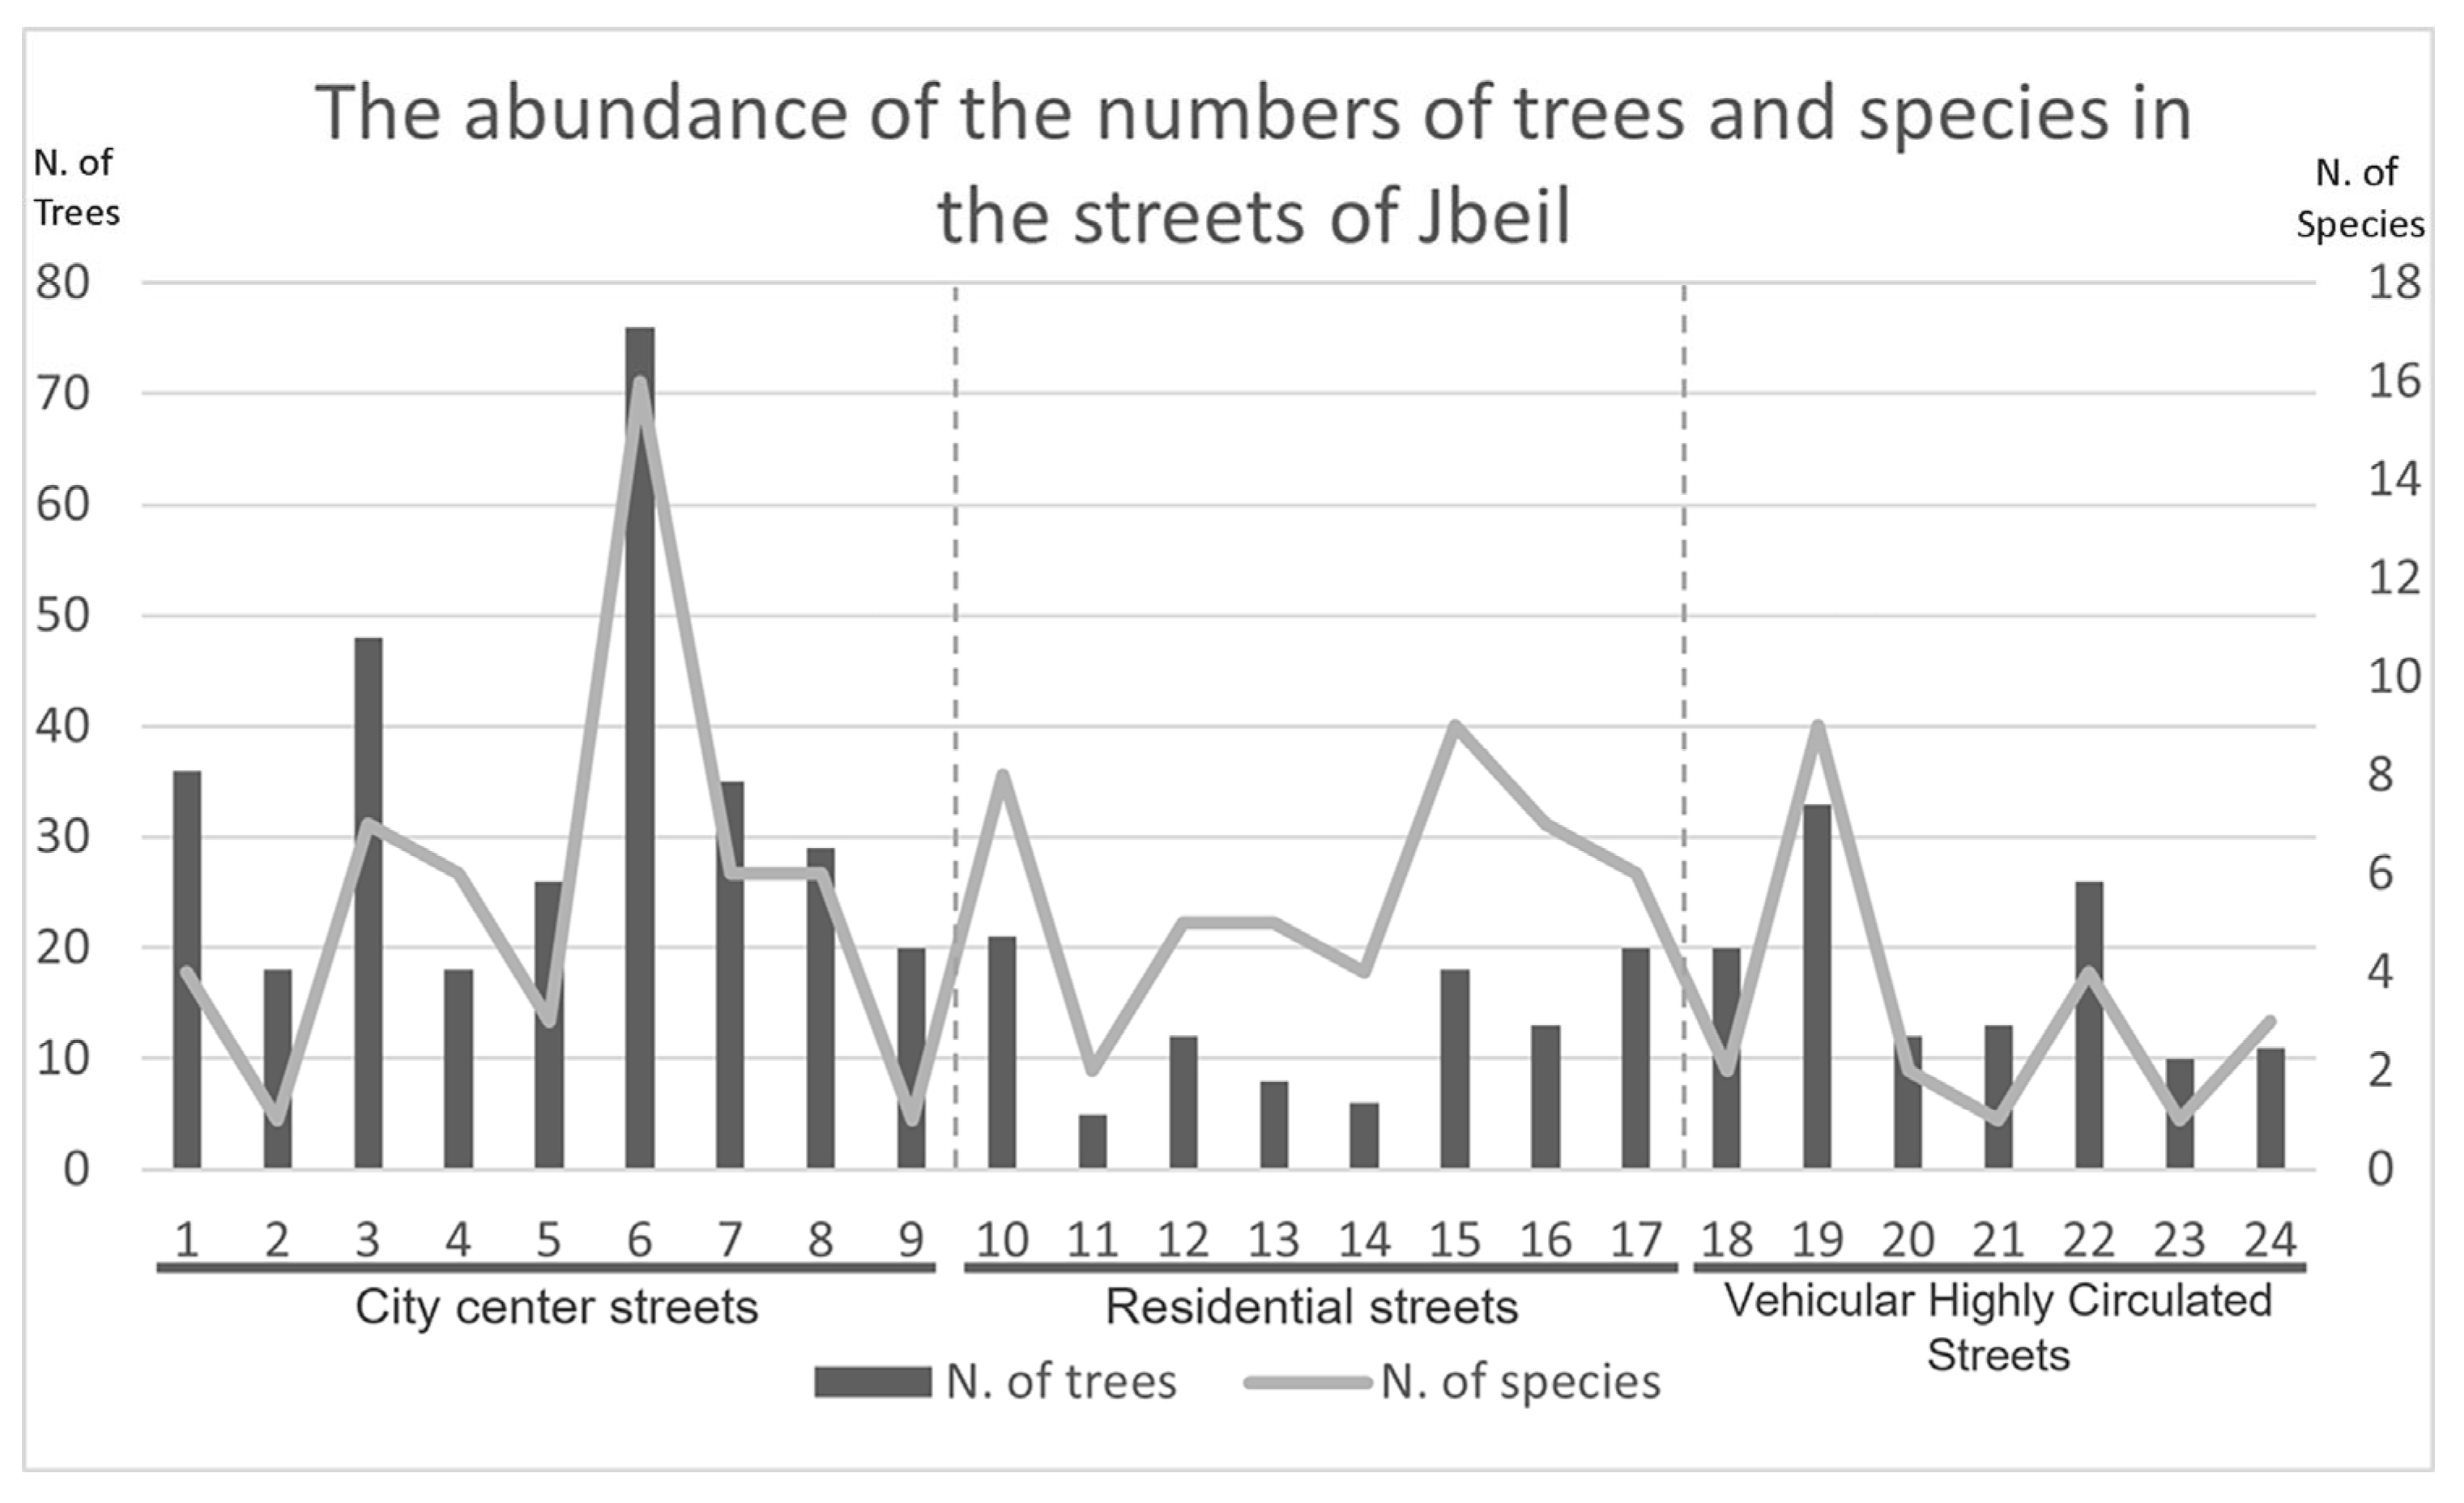
3.3. Tree Species and Composition

The forest in Byblos showed a diverse array of trees, encompassing ornamental, evergreen, and fruit varieties. We found 56 tree species present in the surveyed streets of Byblos, and of those, 17 were native to the region, such as Nerium oleander and Cupressus sempervirens, while the remaining species were non-native, including Ceiba speciosa, Jacaranda mimosifolia, and Delonix regia, among others. The diversity of the tree species generally followed the 10–20–30 rule of Santamour (1990) [34], except for Nerium oleander, which exceeded the recommended 10% to 15% threshold. The diversity of trees in the city center streets was significantly higher than those in the streets with heavy car traffic and in residential areas (Figure 7). Within the city center, the number of trees per street varied from 18 to 76, typically encompassing a range of 4 to 16 distinct species. Streets experiencing heavy traffic contained 11 to 33 trees, commonly featuring only 2 species per street. In residential zones, the tree counts per street ranged from 5 to 21, highlighting a diversity of 4 to 9 species on each street (Figure 7).

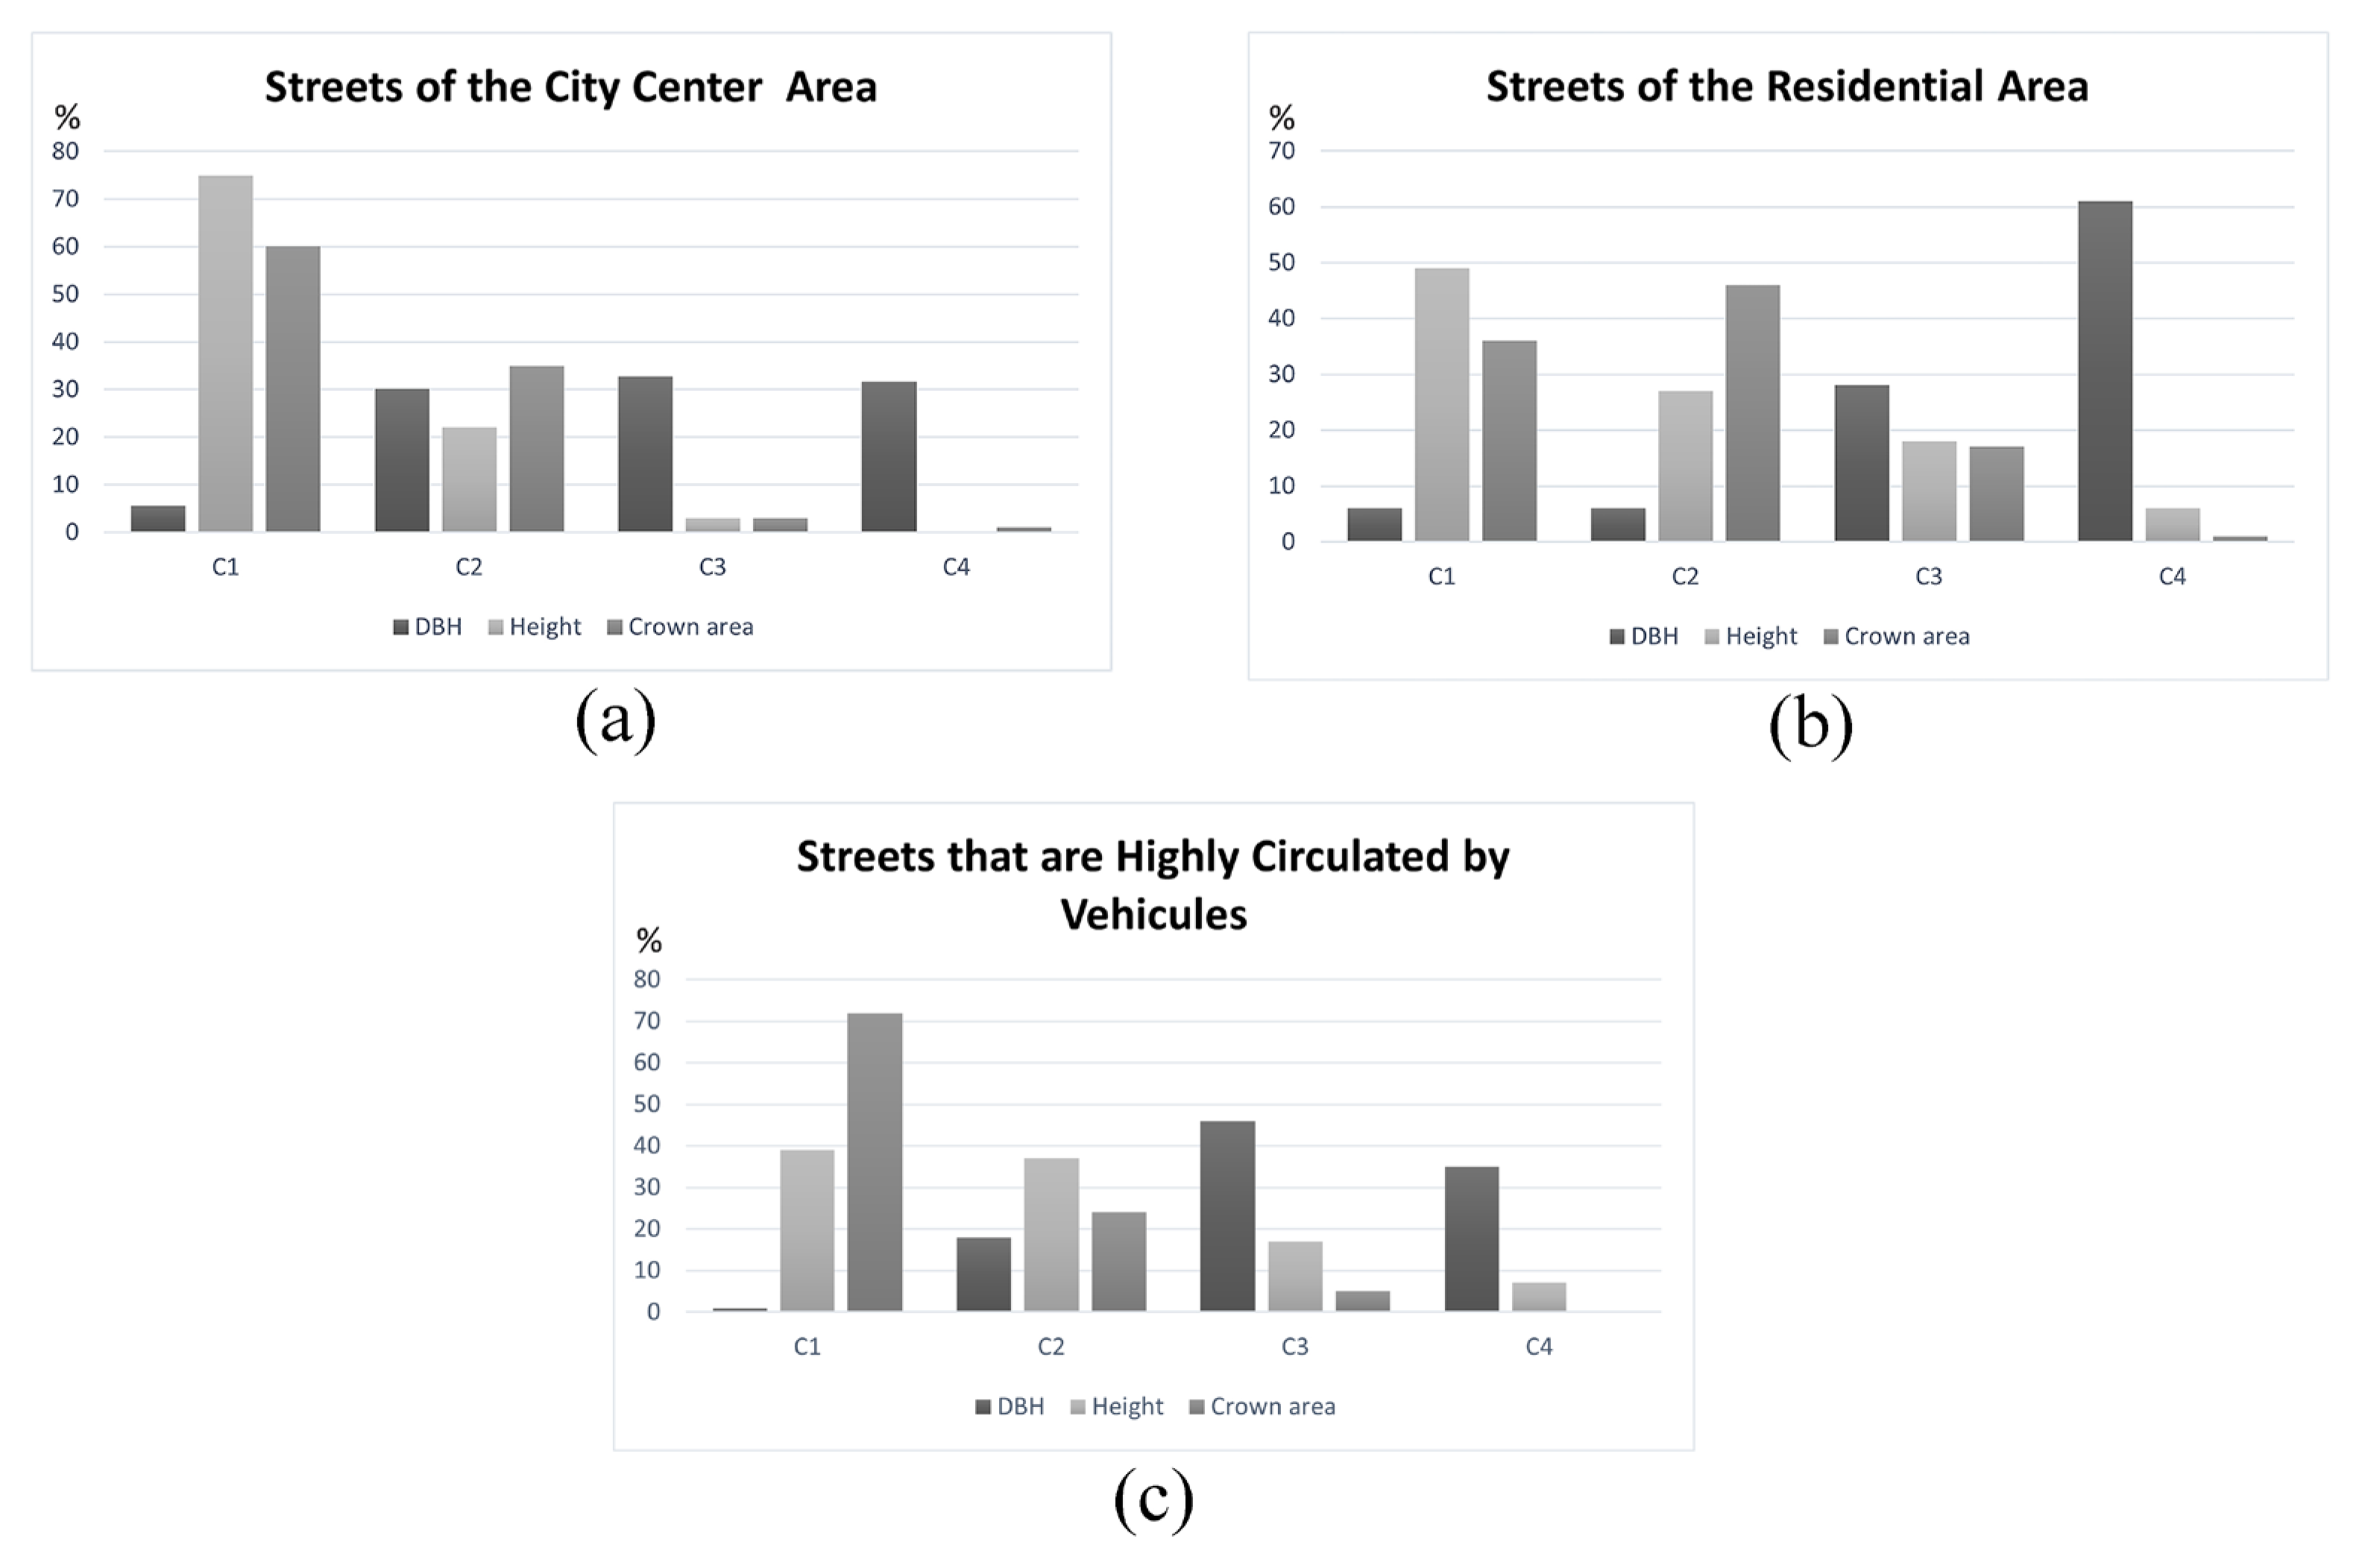
3.4. Forest Composition and Structure

The city center streets exhibited one of the narrowest ranges of diameter at breast height (DBH) values, spanning from 34.9 cm to 99 cm, with heights ranging from 4.9 m to 8.4 m, and possessed the lowest crown area. In contrast, vehicular highly circulated streets displayed the widest range of DBH values, extending from 44.5 cm to 197.5 cm. These streets showcased both the shortest and tallest tree heights, ranging from 3.5 m to 13.9 m. Additionally, vehicular highly circulated streets had the highest average crown area of 65.7 m². As for the reversed J-shaped distribution, it was found in several indicators like the height (c1: 75, c2:22,c3: 3, c40) and the crown area (c1:60, c2:35, c3:3, c4:1) in the city center; the crown area (c1:75, c2:16, c3:10, c4:0) in the highly circulated streets; and the height (c1:49, c2:27, c3:18, c4:6) in the residential streets. In all streets, the first class (c1) had the highest value, and the rest of the classes had decreasing values, respectively.
One of the distributions fit the J-shaped type—the DBH (c1:6, c2:6, c3:28, c4:61). In the residential streets, it started with a low value in c1 and started increasing until it reached its highest value in the last class, c4. The last distribution type was the inversed J-shaped, like the height (c1:39, c2:37, c3:17, c4:7) in the vehicular highly circulated streets, and in the crown of the residential area (c1:36, c2:46, c3:17, c4:1), where they start at constant values and then begin decreasing.

Classification by Classes

Figure 8 shows the percentages of different classes of DBH, height, and crown. We detected several types of distribution: approximately normal distribution, J-shaped, reversed J-shaped, and inverted J-shaped. We found a normal distribution in the DBH in the city center streets (c1:6, c2:30, c3:33, c4:32) and the DBH in the vehicular highly circulated streets (c1:1, c2:18, c3:46, c4:35), where they started with a low value, reached the highest value in the middle and then decreased.

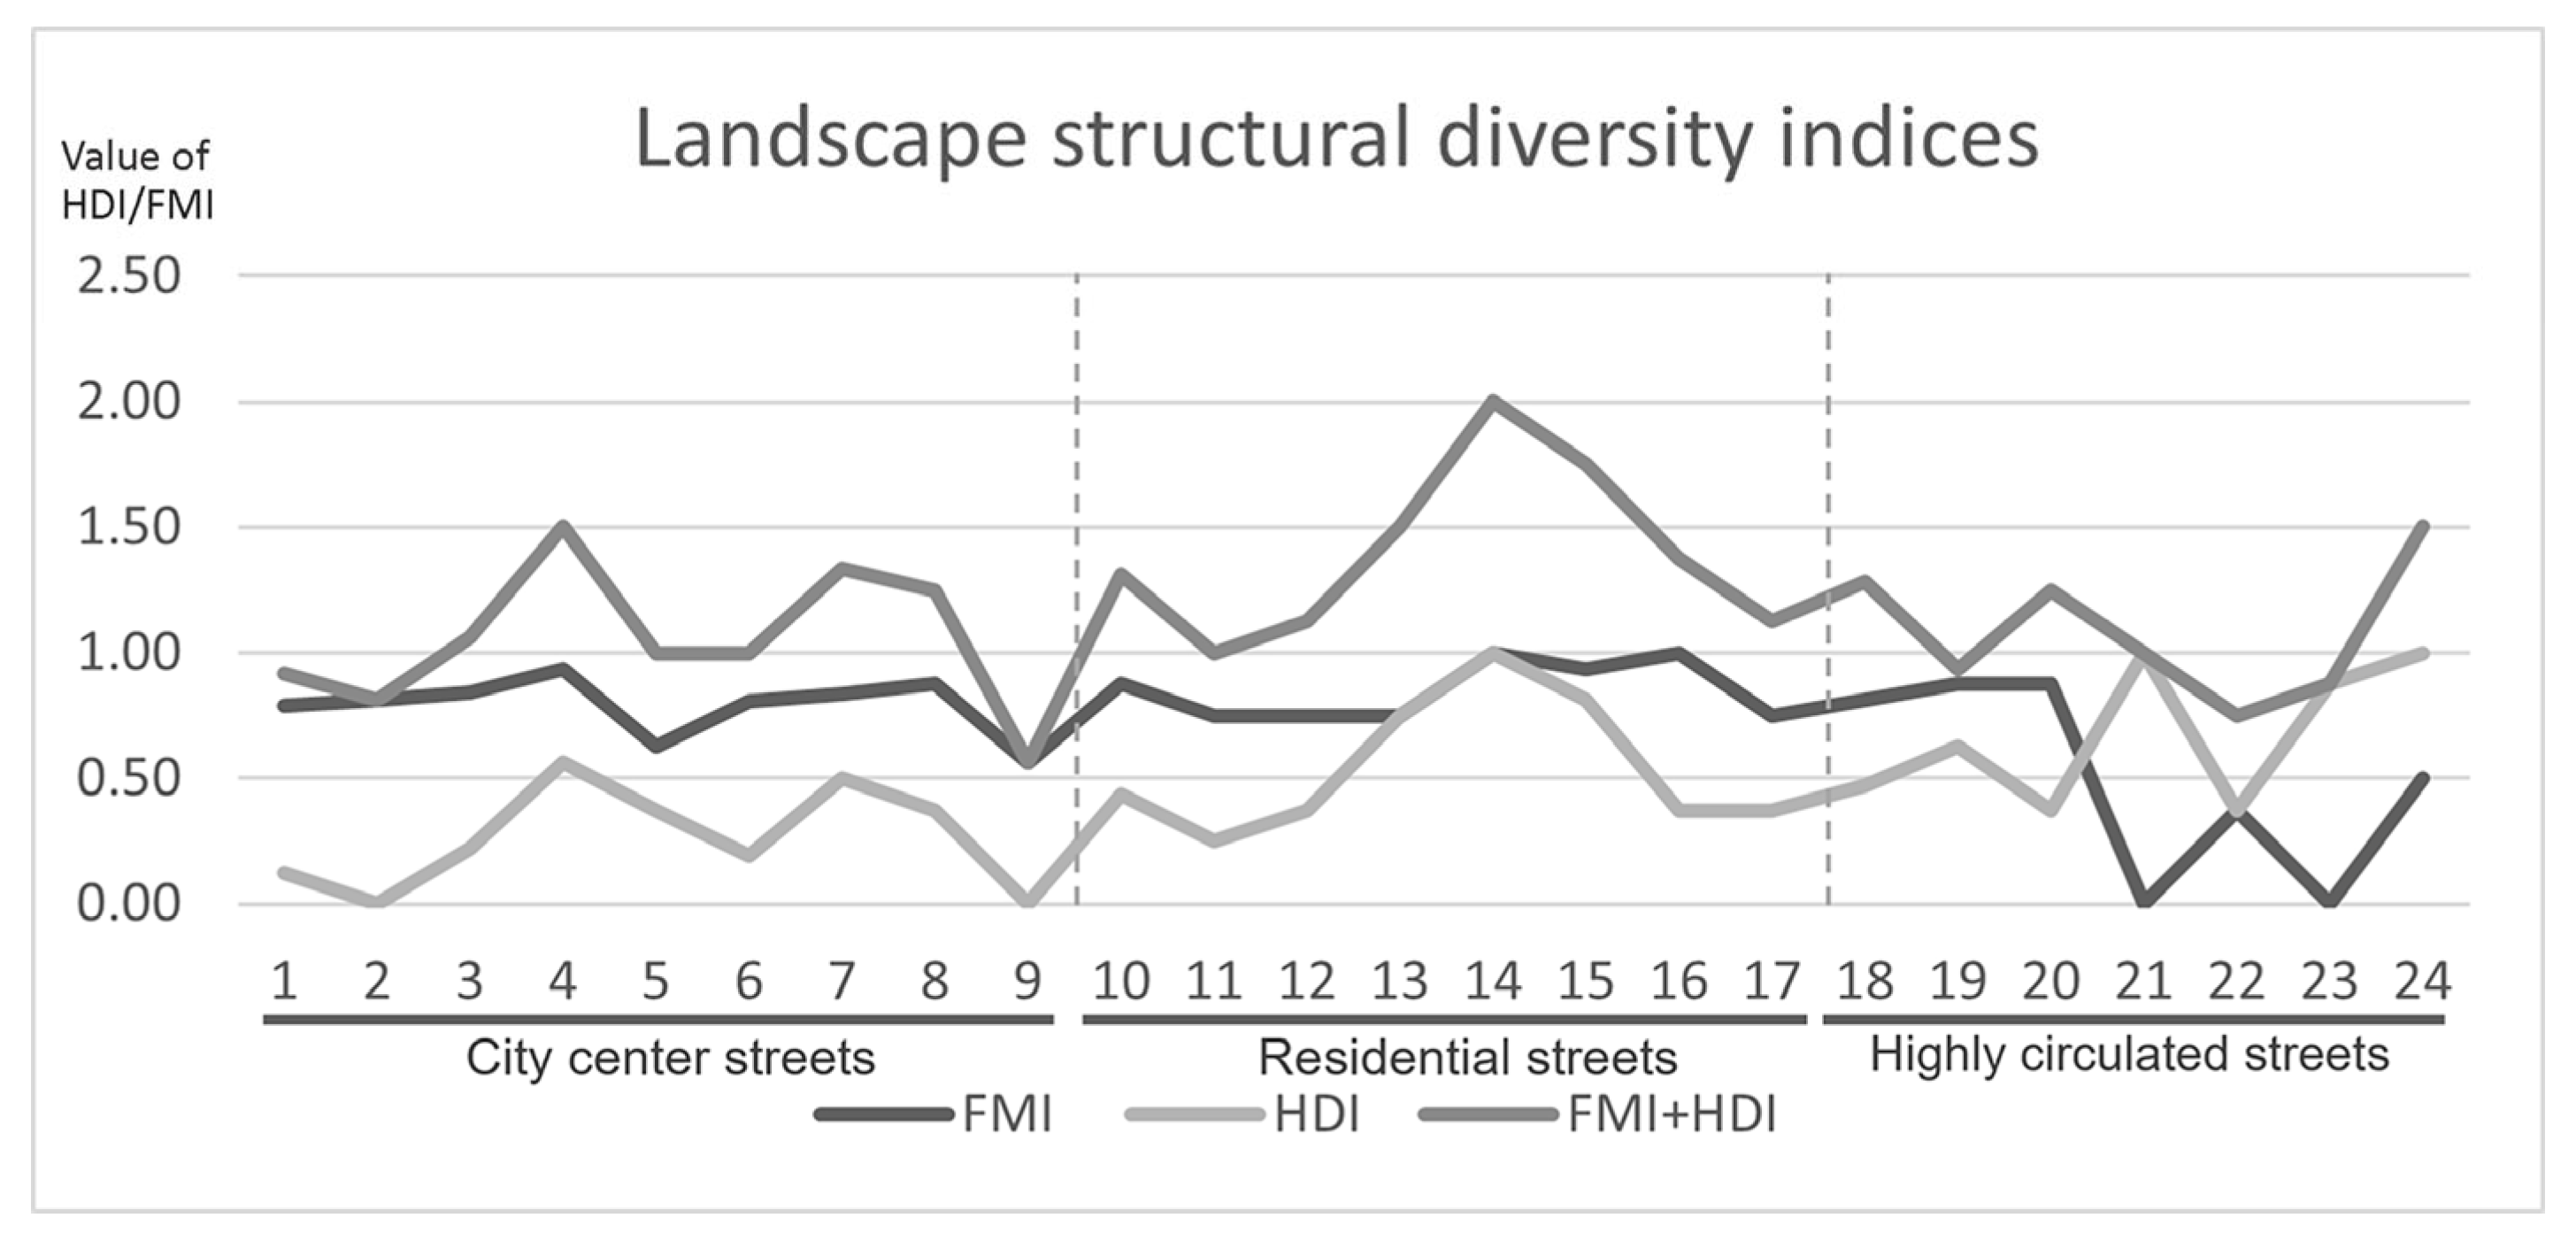
3.5. Landscape Assessment

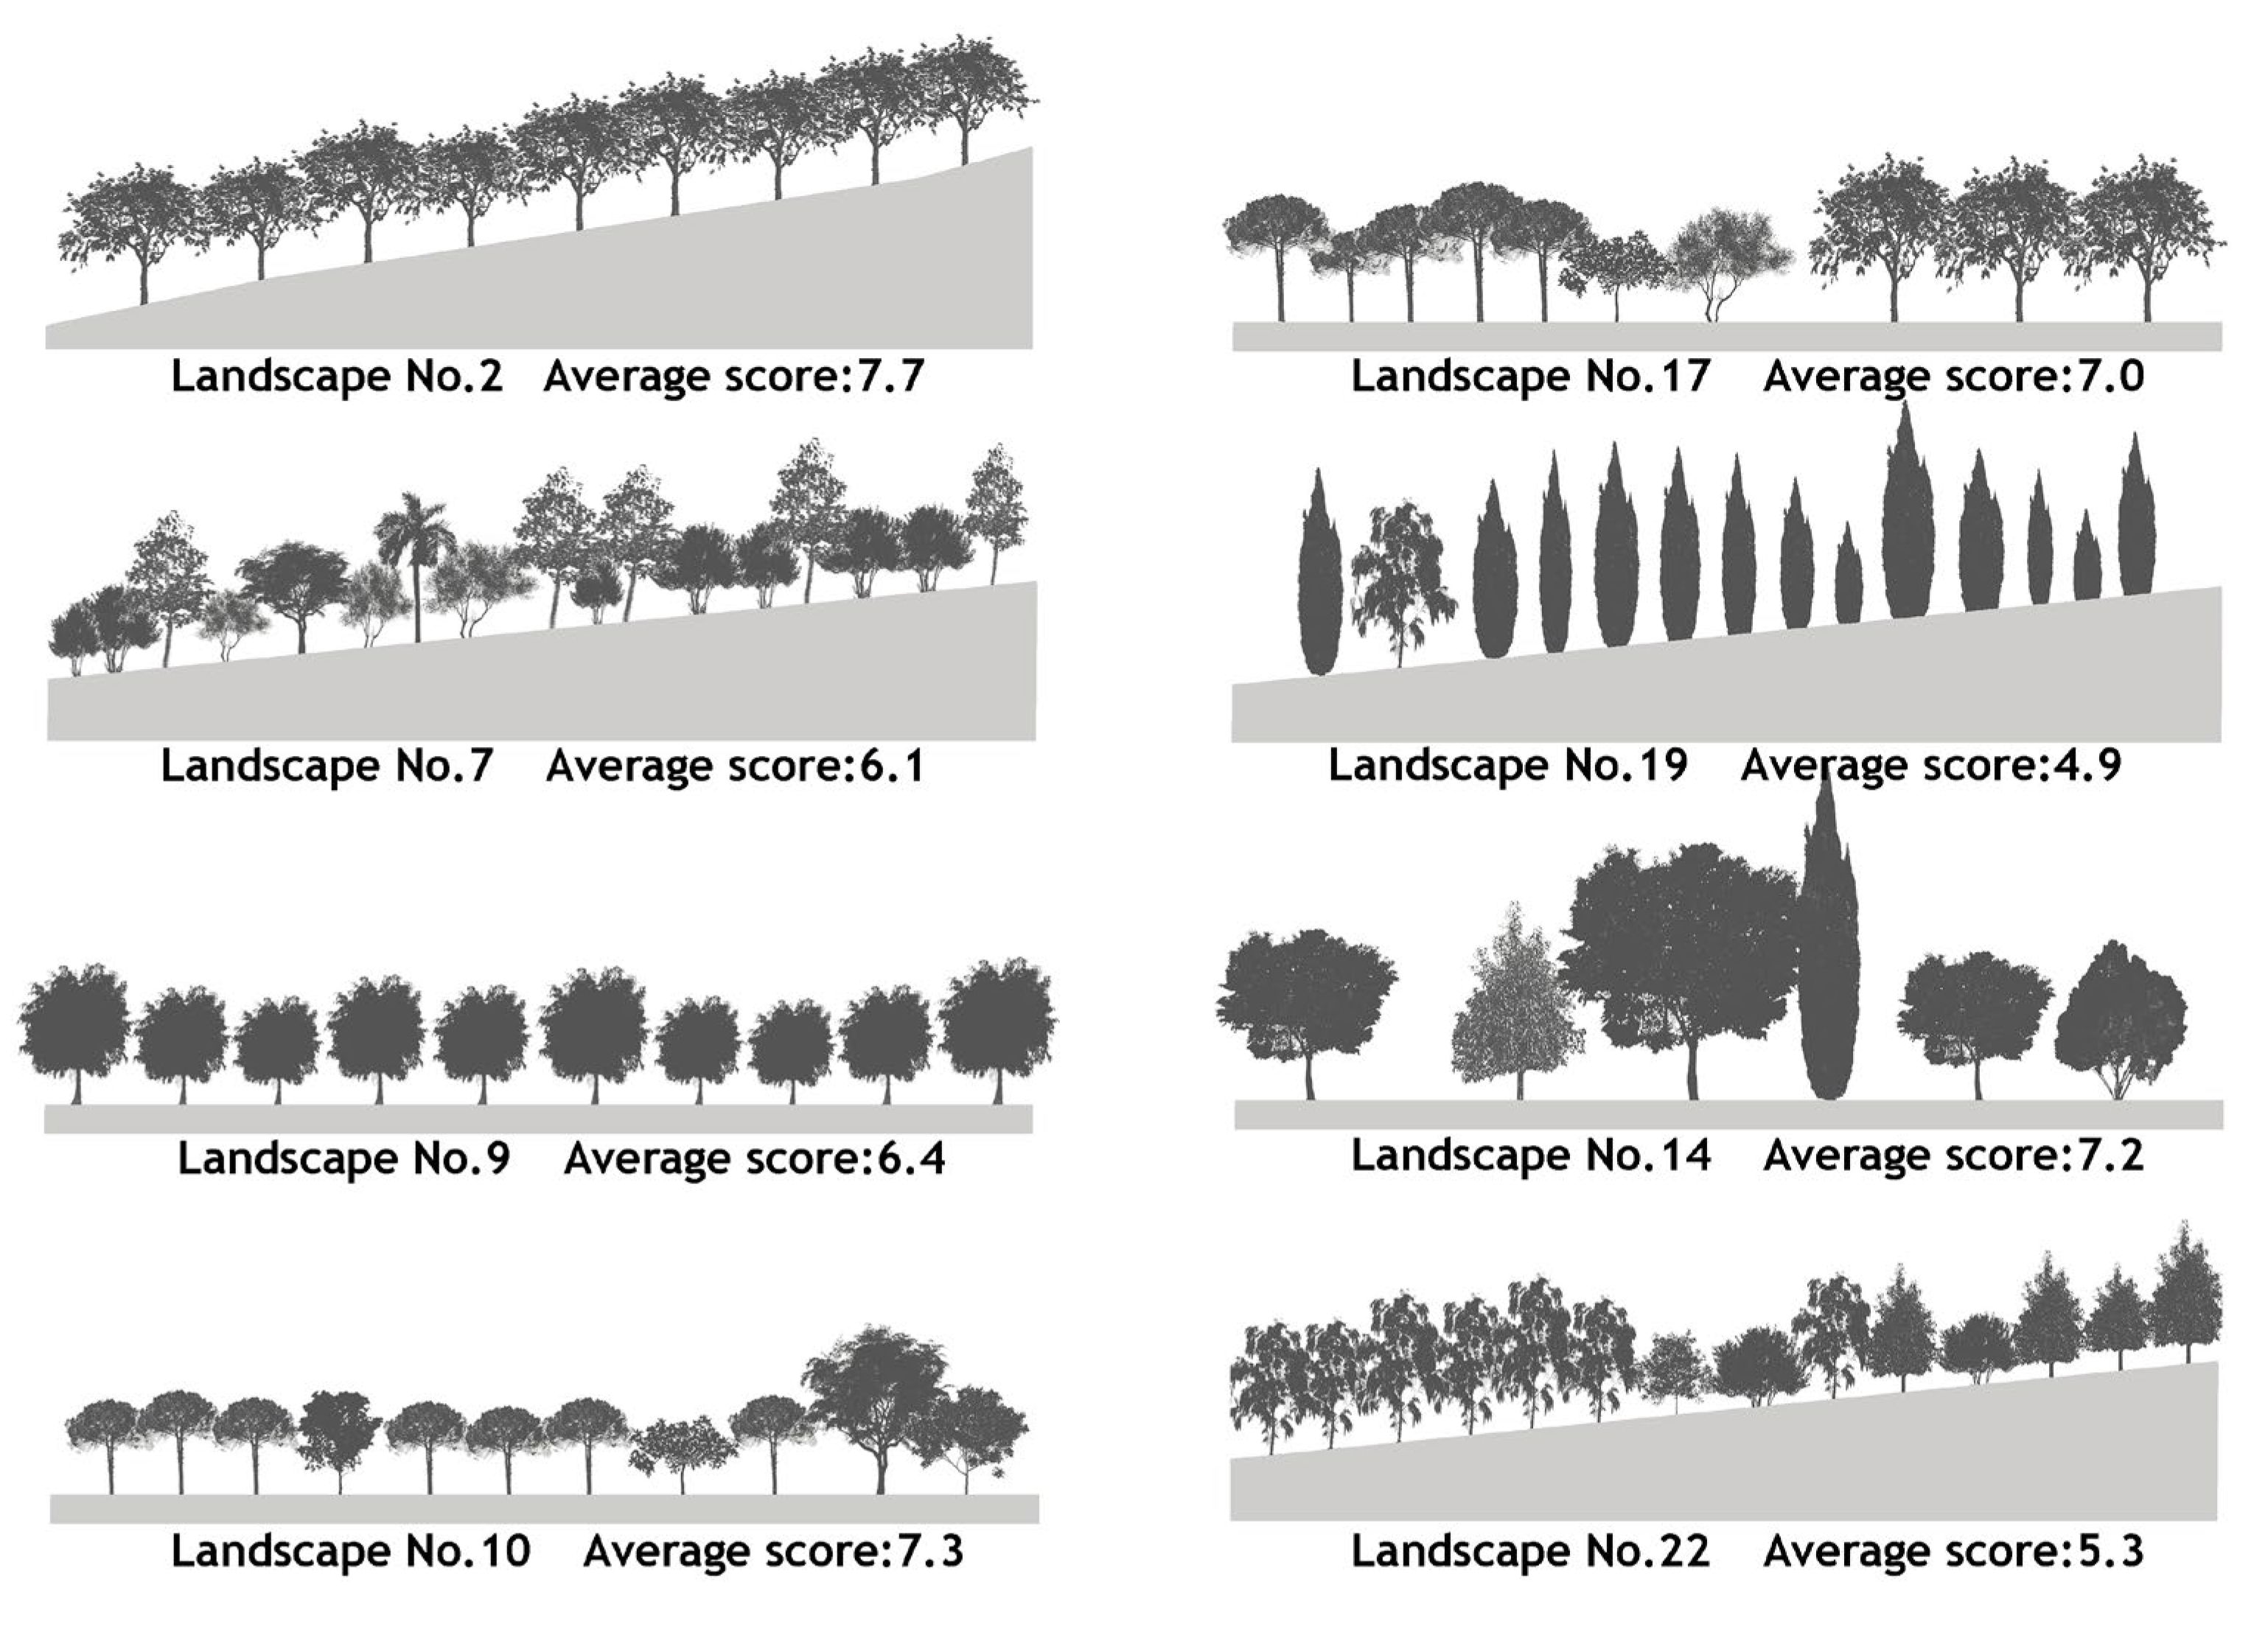
3.5.1. Silhouette and Perceptual Testing

Our analysis revealed that Landscape 14, located within the residential streets, exhibited the highest levels of both forms of the mingling index and the height dominance index. The streets of the city center demonstrated lower scores in terms of structural diversity, with most of the sampled streets exhibiting low values for the height dominance index but higher values for the form mingling index. In highly circulated areas, several streets scored poorly on the form mingling index, with some even scoring 0.5 or lower on the height dominance index (Figure 9).
The perceptual test revealed landscape silhouette values ranging from 4.9 to 7.7 (as seen in Table 3). Interestingly, landscapes with the same species had different scores. For instance, Landscape No. 19 (Figure 10), with columnar-shaped trees of varying heights, scored the lowest (4.9). Meanwhile, Landscapes No. 9, 21, and 23, with the same species but with round or irregular crowns, scored higher at 6.4, 6.5, and 6.5, respectively. Landscape No. 2, with the same species but slightly different heights and a V-shaped crown, received the highest score of 7.7.
Large trees of different species and crown shapes, like those found in Landscapes 11, 14, 20, and 24, scored between 6.4 and 7.2. On the other hand, smaller trees, like those in Landscapes 10 (7.3) and 12 (6.3), were also well-regarded by participants. Trees clustered within the same species, as seen in Landscapes 17 and 18, attained scores of 7 and 6.4, respectively. Conversely, Landscapes 7 and 8, showcasing a mixture of species and forms, received lower scores of 6.1 and 5.9. To prove a relation between the form of the trees, their height, and their silhouette scores, a Pearson correlation was applied. There was a positive correlation between the form mingling index and the silhouette perceptual scores, as well as between the height dominance index and the silhouette perceptual scores as shown in Table 4. The combination of HDI and FMI had a more pronounced impact on visual preference, showing a correlation of 0.37 with the silhouette perceptual test.

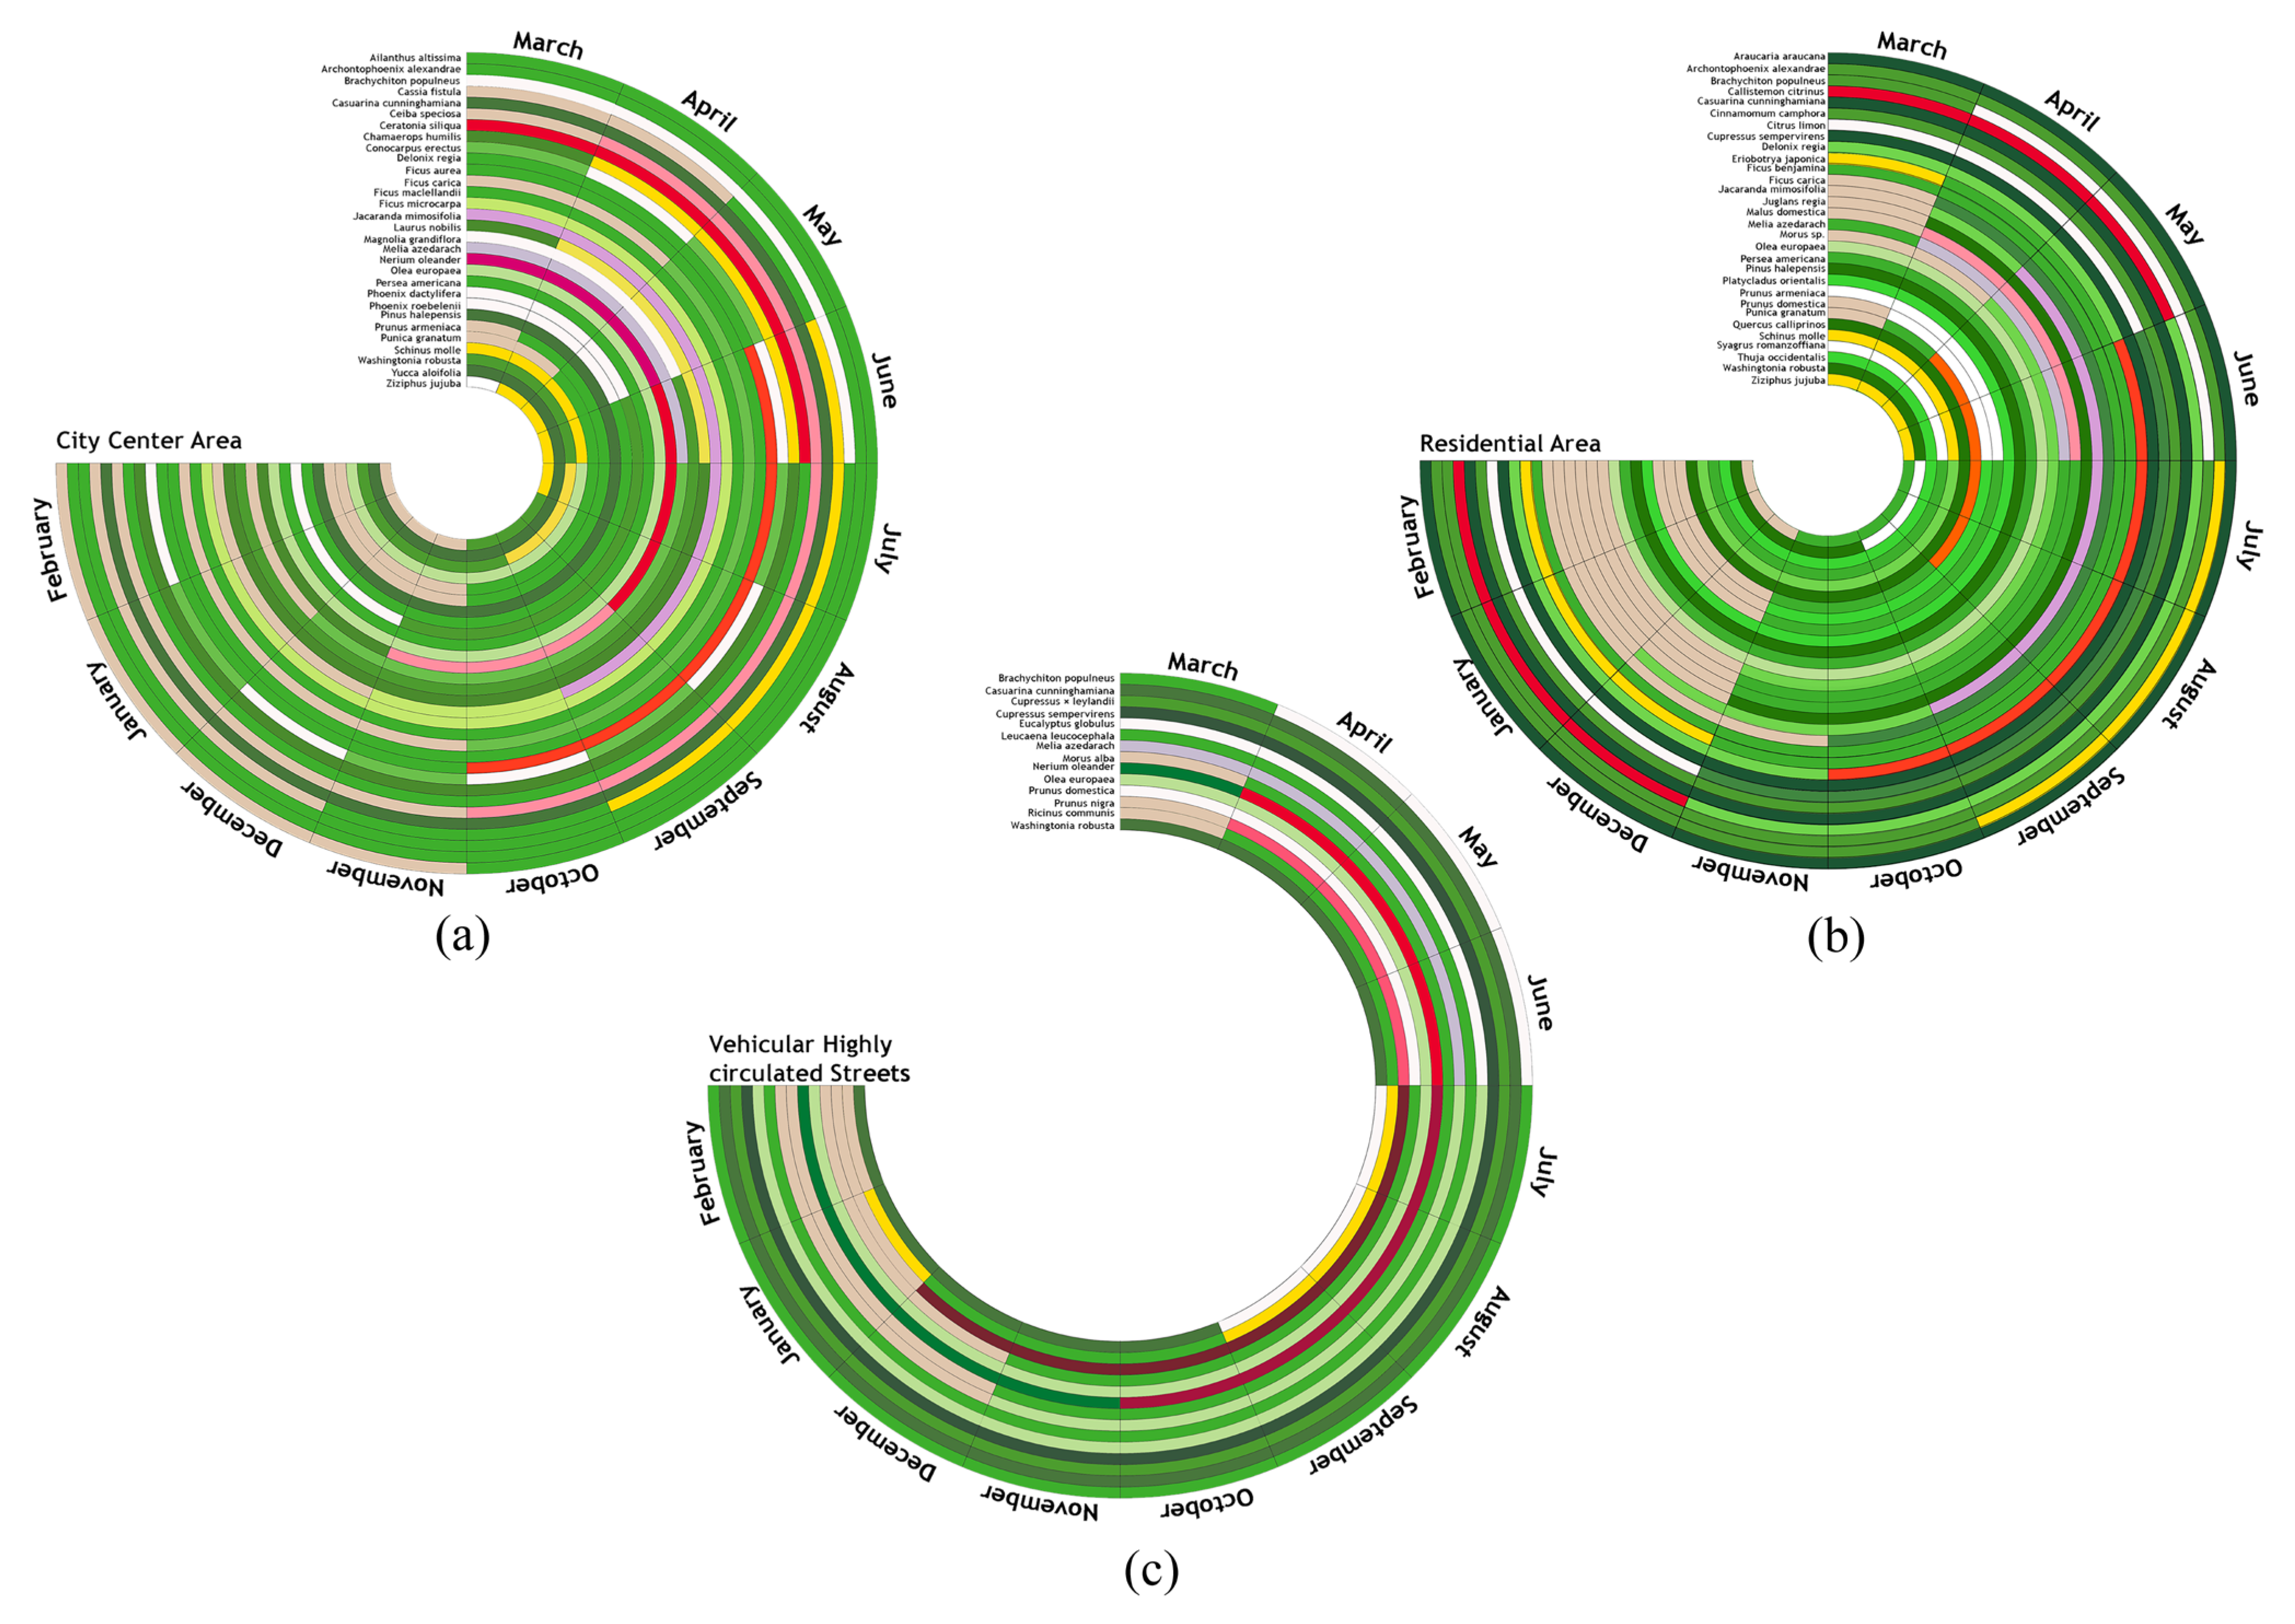
3.5.2. Blossoming Monthly Statistics

Each area’s monthly statistics are represented in Figure 11, indicating the abundance of colors in Byblos during the seasons, based on the species sampled in each street.
In residential streets, 30 distinct tree species were identified, primarily blooming in spring from mid-March to mid-June. In the city center, 30 tree species, mostly evergreen, bloom from April to August. Highly circulated streets feature only 14 tree species, mainly evergreen, with limited visibility of spring blossoming.

4. Discussion

As urbanization accelerated in Byblos City, vegetation that once facilitated permeability was supplanted by impervious surfaces [35]. This change led to insufficient drainage and heat dissipation, ultimately contributing to an increase in urban flood disasters [35]. With climate change, extreme rainfall events are becoming more frequent [36], exacerbating the problem. Some incidents related to urban floods have been reported, including in November 2017 when water filled the walkways of the old city, and in January 2019 when stormwater caused damage to the water drainage channels, resulting in financial loss [24]. Byblos still has a large green area (28%); however, it cannot act as a sponge to retain stormwater since it is located in the northeast part of the city. Byblos boasts a significant green area (28%); however, its capacity to retain stormwater is limited due to its location in the northeast part of the city. Nevertheless, when specifically considering the canopy cover, the values align with the established benchmark of 20%, as determined by UPF guidelines [1]. In many cities, the typical green infrastructure ratio hovers around 16.8% [37]. Despite this accomplishment, only 11% of the green infrastructure is situated in the city center, underscoring the need to establish green corridors that connect these smaller green spaces with the larger expanses in the north. Such an approach not only facilitates the movement of flora and fauna but also fosters increased biodiversity within the city, particularly given the current low connectivity of wooded areas [38,39].
Byblos boasts a diverse selection of tree species. It has carefully curated a mix of both native and exotic trees, with native species abundance making up 47% of the plantation—a figure in line with UPF guidelines [1]. The city center, being a prominent tourist destination, strategically incorporates specific plants like Ceiba speciosa for ornamental purposes and culturally significant species like Olea europaea and Nerium oleander, which evoke the Roman era in Byblos [40]. This deliberate selection of trees to reflect Byblos’ cultural heritage underscores the existence of a comprehensive management plan. The combination of both evergreen and deciduous species in Byblos City, both of which play a vital role in purifying the air and sequestering carbon, add visual interest to the landscape of Byblos [41,42]. Notably, the city center and residential area demonstrate nearly identical richness indices, each with thirty species of trees lining their streets. The richness indicator in this research presented a value ranging between 3.14 and 5.75, which shows good diversity compared to the richness index values of core areas in three villages in China (Guangzhou, Foshan, and Zhuhai), which demonstrated 3.27, 5.05, and 4.69, respectively [27]. Though Alvey [43] reported that, traditionally, urban forest areas have been regarded as locations of low biodiversity that are dominated by non-native species, evidence from this study, as well as from published information, suggests that urban and suburban areas can contain relatively high levels of biodiversity [44,45].
This suggests a well-balanced composition, leading to a stable and resilient urban forest that is not only richer in fauna but also provides residents with a broader array of benefits more effectively [46]. This diversity serves to minimize the risk of species-specific pests and diseases, making it a valuable asset [47]. However, thoroughfares with heavy vehicular traffic tend to exhibit lower species diversity and richness indices. This phenomenon stems from the prevalent practice of planting the same species along highways for visual consistency and ease of maintenance, resulting in a monotonous landscape [48]. Increasing diversity in vehicular roads is crucial, as a variety of plant species can offer a range of ecosystem benefits [48]. To achieve this, it is recommended to plant more tree species, particularly those that are native and can provide significant benefits such as pollination, erosion control, and soil stabilization. This approach can also create pathways that connect isolated habitats, promoting gene flow and improving population connectivity for plants, animals, and seeds [48]. According to studies conducted by Modlingerová et al. (2012) [49] and Bandara and Dissanayake (2021) [50], trees along roadways are expected to endure environmental pollution. Therefore, it is important to select appropriate types of trees that can reduce pollution and absorb noise.
The distribution of tree diameters (DBH), heights, and crown areas within the city center streets exhibits a normal distribution J shape, which is considered the most stable pattern for urban forests. The presence of a significant number of trees in medium-sized classes contributes to maintaining community stability, while the presence of both small- and large-sized classes ensures a balanced transition from younger to older trees [51]. Residential and vehicular highly circulated streets exhibit an abundance of medium and large diameters. The prevalence of Olea europaea and Pinus halepensis in the residential area can account for the high abundance of trees in the larger diameter at breast height (DBH) classes. The low percentage of trees falling into the small DBH classes suggests a lack of initiative to introduce new trees to these streets. However, it is important to note that one of the primary objectives of urban and peri-urban forests (UPFs) is to promote the physical and emotional well-being of residents [52]. Urban forests with elevated rates in large DBH classes can also support local livelihoods, improve community cohesiveness, and strengthen urban dwellers’ connection to nature, as well as improve it.
The city center streets feature a moderate level of structural diversity, displaying various shapes and minimal variations in height. This diversity primarily stems from the types of trees planted rather than their growth patterns. On the contrary, residential streets exhibit high levels of structural diversity, largely influenced by the shapes of the trees and, to a lesser extent, their heights. Conversely, vehicular streets tend to have less structural diversity as they are often dominated by similarly sized trees, with variations in height being the main factor contributing to any observed diversity.
The significance of the largest blossoming season in the central area lies in its ability to attract people and visitors to the heart of the city, where most heritage sites and attractions are located. The colorful spaces and variety of species can have a positive impact on visitors’ perceptions; therefore, they can generate feelings of enjoyment, self-esteem, and motivation, driving them to revisit the city [53]. The residential area has more deciduous trees than evergreen ones, creating a stronger connection between residents and nature. Warm colors in this area can generate feelings of comfort, power, and passion [54]. Residents can witness the natural cycle of the trees, experiencing the changing colors, falling leaves, and new growth in the spring. Highly circulated streets are mainly planted with evergreen species, providing drivers with pleasant scenery and a sense of security while also reducing driving-related stress [55].
The findings from the perceptual tests align with previous research on the impact of tree shapes on preference, which consistently demonstrates a preference for broad canopies, including spreading and globular canopies. This is likely due to the perception of spreading canopies providing protection [56]. Moreover, numerous studies have compared the shapes of trees and found that people prefer a spreading canopy over a round shape, while the conical shape is the least favored [56,57]. Our analysis indicates that the shape of the tree has a greater influence.

4.1. Recommendations

Based on the results gained from our multi-faceted approach, this study presents actionable recommendations to address key issues concerning Byblos’ urban landscape. In particular, the following recommendations aim to enhance the city’s green infrastructure, leading to improved environmental quality and resident well-being:
-
The city of Byblos can enhance its canopy cover to a minimum of 30% by connecting the wooded lands in the north of the city to the smaller patches distributed throughout. The incorporation of man-made urban corridors or roads can increase the city’s biodiversity and resilience by connecting green spaces within the city.
-
To improve stormwater management, the city can implement new trees of medium size along the streets. These trees can aid in retaining water from drainage channels by transpiration and interception, reducing throughfall, and increasing infiltration.
-
New implementation projects ought to be carried out in residential and highly circulated areas, with a selection of trees that fit the intended function. The trees planted should ideally reduce pollution and absorb noise while tolerating environmental difficulties. A mix of medium and small trees should be utilized to ensure long-term sustainable UPFs.
-
A management plan that includes residential streets, not just tourist ones, should be applied to enhance and maintain tree health in Byblos. Residential streets have a significant impact on urban dwellers’ health and well-being, and therefore, the 3–30–300 rule could be applied [58]. This rule suggests that every resident should be able to see three trees from their house, each neighborhood should have 30% canopy cover, and the nearest high-quality green public space should be 300 m away.
-
Encouraging eco-roofs has numerous benefits. For one, it can offer green spaces for building residents while also being open to public use through collaboration between private owners and the municipality of Byblos. This initiative can significantly increase public green spaces in residential areas of the city. Eco-roofs can form a steppingstone for connectivity in Byblos while increasing its canopy cover. They can also reduce the flow of stormwater. Eco-roofs can be connected to green spaces or the base of trees where the water would be retained by the tree, and not added to the drainage system.

4.2. Study Limitations

The study acknowledges a limitation regarding the number of sampled streets. While a more extensive sample could have enhanced the study’s external validity, constraints in resources and time dictated the final sample size. The findings should be interpreted within the context of this limitation, recognizing the potential impact on generalizability.
The present study primarily focused on tree silhouettes, regardless of their specific placement on different types of streets. However, it was inherently limited in terms of the depth of contextual information gathered. As a result, certain nuanced factors associated with street and building contexts influencing residents’ preferences may not have been fully explored.

5. Conclusions

The outcome of this research has established foundational data on urban and peri-urban forests within Byblos City. This information can serve as a basis for developing a comprehensive tree species database for the region. The research has also highlighted the potential of urban and peri-urban forests in conserving biodiversity and offering crucial products and services for environmental management, economic empowerment, and social welfare within the community. An improvement in the connectivity between the rural part in the north and the rest of the city and an increase in biodiversity based on a specialized selection of trees is required. At the landscape level, the diverse scenery in Byblos, characterized by a variety of blooming colors and shapes, offers valuable insights for future studies focused on visually guiding trees based on their silhouette values and perception. This exploration could potentially lead to the establishment of guidelines for selecting and placing trees based on their visual characteristics. Additionally, future research could explore connectivity strategies aimed at enhancing the linkages between pocket green spaces, especially in urban areas where grey infrastructure dominates the landscape. These strategies could facilitate biodiversity restoration and contribute to the overall environmental quality of urban settings.

Author Contributions

Conceptualization, M.H. and V.D.; methodology, M.H. and V.D.; software, M.H.; formal analysis, M.H.; investigation, M.H.; data curation, M.H.; writing—original draft preparation, M.H., V.D. and A.R.; writing—review and editing, M.H., V.D., G.K. and A.R. All authors have read and agreed to the published version of the manuscript.

Funding

This research received no external funding.

Data Availability Statement

The data that support the findings of this study are available from the corresponding author upon reasonable request.

Acknowledgments

We thank the two anonymous reviewers for their constructive feedback, which helped us improve the quality of our paper.

Conflicts of Interest

The authors declare no conflicts of interest.

References

  1. Salbitano, F.; Borelli, S.; Conigliaro, M.; Chen, Y.; FAO. Guidelines on Urban and Peri-Urban Forestry; FAO Forestry Paper No. 178; Food and Agriculture Organization of the United Nations: Rome, Italy, 2016; Available online: https://www.fao.org/3/i6210e/i6210e.pdf (accessed on 14 April 2023).
  2. Georgi, J.; Zigkiris, S.; Ftika, Z.; Konstantinidou, E. Management and protection of peri-urban forests of three towns in Greece. In Proceedings of the Fourth International Conference on Remote Sensing and Geoinformation of the Environment (RSCy2016), Paphos, Cyprus, 4–8 April 2016; Volume 9688, p. 96881. [Google Scholar] [CrossRef]
  3. Abd El Karim, A.; Alogayell, H.M.; Alkadi, I.I.; Youssef, I. Mapping of GIS-land use suitability in the rural–urban continuum between Ar Riyadh and Al Kharj Cities, KSA based on the integrating GIS Multi Criteria Decision Analysis and Analytic Hierarchy Process. Environments 2020, 7, 75. Available online: https://www.mdpi.com/840318 (accessed on 11 April 2023). [CrossRef]
  4. Weissert, L.F.; Salmond, J.A.; Schwendenmann, L. A review of the current progress in quantifying the potential of urban forests to mitigate urban CO2 emissions. Urban Clim. 2014, 8, 100–125. [Google Scholar] [CrossRef]
  5. Cueva, J.; Yakouchenkova, I.A.; Fröhlich, K.; Dermann, A.F.; Dermann, F.; Köhler, M.; Grossmann, J.; Meier, W.; Bauhus, J.; Schröder, D.; et al. Synergies and trade-offs in ecosystem services from urban and peri urban forests and their implication to sustainable city design and planning. Sustain. Cities Soc. 2022, 82, 103903. [Google Scholar] [CrossRef]
  6. Russo, A.; Cirella, G.T. Urban Sustainability: Integrating Ecology in City Design and Planning. In Sustainable Human—Nature Relations: Environmental Scholarship, Economic Evaluation, Urban Strategies; Springer: Singapore, 2020; pp. 187–204. [Google Scholar] [CrossRef]
  7. Grey, G.W.; Deneke, F.J. Urban Forestry; Wiley: New York, NY, USA, 1986; 299p. [Google Scholar]
  8. Konijnendijk, C.C.; Sadio, S.; Randrup, T.B.; Schipperijn, J. Urban and peri-urban forestry in a development context—Strategy and implementation. J. Arboric. 2004, 30, 269–275. [Google Scholar] [CrossRef]
  9. Escobedo, F.J.; Kroeger, T.; Wagner, J.E. Urban forests and pollution mitigation: Analyzing ecosystem services and disservices. Environ. Pollut. 2011, 159, 2078–2087. [Google Scholar] [CrossRef] [PubMed]
  10. Roeland, S.; Moretti, M.; Amorim, J.H.; Branquinho, C.; Fares, S.; Morelli, F.; Niinemets, Ü.; Paoletti, E.; Pinho, P.; Sgrigna, G.; et al. Towards an integrative approach to evaluate the environmental ecosystem services provided by urban forest. J. For. Res. 2019, 30, 1981–1996. [Google Scholar] [CrossRef]
  11. Russo, A.; Escobedo, F.J.; Zerbe, S. Quantifying the local-scale ecosystem services provided by urban treed streetscapes in Bolzano, Italy. AIMS Environ. Sci. 2016, 3, 58–76. [Google Scholar] [CrossRef]
  12. Wolf, K.L.; Lam, S.T.; McKeen, J.K.; Richardson, G.R.A.; van den Bosch, M.; Bardekjian, A.C. Urban Trees and Human Health: A Scoping Review. Int. J. Environ. Res. Public Health 2020, 17, 4371. [Google Scholar] [CrossRef] [PubMed]
  13. Jones, B.A. Planting urban trees to improve quality of life? The life satisfaction impacts of urban afforestation. For. Policy Econ. 2021, 125, 102408. [Google Scholar] [CrossRef]
  14. Thompson, E.; Herian, M.; Rosenbaum, D. The Economic Footprint and Quality-of-Life Benefits of Urban Forestry in the United States. 2021. Available online: https://www.arborday.org/urban-forestry-economic/downloads/complete-report-findings.pdf (accessed on 25 March 2024).
  15. Cirella, G.T.; Russo, A.; Benassi, F.; Czermański, E.; Goncharuk, A.G.; Oniszczuk-Jastrzabek, A. Energy Re-Shift for an Urbanizing World. Energies 2021, 14, 5516. [Google Scholar] [CrossRef]
  16. McPherson, E.G.; Simpson, J.R. Potential energy savings in buildings by an urban tree planting programme in California. Urban For. Urban Green. 2003, 2, 73–86. [Google Scholar] [CrossRef]
  17. Barona, C.O.; Eleuterio, A.A.; Vasquez, A.; Devisscher, T.; Baptista, M.D.; Dobbs, C.; Orozco-Aguilar, L.; Meléndez-Ackerman, E. Views of government and non-government actors on urban forest management and governance in ten Latin-American capital cities. Land Use Policy 2023, 129, 106635. [Google Scholar] [CrossRef]
  18. Borghesi, S.; Ticci, E.; Climate change in the MENA region: Environmental risks, socioeconomic effects and policy challenges for the future. MED. 2019, pp. 289–292. Available online: https://www.iemed.org/publication/climate-change-in-the-mena-region-environmental-risks-socioeconomic-effects-and-policy-challenges-for-the-future/ (accessed on 10 May 2023).
  19. Abumoghli, I.; Goncalves, A. Environmental Challenges in the MENA Region. Available online: https://wedocs.unep.org/20.500.11822/31645. (accessed on 10 May 2023).
  20. Saudi Vision 2030. Green Riyadh. Available online: https://www.vision2030.gov.sa/en/projects/green-riyadh/ (accessed on 7 May 2023).
  21. Ostoić, S.K.; Salbitano, F.; Borelli, S.; Verlič, A. Urban forest research in the Mediterranean: A systematic review. Urban For. Urban Green. 2018, 31, 185–196. [Google Scholar] [CrossRef]
  22. National Urban Policies Program in Lebanon, Diagnosis Report|UN-Habitat. Available online: https://unhabitat.org/national-urban-policies-programme-in-lebanon-diagnosis-report (accessed on 10 May 2023).
  23. UNDP. Climate-Proofing Lebanon’s Development Plans. Beirut, Lebanon. 2021. Available online: https://climatechange.moe.gov.lb/viewfile.aspx?id=323 (accessed on 12 May 2023).
  24. ARUP. Resilient Byblos Connecting with our Past, Creating Our Future. 2016. Available online: https://www.arup.com/perspectives/publications/research/section/resilient-byblos# (accessed on 19 May 2023).
  25. Mark, J.J. Byblos. World History Encyclopedia. 2009. Available online: https://www.worldhistory.org/Byblos/ (accessed on 19 May 2023).
  26. Najjar M.; Ortais C.; Piaalucha D.; Zerbib L. Byblos Toward an Inclusive City. 2017. Available online: https://resilientcitiesnetwork.org/byblos/ (accessed on 1 May 2023).
  27. National Council for Scientific Research – Lebanon (CNRS). Land Use Land Cover Maps of Byblos Lebanon. 2022.
  28. Lande, R. Statistics and partitioning of species diversity, and similarity among multiple communities. Oikos 1996, 76, 5–13. [Google Scholar] [CrossRef]
  29. Gotelli, N.J.; Colwell, R.K. Estimating species richness. Biol. Divers. Front. Measure. Assess. 2011, 12, 39–54. [Google Scholar]
  30. Zhao, Q.; Xu, D.; Qian, W.; Hu, R.; Chen, X.; Tang, H.; Zhang, C. Ecological and Landscape Perspectives on Urban Forest Planning and Construction: A Case Study in Guangdong-Hong Kong Macao Greater Bay Area of China. Front. Sustain. Cities 2020, 2, 44. [Google Scholar] [CrossRef]
  31. Aguirre, O.; Hui, G.; Gadow, K.V.; Jime´nez, J. An analysis of spatial forest structure using neighbourhood-based variables. Ecol. Manag. 2003, 183, 137–145. [Google Scholar] [CrossRef]
  32. Ozkan, U.Y.; Ozdemir, I. Assessment of landscape silhouette value in urban forests based on structural diversity indices. Int. J. Environ. Sci. Technol. 2015, 12, 3971–3980. [Google Scholar] [CrossRef]
  33. Müderrisoğlu, H.; Eroğlu, E.; Özkan, Ş.; Ak, K. Visual perception of tree forms. Build Env. 2006, 41, 796–806. [Google Scholar] [CrossRef]
  34. Santamour, F.S., Jr. Trees for urban planting: Diversity, uniformity, and common sense. In Proceedings of the 7th Conference Metropolitan Tree Improvement Alliance (METRIA), Lisle, IL, USA, 11–12 June 1990; Volume 7, pp. 57–65. [Google Scholar]
  35. Walsh, C.J.; Fletcher, T.D.; Burns, M.J. Urban stormwater runoff: A new class of environmental flow problem. PLoS ONE 2012, 7, e45814. [Google Scholar] [CrossRef]
  36. Guan, X.; Wang, J.; Xiao, F. Sponge city strategy and application of pavement materials in sponge city. J. Clean. Prod. 2021, 303, 127022. [Google Scholar] [CrossRef]
  37. Forestry Commission. National Forest Inventory Report – Tree Cover outside Woodland in Great Britain. 2017. Available online: https://www.forestresearch.gov.uk/tools-and-resources/national-forest-inventory/trees-outside-woodland-tow/ (accessed on 26 August 2023).
  38. Heidt, V.; Neef, M. Benefits of Urban Green Space for Improving Urban Climate. In Ecology, Planning, and Management of Urban Forests; Carreiro, M.M., Song, Y.C., Wu, J., Eds.; Springer: New York, NY, USA, 2008. [Google Scholar] [CrossRef]
  39. BCN. Barcelona Green Infrastructure and Biodiversity Plan 2020. 2013. Available online: https://climate-adapt.eea.europa.eu/en/metadata/case-studies/barcelona-trees-tempering-the-mediterranean-city-climate/11302639.pdf (accessed on 7 April 2023).
  40. Fărcaş, C.P.; Cristea, V.; Fărcaş, S.; Ursu, T.M.; Roman, A. The symbolism of garden and orchard plants and their representation in paintings (I). Contrib. Bot. 2015, 50, 189–200. [Google Scholar]
  41. Gratani, L. Understanding the Benefits from Green Areas in Rome: The Role of Evergreen and Deciduous Species in Carbon Dioxide Sequestration Capability. Am. J. Plant Sci. 2020, 11, 1307–1318. [Google Scholar] [CrossRef]
  42. Lu, C.; Kotze, D.J.; Setälä, H.M. Evergreen trees stimulate carbon accumulation in urban soils via high root production and slow litter decomposition. Sci. Total Environ. 2021, 774, 145129. [Google Scholar] [CrossRef] [PubMed]
  43. Alvey, A.A. Promoting and preserving biodiversity in the urban forest. Urban For. Urban Green. 2006, 5, 195–201. [Google Scholar] [CrossRef]
  44. Cornelis, J.; Hermy, M. Biodiversity relationships in urban and suburban parks in Flanders. Landsc. Urban Plan. 2004, 69, 385–401. [Google Scholar] [CrossRef]
  45. Kühn, I.; Brandl, R.; Klotz, S. The flora of German cities is naturally species rich. Evol. Ecol. Res. 2004, 6, 749–764. [Google Scholar]
  46. Cowett, F.D.; Bassuk, N. Street tree diversity in three northeastern US states. Arboric. Urban For. 2017, 43, 1–14. Available online: https://www.researchgate.net/publication/312231638_Street_Tree_Diversity_in_Three_Northeastern_US_States (accessed on 16 September 2023).
  47. Setiawan, N.N.; Vanhellemont, M.; Baeten, L.; Dillen, M.; Verheyen, K. The effects of local neighborhood diversity on pest and disease damage of trees in a young experimental forest. For. Ecol. Manag. 2014, 334, 1–9. [Google Scholar] [CrossRef]
  48. Lázaro-Lobo, A.; Ervin, G.N. A global examination on the differential impacts of roadsides on native vs. exotic and weedy plant species. Glob. Ecol. Conserv. 2019, 17, e00555. [Google Scholar] [CrossRef]
  49. Modlingerová, V.; Száková, J.; Sysalová, J.; Tlustoš, P. The effect of intensive traffic on soil and vegetation risk element contents as affected by the distance from a highway. Plant Soil Environ. 2012, 58, 379–384. [Google Scholar] [CrossRef]
  50. Bandara, W.A.R.T.W.; Dissanayake, C.T.M. Most tolerant roadside tree species for urban settings in humid tropics based on Air Pollution Tolerance Index. Urban Clim. 2021, 37, 100848. [Google Scholar] [CrossRef]
  51. Yang, X.; Hong, W.; Wu, C. Distribution characteristic of DBH and tree height for gap edge trees of Acacia confusa in mid-subtropical zone. J. Southwest For. Univ. 2010, 30, 25–28. [Google Scholar] [CrossRef]
  52. Braubach, M.; Egorov, A.; Mudu, P.; Wolf, T.; Ward Thompson, C.; Martuzzi, M. Effects of urban green space on environmental health, equity and resilience. In Nature-Based Solutions to Climate Change Adaptation in Urban Areas: Linkages between Science, Policy and Practice; SpringerOpen: Cham, Switzerland, 2017; pp. 187–205. [Google Scholar]
  53. Akers, A.; Barton, J.; Cossey, R.; Gainsford, P.; Griffin, M.; Micklewright, D. Visual color perception in green exercise: Positive effects on mood and perceived exertion. Environ. Sci. Technol. 2012, 46, 8661–8666. [Google Scholar] [CrossRef] [PubMed]
  54. Kurt, S.; Osueke, K.K. The effects of color on the moods of college students. Sage Open 2014, 4, 2158244014525423. [Google Scholar] [CrossRef]
  55. Elsadek, M.; Liu, B.; Lian, Z.; Xie, J. The influence of urban roadside trees and their physical environment on stress relief measures: A field experiment in Shanghai. Urban For. Urban Green. 2019, 42, 51–60. [Google Scholar] [CrossRef]
  56. Lohr, V.I.; Pearson-Mims, C.H. Responses to scenes with spreading, rounded, and conical tree forms. Environ. Behav. 2006, 38, 667–688. [Google Scholar] [CrossRef]
  57. Balling, J.D.; Falk, J.H. Development of visual preferences for natural landscapes. Environ. Behav. 1982, 14, 5–28. [Google Scholar] [CrossRef]
  58. Konijnendijk, C. Promoting Health and Wellbeing through Urban Forests–Introducing the 3-30-300 Rule. 2021. Available online: https://iucnurbanalliance.org/promoting-health-andwellbeing-through-urban-forests-introducing-the-3-30-300-rule (accessed on 12 October 2023).
Figure 1. (a) The location of Byblos, (b) the topography of Byblos, retrieved from National Council for Scientific Research–Lebanon (CNRS) 2022, (c) The circulation in Byblos, made by the author in 2024.
Land 13 00464 g001
Figure 2. Map showing the social nodes in Byblos. Made by the author, 2024.
Land 13 00464 g002
Figure 3. A flowchart showing the methodology applied in the study.
Land 13 00464 g003
Figure 4. The 24 sampled streets in Byblos. Made by the author in 2024.
Land 13 00464 g004
Figure 5. Representation of the FMI and HDI figures, where A is the reference tree and A1, A2, A3, A4, A5, A6, A7, and A8 are the neighbor trees.
Land 13 00464 g005
Figure 6. Map representing the different land-use and land-cover types in Byblos, retrieved from National Council for Scientific Research–Lebanon (CNRS) 2022, edited by the author, 2024.
Land 13 00464 g006
Figure 7. The abundance of tree species and tree numbers by streets.
Land 13 00464 g007
Figure 8. Charts showing the class distribution of DBH, height, and crown area in all three areas, (a) Streets of the city center area, (b) Streets of the residential area, and (c) Streets that are highly circulated by vehicles.
Land 13 00464 g008
Figure 9. Chart representing the landscape structural diversity indices.
Land 13 00464 g009
Figure 10. The landscape sceneries of the perceptual testing, with their average score.
Land 13 00464 g010
Figure 11. Blossoming calendar of each area based on the species present within, (a) City center area, (b) Residential area, (c) Vehicular highly circulated streets. Each ring in the figure represents the blossoming cycle of a species of trees assessed in the inventory. When it is evergreen, the ring is always green; light brown indicates deciduous trees, and the colors represent the color of tree flowers. Source: Made by the author, 2024.
Land 13 00464 g011
Table 1. Representing the specific class classifications for DBH, height, and crown area.
ClassDBH/cmHeight/mCrown Area/m2
C15–201–71–16
C220–407–1116–64
C340–8011–1764–144
C4>80>17>144
Table 2. Represents the average of each ecological indicator in each type of street.
AreaNo. of SpeciesRISWISIEI
City center streets305.561.020.480.56
Residential streets305.751.350.660.80
Vehicular highly circulated streets143.140.640.340.51
All over Byblos56-2.050.750.66
Table 3. Descriptive statistics of landscape images.
No. of the StreetMin.Max.Average ScoreStand. Dev.No. of the StreetMin.Max.Average ScoreStand. Dev.
11106.21.9131106.12
23107.71.9144107.21.6
31105.32.1151106.11.9
42106.32.1161105.32.2
51106.42.11711072.2
61106.82.2182106.42.1
71106.12191104.92.2
81105.92.2203106.41.5
92106.41.7213106.51.8
102107.31.7221105.32.1
112106.51.8231106.51.9
121106.32243106.91.7
Table 4. Correlation coefficient between FMI, HDI, FMI + HDI, and the perceptual testing results.
Indicatorrp-ValueR2
FMI−0.060.250.24
HDI 0.030.420.17
FMI + HDI0.140.070.37
Disclaimer/Publisher’s Note: The statements, opinions and data contained in all publications are solely those of the individual author(s) and contributor(s) and not of MDPI and/or the editor(s). MDPI and/or the editor(s) disclaim responsibility for any injury to people or property resulting from any ideas, methods, instructions or products referred to in the content.

