Abstract
The spatial–temporal distribution and evolution characteristics of carbon stock under the influence of land use changes are crucial to the scientific management of environmental resources and the optimization of land spatial layout. Taking the Xiamen–Zhangzhou–Quanzhou urban agglomeration in the southeastern coastal region of China as an example, based on seven land use types from 1990 to 2020, including cultivated land, woodland, and construction land, we quantitatively investigate the spatial–temporal patterns of carbon stock development and the spatial correlation of carbon stock distribution. Additionally, two scenarios for the development of urban and ecological priorities in 2060 are established to investigate the effects of land use changes on carbon stock. The results indicate that (1) the research area has formed a land use spatial pattern centered around urban construction in the eastern bay area, with the western forest area and coastal forest belt serving as ecological barriers. Carbon stock is influenced by land use type, and the distribution of total carbon stock exhibits a spatial aggregation phenomenon characterized by “low in the southeast, high in the north, and medium in the center”. (2) Distance of trunk and secondary roads, elevation, slope, watershed borders, population size, and gross domestic product (GDP) factors are the main drivers of the growth of land use types. The primary causes of the reduction in carbon stock are the widespread conversion of cultivated land, woodland, and grassland into construction land, as well as water and unused land. (3) In 2060, there will be a decrease of 41,712,443.35 Mg in the urban priority development scenario compared to 2020, and a decrease of 29,577,580.48 Mg in the ecological priority development scenario. The estimated carbon stock under the two scenarios varies by 12,134,862.88 Mg. The average carbon storage of Zhangpu County, Quangang County, and Jimei County is expected to rise by one level under the ecological protection scenario, indicating that the vast forest area can become a potential area to maintain carbon stock. It is crucial to encourage the coordinated development of peri-urban agroforestry and ecological barriers, as well as to establish a harmonious spatial pattern of land use and carbon stock at the scale of urban agglomerations.
1. Introduction
China’s carbon reduction targets are based on a reduction in CO2 emissions, and the total CO2 emissions in China are approximately 10,356.26461 Mt, with a 97.5% confidence interval, suggesting a possible range of variation from a decrease of 3.43% to an increase of 3.45% [1]. At the UN General Assembly in September 2020, China declared that its CO2 emissions would peak by 2030 and that it would work toward achieving carbon neutrality by 2060. For the goals of utilizing natural resources, controlling global warming, and scientifically managing carbon sources and sinks, carbon stocks serve as an important indicator of the scope and magnitude of the primary production of ecosystems [2,3,4,5]. High economic density makes coastal locations ideal for urban growth, and fast urbanization has sped up changes in land use [6,7,8], which has an impact on the storage of carbon in terrestrial ecosystems [9,10,11,12]. In this regard, examining how spatial and temporal patterns of carbon storage develop in coastal urban clusters under the effect of land use change has a positive impact on achieving the construction goal of high-quality development based on ecological priorities, improving the carbon balance of terrestrial ecosystems in the study area, maintaining the regional carbon cycle, mitigating climate change, and promoting a high quality of life and sustainability [13].
Numerous studies discussing the connection between land use/land cover and carbon stocks, as well as improving the ability of terrestrial ecosystems to sequester carbon, have been conducted in recent years [14,15,16]. the integrated valuation of ecosystem services and trade-offs (InVEST) model has been utilized in the majority of studies that assess carbon stocks. The conditions for the interaction between land use/land cover and carbon stocks are often complex. For instance, changes in land use in the Xinjiang Tianshan region and the Chengde Meizi region have an impact on the distribution of carbon stocks [17,18], while changes in the cover of land uses with similar characteristics in the Loess Plateau region have a sizable impact on the spatial variation in carbon stocks [19], in the UK National Park and Hainan Island, differences in carbon stocks result from different plant species [20,21], and in the Guangdong–Hong Kong–Macao urban agglomeration and north gulf of Guangxi, carbon stocks fluctuate as a result of wetland changes [22]. Meanwhile, the driving factors leading to land use change can affect the distribution of carbon storage by altering land types. For instance, climate factors can change the use of forest vegetation, thus reducing the land carbon sequestration capacity [23]; land types are affected by the policy of converting land for grain to land for forests, thereby increasing carbon storage [24]; and the transformation of land types to construction land brought about by urban economic development has led to a decrease in carbon storage [25]. Since most studies on carbon stocks related to land use change have focused on watersheds and inland cities, it is not yet possible to determine the mechanism of influence of each land use type and land use change factor on the spatial pattern of carbon stocks in urban coastal areas.
As for the study of land class transformation, the current numerical simulation methods can be divided into the comparative transformation method and the neighborhood correlation method. The contrastive transformation method can extract input land use data from two phases to predict the transformation probability of each category, which can improve spatial analysis and simulation operations, but it has the drawback that as the number of categories rises, the computational cost becomes very high. The software on which the method is based primarily consists of cellular automata (CA) and artificial neural network (ANN),such as logistic-CA models [26,27], ANN-CA models [28,29], and multi-intelligent body models [30,31]. The neighborhood correlation approach calculates the likelihood that each category will change, using land use data from a specific time period and an algorithmic model based on spatial autocorrelation weighting coefficients. Its drawback is that it fails to take into account the evolution of land use through time and pays little attention to how various external factors affect changes in land use. It mostly consists of software like the CLUE-S (Conversion of Land Use and its Effects at Small regional extent) model [32,33], FLUS (Functional Land Use Simulation) model [34,35], and SD-MOP (System Dynamics-Multi-Objective Programming) model [36,37].
In view of the widespread use of intelligent algorithms in predictive simulation research, the PLUS (patch-generating land use simulation) model, which is based on the integrated cellular automata (CA) model, the random forest model, and the Markov chain model [38], is widely used. The model can account for the factors that influence landscape evolution and land extent. The method has also drawn the attention of many scientists and is frequently used in research areas like disaster-adaptive regulation [39], construction timing strategies [40], the optimization of spatial patterns for productive, ecological, and living habitats [41,42], and habitat quality [43,44,45], because it can capture the drivers of change across categories, model the process of land use area change, and realize land use prediction scenarios in the context of multi-scenario decision making [46,47]. Currently, some researchers have coupled the InVEST model with the PLUS model, with the main research content being the regional distribution of carbon stock potential in the context of coastal planning and management [48,49] and the link between carbon stock and spatial development patterns of urban clusters [50,51]. The differences in carbon stock distribution between various development scenarios, including low-carbon development scenarios [52], environmental and economic development scenarios [53], and natural development, farmland conservation, and ecological priorities scenarios [54], have been analyzed. Determining the effects of carbon stock development patterns under various scenarios is the subject of a new study field for carbon stock prediction analysis. As these studies call for distinct assessments based on the geographical patterns and development policy traits of different regions, it is uncertain if these regional disparities can be applied to spatial prediction studies of carbon stocks in each city.
Overall, there are three difficulties in analyzing the carbon stock estimate in coastal urban agglomerations under the influence of land use change, as follows:
- (1)
- How can the effects of various land uses on the development of carbon stock patterns be taken into account, in order to then evaluate the spatial connection of carbon stocks in coastal urban agglomerations?
- (2)
- How can the influencing factors for the growth of each land use type contribute?
- (3)
- How can the interaction between low-carbon ecological and economic development be balanced and well-coordinated?
To address these challenges and provide planning strategies for terrestrial ecosystem management in coastal urban agglomerations based on a carbon balance perspective, we chose the Xiamen–Zhangzhou–Quanzhou urban agglomeration as the study area and first quantitatively analyzed the spatial and temporal distribution of carbon stocks from 2000 to 2020 under the influence of land use change. Then, we analyzed the spatial correlation of carbon stocks in the Xiamen–Zhangzhou–Quanzhou urban agglomeration. The two scenarios for future planning decisions that match the priorities of urban development and ecological development were then compared. The PLUS model was used to simulate the pattern of land use in the study area in 2060 and provide predictions about the features of carbon stock changes. The findings of this study contribute to meeting the dual carbon objective by balancing regional synergistic development with environmental protection. They also provide a scientific basis for the development of coastal city clusters.
2. Materials and Methods
2.1. Study Area
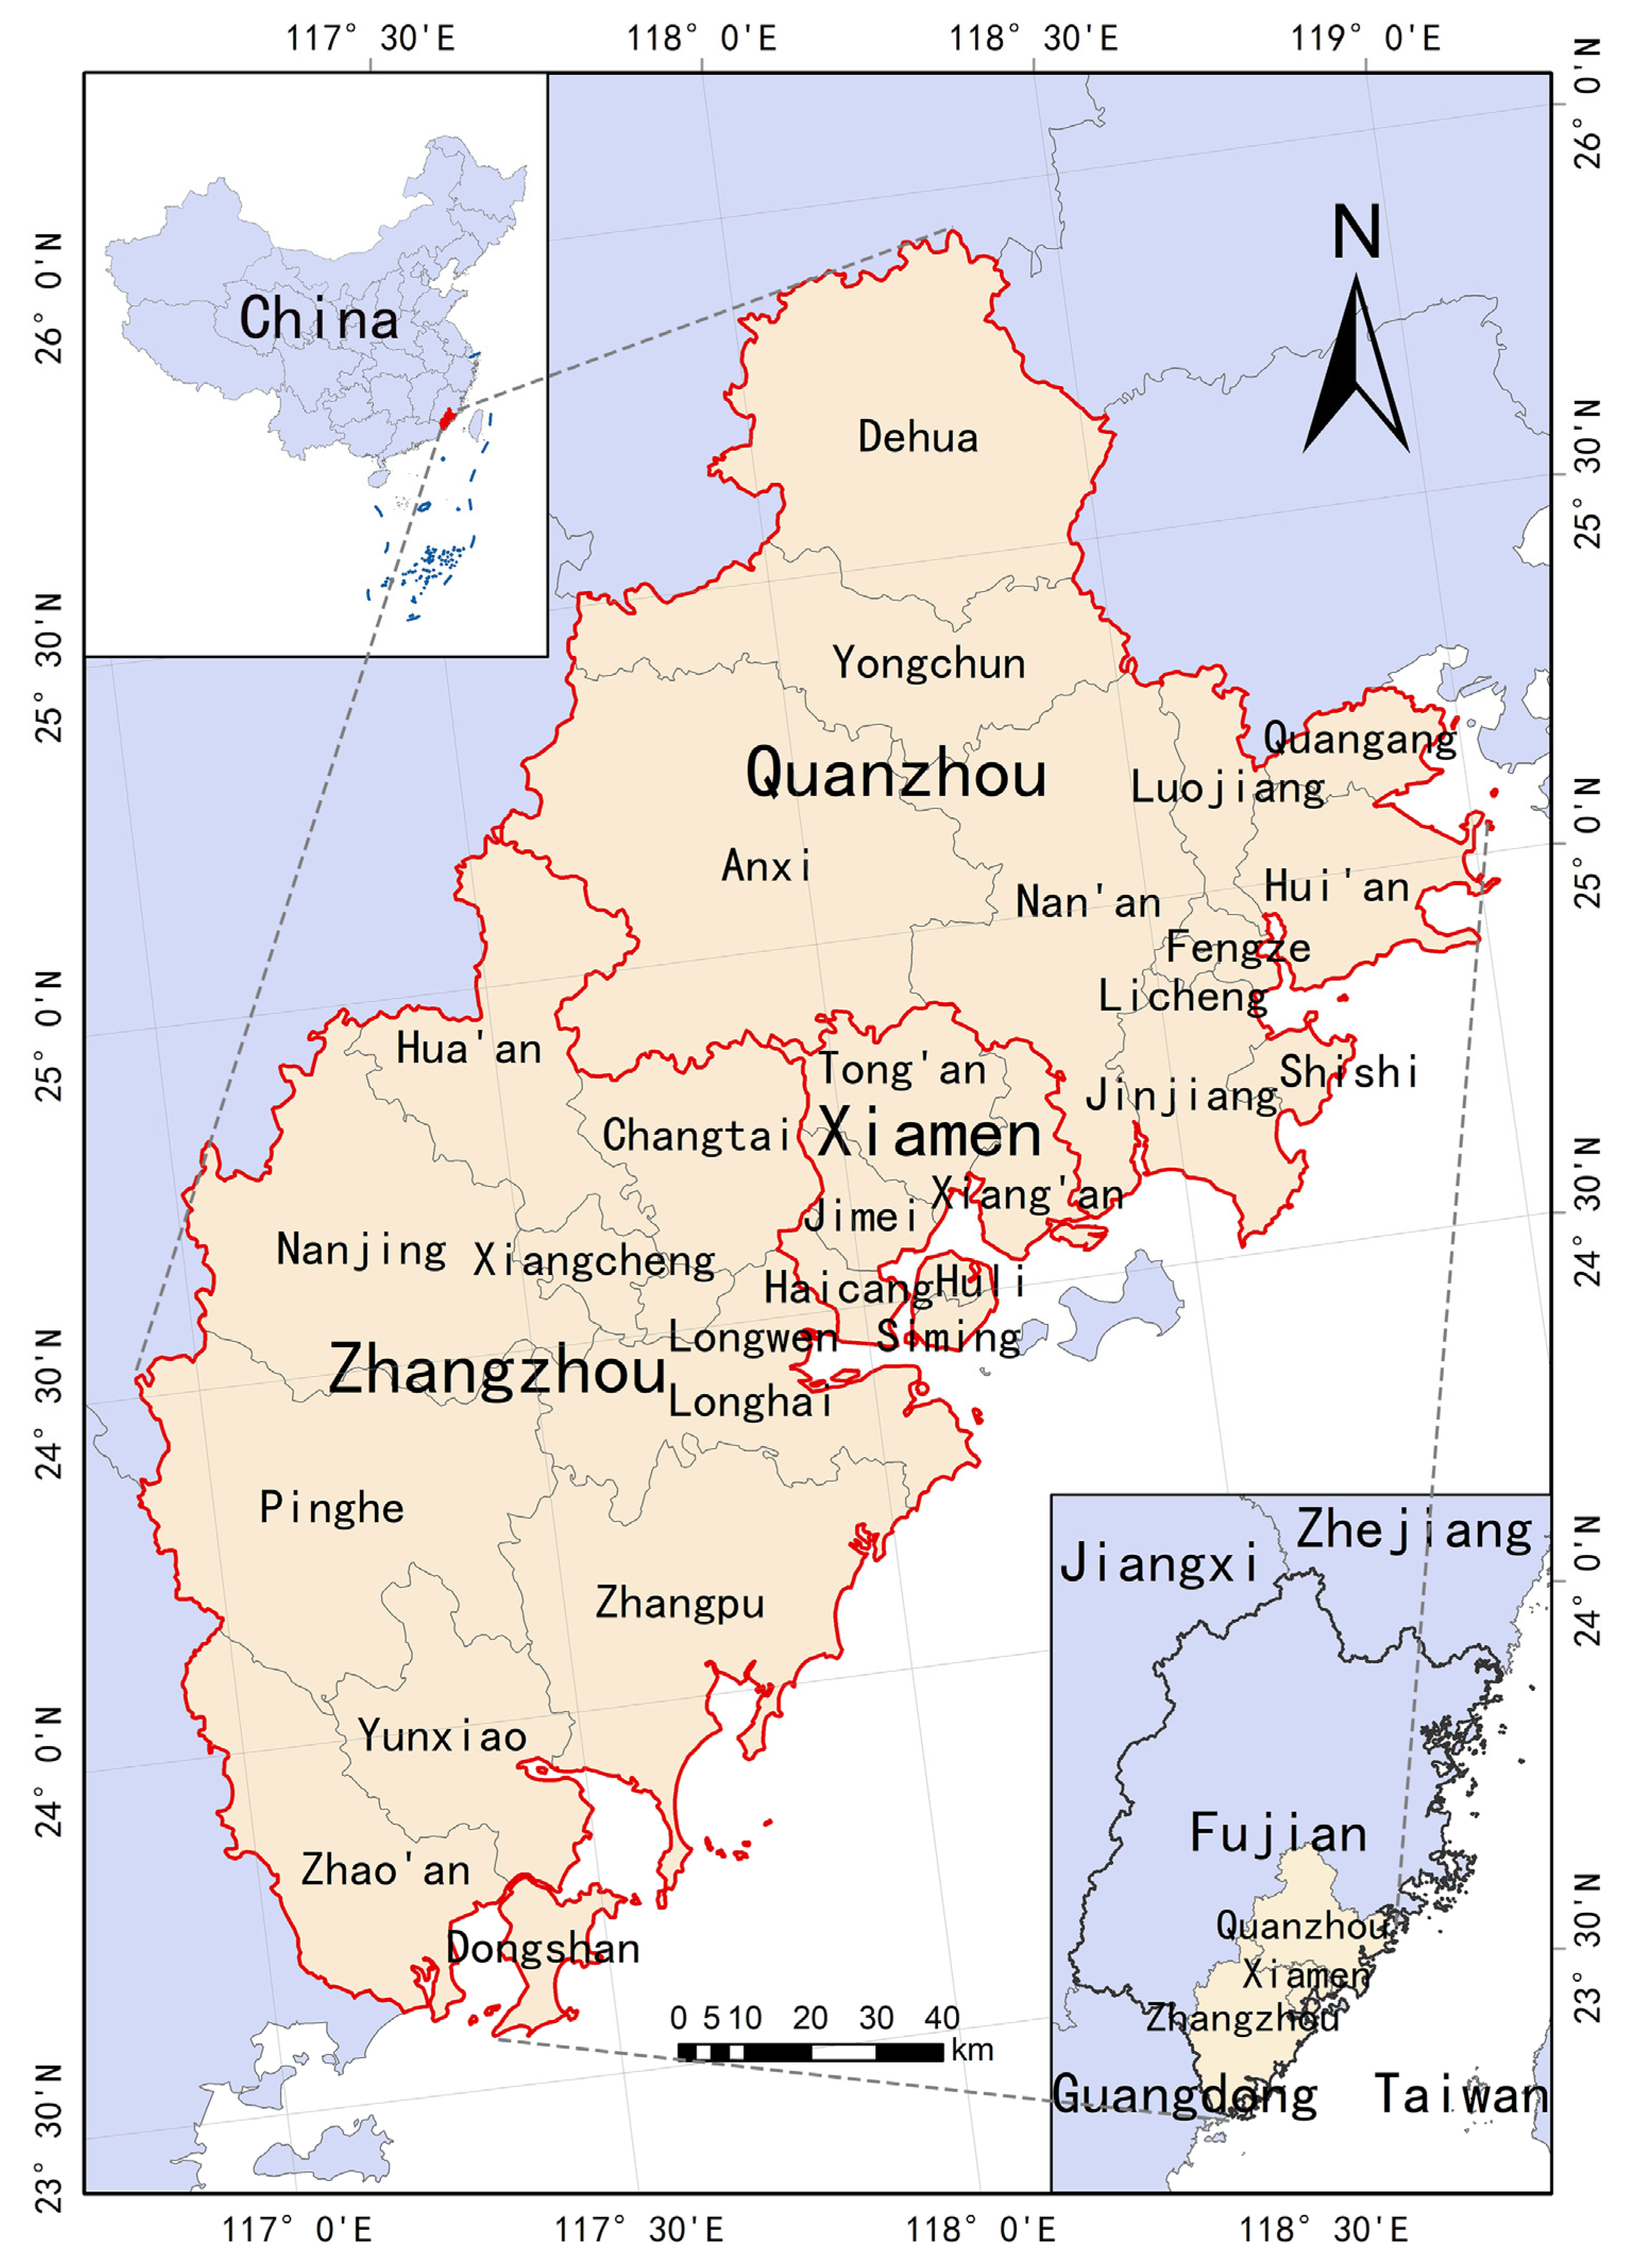
The study area is located in the southeastern coastal region of China, in the southeastern part of Fujian Province, near the Taiwan Strait coastal area, and includes the cities and counties of Quanzhou City, Xiamen City, and Zhangzhou City (except Jinmen County, which belongs to Quanzhou City), with an area of 25,314.39 km2 (Figure 1). By the end of 2022, the urban agglomeration of Xiamen, Zhangzhou, and Quanzhou had a population of 19.2 million and an annual GDP of RMB 2336.35 billion [55],. The Xiamen–Zhangzhou–Quanzhou urban agglomeration is the most vibrant and prosperous metropolitan area in Fujian Province, covering 20.85% of its total area, producing 47.87% of the entire economic output of the province, and housing 45.86% of its total population. The region is known for its steep and hilly landscape, which is typically high in the north and low in the south. With an average annual precipitation of 1477.1 mm, the subtropical maritime monsoon climate that affects the south is moderate and humid all year long. The research area is ideal for the growth of vegetation, 49.68% of which is forest, and is rich in water, light, and heat resources. However, due to the region’s accelerated urbanization, which has resulted in quick changes in land use, the study area now faces serious threats in terms of storing carbon, managing climate change, and preserving the environment.
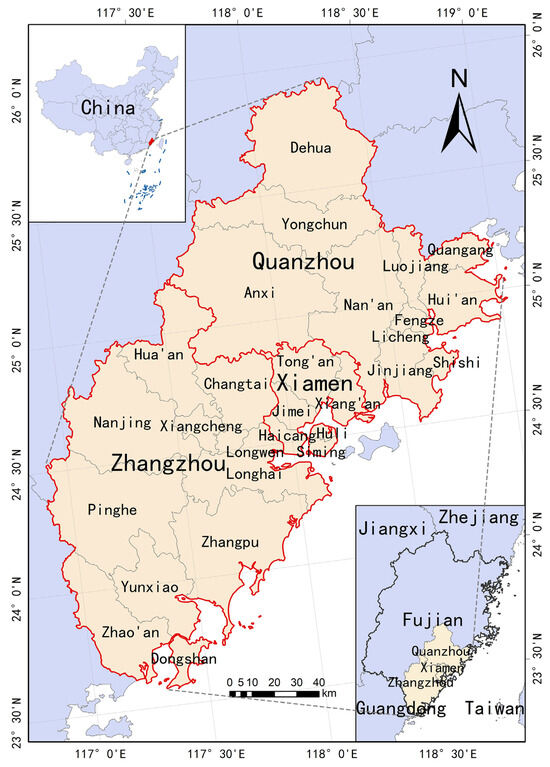
Figure 1.
Geographical location and administrative division of the study area.
2.2. Research Methods
2.2.1. A Carbon Stock Calculation Method using the InVEST Model
In order to construct carbon pool data based on land use types and calculate carbon stocks for land uses in the study area over various time periods, the embedded carbon module in the InVEST model assumes that carbon stocks in various soil types do not vary linearly with time, without taking into account conditions like photosynthetic rates and the presence of active soil organisms. The method of calculation involved dividing the carbon stock into the carbon densities of aboveground biogenic carbon (Ci_above), belowground biogenic carbon (Ci_below), soil carbon (Ci_soil), and dead organic carbon (Ci_dead), and then using data on land use change and carbon pools to create a map of the spatial distribution of carbon stock in the study area. Additionally, both land use and soil type are significant factors affecting carbon storage. They were categorized based on different classification criteria to delineate spatial areas. A single land use type may correspond to multiple soil types. In this study, the average value of multiple soils under a specific land use type was taken.
The following equation was used to determine the carbon intensity for various land use categories in a certain area:
where Ctot is a region’s average carbon density for all land use types; Cabove is the biomass that grows above ground and contains the carbon stored in all living plant material; Cbelow is the carbon density of belowground biomass; Csoil is the soil carbon stock, which refers to carbon distributed in organic and mineral soils at a depth of 1 m; and Cdead is the carbon of dead organic matter, including apoplastic matter and dead trees.
Ctot = Cabove + Cbelow + Csoil + Cdead
The following equation was used to determine the carbon stock for various land uses in a certain area:
where i is the i-th land use type; Ci_tot is the total carbon stock of the i-th land use type; Ci_above, Ci_below, Ci_soil, and Ci_dead are the various types of carbon density of the i-th land use type; and Ai is the area of the i-th land use.
Ci_tot = (Ci_above + Ci_below + Ci_soil + Ci_dead) × Ai
2.2.2. A Grid-Based Approach to Spatial Correlation Analysis
In this study, a 5 km × 5 km fishnet grid built on the ArcGIS platform was spatially connected, layered with carbon stock data derived from the InVEST model, and used to generate carbon stock values at the grid level. The correlation between carbon stocks and geographic space was then evaluated using Moran’s I index values, z-scores, and p-values, utilizing the global spatial autocorrelation statistic based on grid position and carbon stock features. Statistical significance was indicated when the z-score or p-value was present. A smaller p-value indicated a higher likelihood that the data had aggregate and discrete distributions; more clustering was observed when the z-score’s absolute value was higher. The positive value of Moran’s I index denoted a tendency toward clustering, while its negative value denoted a tendency toward dispersion. Based on this, the Anselin local Moran’s I was used to analyze the local auto-correlation data. In other words, the Local Indicators of Spatial Association (LISA) cluster map was created by analyzing spatial outliers and using the cluster and outlier analysis methods to find spatial clusters of carbon stock elements with high or low values. The Getis-Ord-Gi* index approach examined the geographical distribution of carbon stock data and discovered statistically significant hot and cold places. Hot spots were areas of aggregation with high values, whereas cold spots were areas of aggregation with low values.
2.2.3. A Patch-Generating Land Use Simulation (PLUS)-Based Approach to Sprawl Research
The PLUS (patch-generating land use simulation) model is a land use change simulation model based on raster data. This method can mine the driving factors of land use change, simulate the process of land use type patch change, and realize the feasibility of land use prediction scenario under multi-scenario decisions. The land expansion analysis strategy (LEAS) involves calculating the likelihood that each land type will develop, extracting the percentage of land use change in the two time periods in which each land type expands, identifying the drivers of land expansion using the random forest algorithm, and evaluating the contribution of each driver. The CA model based on multi-class random patch seeding (CARS) combines random seed generation and threshold reduction mechanisms to simulate land use patch generation under different constraints.
2.3. Data Source and Data Preprocessing
2.3.1. Land Use Data
A land use dataset was provided, with a spatial resolution of 30 m × 30 m [56]. The classification method was as follows: the regional land use types were classified into 6 primary types (new codes will be added in the 2020 data update, due to marine and terrestrial land reclamation involving the sea) and 25 secondary types, according to the natural attributes of the land resources. The data were manually checked and the accuracy was 88.95% [57]. In this study, the secondary categories of the original data were combined to create six land use types for 2000, 2010, and 2015, and seven land use types for 2020. A total of four periods of land use data were chosen for 2000, 2010, 2015, and 2020.
2.3.2. Carbon Pool Data
For the purposes of this study, carbon stocks were calculated to include aboveground biogenic carbon, belowground biogenic carbon, soil organic carbon, and dead organic carbon density. Aboveground biogenic carbon refers to the carbon content of all living plants above ground; belowground biogenic carbon refers to the carbon content in the living root system of plants; soil carbon content usually refers to the organic and inorganic carbon distributed in organic and mineral soils; since soil inorganic carbon content is much lower than soil organic carbon content and is difficult to determine, soil organic carbon content was used for calculation in this study (Figure 2). Dead organic carbon is the amount of carbon stored in dead trees. The carbon density data of each land use type were obtained by referring to existing research results [58,59,60,61,62], and the final carbon density database in the study area was constructed (Table 1).
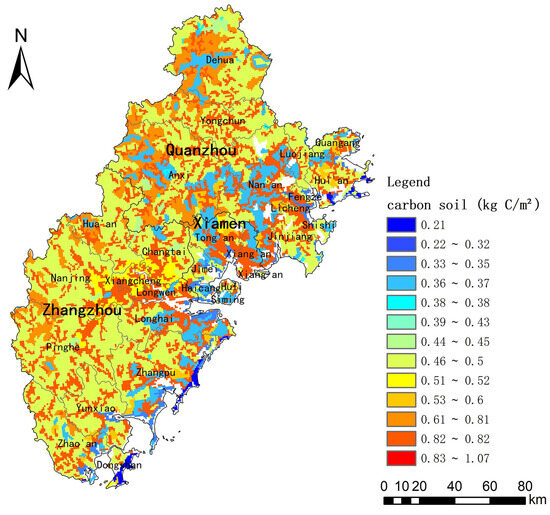
Figure 2.
Soil carbon density distribution [63].

Table 1.
Carbon density of different land use types.
2.3.3. Data and Parameter Settings for the PLUS Model
Socioeconomic, public administration, climatic, and geographic–environmental factors were taken into account as the drivers of land use change (Table 2), and datasets were quality-controlled through manual review. In order to comply with the data processing criteria of the simulation, sea was removed from the calculations and land use simulation stages that incorporate the carbon stock in this study, because it was determined that the marine carbon density of reclaimed land is zero.
Table 2.
PLUS model land use driver data.
The analysis was based on two distinct development scenarios: a natural development scenario, where environmental preservation and maintaining urban safety are the primary goals, and an urban development scenario, where economic growth and enhancing quality of life are the main goals. The following settings were made for the various parameters in the LEAS and CARS modules.
For the land expansion analysis strategy (LEAS) module, the random forest regression (RFC) parameter sampling rate was set to 0.01, and mTry was equal to the number of drivers. For the land use change emergence simulation (CARS) module, future land use demand was predicted using the Markov chain method. A default value of 3 was chosen for the PLUS neighborhood effect, a mitigation coefficient of 0.5 was chosen for the declining threshold of patch emergence, a diffusion coefficient of 0.1 was chosen, and a default probability of random patch seeding of 0.0001. The transmission matrix and neighborhood weights are as shown in Table 3 and Table 4, respectively.
Table 3.
Transmission matrix parameter settings. “0” indicates that conversion is not allowed, while “1” indicates that conversion is permitted. The likelihood of conversion is derived from reference [38].
Table 4.
Neighborhood weight settings. The value range is from zero to one, with higher values signifying greater influence from neighboring areas; it is calculated based on the proportion of each land use type’s expansion area, relative to the total land expansion.
3. Results
3.1. Features of Land Use Change in the Xiamen–Zhangzhou–Quanzhou Urban Agglomeration
Regarding the changes in land use (Figure 3 and Table 5) between 2000 and 2020, the proportions of cultivated land, woodland, and grassland in the Xiamen–Zhangzhou–Quanzhou urban agglomeration decreased by 99,179.37 ha, 39,546.09 ha, and 14,075.19 ha, respectively. The proportion of cultivated land decreased from 25.56% to 21.58%, the proportion of woodland decreased from 51.25% to 49.56%, and the proportion of grassland decreased from 16.17% to 15.58%. The proportion of building land increased by 5.81%, the proportion of water areas rose by 0.43%, and the proportion of unused land increased by 0.02%, i.e., by 147,536.28 ha, 11,014.83 ha, and 476.73 ha, respectively. Construction land is expressed as the spread of urban land as well as other construction land. The construction of dams, ponds, and lakes increased the proportion of water, while the development of wetlands increased the amount of undeveloped land. Currently, the proportion of cultivated land is declining the fastest, while the amount of land used for development is rising.
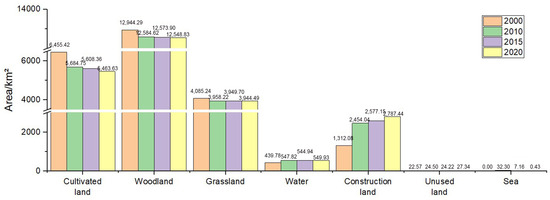
Figure 3.
Quantitative structure of land use.
Table 5.
Proportion of land use.
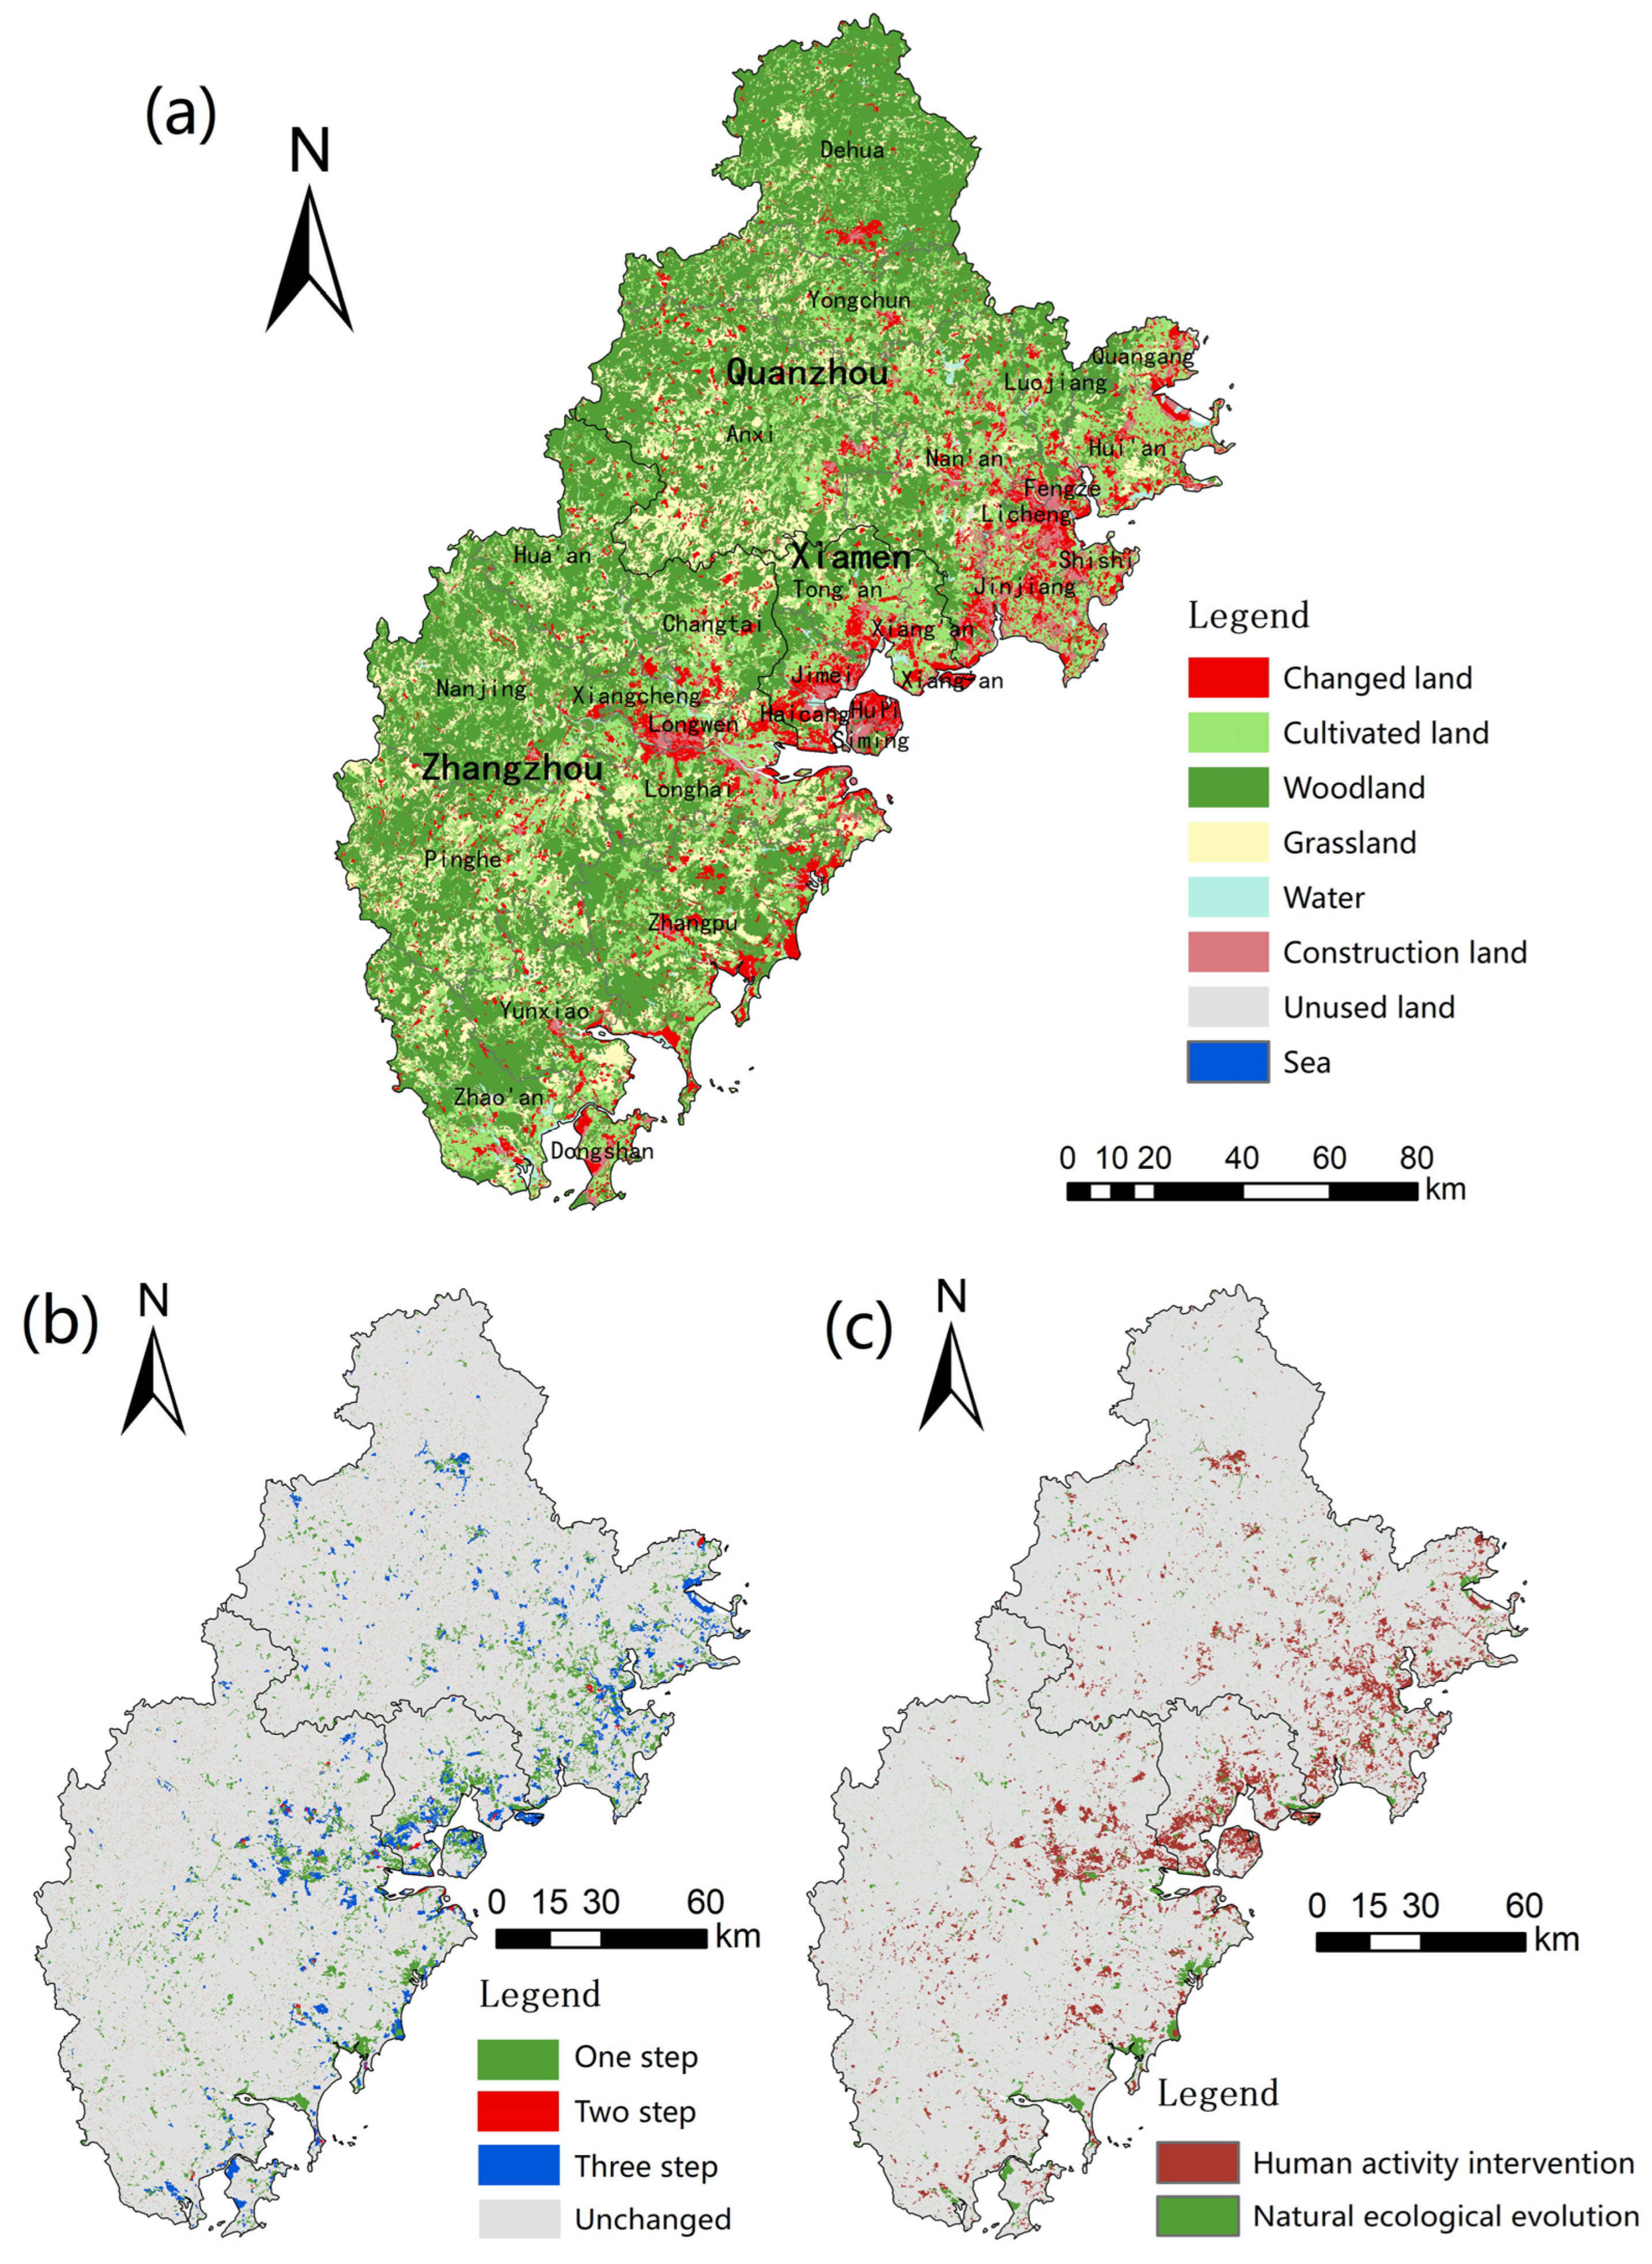
As for the spatial distribution of land use types (Figure 4), the obvious concentration of construction land between 2000 and 2020 was in the central urban areas of Quanzhou, Xiamen, and Zhangzhou, close to the Taiwan Strait, specifically in the Fengze District, Xicheng District, Haicang District, Jimei District, Huli District, Siming District, Xiangcheng District, and Longwen District, where the concentration of construction land was as follows: Xiamen City > Quanzhou City > Zhangzhou City. Urban land has dramatically increased in size in the Xiamen–Zhangzhou–Quanzhou region during the past 20 years as a result of population growth, rapid industrial and commercial development, and urbanization. The western coast of the Taiwan Strait is important for the development of the Xiamen–Zhangzhou–Quanzhou urban agglomeration [67], so there is a high intensity of land use there. Urban construction areas have a distinctive agglomeration pattern, with fragmentary use of much of the original cultivated land. In Fujian Province, the western forest, which is primarily made up of woodland and grassland, is crucial for delivering ecosystem services. The Xiamen–Zhangzhou–Quanzhou urban agglomeration has developed a spatial land use pattern, with the western woodland and forest along the seashore serving as the ecological barrier and the eastern bay of Quanzhou City, Xiamen Island, and its surrounding areas serving as the economic center.

Figure 4.
Land use changes in the Xiamen–Zhangzhou–Quanzhou urban agglomeration from 2000 to 2020. (a) Areas of land use conversion. (b) Multi-period land use changes. (c) Types of land use conversion.
According to the matrix of land use conversion in Xiamen–Zhangzhou–Quanzhou urban agglomeration from 2000 to 2020 (Table 6), a total of 123,010.29 ha of cultivated land has been converted in the past 20 years, of which 79.50% has been converted to construction land and 12.06% to woodland. A total of 71,931.78 ha of woodland has been converted, of which 53.12% has been converted to construction land, 24.10% to grassland, and 19.44% to cultivated land. In the past 20 years, 161,425.80 ha of construction land has been converted, of which 60.58% has been converted to cultivated land, 23.67% to woodland, and 10.20% to grassland. Construction land, cultivated land, and woodland are the main categories of land with high conversion rates. The cultivated land area in the Xiamen–Zhangzhou–Quanzhou urban agglomeration fell by an average of 7706.72 ha per year between 2000 and 2010, while the construction land area expanded by an average of 11,419.57 ha per year, exhibiting the fastest growth rate. Cultivated land has been the reserve resource for the development plan of construction land in the central urban areas of the three cities of Xiamen, Zhangzhou, and Quanzhou over the past 20 years. Woodland as a soil resource with the requirements of conservation and cover index plays an important role in maintaining the stability of the ecosystem and scenic environment in Xiamen, Zhangzhou, and Quanzhou, both of which have been disturbed and destroyed to different degrees by the urbanization process. Following the reform and opening up, Quanzhou started to draw urban businesses from Jinjiang and Shishi, creating the “Quanzhou Model,” where light industries were situated and private businesses took the lead. Since 2006, Quanzhou has entered a period of transformation and development, in which industrial land and urban land have increased, and the city has become one of the central cities of Fujian Province. Since the expansion of Xiamen Special Economic Zone to the whole island in 1984, Xiamen has been striving to develop a modern port, a picturesque tourist city, and a central city on the west coast of the Taiwan Strait. When the Xiamen Haicang Free Trade Port Zone was founded in 2008, it created an all-encompassing, multi-level development pattern, during which arable land was significantly reduced and urban building land was significantly increased. Zhangzhou, which has remained a crucial location for ecological conservation, has seen little change in both the distribution of land use and the size of its central area since 2010. The Xiamen–Zhangzhou–Quanzhou urban agglomeration currently has significant disparities in the intensity of land use development, and there is a problem with unbalanced regional development, which is also influenced by the siphon effect of the Pearl River Delta and Yangtze River Delta regions. The joint and synergistic development of the three cities can be promoted to attract capital, technology, industry, and talent.
Table 6.
Area transfer matrix for the Xiamen–Zhangzhou–Quanzhou urban agglomeration (ha).
3.2. Analysis of the Evolution of Spatial and Temporal Patterns of Carbon Stocks in the Xiamen–Zhangzhou–Quanzhou Urban Agglomeration
The InVEST model was used to determine the spatial distribution of carbon reserves at four time points (Figure 5). Considerable changes have occurred in the spatial and temporal patterns of carbon stocks in Fujian Province over the past 20 years. In 2000, urbanization was still in the early stages. The low-carbon-storage areas were sparsely distributed along the Taiwan Strait, the high-carbon-storage areas were widely dispersed in the western portion of the study area, and the medium-carbon-storage spaces were more concentrated in the low-carbon-storage agglomerations and dispersed in the high-carbon-storage areas. The mix of medium- and low-carbon-storage areas increased between 2000 and 2010, and the development pattern of low-carbon-storage concentration areas took shape in the districts of Fengze and Licheng in Quanzhou City, Huli and Siming in Xiamen City, and Longwen and Xiangcheng in Zhangzhou City. The total carbon stocks were 1,124,330.839 Mg, 332,923.184 Mg, 210,378.9939 Mg, 755,029.667 Mg, 1,369,942.187 Mg, and 4,388,893.549 Mg, respectively, which were below the average carbon stock of 18,770,424.09 Mg for the urban agglomeration. The three-city hinterland space of Dehua County and Jinjiang City in Quanzhou City, Jimei District and Haicang District in Xiamen City, and Changtai County in Zhangzhou City began to become low-carbon-storage spaces from 2010 to 2020. However, compared to a decade earlier, the expansion of low-carbon-storage space slowed down, due to the transition from high-speed to high-quality developments in urban construction, and the decrease in total carbon stock shifted from 22,194,053.42 Mg to 3,972,839.45 Mg, representing a reduction of 82.10% year-on-year. The western and southern parts of the study area became high-carbon-storage supply areas, with Dehua County, Anxi County, Hua’an County, Nanjing County, Pinghe County, Yunxiao County, and Zhao’an County accounting for 59.33% of the total carbon stock of the 28 districts and counties in the urban agglomeration. In the whole Xiamen–Zhangzhou–Quanzhou urban agglomeration, the pattern of carbon storage over the past 20 years has shown an evolution of “low in the southeast, high in the north, and medium in the middle”. Taking each municipal administrative region as the object of study, the low-carbon-storage area in Quanzhou City gradually forms a triangular spatial distribution pattern with the endpoints of “Fengze, Licheng District–Jinjiang City–Shishi City”, and the high-carbon-storage area is more densely distributed in the northern part of the city. The low-carbon-storage area in Xiamen is centered on Xiamen Island and spreads outward, followed by the medium-carbon-storage area and high-carbon-storage area, showing obvious characteristics of circle distribution; the low-carbon-storage area in Zhangzhou City extends into the central area of Zhangzhou City in a wedge shape along the Jiulong River, and the aggregated patches of the high-carbon-storage area and medium-carbon-storage area are mostly distributed in the southern part of the city.
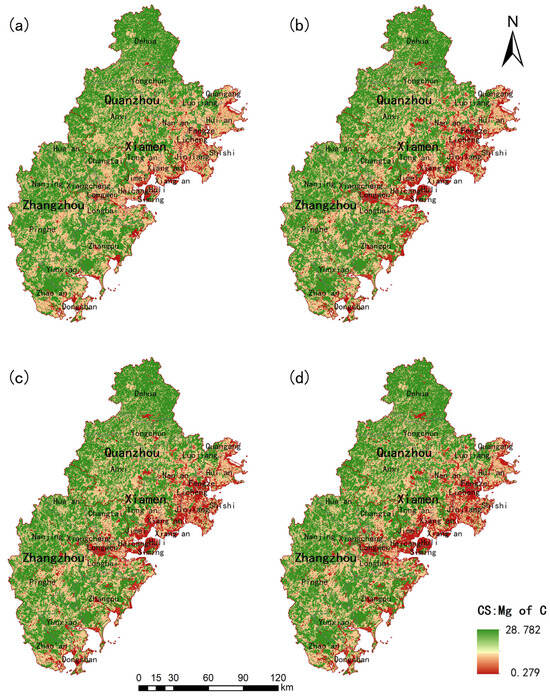
Figure 5.
Spatial and temporal distribution of carbon stocks in the Xiamen–Zhangzhou–Quanzhou urban agglomeration; from (a–d) in order: 2000, 2010, 2015, 2020.
The total carbon stocks in the study area were 54,773.58 Mg in 2000 and 52,156.90 Mg in 2020, according to the development of the pattern of carbon stocks in the Xiamen–Zhangzhou–Quanzhou urban agglomeration (Table 7). The carbon stocks in each period, from the largest to the smallest, were woodland > cultivated land > grassland > water > construction land > unused land. Although the area and carbon stocks of forest land, cultivated land, and grassland have decreased, they are still the most important carbon store in the Xiamen–Zhangzhou–Quanzhou urban agglomeration, with both land use types accounting for more than 99% of the total carbon storage in each period. The largest of these is the amount of carbon stored in woodland, which increased from 75.58% to 76.94% in 2020. The amount of carbon stored in cropland decreased year-by-year from 14.76% to 13.12% in 20 years. The amount of carbon stored in grassland decreased by 1,779,666.96 Mg overall but increased by 0.13% in the study area. Forest ecosystems contribute significantly to the increase in terrestrial carbon sinks [68], while the Xiamen–Zhangzhou–Quanzhou region experienced a rapid decline in ecological resources due to urban expansion between 2000 and 2010. The research area’s ability to sequester carbon has been compromised by the change in land use type brought on by ecological degradation, which has a detrimental effect on the regional environment’s overall carbon stock. This is because the degradation of cultivated land, woodland, and grassland tends to slow down after 2010 [69], which is due to the massive encroachment during the previous urbanization period. Overall, the loss in carbon stocks of ecosystems in the study area is mostly due to an increase in built-up areas, which have a limited capacity to sequester carbon, and a decrease in cultivated land, woodland, and grassland, which have a high capacity to do so.
Table 7.
Evolution of carbon stock in land use in the Xiamen–Zhangzhou–Quanzhou urban agglomeration, 2000–2020.
3.3. Spatial Correlation of Carbon Stocks in the Xiamen–Zhangzhou–Quanzhou Urban Agglomeration
The global spatial autocorrelation analysis of carbon stock in the Xiamen–Zhangzhou–Quanzhou urban agglomeration (Figure 6a) shows that the Moran’s I index value is 0.5445, with a z-score of 3.7143 and a p-value of 0.0002, indicating that carbon stock in the Xiamen–Zhangzhou–Quanzhou urban agglomeration represents a spatial clustering phenomenon. The LISA cluster map shows (Figure 6b) that Fengze County of Quanzhou City, Jinjiang City, Shishi City, Huian County, and the whole Xiamen City are low–low cluster carbon stock agglomeration areas, indicating that these county-level administrative regions have low carbon stocks and show a spatial pattern of agglomeration distribution. Yongchun County of Quanzhou City belongs to the high–high cluster carbon stock agglomeration area, while Nan’an City of Quanzhou City and Longhai City of Zhangzhou City are high-carbon-stock areas surrounded by low-carbon-stock areas. The Getis-Ord Gi* hotspot analysis shows that there is little difference in the regional extent of cold hotspots for carbon stocks between 2000 and 2020, and that statistically significant cold hotspots and hotspots each have cluster characteristics (Figure 7). Hotspot areas are regions with high–high cluster carbon stocks and strong spatial correlation, primarily in the north of Quanzhou city, the northwest of Xiamen city, and the west of Zhangzhou city. These regions are mainly concentrated in places with rich forest cover, such as Jiuxianshan Forest Recreation Base in Dehua County, Anxi County, Foershan Forest Park, Hua’an National Forest Park, Nanjing Tulou Forest Park, and Jiulongjiang Summit Valley Forest Recreation Base in Pinghe County, with 99% confidence as carbon stock hotspots. The key development regions of the three cities along the Taiwan Strait are the eastern bay area of Quanzhou City, Xiamen Island and its environs, and the southeastern port area of Zhangzhou City, where the cold spots in carbon stocks are found. The hot spots in the study area are characterized by a western ecological barrier complemented by the coastal forest, while the cold spots are characterized by clustering along the river mouth and bay.
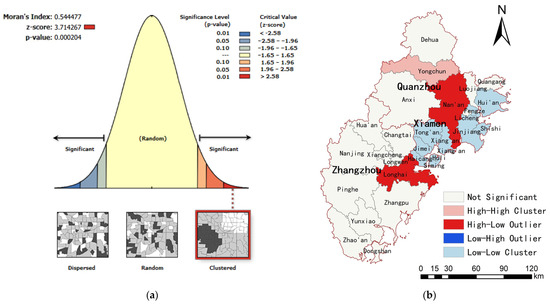
Figure 6.
Spatial autocorrelation analysis of Moran’s index (a) and LISA agglomeration map of carbon stocks in the Xiamen–Zhangzhou–Quanzhou urban agglomeration (b).
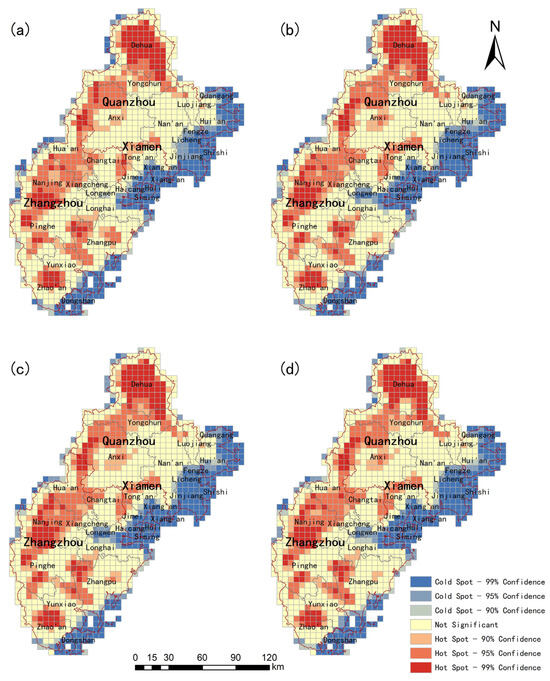
Figure 7.
Hot spot analysis of carbon storage in the Xiamen–Zhangzhou–Quanzhou urban agglomeration; from (a–d) in order: 2000, 2010, 2015, 2020.
3.4. Carbon Stock Projections for Land Use in the Xiamen–Zhangzhou–Quanzhou Urban Agglomeration under Different Development Scenarios
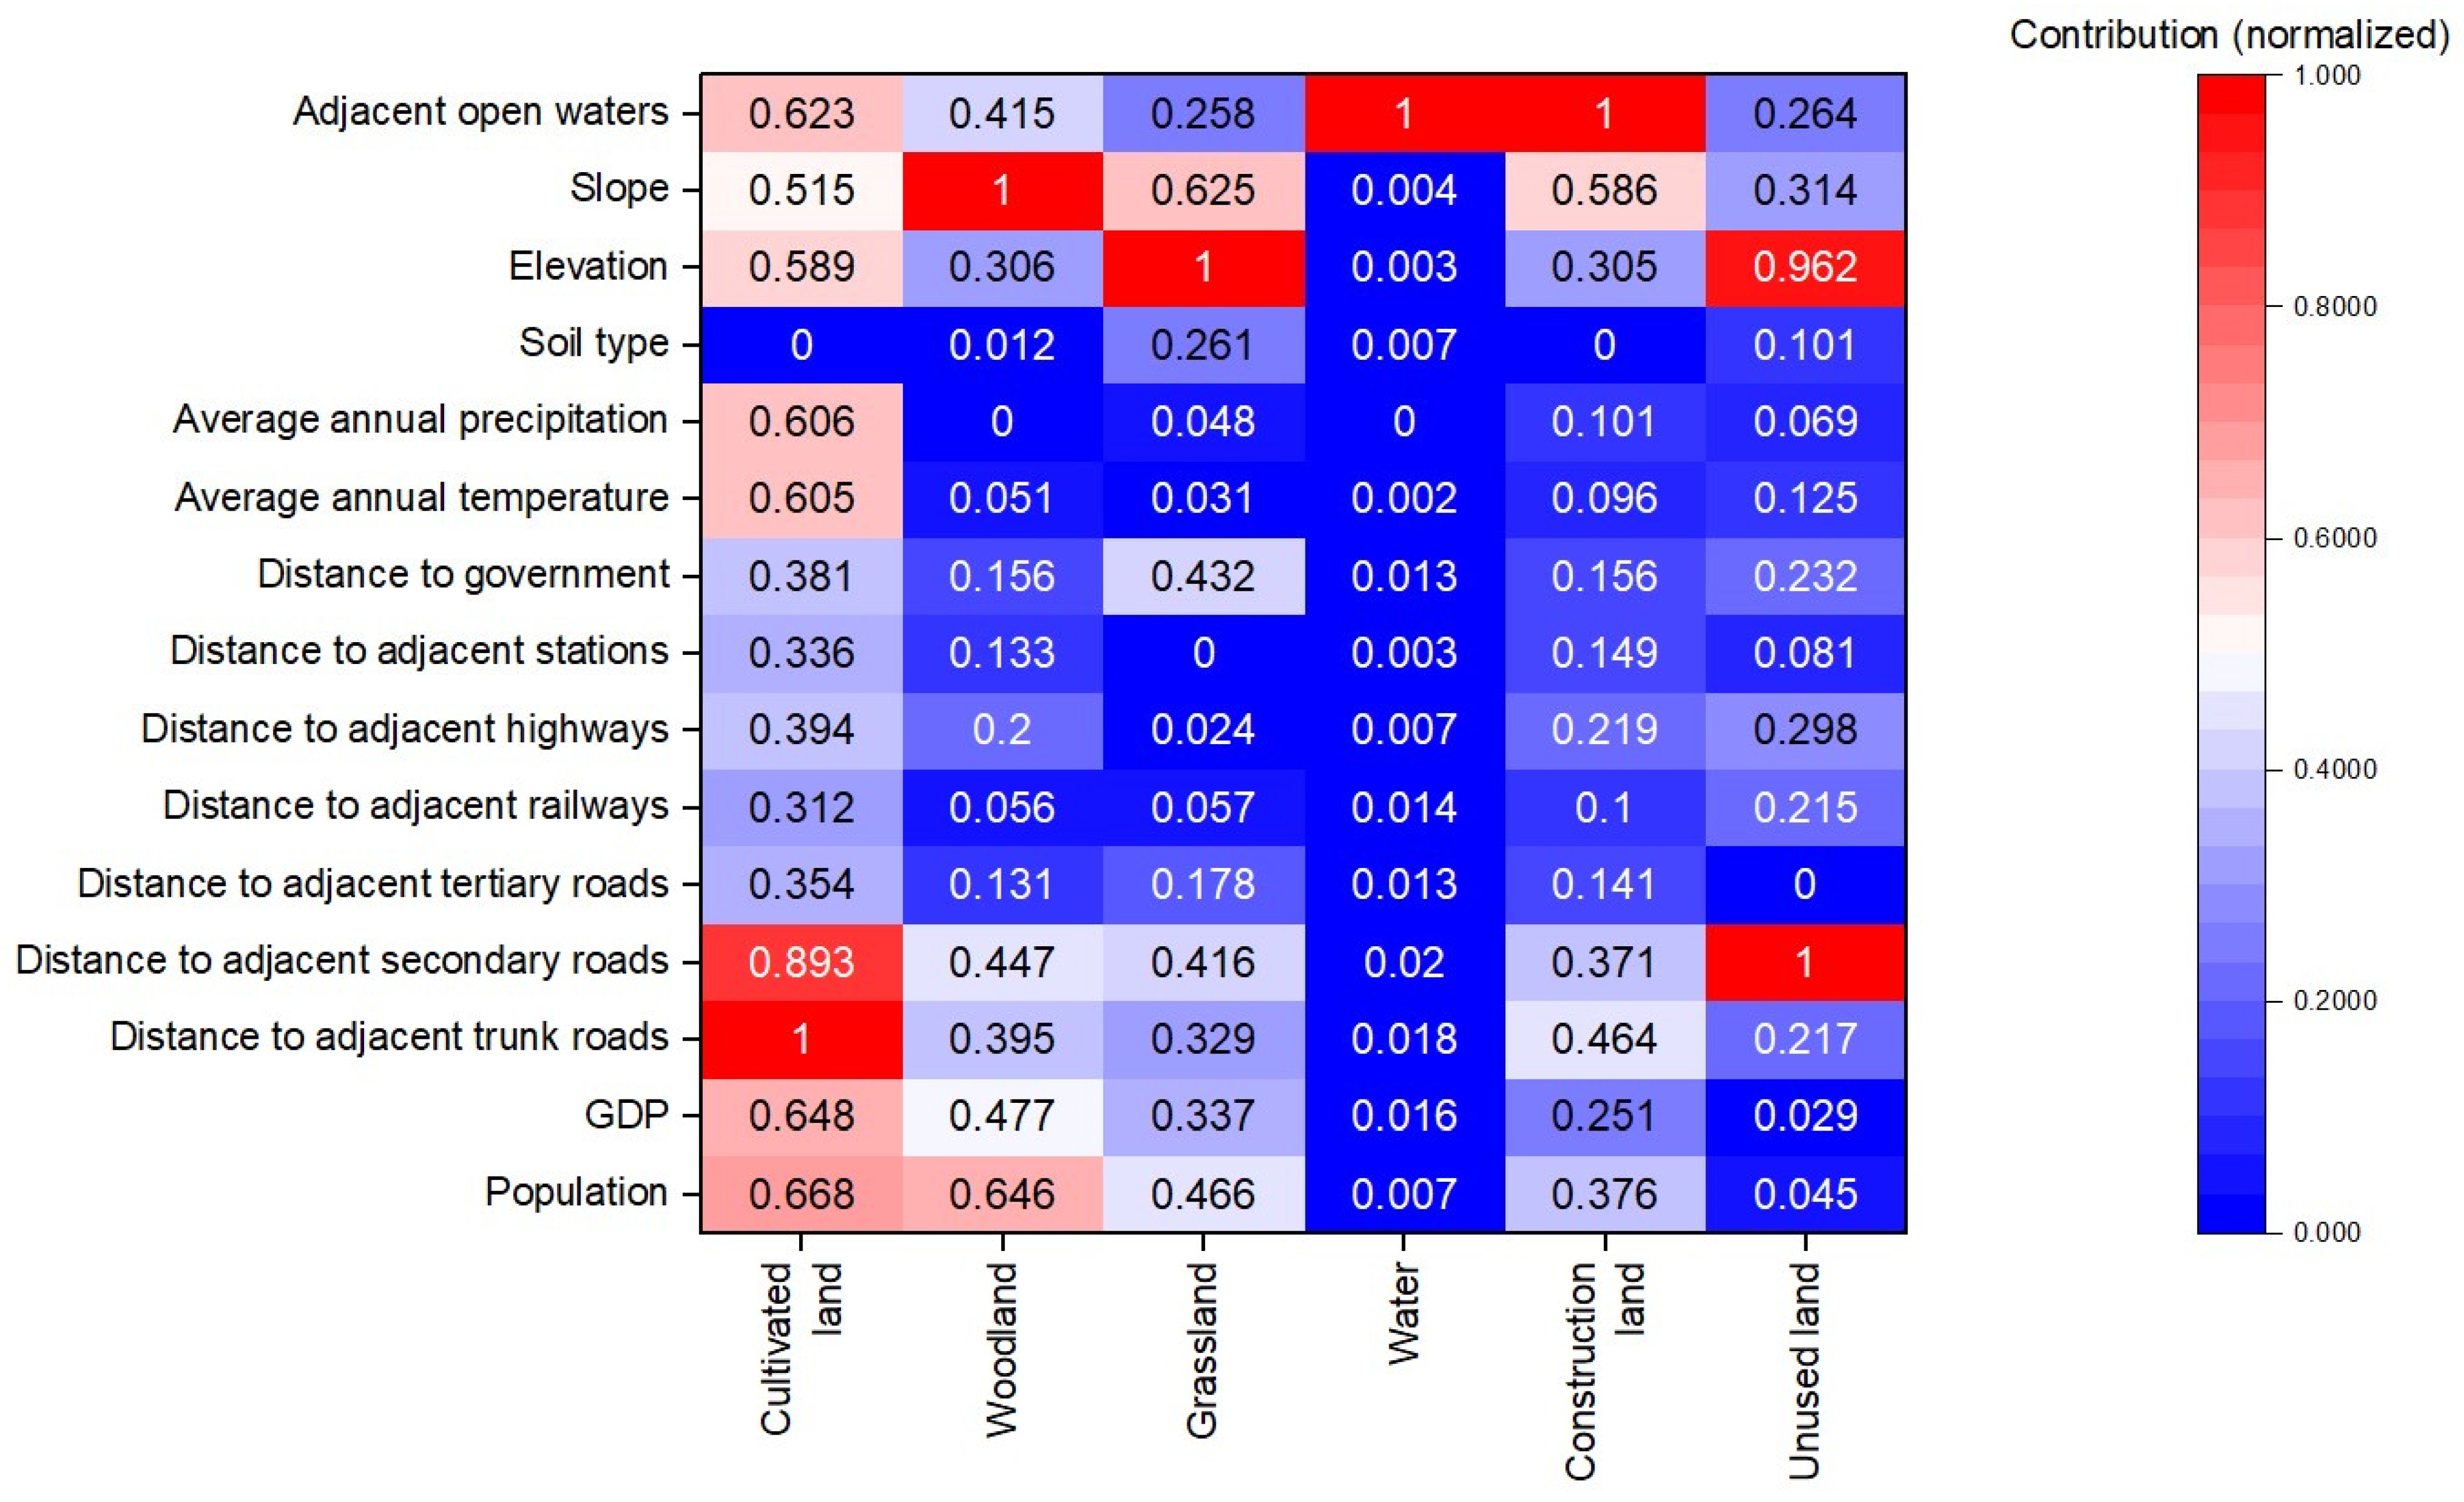
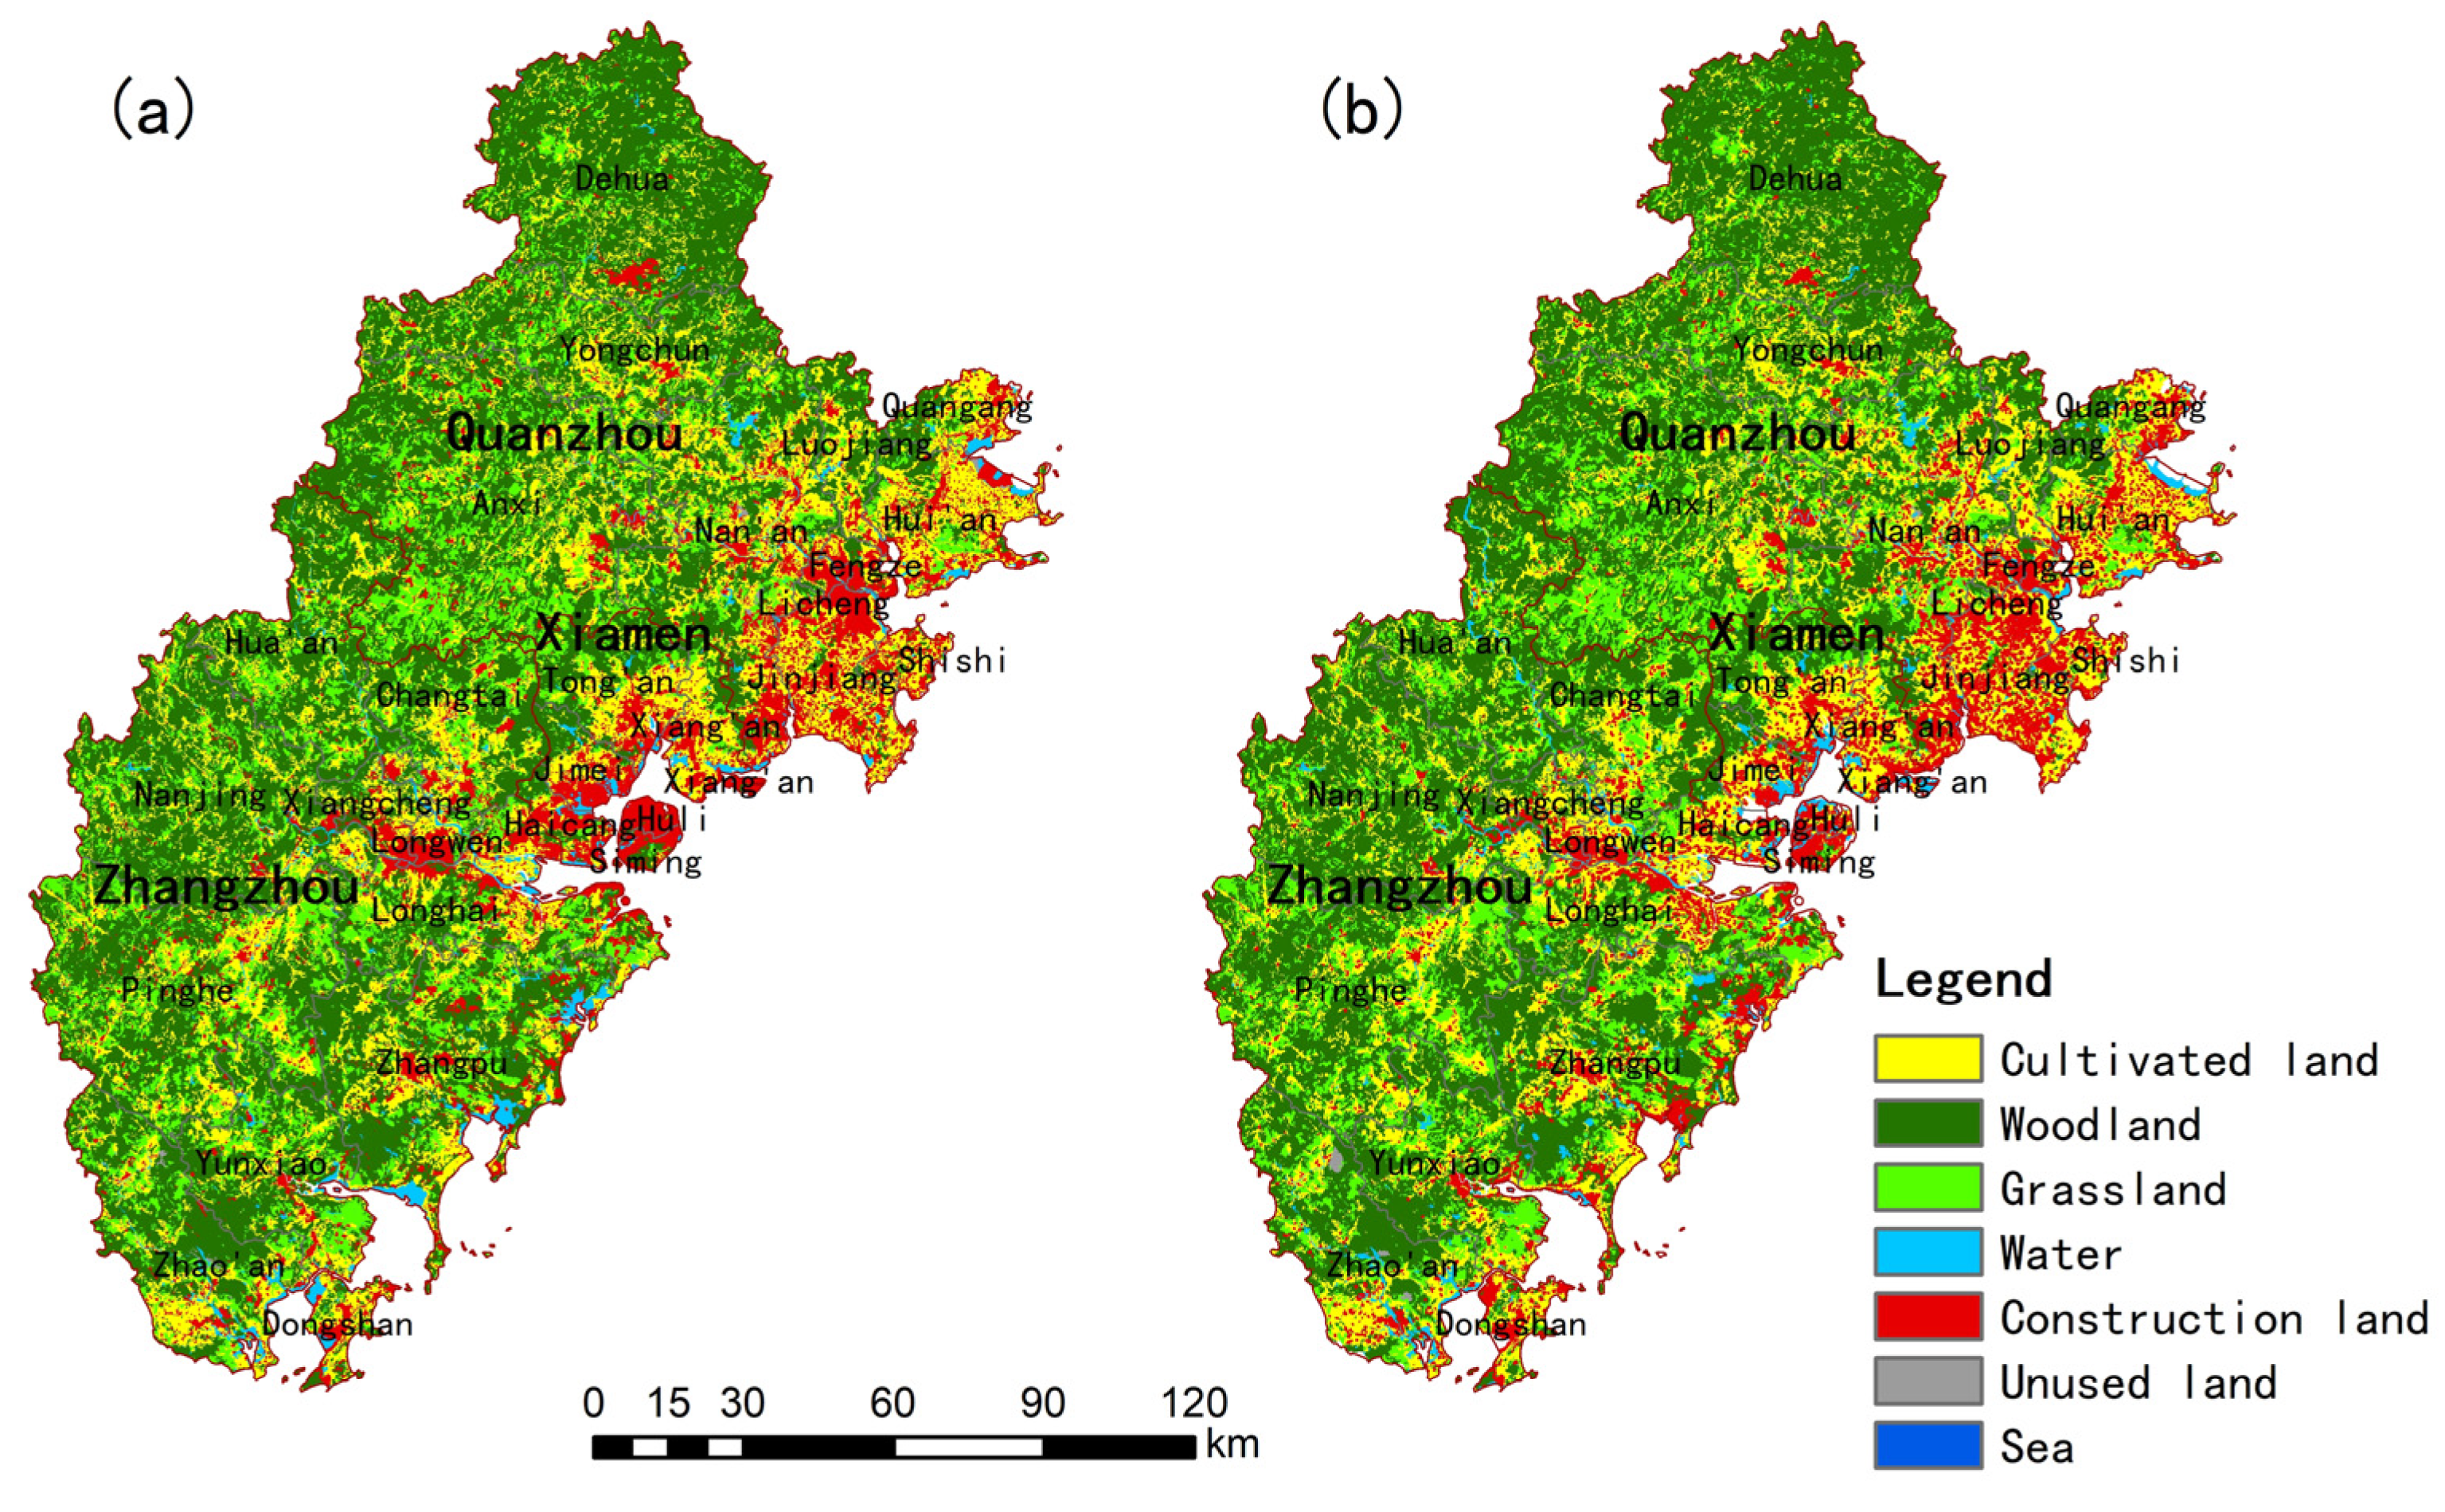
The extent to which various factors contribute to the growth of each land use type can be evaluated using the PLUS model. The findings demonstrate that the distance to trunk roads is the most important potential factor influencing land use change on cultivated land; slope, population size, and GDP factors are the main drivers of land use change on woodland; elevation and slope are the main drivers on grassland; and watersheds are hardly influenced by factors other than themselves. Watershed borders, the distribution of trafficable roads, and slope affect the amount of construction land; the distance of secondary roads and elevation are potential change agents for unused land (Figure 8). The land use distribution in 2020 was predicted (Figure 9b) and contrasted with the actual land use situation (Figure 9a). The validation indicates that the Kappa coefficient is 0.7868, the FoM (Figure of Merit) value is 0.1297, and the overall accuracy is 0.8572. The accuracy assessment results are feasible, which suggests that the driving factors selected based on the PLUS model in this study are applicable for simulating and predicting future land use changes in the Xiamen–Zhangzhou–Quanzhou urban agglomeration.
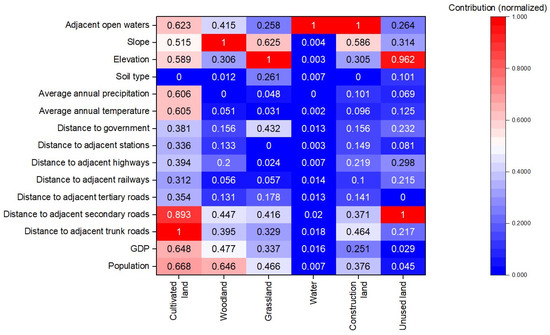
Figure 8.
The contribution of the influencing factors, based on the random forest regression model. The contribution has been normalized.
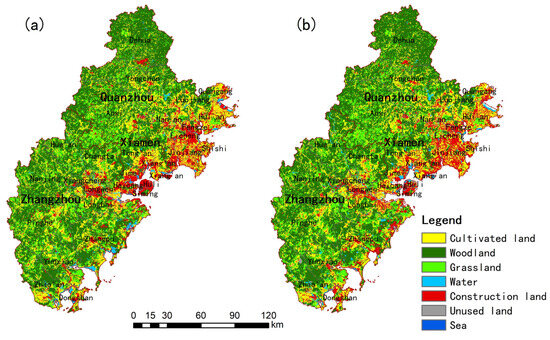
Figure 9.
Applicability of the PLUS model: (a) actual land use in 2020; (b) simulation results in 2020.
Using the year 2000 as the base period and the year 2020 as the current period for the land use of the Xiamen–Zhangzhou–Quanzhou urban agglomeration, two development scenarios for the year 2060 are identified, namely, giving priority to the preservation of the natural environment and satisfactory urban development. The results show that by 2060, under both scenarios, cropland, woodland, and grassland continue to decrease, and aquatic and built-up areas continue to increase, with cropland and grassland decreasing by 136,311.66 ha and 27,104.94 ha, respectively, and construction land increasing by 190,053.81 ha (Table 8). Under the urban development priority scenario, woodland decreases by 70,607.61 ha, water area increases by 40,139.46 ha, and unused land increases by 419.49 ha; under the ecological development priority scenario, woodland decreases by 30,250.53 ha, water area increases by 657.99 ha, and unused land decreases by 456.12 ha. A comparison of land use types between the two development scenarios shows that in the urban priority development scenario, more woodland is converted to water and unused land, and the area of hard-to-use land, such as sand, gobi, and bare rocky terrain, increases, while reservoirs and ponds are built to ensure the quality of urban life. In the ecological priority development scenario, further slowing down the degradation of forest land from the perspective of increasing vegetation coverage, developing the landscape pattern, and enhancing species diversity improve the ecological resilience of the research area (Figure 10).
Table 8.
Structure of land use and carbon stocks in 2060 (Area: ha; carbon stock: Mg).
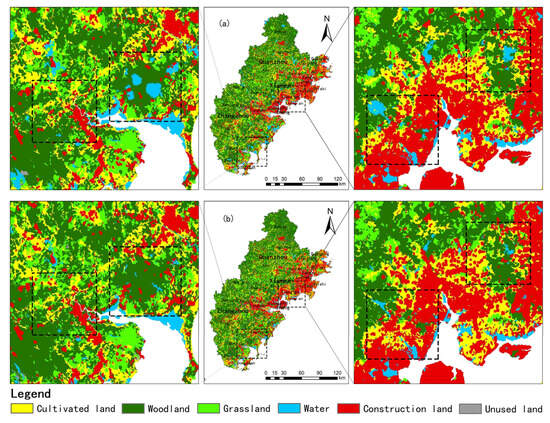
Figure 10.
Land use projections for 2060: (a) urban priority development scenario; (b) ecological priority development scenario.
According to the carbon stock structure table (Table 8), under the urban priority development scenario, carbon stocks are reduced by a total of 41,712,443.35 Mg compared to 2020, with woodland showing the largest reduction of 22,580,313.68 Mg, or an average annual reduction of 564,507.84 Mg. Cultivated land is next, with a reduction of 17,067,582.95 Mg over 40 years, or an average annual reduction of 426,689.57 Mg. Under the ecological priority scenario, carbon stocks are reduced by a total of 29,577,580.48 Mg. Cultivated land experiences the highest reduction in carbon stocks, with an average yearly decline of 426,689.57 Mg. Woodland experiences the second-largest reduction of 9,674,119.49 Mg, with an average annual decrease of 241,852.99 Mg. Due to an increase in lower carbon-stock land being used for construction, a decrease in higher carbon-stock cultivated land and woodland, and a reduction to provide ecological services, the total carbon stock declines at different rates under both development scenarios, compared to 2020. When comparing the two scenarios (Figure 11), it can be seen that the urban development priority scenario’s low-carbon-stock areas are concentrated in Quanzhou City’s eastern bay area, Xiamen Island and its surrounding areas, and Zhangzhou City’s bay area with Xiangcheng, Longwen, Longhai, and Zhangpu counties, while there are almost no high-carbon-stock areas from Quanzhou Port southward to the coast of Zhangzhou Port. Under the ecological development priority scenario, Zhangpu, Hua’an, Yunxiao, and Dehua counties in Zhangzhou City preserve their original pattern of high carbon concentrations and are less impacted by the fragmentation of low-carbon-stock areas caused by urban expansion.
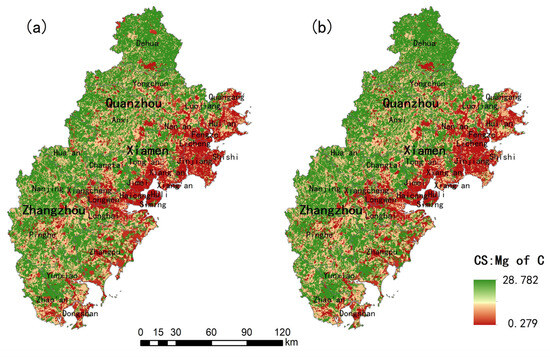
Figure 11.
Projected distribution of carbon stocks in 2060 in the Xiamen–Zhangzhou–Quanzhou urban agglomeration: (a) urban development priority scenario; (b) ecological development priority scenario.
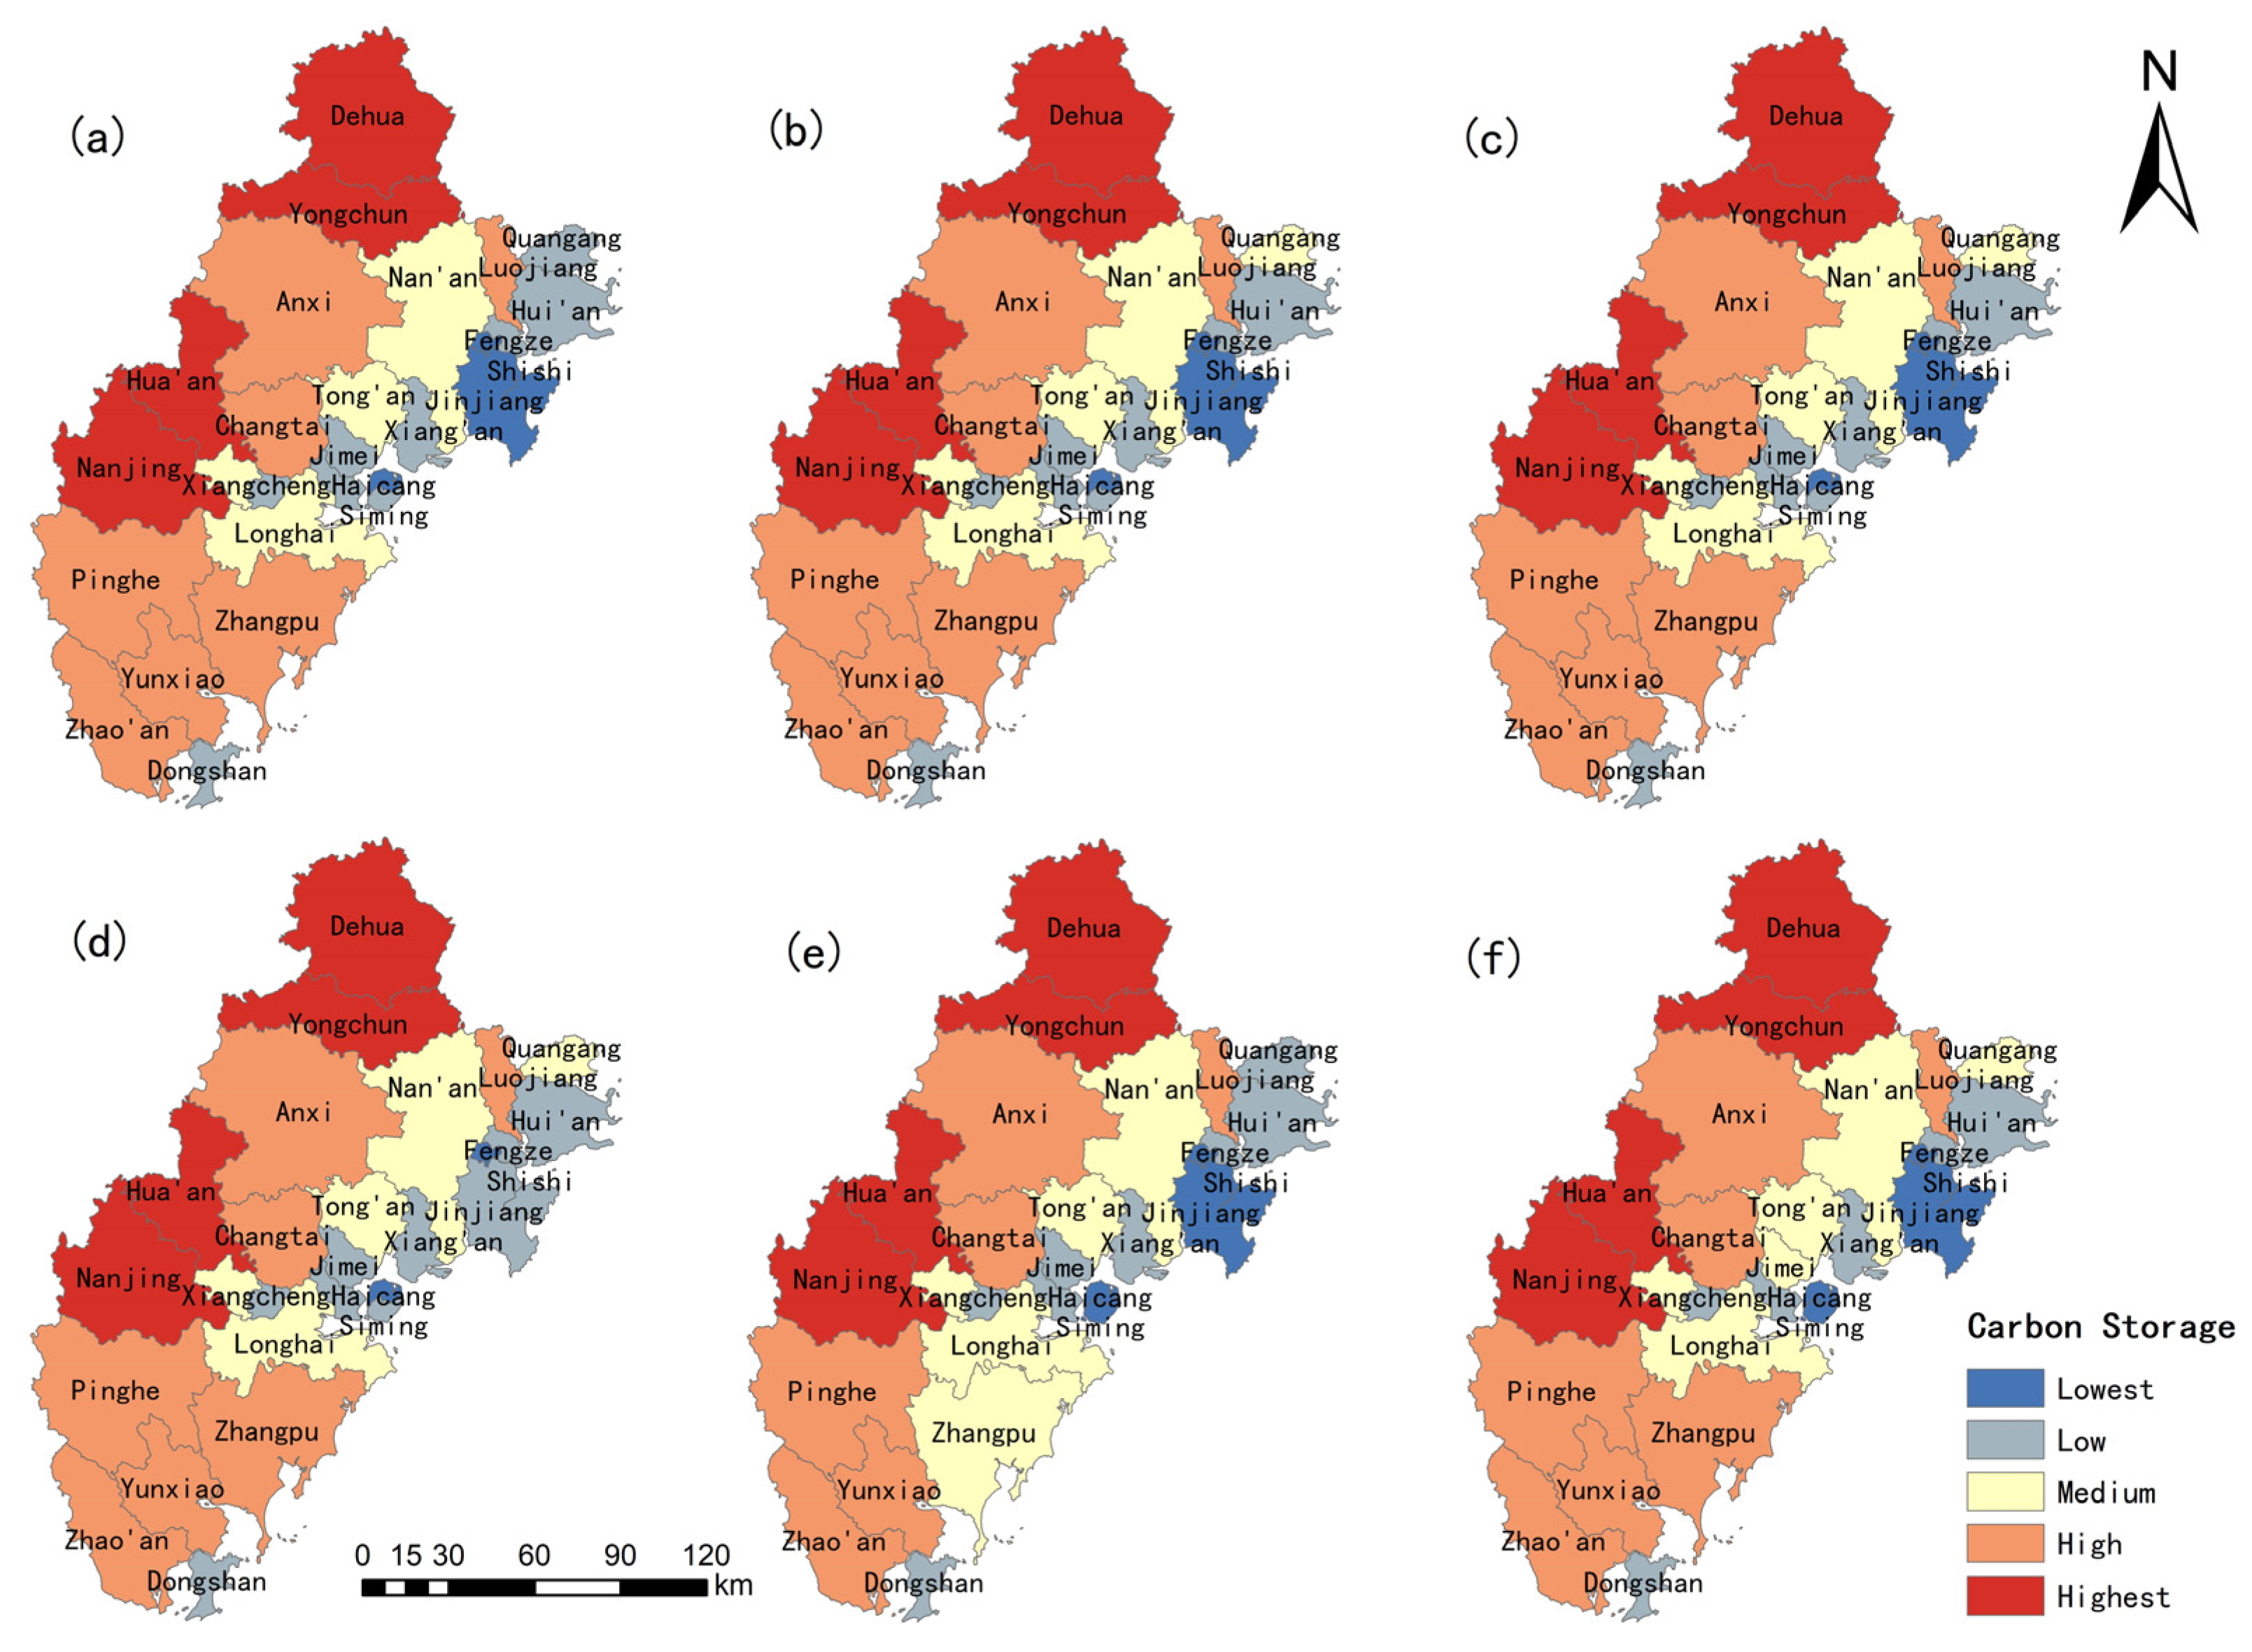
The average carbon stock of each county-level administrative region was divided into lowest carbon-stock areas, low-carbon-stock areas, medium-carbon-stock areas, high-carbon-stock areas, and highest carbon-stock areas, using the natural breakpoint method. This allows us to visualize the spatial and temporal evolution of the average carbon stock in the Xiamen–Zhangzhou–Quanzhou urban agglomeration from 2000 to 2060. The results indicate that, with the exception of Quanzhou Quangang district, which was upgraded from a low-carbon-storage region to a medium-carbon-storage area, the average carbon storage rank of administrative districts did not significantly change between 2000 and 2015. Jinjiang and Shishi cities in Quanzhou went from having the lowest carbon storage to having low carbon storage by 2020. The average carbon stock ranking is the same for all county-level administrative regions in 2060 under both the urban development priority scenario and the ecological development priority scenario, with the exception of Zhangpu County, Quangang County, and Jimei County, which rise by one level of average carbon stocks under the ecological protection scenario, indicating that these counties’ extensive forest areas become a potential area for maintaining carbon stock. The average carbon stock in Siming County in Xiamen City decreases, changing it from a low-carbon-storage area to a lowest storage area in 2060, compared to 2020. Jinjiang and Shishi cities in Quanzhou City change from low-carbon-storage areas to lowest storage areas, and Quangang County in Quanzhou City changes from a medium-carbon-storage area to a low-carbon-storage area. Dehua, Yongchun, Hua’an, and Nanjing counties in the northwest of the urban agglomeration consistently maintained their position in the highest carbon storage zone across the four periods, which is a crucial ecological safety barrier for preserving ecosystem structure, functions, and processes. As a result of being in the lowest carbon storage zone, Huli County in Xiamen and Fengze County in Quanzhou experienced the greatest carbon loss (Figure 12).

Figure 12.
Gradation of average carbon stocks by administrative district; from (a–f) in order: 2000, 2010, 2015, 2020, 2060 (urban development priority scenario), and 2060 (ecological development priority scenario).
4. Discussion
4.1. Interpretation of Research
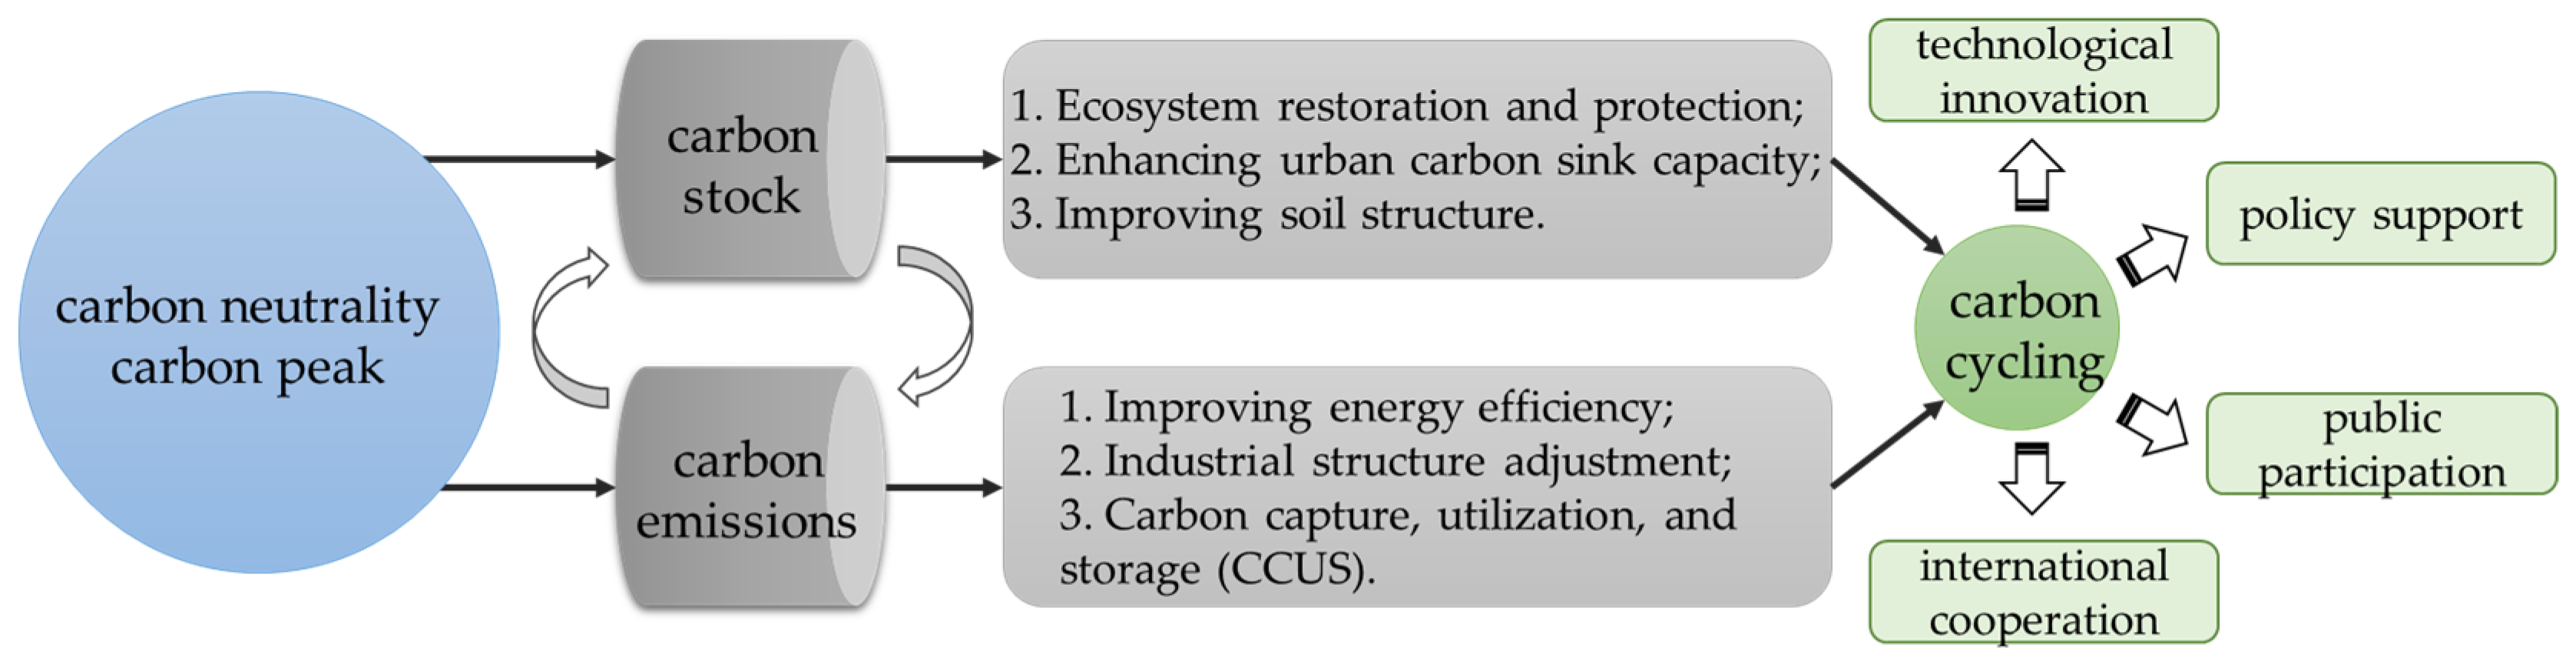
Based on the land use data and carbon pool data from 2000 to 2020, we dynamically analyzed the features of land use change and the evolution of spatial and temporal distribution pattern of carbon stock in the Xiamen–Zhangzhou–Quanzhou urban agglomeration. We also took into account the spatial correlation between land use structure and carbon stock, and we categorized the distribution areas with high and low carbon stock concentrations. In order to predict the carbon stocks under the priority natural and priority urban growth directions, the land use simulation data from 2060 were then coupled with socioeconomic, public administration, climatic, and geographic–environmental data, and, finally, the Xiamen–Zhangzhou–Quanzhou urban agglomeration’s historical series of changes in carbon stocks were zoned. The research findings can provide recommendations on land use and ecological restoration for policy, industry, and public administration sectors, which will contribute to the achievement of China’s carbon neutrality and carbon peak goals by 2060 (Figure 13).
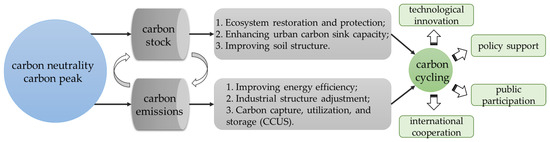
Figure 13.
The ways to achieve China’s dual carbon goals.
In this study, the proportions of arable land, forest land, and grassland in the Xiamen–Zhangzhou–Quanzhou urban agglomeration all showed a declining trend. Concurrently, the proportion of construction land significantly increased, while the proportions of water bodies and unused land slightly rose. The growth in construction land was primarily reflected in the expansion of urban land and other types of construction land. The increase in the proportion of water bodies was mainly attributed to the expansion of reservoirs, ponds, and lakes. The rise in unused land was predominantly characterized by the growth in the area of swamplands. Construction land exhibited a notable agglomeration in the central urban areas of Quanzhou, Xiamen, and Zhangzhou, which are close to the Taiwan Strait. Among them, Xiamen had the highest degree of agglomeration of construction land, followed by Quanzhou and Zhangzhou. This phenomenon is underpinned by the rapid development of commerce and industry, as well as population mobility, driven by the Xiamen Economic Zone; these are factors that have collectively propelled the dramatic expansion of urban land in the Xiamen–Zhangzhou–Quanzhou region over the past two decades. The eastern coastal area along the Taiwan Strait is a key development zone for the urban agglomeration, where land use development intensity is high, and urban construction land shows a clear pattern of agglomeration, leading to the significant encroachment and fragmentation of the original arable land. In contrast, the western forest region, dominated by forest land and grassland, is an important area for the provision of ecosystem services in Fujian Province. The Xiamen–Zhangzhou–Quanzhou urban agglomeration has formed a unique spatial pattern of land use, with the eastern coastal bay area of Quanzhou, the Xiamen Island and its surrounding areas, and the eastern urban area of Zhangzhou as the economic centers, and the western forest region and coastal forest belt serving as ecological barriers. The formation of this pattern is of significant importance for the sustainable development of the region and also poses new challenges for land use planning and management.
Despite the reduction in the areas of cultivated land, woodland, and grassland, these land use types continue to be the primary carbon sinks within the urban agglomeration, aligning with the conclusions of other researchers [70,71,72]. The Xiamen–Zhangzhou–Quanzhou urban agglomeration experienced a rapid depletion of ecological resources and environment due to the swift expansion of urban scale between 2000 and 2010. Although the rate of ecological consumption slowed down after the introduction of ecological civilization construction policies, cultivated land, woodland, and grassland still suffered significant encroachment during the urbanization process. The degradation of the ecological environment and the resulting changes in land use types have weakened the carbon sequestration capacity of the study area and had a negative impact on the overall regional carbon storage. The increase in construction land area and the decrease in cultivated land, woodland, and grassland are the main reasons for the reduction in the ecosystem carbon storage of the study area, consistent with the findings of Zhao et al. [73]. This discovery emphasizes the importance of protecting and rationally managing land resources during the urbanization process to ensure the stability of regional carbon storage and the sustainability of ecosystem services.
Additionally, traffic roads were found to be the most significant factor affecting changes in arable land, while changes in forest land were mainly influenced by slope, population size, and GDP. Changes in grassland were more affected by elevation and slope. The changes in water bodies were hardly influenced by other factors, and the expansion of construction land was affected by the boundaries of water bodies, the distribution of traffic roads, and slope. Changes in unused land were mainly caused by the distribution of secondary roads and elevation factors. This is different from Zhou’s conclusion [74], where, despite being areas with ecological protection zones, regional development and topographic conditions were the main driving factors for the expansion or reduction of various land use types. This might be related to the urban development strategy of the study area, where some cities develop by relying on well-developed transportation, while others grow centered around population aggregation areas. The commonality, however, is that urban construction and human activities limit the development of ecological space.
Furthermore, under both the nature conservation priority and urban development priority scenarios, the areas of arable land, forest land, and grassland will continue to decrease, while the areas of water bodies and construction land will persist in increasing. A comparison of the two development scenarios reveals that, under the urban development priority scenario, a greater amount of forest land will be converted into water bodies and unused land. Additionally, the area of land that is difficult to utilize will increase during the process of constructing water conservancy facilities such as reservoirs and ponds. In contrast, under the ecological development priority scenario, there will be a greater emphasis on slowing the degradation of forest land, enhancing the ecological resilience of the study area by increasing vegetation cover, improving landscape patterns, and increasing species diversity. These findings are of significant importance for formulating future land use planning and policies for the Xiamen–Zhangzhou–Quanzhou urban agglomeration, particularly in providing valuable references for balancing urban development and ecological conservation.
4.2. Contributions and Limitations
Based on data on land use change and carbon intensity over the previous 20 years, the PLUS and InVEST models were used in this study to simulate changes in land use and carbon stock over the next 40 years. We also analyzed the spatial correlation between the distribution of high and low carbon stock values, offering a reference method for simulating land use and carbon stock distribution under various scenarios. We offered a way to simulate how land use and carbon stocks are distributed under various scenarios, which benefits regional carbon cycle research, reduces climate change, and promotes sustainable regional development. The accuracy test results were plausible and the simulation results were largely compatible with the observed land use pattern, suggesting that the PLUS model was more accurate at predicting future land use changes in the Xiamen–Zhangzhou–Quanzhou urban agglomeration.
In this study, land use over the next 40 years was predicted using 15 development indicators related to urban quality improvement and environmental protection; however, actual development is influenced by additional factors such as laws and policies, unforeseen disasters, and climate change. Additionally, the carbon pool of the InVEST model created in this work only pertains to primary land types due to restrictions on data access, and the carbon intensity of each land use type is assumed to remain constant over time. The carbon density of different secondary land use patterns varies somewhat in reality and is influenced by seasonal turnover, biotic stock, and ground vegetation type, and soils with higher biomass have greater potential for carbon storage. It is worth mentioning that the impact of temporal factors on the carbon density of land use deserves attention. Establishing a model that tracks the changes in carbon density over time can facilitate more accurate predictions of carbon stocks. Future research can increase the accuracy of land use estimates and carbon stock simulation results by taking into account more growth scenarios and development indicators and by using field measurements and modeling techniques.
4.3. Proposals for Future Development
Since 2000, as urbanization has accelerated, the region’s spatial pattern of land use has undergone significant changes, as the growth of built-up regions has been accompanied by a danger to natural resources. The major causes of the drop in ecosystem carbon stocks in the study area are the rise in land used for building, which has a limited capacity to store carbon, and the decrease in cultivated land, woodland, and grassland, which have a high capacity to store carbon. Planning decisions that optimize land use patterns, establish synergies between urban and rural development, and balance environmental preservation and economic development are therefore excellent ways to increase regional carbon stocks.
It is necessary to optimize the spatial arrangement of urban functions to take into account high ecological efficiency, high production efficiency, and high quality of life, to create urban green spaces with the capacity to sequester carbon and protect functions, and to promote the ecological barriers of agriculture and forestry in the surrounding areas. In addition, it is necessary to return ecologically significant and important cultivated land that cannot be used for agriculture to the woodlands, in order to preserve regional ecology and food security and to gradually convert former “non-agricultural” and “non-food” land back to cultivated land, in order to convert it into high-standard agricultural land that complies with the demands of the new era. It is also necessary to promote low-carbon development in urban areas and expand land uses that have a stronger impact on carbon storage, such as cultivated land, woodland, and grassland, to improve the carbon absorption and regulation capacity of ecosystems.
5. Conclusions
We constructed a referenceable calculation method to test and predict the impact of land use changes on the spatial and temporal distribution patterns of carbon stocks, and subsequently drew the following conclusions.
- (1)
- Taking the Xiamen–Zhangzhou–Quanzhou urban agglomeration as an example, we studied land use from 2000 to 2020 under two scenarios in which the area of cultivated land, woodland, and grassland continues to decrease, and the area of watershed and construction land continues to increase until 2060. Under the urban development priority scenario, more woodland is converted to water and unused land, while reservoirs and ponds are built to provide quality urban living, and the area of hard-to-use land, such as sandy and bare rock areas, increases. An ecological development scenario with greater mitigation of forest degradation should be prioritized to improve the ecological resilience of the study area, in terms of increasing vegetation cover, improving landscape patterns, and increasing species diversity. Cultivated land, woodland, and grassland areas are heavily used in the process of urbanization, and the change in land use type in the process of ecological degradation negatively affects the overall carbon stock of the regional environment.
- (2)
- The study found that the distance to trunk roads was the most important potential driver of land use change in cultivated land; land use change in forests was mainly influenced by slope, population size, and GDP factors; and land use change in grassland was more influenced by elevation and slope. The analysis of the spatial heterogeneity of carbon stock changes under different scenarios showed that a massive conversion of woodland to building land and of watershed and unused land were the main drivers of carbon stock decline; under the ecological priority scenario, the conversion of cropland, woodland, and grassland to building land was the main driver of carbon stock decline.
- (3)
- The spatial correlation analysis of carbon stocks in the Xiamen–Zhangzhou–Quanzhou urban agglomeration shows that the hot spots are mainly located in the northern part of Quanzhou City, the northwestern part of Xiamen City, and the western part of Zhangzhou City. The cold spots of carbon storage are concentrated in the eastern bay of Quanzhou City, Xiamen Island and its surroundings, and the southeastern port area of Zhangzhou City, which are the main development areas of the three cities. Overall, the hot spot areas of the study area have a predominantly westerly ecological barrier complemented by the seashore forest, while the cold spot areas are concentrated along the estuary and bay.
- (4)
- A comparison of the carbon stock patterns of the two scenarios for the Xiamen–Zhangzhou–Quanzhou urban agglomeration in 2060 shows that, under the urban development priority scenario, the difference between the predicted carbon storage values is 12,134,862.88 Mg. The low-carbon-stock areas are concentrated in the eastern bay of Quanzhou city, Xiamen Island and its surroundings, and the middle of Zhangzhou city; in the ecological development priority scenario, Zhangpu County, Hua’an County, Yunxiao County, and Dehua County are the concentrated areas with high carbon storage value. Dehua, Yongchun, Hua’an, and Nanjing counties are important ecological safety barriers for maintaining ecosystem functions in the region; Huli and Fengze counties have significant carbon losses; and Zhangpu county is a potential area for maintaining carbon storage in the urban agglomeration in the future.
Author Contributions
Conceptualization, S.Z. and J.Z.; methodology, S.Z. and J.Z.; software, X.L.; validation, S.Z., X.L., J.T. and J.Z.; formal analysis, X.L.; investigation, S.Z., J.T. and J.Z.; resources, S.Z., J.T. and J.Z.; data curation, X.L. and J.T.; writing—original draft preparation, S.Z. and X.L.; writing—review and editing, S.Z., J.T. and J.Z.; visualization, X.L.; supervision, S.Z., J.T. and J.Z.; project administration, J.T. and J.Z.; funding acquisition, S.Z., X.L. and J.T. All authors have read and agreed to the published version of the manuscript.
Funding
This research was funded by the National Natural Science Foundation of China, grant number 52078320; the National Natural Science Foundation of China, grant number 52378065; the Tianjin Research Innovation Project for Postgraduate Students, grant number 2022SKYZ323; and the Tianjin Research Innovation Project for Postgraduate Students, grant number 2022SKY385.
Data Availability Statement
The data presented in this study are available on request from the corresponding author.
Acknowledgments
We appreciate the developers of the relevant technologies and datasets, as well as the editors and reviewers for helpful comments.
Conflicts of Interest
The authors declare no conflicts of interest.
References
- Xu, J.; Guan, Y.; Oldfield, J.; Guan, D.; Shan, Y. China carbon emission accounts 2020–2021. Appl. Energy 2024, 360, 122837. [Google Scholar] [CrossRef]
- Gu, T.W.; Peng, J. Nature-based solutions for carbon peaking and carbon neutrality goals: Key issues. Acta Ecol. Sin. 2023, 43, 3384–3391. [Google Scholar] [CrossRef]
- Li, X.T.; Jia, B.Q.; Li, F.; Ma, J.; Liu, X.P.; Feng, F.; Liu, H.L. Effects of multi-scale structure of blue-green space on urban forest carbon density: Beijing, China case study. Sci. Total Environ. 2023, 883, 163682. [Google Scholar] [CrossRef]
- Luo, W.; Chen, J.; Lu, Y.Y. Evoluion characteristics and improvement path of terrestrial ecosystem carbon storage in Zhejiang Province from 2000 to 2020. Environ. Pollut. Control 2023, 45, 413–418. [Google Scholar] [CrossRef]
- Zhang, M.Q.; Chen, B.; Zhao, M. Analysis of the carbon stock and carbon neutral potential of wetlands in Guizhou Province. Bull. Geol. Sci. Technol. 2023, 42, 315–326. [Google Scholar] [CrossRef]
- Chen, H.X.; Tang, L.N.; Qiu, Q.Y.; Wu, T.; Wang, Z.Y.; Xu, S.; Xiao, L.S. Coupling between Rural Development and Ecosystem Services, the Case of Fujian Province, China. Sustainability 2018, 10, 524. [Google Scholar] [CrossRef]
- Shi, T.G.; Zhang, J.; Shi, H. Spatial-Temporal Evolution and Influencing Factors of Ecological Efficiency of Coastal Urban Agglomerations in Eastern China. Ecol. Econ. 2023, 39, 90–100. [Google Scholar]
- Yin, X.Y.; Zong, H.M.; Qu, M.H.; Wang, C.J. Research on coordinated development and driving mechanism of port-city relationship of coastal ports in China. Hum. Geogr. 2023, 38, 64–70. [Google Scholar] [CrossRef]
- Eze, S.; Magilton, M.; Magnone, D.; Varga, S.; Gould, I.; Mercer, T.G.; Goddard, M.R. Meta-analysis of global soil data identifies robust indicators for short-term changes in soil organic carbon stock following land use change. Sci. Total Environ. 2023, 860, 160484. [Google Scholar] [CrossRef]
- Jiang, H.P.; Guo, H.D.; Sun, Z.C.; Yan, X.F.; Zha, J.L.; Zhang, H.L.; Li, S.J. Urban-rural disparities of carbon storage dynamics in China’s human settlements driven by population and economic growth. Sci. Total Environ. 2023, 871, 162092. [Google Scholar] [CrossRef]
- Su, K.; Wei, D.Z.; Lin, W.X. Influencing factors and spatial patterns of energy-related carbon emissions at the city-scale in Fujian province, Southeastern China. J. Clean. Prod. 2020, 244, 12. [Google Scholar] [CrossRef]
- Tang, L.P.; Ke, X.L.; Zhou, Q.S.; Wang, L.Y.; Koomen, E. Projecting future impacts of cropland reclamation policies on carbon storage. Ecol. Indic. 2020, 119, 106835. [Google Scholar] [CrossRef]
- Cai, G.; Lin, Y.Y.; Zhang, F.Z.; Zhang, S.H.; Wen, L.S.; Li, B.Y. Response of Ecosystem Service Value to Landscape Pattern Changes under Low-Carbon Scenario: A Case Study of Fujian Coastal Areas. Land 2022, 11, 2333. [Google Scholar] [CrossRef]
- Zou, N.; Wang, C.; Wang, S.; Li, Y. Impact of ecological conservation policies on land use and carbon stock in megacities at different stages of development. Heliyon 2023, 9, e18814. [Google Scholar] [CrossRef]
- Feitosa, T.B.; Fernandes, M.M.; Santos, C.A.G.; Silva, R.M.D.; Garcia, J.R.; Araujo Filho, R.N.D.; Fernandes, M.R.D.M.; Cunha, E.R.D. Assessing economic and ecological impacts of carbon stock and land use changes in Brazil’s Amazon Forest: A 2050 projection. Sustain. Prod. Consum. 2023, 41, 64–74. [Google Scholar] [CrossRef]
- Peng, Y.; Cheng, W.; Xu, X.; Song, H. Analysis and prediction of the spatiotemporal characteristics of land-use ecological risk and carbon storage in Wuhan metropolitan area. Ecol. Indic. 2024, 158, 111432. [Google Scholar] [CrossRef]
- Lu, Y.Y.; Xu, X.L.; Li, J.C.; Feng, X.H.; Liu, L.Y. Research on the spatio-temporal variation of carbon storage in the Xinjiang Tianshan Mountains based on the InVEST model. Arid Zone Res. 2022, 39, 1896–1906. [Google Scholar] [CrossRef]
- Zhuang, Z.X.; Xie, M.Q.; Zhang, W.P.; Wang, Q.N. Temporal and Spatial Changes and Multi-scenario Simulation Prediction of Carbon Storage Based on FLUS-InVEST Model: A Case Study of Chengdu–Deyang–Meishan–Ziyang Area. Landsc. Archit. 2022, 29, 38–44. [Google Scholar] [CrossRef]
- Hou, J.K.; Chen, J.J.; Zhang, K.Q.; Zhou, G.Q.; You, H.T.; Han, X.W. Temporal and Spatial Variation Characteristics of Carbon Storage in the Source Region of the Yellow River Based on In VEST and GeoSoS-FLUS Models and Its Response to Different Future Scenarios. Environ. Sci. 2022, 43, 5253–5262. [Google Scholar] [CrossRef]
- Fryer, J.; Williams, I.D. Regional carbon stock assessment and the potential effects of land cover change. Sci. Total Environ. 2021, 775, 145815. [Google Scholar] [CrossRef]
- Gao, S.C.; Chen, Y.Q.; Chen, Z.Z.; Lei, J.R.; Wu, T.T. Carbon storage and its spatial distribution characteristics of forest ecosystems in Hainan Island, China. Acta Ecol. Sin. 2023, 43, 3558–3570. [Google Scholar] [CrossRef]
- Zhang, Z.; Jiang, W.G.; Peng, K.F.; Wu, Z.F.; Ling, Z.Y.; Li, Z. Assessment of the impact of wetland changes on carbon storage in coastal urban agglomerations from 1990 to 2035 in support of SDG15.1. Sci. Total Environ. 2023, 877, 162824. [Google Scholar] [CrossRef]
- Ahirwal, J.; Gogoi, A.; Sahoo, U.K. Stability of soil organic carbon pools affected by land use and land cover changes in forests of eastern Himalayan region, India. Catena 2022, 215, 106308. [Google Scholar] [CrossRef]
- Ablikim, K.; Yang, H. Spatiotemporal variation of vegetation carbon stocks and its driving factors in the Urumqi River Basin. Ecol. Indic. 2024, 159, 111668. [Google Scholar] [CrossRef]
- Wu, F.; Wang, Z. Assessing the impact of urban land expansion on ecosystem carbon storage: A case study of the Changzhutan metropolitan area, China. Ecol. Indic. 2023, 154, 110688. [Google Scholar] [CrossRef]
- Bansal, J.C.; Engelbrecht, A.; Shukla, P.K. Predicting Forest Cover Change in Middle Atlas Morocco: A Logistic–CA–Markov Approach. In Computer Vision and Robotics Proceedings of CVR 2021; Springer Singapore Pte. Limited: Singapore, 2022; ISBN 9811682240/9789811682247. [Google Scholar]
- Li, S.F.; Hong, Z.L.; Xue, X.P.; Zhang, F.J.; Shi, W. Multi-Scenario Simulation of LUCC in Binzhou City Based on Logistic-CA-Markov Coupling Model. Res. Soil Water Conserv. 2022, 29, 292–299. [Google Scholar] [CrossRef]
- Huang, Q.; Mou, F.Y.; Zhang, Y.C.; Yang, M.; Chen, L.; Wang, J.X.; Tian, T.; He, Q.Y. Evolution and Prediction of Cultivated Land Landscape Pattern in Multi-level Watershed of Chongqing Based on ANN-CA model. Res. Soil Water Conserv. 2023, 30, 379–387. [Google Scholar] [CrossRef]
- Liu, R.Z.; Chen, H.R. Simulation of Urban Spatial Expansion and Growth Boundary in Hangzhou Based on ANN-CA Model. Resour. Environ. Yangtze Basin 2021, 30, 1298–1307. [Google Scholar] [CrossRef]
- Gebrehiwot, A.A.; Hashemi-Beni, L.; Kurkalova, L.A.; Liang, C.L.; Jha, M.K. Using ABM to Study the Potential of Land Use Change for Mitigation of Food Deserts. Sustainability 2022, 14, 9715. [Google Scholar] [CrossRef]
- Wang, Z.Y.; Shi, P.J.; Zhang, X.B.; Wang, Y.S.; Xie, X.Y. Simulation of Lanzhou urban land expansion based on multi-agent model. Chin. J. Appl. Ecol. 2021, 32, 2169–2179. [Google Scholar] [CrossRef]
- Nasiakou, S.; Vrahnakis, M.; Chouvardas, D.; Mamanis, G.; Kleftoyanni, V. Land Use Changes for Investments in Silvoarable Agriculture Projected by the CLUE-S Spatio-Temporal Model. Land 2022, 11, 598. [Google Scholar] [CrossRef]
- Yu, Z.L.; Zhao, M.S.; Gao, Y.F.; Wang, T.; Zhao, Z.D.; Wang, S.H. Land use simulation and multi-scenario prediction based on CLUE-S and PLUS models in Huaibei City. J. Agric. Resour. Environ. 2023, 13, 7142. [Google Scholar] [CrossRef]
- Liu, X.P.; Liang, X.; Li, X.; Xu, X.C.; Ou, J.P.; Chen, Y.M.; Li, S.Y.; Wang, S.J.; Pei, F.S. A future land use simulation model (FLUS) for simulating multiple land use scenarios by coupling human and natural effects. Landsc. Urban Plan. 2017, 168, 94–116. [Google Scholar] [CrossRef]
- Xu, C.M.; Chen, J.; Zhang, L.D.; Lin, S.; Qiu, R.Z.; Hu, X.S. Simulation of Regional Territorial Spatial Patterns Based on Major Function-Oriented Zoning and FLUS-Markov Model. Bull. Soil Water Conserv. 2022, 42, 155–165. [Google Scholar] [CrossRef]
- Fu, H.Y.; Chen, Y.H. Investigation on urban construction land use with a new structure optimization model-SD-MOP integrated model. China Civ. Eng. J. 2011, 44, 129–135. [Google Scholar] [CrossRef]
- Li, S.F.; Yan, L.; Pang, L.; Zhang, M.H.; Yan, X.; He, J.H.; Tang, Y. Research on Optimization of “Technology-Environmental-Economic” for Development Strategies in Resource—Intensive Area—Based on the SD-MOP Integrated Model. Sci. Technol. Manag. Res. 2015, 35, 74–77. [Google Scholar] [CrossRef]
- Liang, X.; Guan, Q.F.; Clarke, K.C.; Liu, S.S.; Wang, B.Y.; Yao, Y. Understanding the drivers of sustainable land expansion using a patch-generating land use simulation (PLUS) model: A case study in Wuhan, China. Comput. Environ. Urban Syst. 2021, 85, 101569. [Google Scholar] [CrossRef]
- Wang, Q.W.; Tian, J.; Zeng, J.; Wang, N. Construction of flood adaptation network and planning response of strategy urban agglomeration in the Min Delta based on scenario simulation. J. Hydraul. Eng. 2022, 53, 876–889. [Google Scholar] [CrossRef]
- Zhao, J.Y.; Cui, L.; Wang, J.; Chen, S. Multi-scenario simulation of urban green space development and construction Timeline based on PLUS model analysis: A case study of the central Zhanjiang City. Acta Ecol. Sin. 2023, 43, 18. [Google Scholar] [CrossRef]
- Nie, W.B.; Xu, B.; Yang, F.; Shi, Y.; Liu, B.T.; Wu, R.W.; Lin, W.; Pei, H.; Bao, Z.Y. Simulating future land use by coupling ecological security patterns and multiple scenarios. Sci. Total Environ. 2023, 859, 160262. [Google Scholar] [CrossRef]
- Zhang, K.; Huang, C.H.; Wang, Z.Y.; Wu, J.Y.; Zeng, Z.Q.; Mu, J.J.; Yang, W.Y. Optimization of “production-living-ecological” spaces based on DTTD-MCR-PLUS Model: Taking Changsha City as an example. Acta Ecol. Sin. 2022, 42, 9957–9970. [Google Scholar] [CrossRef]
- Ji, Y.F.; Jia, L.J.; Yang, L.A.; Li, Y.L.; Dong, Q.H. Spatio-temporal Evolution and Prediction Analysis of Habitat Quality in Yulin City Coupled with InVEST-PLUS Model. J. Soil Water Conserv. 2023, 37, 123–132. [Google Scholar] [CrossRef]
- Li, Y.G.; Liu, W.; Feng, Q.; Zhu, M.; Yang, L.S.; Zhang, J.T.; Yin, X.W. The role of land use change in affecting ecosystem services and the ecological security pattern of the Hexi Regions, Northwest China. Sci. Total Environ. 2023, 855, 158940. [Google Scholar] [CrossRef]
- Yang, Z.; Zhan, J.Y.; Wang, C.; Twumasi-Ankrah, M.J. Coupling coordination analysis and spatiotemporal heterogeneity between sustainable development and ecosystem services in Shanxi Province, China. Sci. Total Environ. 2022, 836, 155625. [Google Scholar] [CrossRef]
- Xie, L.; Wang, H.W.; Liu, S.H. The ecosystem service values simulation and driving force analysis based on land use/land cover: A case study in inland rivers in arid areas of the Aksu River Basin, China. Ecol. Indic. 2022, 138, 108828. [Google Scholar] [CrossRef]
- Xu, L.F.; Liu, X.; Tong, D.; Liu, Z.X.; Yin, L.R.; Zheng, W.F. Forecasting Urban Land Use Change Based on Cellular Automata and the PLUS Model. Land 2022, 11, 652. [Google Scholar] [CrossRef]
- Zhou, Y.; Han, Z. Spatial and Temporal Variation of Carbon Storage from Coastal Zone Planning and Management Perspective. Remote Sens. Inf. 2023, 38, 11–17. [Google Scholar] [CrossRef]
- Zhu, L.Y.; Hu, K.; Sun, S.; Liu, Y.H.; Liang, J.X. Research on the Spatiotemporal Variation of Carbon Storage in the Coastal Zone of Liaoning Province Based on InVEST Model. Geoscience 2022, 36, 96–104. [Google Scholar] [CrossRef]
- Gong, S.X.; Zhang, Y.H.; Li, Y.H. Spatio-temporal variation and prediction of carbon storage in Beijing-Tianjin-Hebei region—A PLUS -InVEST model approach. J. Arid Land Resour. Environ. 2023, 37, 20–28. [Google Scholar] [CrossRef]
- Lin, T.; Yang, M.Z.; Wu, D.F.; Liu, F.; Yang, J.H.; Wang, Y.J. Spatial correlation and prediction of land use carbon storage based on the InVEST-PLUS model—A case study in Guangdong. China Environ. Sci. 2022, 42, 4827–4839. [Google Scholar]
- Li, D.C.; Fan, K.K.; Lu, J.Q.; Wu, S.; Xie, X.W. Research on Spatio-Temporal Pattern Evolution and the Coupling Coordination Relationship of Land-Use Benefit from a Low-Carbon Perspective: A Case Study of Fujian Province. Land 2022, 11, 1498. [Google Scholar] [CrossRef]
- Ren, D.F.; Cao, A.H.; Wang, F.Y. Response and Multi-Scenario Prediction of Carbon Storage and Habitat Quality to Land Use in Liaoning Province, China. Sustainability 2023, 15, 4500. [Google Scholar] [CrossRef]
- Zou, T.H.; Chen, P.; Liu, J.F.; Du, H.S. Spatio-temporal dynamics of territorial ecosystem carbon storage under different land use scenarios in Siping City. China Environ. Sci. 2023, 15, 1575. [Google Scholar] [CrossRef]
- Fujian Provincial Bureau of Statistics. Fujian Statistical Yearbook 2022; China Statistics Press: Beijing, China, 2022; ISBN 978-7-5037-9840-5. [Google Scholar]
- Xu, X.L.; Liu, J.Y.; Zhang, S.W.; Li, R.D.; Yan, C.Z.; Wu, S.X. China’s Multi-Period Land Use Land Cover Remote Sensing Monitoring Dataset (CNLUCC). Available online: http://www.resdc.cn/DOI (accessed on 5 May 2023).
- Liu, J.Y. Macro-Scale Survey and Dynamic Study of Natural Resources and Environment of China by Remote Sensing; China Science and technology Press: Beijing, China, 1996; p. 353. ISBN 7-5046-2323-7. [Google Scholar]
- Li, M.; Zheng, P.; Pan, W.B. Spatial-Temporal Variation and Tradeoffs/Synergies Analysis on Multiple Ecosystem Services: A Case Study in Fujian. Sustainability 2022, 14, 3086. [Google Scholar] [CrossRef]
- Li, S.P.; Cao, Y.G.; Liu, J.L.; Wang, S.F.; Zhou, W.X. Assessing Spatiotemporal Dynamics of Land Use and Cover Change and Carbon Storage in China’s Ecological Conservation Pilot Zone: A Case Study in Fujian Province. Remote Sens. 2022, 14, 4111. [Google Scholar] [CrossRef]
- Niu, X.N.; Ni, H.; Ma, Q.; Wang, S.X.; Zong, L.L. Identifying Ecological Security Patterns Based on Ecosystem Service Supply and Demand Using Remote Sensing Products (Case Study: The Fujian Delta Urban Agglomeration, China). Sustainability 2023, 15, 578. [Google Scholar] [CrossRef]
- Wang, W.J. Reserve Estimation, Spatiotemporal Distribution and Its Influencing Factors of Soil Organic Carbon in Fujian Province, China. Geosciences 2019, 33, 1295–1305. [Google Scholar] [CrossRef]
- Xu, L.; He, N.P.; Yu, G.R. A Dataset of Carbon Density in Chinese Terrestrial Ecosystems (2010s). Available online: http://csdata.org/en/p/301/1/ (accessed on 10 May 2023).
- China High-Resolution National Soil Information Grid Basic Attribute Dataset (2010–2018). Available online: http://soil.geodata.cn/ztsj.html (accessed on 8 January 2024).
- Xu, X.L. Chinese Population Spatial Distribution km Grid Dataset. Available online: https://www.resdc.cn/DOI/DOI.aspx?DOIID=33 (accessed on 24 August 2023).
- Xu, X.L. China GDP Spatial Distribution km Grid Dataset. Available online: https://www.resdc.cn/DOI/DOI.aspx?DOIID=32 (accessed on 24 August 2023).
- Lu, L.; Liu, C. Chinese Soil Dataset Based on the World Soil Database (HWSD) (v1.1). Available online: http://www.ncdc.ac.cn (accessed on 2 August 2023).
- Huang, D.M.; Liu, X.Y.; Zheng, Q.C.; Liu, J. Effects of polycentric mode on the coupling and coordinated development between urbanization and ecological environment: A case study of two metropolitan areas in Fujian Province. Acta Ecol. Sin. 2020, 40, 7886–7896. [Google Scholar] [CrossRef]
- Cai, W.X.; He, N.P.; Xu, L.; Li, M.X.; Wen, D.; Liu, S.R.; Sun, O.J.X. Spatial-temporal variation of the carbon sequestration rate of afforestation in China: Implications for carbon trade and planning. Sci. Total Environ. 2023, 884, 163792. [Google Scholar] [CrossRef]
- Guo, R.; Fan, J.; Liu, H.C. Impact of Resource-Environmental Restriction on the Layout of Metropolitan Area: A Case Study of Xiamen-Zhangzhou-Quanzhou Metropolitan Area. Econ. Geogr. 2021, 41, 10–19. [Google Scholar] [CrossRef]
- Yu, Z.; Zhao, M.; Gao, Y.; Wang, T.; Zhao, Z.; Wang, S. Spatio-temporal Evolution and Prediction of Carbon Storage in Huaibei City Based on InVEST-PLUS Model. Environ. Sci. 2023, 13, 7142. [Google Scholar] [CrossRef]
- Qi, M.; Wang, F.; Hua, Y.; Wang, M. Assessment of Land Use Change and Carbon Storage in Inner Mongolia Autonomous Region Based on PLUS and InVEST Models. J. Soil Water Conserv. 2023, 37, 194–200. [Google Scholar] [CrossRef]
- Wang, Y.; Xu, Y.; Yu, H. Prediction of Spatial and Temporal Changes of Carbon Stocks in Anhui Province Based on PLUS-InVEST Model. Bull. Soil Water Conserv. 2023, 43, 277–289. [Google Scholar] [CrossRef]
- Zhao, H.; Liu, G.; Yang, Z.; Liu, X.; Miao, Q.; Fu, H. Ecosystem Services Assessment and Multi-Scenario Prediction in Liaoning Province from 2000 to 2020. Environ. Sci. 2023, 11, 1228558. [Google Scholar] [CrossRef]
- Zhou, M.; Wang, C. Multi-scenario simulation of “production-livelihood-ecological” space in Urumqi based on PLUS. China Environ. Sci. 2024, 1–11. [Google Scholar] [CrossRef]


Disclaimer/Publisher’s Note: The statements, opinions and data contained in all publications are solely those of the individual author(s) and contributor(s) and not of MDPI and/or the editor(s). MDPI and/or the editor(s) disclaim responsibility for any injury to people or property resulting from any ideas, methods, instructions or products referred to in the content. |
© 2024 by the authors. Licensee MDPI, Basel, Switzerland. This article is an open access article distributed under the terms and conditions of the Creative Commons Attribution (CC BY) license (https://creativecommons.org/licenses/by/4.0/).