Article

Comparison of the Analytic Network Process and the Best–Worst Method in Ranking Urban Resilience and Regeneration Prioritization by Applying Geographic Information Systems

1
Department of Geography and Urban Planning, Islamic Azad University, Isfahan 39998-81551, Iran
2
Environmental Science, University of Tehran, Tehran 1417935840, Iran
3
Surveying Engineering, Islamic Azad University, Chalus 1477893855, Iran
4
Geography and Urban Planning, Sistan & Baluchestan University, Zabul 9816745785, Iran
5
Remote Sensing & Geographic Information System, Kharazmi University, Tehran 1571914911, Iran
6
Faculty of Science and Technology, Athabasca University, Athabasca, AB T9S 3A3, Canada
7
Dubai Campus, Heriot-Watt University, Dubai P.O. Box 501745, United Arab Emirates
8
Remote Sensing & Geographic Information System, Islamic Azad University, Tehran 1148963537, Iran
9
Department of Geography, Razi University, Kermanshah 6714414971, Iran
10
Department of Geomatics Sciences, Université Laval, Quebec City, QC G1V 0A6, Canada
*
Author to whom correspondence should be addressed.
Land 2024, 13(7), 1008; https://doi.org/10.3390/land13071008
Submission received: 18 May 2024 / Revised: 30 June 2024 / Accepted: 2 July 2024 / Published: 7 July 2024
(This article belongs to the Special Issue Geospatial Data in Land Suitability Assessment)

Abstract

:
Urbanization without planning causes concerns about biodiversity loss, congestion, housing, and ecosystem sustainability in developing countries. Therefore, resilience and regeneration following urbanization are critical to city planning and sustainable development. Integrating multi-criteria decision-making methods (MCDM) with geographic information systems (GIS) can be a promising method for analyzing city resilience and regeneration. This study aims to use two MCDMs, the Analytic Network Process (ANP) and the Best–Worst Method (BWM), to evaluate the resilience of metropolitan neighborhoods in Tehran. Fourteen criteria were selected to represent the city’s resilience, and the weights of two models were evaluated for their spatial patterns using GIS. The results showed that the building age was the most important criterion in both methods, while the per capita green space was the least important criterion. The weights of the most important criterion, the building age, for the ANP and BWM, were 19.56 and 18.98, respectively, while the weights of the least important criterion, the per capita green space, were 2.197 and 1.655, respectively. Therefore, the MCDM with GIS provides an approach for assessing city resilience and regeneration priority.

1. Introduction

Urbanization refers to a trend of city population growth and urban scale expansion, and it involves a set of social and environmental changes related to the city in question [1,2]. Currently, 55% of the global population resides in urban regions. As the world continues to urbanize, the percentage is projected to reach 60% of the global population by 2030 [3,4] and 68% by 2050 [5]. However, urbanization often results in many concerns, such as concerns related to housing, health care, transportation, and infrastructure systems for employment and basic services [5,6,7]. Furthermore, urbanization can change ecosystem services through deforestation, habitat loss, land degradation, and the extraction of freshwater, which can decrease biodiversity and alter species ranges and interactions. Therefore, sustainable urban development relies increasingly on urbanization management, particularly in developing countries [8,9]. Therefore, urban sustainability planning requires integrated management and policies with urban managers, local communities, and residents coordinating for a specific purpose (optimal use of space and time) to provide infrastructure and services [10,11]. Investigating urban structure and function requires a proper understanding of adaptation and resilience to urban growth [12,13,14]. Thus, understanding risk, and human adaptation and resilience to urban growth has become a research subject [15,16,17,18,19,20].
The resilience concept has widely been used to assess the risk of urban disasters in scientific and political communities in the context of sustainable urban development [21]. Resilience refers to the level of resistance against external stresses [22]. Urban regeneration is a process of city redevelopment that aims to resolve urban threats or risks [23]. This includes clearing out blighted areas in inner cities to create new infrastructure, increase tax revenue, and create new businesses [24]. Explaining urban resilience and regeneration in the face of threats involves understanding how social, economic, institutional, political, and executive capacities respond to the challenges of creating livable spaces [25,26,27]. For example, most land uses and services require regeneration to update and upgrade old infrastructure and services in the city center [28] and develop new facilities for social services, education, and health care in the city’s outskirts [29]. Sustainability and resilience are now the main analytical and normative concepts that address the multi-faceted problems facing poor city regions and improve living quality [30]. Thus, quantifying resilience is critical for generating holistic strategies and planning for urban-regeneration projects [31].
Geographic information systems (GIS) have become more and more popular in spatial data analysis [32,33] and have been widely applied in various sectors, such as traffic [34], climate [35,36], land use [37,38], freshwater resources [39,40], hazards [41,42,43], wildlife habitats [44], and service-site selection [45,46]. However, applications of GIS data to assessing spatial resilience are rare due to limited software capabilities and the complexity of resilience assessment [47]. The Resilient Cities Index by Arup evaluates urban resilience through four main dimensions: health and well-being, economy and society, infrastructure and environment, and leadership and strategy [48]. It provides a comprehensive framework to assess cities’ abilities to withstand and recover from various shocks and stresses. The City Resilience Index by the Rockefeller Foundation similarly measures resilience across four dimensions: health and well-being, economy and society, infrastructure and environment, and leadership and strategy, using a set of 52 indicators to provide a holistic view of urban resilience [48]. Multi-criteria decision-making methods (MCDM) explicitly evaluate multiple conflicting decision-making criteria but lack spatial-visualization capacity [49,50]. Therefore, GIS coupled with MCDM can be used to quantify urban resilience [51,52,53] and urban regeneration, as well as for mapping [54,55,56]. However, different MCDMs, such as the Analytic Hierarchy Process (AHP), the Analytic Network Process (ANP), and the Best–Worst Method (BWM), have different mechanisms for criteria selection and algorithms. They may perform differently in ranking urban resilience and regeneration due to differences in geographic locations, selection of criteria, and priorities. For example, ref. [57] investigated urban-sustainability criteria in several cities. They found that the ability to obtain the best performance via different MCDM practices depends not only on the selection of different criteria but also on consistent processes of choosing criteria. Additionally, ref. [58] compared metrics of transportation sustainability for 100 cities in the world. They found that sustainable transportation was positively correlated with gross domestic product (GDP) and urban density but negatively correlated with urban areas. However, [59] compared urban-resilience indicators for nine urban areas in the USA, Latin America, and the Caribbean. They found significant differences among urban areas and their governance roles in geography and policy resilience. Since there are many different MCDM methods, comparing the results using several algorithms is common practice. This enables a more robust ranking of neighborhood resilience and regeneration priority for decision-making. Therefore, considering the rapidly and continuously changing criteria and algorithms, our understanding of the effects of different MSDMs and geographic characteristics on urban resilience and regeneration is still insufficient [60]. Particularly in metropolitan neighborhoods in Tehran, Iran, quantifying resiliencies is an urgent need due to fast urban development, which results in potential uncertainties in decision-making and regeneration plans.
This article, focusing on examining and comparing various MCDM (Multi-Criteria Decision-Making) methods for assessing resilience and their integration with GIS (Geographic Information Systems), aims to determine the extent of similarity or difference between different MCDM approaches concerning urban resilience and regeneration. How does their combination with GIS affect the mapping and prioritization strategies differently? To address the above issues, the objectives of this study are to develop multiple criteria for resilience and alternative methods by which to assess the resilience and regeneration priorities of the metropolitan neighborhoods in Tehran using a multi-criteria decision-making analysis. We will apply ANP and BWM methods and a combined method to quantify resilience rankings of metropolitan areas (1) to rank the neighborhood resilience, criteria, and regeneration; (2) to compare the results of different alternatives to find a suitable model for assessing the resilience; (3) to analyze spatial heterogeneity of resilience between neighborhoods; and (4) to foster a better understanding of urban systems and provide insights for urban management, planning and urban design, emergency resilience management, and regeneration priorities.

2. Methodology

2.1. Data Sources and Study Area

Tehran is the capital of Iran and has a population of 9,400,000, making it the largest city in Iran. It is located in the Middle East (Latitude 35°41′ N and Longitude 51°25′ E) [61,62] (Figure 1). According to the latest population and housing census in 2015, Tehran has a population of 8,737,510 people and 2,924,208 households (no census was conducted in 2020 due to COVID-19) [63]. This city is divided into 22 municipal districts [64] and 375 neighborhoods [65]. Tehran is one of West Asia’s most populous and polluted cities [66]. This city’s industrial growth has resulted in its experiencing only 26 days of clean air annually [67].

2.2. Multi-Criteria Decision-Making Models

Two MCDM methods, namely, ANP and BWM, were compared in terms of their abilities to rank the resilience of Tehran. Fourteen criteria were selected, including building age, population density, distance from fault, etc. These criteria are summarized in Table 1. Resilience criteria were obtained by reviewing previous studies. The criteria for resilience and regeneration were the same in this research.
Models are implemented according to the following steps:
  • Pairwise comparison matrix of ANP methods
  • Pairwise comparison matrix of the BWM
  • Calculation of criterion weight in the ANP and the BWM
  • Validation of questionnaires
  • Analysis of the criteria map
  • Provision of a resilience map using two methods
  • Resilience rating and regeneration prioritization
  • Combination of the results of the two methods and their combination.

2.2.1. Analytical Network Process (ANP)

The ANP is an extension of the AHP [82,83]. Like the AHP, the ANP employs pairwise comparisons to evaluate the weights of the structural elements and eventually rank the alternatives in the decision. When the AHP constructs a decision problem into a hierarchy with a target, decision criteria, and alternatives, the components of the hierarchy do not depend on others. The decision criteria are independent of each other. In contrast, the ANP builds a decision problem as a network and is more general since there is interdependence among the items in many real-world cases. Thus, in the ANP, components can depend on each other.
That is, the priority of the most important criterion should not be more than nine times the priority of the least important criterion [82]. The degree of preference in this 9-point scale is presented in Table 2 [84].
The ANP uses weights to rank the significance of criteria to determine the overall target. The criteria pairs are compared to judge whether their ranks are equally significant, moderately more significant, strongly significant, and the rest.
The ANP is implemented in 4 stages:
Stage 1: Defining the decision-making problem and presenting it in a network model. After the decision-making problem and its influencing factors have been defined, a network model should be formed at this stage. This model includes the relationships among decision-making, groups, and components and internal and external dependencies between them.
Stage 2: Formation of pairwise comparison matrices and extraction of priority vectors. Here, the decision components in every group are compared two-by-two according to their importance to the control criteria (on a 9-point scale, as for the AHP). A score of 1 represents equal significance between the two components, and a score of 9 represents one component as the most significant. After the preferences have been written in the pairwise comparison matrices, the local priority vectors can be obtained for each pairwise comparison matrix through the eigenvector approach. The internal significance vector is expressed as the relative significance of components or groups using Equation (1), as follows:
A W = λ m a x W
where λ m a x   denotes the maximum eigenvalue of the compared matrices.
Stage 3: Forming the supermatrix. All priority vectors are evaluated for every pairwise comparison in one matrix. The union of all priority vectors forms a supermatrix. An unweighted supermatrix is obtained by substituting the vectors of internal priorities, components and matrices in the supermatrix. A weighted supermatrix is obtained by multiplying the values in the unweighted supermatrix by the weight of each group. Finally, this supermatrix is normalized and changed to a random state in terms of columns, as in Equation (2) [81], as follows:
W i j = W i 1 j 1 W i 1 j 2 W i 1 j n W i 2 j 1 W i 2 j 2 W i 2 j 1 W i n j 1 W i n j 2 W i n j n
where Wij is a main eigenvector of influenced significance of the component in the ith component of the network and in the jth component.
Limit supermatrix: If all the components of the weighted supermatrix reach a power where the resulting convergence causes the other values of all the columns of the matrix to be the same, the limit supermatrix is formed; in the limit supermatrix, each column represents the overall priority vector (Equation (3)).
W = C 1 C N e 1 1 e 1 n 1 e N 1 e N N n N C 1 C N e 1 1 e 1 n 1 e N 1 e N n N W 11 W 1 N W N 1 W N N  
where Ck is the kth element cluster and includes nk components as e k 1 , e k 2 , , e k m . In a matrix piece, Wij is the relationship between the ith component and the jth component. Every column of Wij represents the local priority vector by calculating the corresponding paired comparison as the importance of the component. If no relationship exists between components, the corresponding matrix piece is a zero matrix. The resulting matrix is called the limit supermatrix and creates the limit priorities of the direct and indirect effects of each component on others.
Stage 4: Calculating the endmost weight of the criteria: In an ANP model, the endmost weights of the criteria and sub-criteria are obtained through the limit vector supermatrix [85]. If the supermatrix includes the total network, the endmost priorities of the component are settled from the corresponding columns of the limit supermatrix.
Then, the consistency index (CI) can be calculated using Formula (4), as follows:
C I =   λ m a x n 1
The consistency ratio (CR) can be calculated using Equation (5), as follows:
CR = C I R I
where λ m a x   is the maximum eigenvalue of the comparison matrix, n the order of matrix A, and RI is the average random CI that can be calculated from Table 3. When CR is less than 0.1, the comparison matrix meets the consistency criteria [86]. Comparisons are consistent if the consistency rate is 0.1 or less [87].
To obtain preferences in the ANP, the goal, criteria, and alternatives were defined. Pairwise comparisons were conducted for all elements. An unweighted supermatrix was constructed and then normalized to create a weighted supermatrix. This was raised to a large power to form the limit supermatrix. Global priorities were extracted from this limit matrix to determine the preferences of alternatives. Super Decisions software (V 2.10.0) was used for calculations. Table 4 shows the number of experts participating in the ANP, along with their backgrounds.

2.2.2. The Best–Worst Method (BWM)

The BWM is a paired-comparison approach of MCDM that provides a structured comparison [88]. The best and worst criteria are determined according to several indicators designed for decision-making. A paired comparison is performed between every best and worst criterion and other criteria. Thus, the best–worst problem can be expressed as a maximum–minimum issue according to the weight of different criteria, expressed as shown in the following matrix [88]:
A = C 1 C 2 C n a 1 a 2 a m p 11 p 12 p 1 n p 21 p 22 p 2 n p m 1 p m 2 p m n
where ai is a vector of alternatives ( a 1 , a 2 , ,   a m ), Cj is a vector of criteria, C 1 , C 2 , , C n and pij denotes the score of alternative i regarding criterion j.
Each alternative has a score regarding each criterion, pij, and the overall score can be obtained without difficulty. The best alternative can be found with the best overall score (Vj). A simple method uses an additive weighted value function to evaluate the overall score for each alternative, as follows:
V j = j = 1 n w j p i j
Thus, the weight of each criterion, wj, can be determined using the BWM.
The BWM can be implemented according to the below stages:
Stage 1: Determining the set of criteria. Here, the criteria ( C 1 , C 2 , , C n ) are determined to reach the goal.
Stage 2: The best criterion (B) or the worst criterion (W) is identified.
Stage 3: Using the 9-point scale, the superiority of the best criterion is determined over others. The resulting Best-to-Others vector is
A B = ( a B 1 , a B 2 , , a B n )
At this stage, aBj shows the superiority of B over criterion j. Therefore, ABB = 1.
Stage 4: All the criteria are compared with the worst criterion on a 9-point scale to determine the preference. A resulting Others-to-Worst vector is
A w = a 1 w , a 2 w , , a n w T  
where ajw denotes the priority of criterion j over w. Therefore, aww = 1.
Stage 5. The optimum weights are identified (i.e., w 1 * , w 2 * , , w n * ). For every pair of wB/wj and wj/wW, wB/wj = aBj and wj/wW = ajW. The optimum weight of the criteria is a value. For this purpose, each criterion j is required to obtain a solution. In this regard, for every j value, we minimize the maximum absolute differences of | w B w j a B j | and | w j w w a j w |. Because the weights are non-negative and summable, one can transform the Equation [88,89] as follows:
Min   m a x j   { | w B w j a B j | ,   | w j w w a j w | }
such that j w j = 1, when wj ≥ 0 for all j
Obtain min ξ
such that
| w B w j a B j | ξ ,   for   all   j
| w j w w a j w | ξ ,   for   all   j
  • j w j = 1
  • wj ≥ 0, for all j
After the equations above have been solved, the optimum values (i.e., w 1 * , w 2 * , , w n * ) and ξ are obtained.
The highest possible value of aij is 9 for (1, …, aBW). Thus, the consistency is lowest if aBj × ajw is less than or greater than aBW. After different values of aBW have been solved for, the maximum likelihood, ξ * (max), is found, and this value is used for the consistency index (Table 5).
The consistency rate can be obtained using the ξ * value and the corresponding consistency index values from Table 4 [88], as follows:
Consistency   rate = ξ * consistency   index

2.3. Spatial Analysis

The resilience and regeneration road maps are spatially heterogeneous. Therefore, the weights of the criteria were evaluated for 375 neighborhoods in Tehran. The values were obtained from the MCDM methods and were mapped using GIS. Furthermore, the resulting weights from the two MCDM methods were combined with the reclassified layers in GIS using the weighted linear-combination method [90] and were presented to provide a single result from the two methods.

2.4. MCDM Implementation

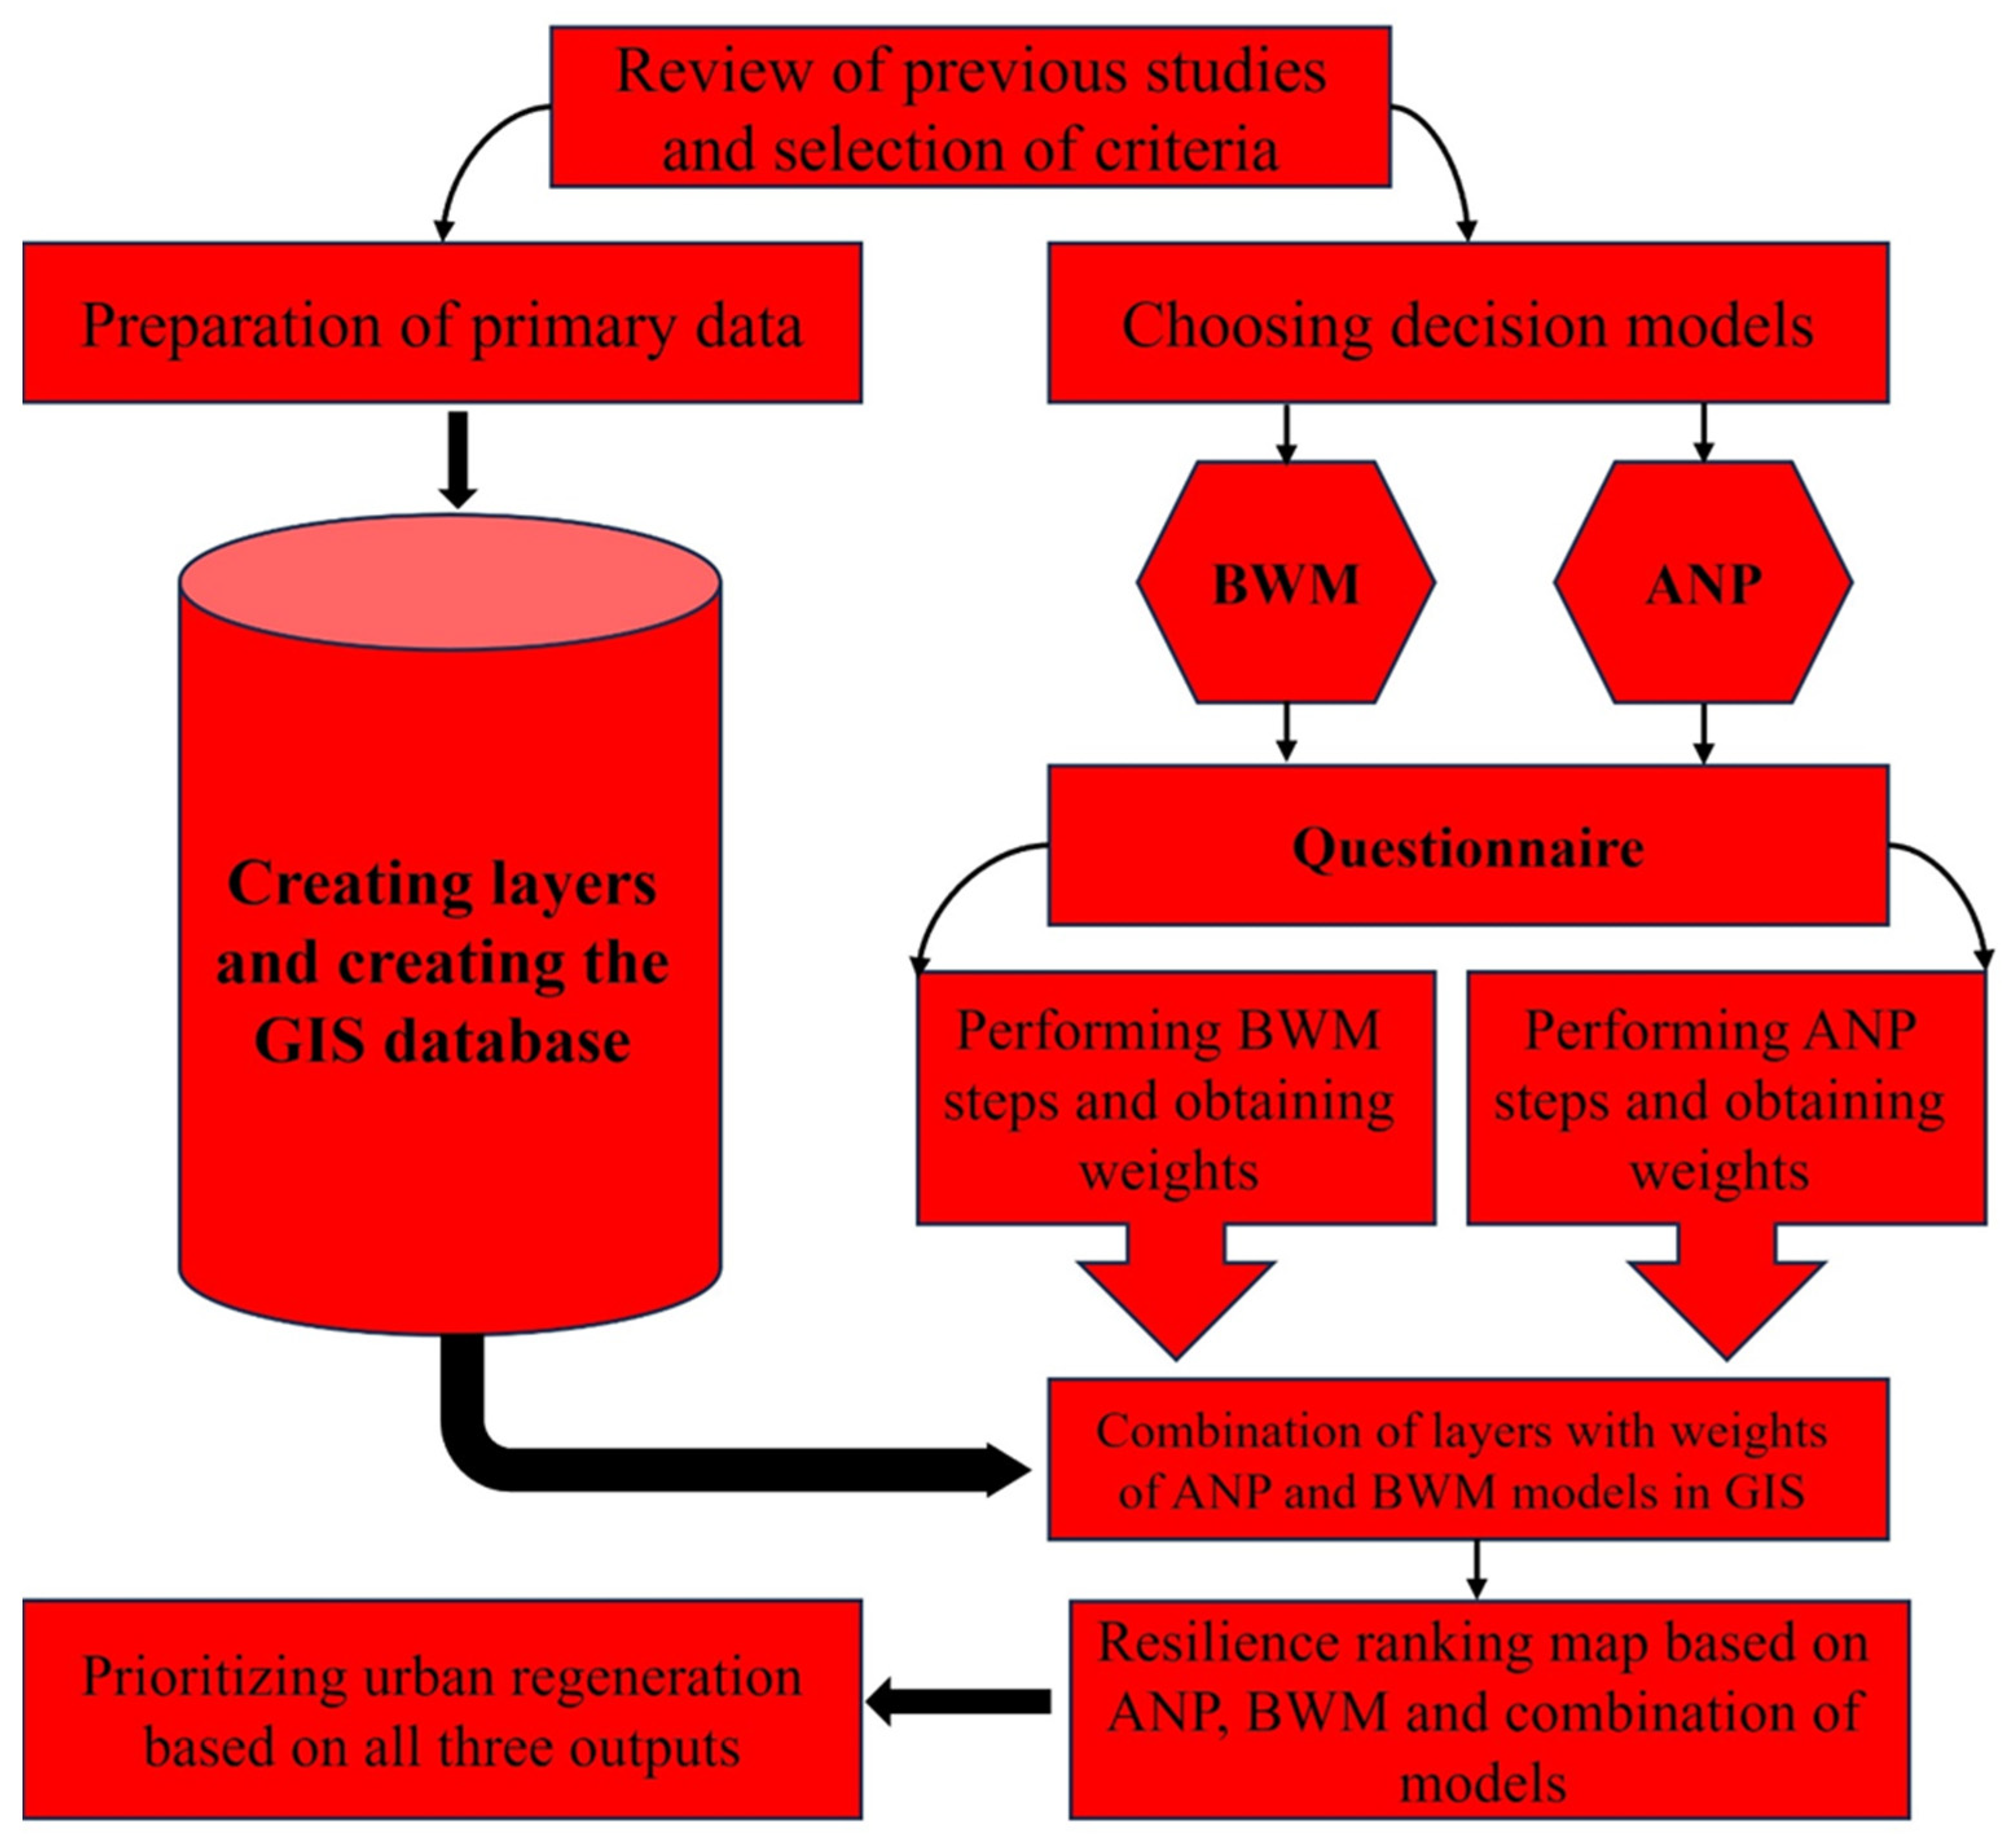
MCDM was implemented as shown in Figure 2. First, 30 articles were reviewed for urban-resilience indicators and their indicators were ranked according to the repetition times in these articles. It should be mentioned that the criteria of this study were selected based on the available indicators from the general indicators. Second, MCDM methods were selected. Here, two methods, the ANP and the BWM, were implemented. At the same time, GIS layers and databases were created using ArcGIS. Third, criteria weights and GIS layers were combined to create the resulting preference, resilience, and priorities. Finally, output resilience ranking maps were output from the ANP and the BWM, as along with their combination and priority urban-regeneration maps. The ANP and BWM determine the importance of each criterion (weight); then, the weights of the criteria are multiplied in the reclassified layers and all the layers are combined together to determine the regeneration-prioritization map (resilience ranking). The ranking of localities is determined by the combination of weights with layers and then integrating them. With the points that the localities obtain from the combination of MCDM results and spatial layers in GIS, we arrive at the prioritization of regeneration. The higher the resilience, the lower the regeneration priority, and vice versa.

3. Results and Discussion

After performing the steps of each of the ANP and BWM methods using Super Decision (2.10.0) and Lingo software (20.0.1), each method’s results were calculated, showing the priority and importance of each of the criteria as a percentage.

3.1. Pairwise Comparison and Criteria Weights

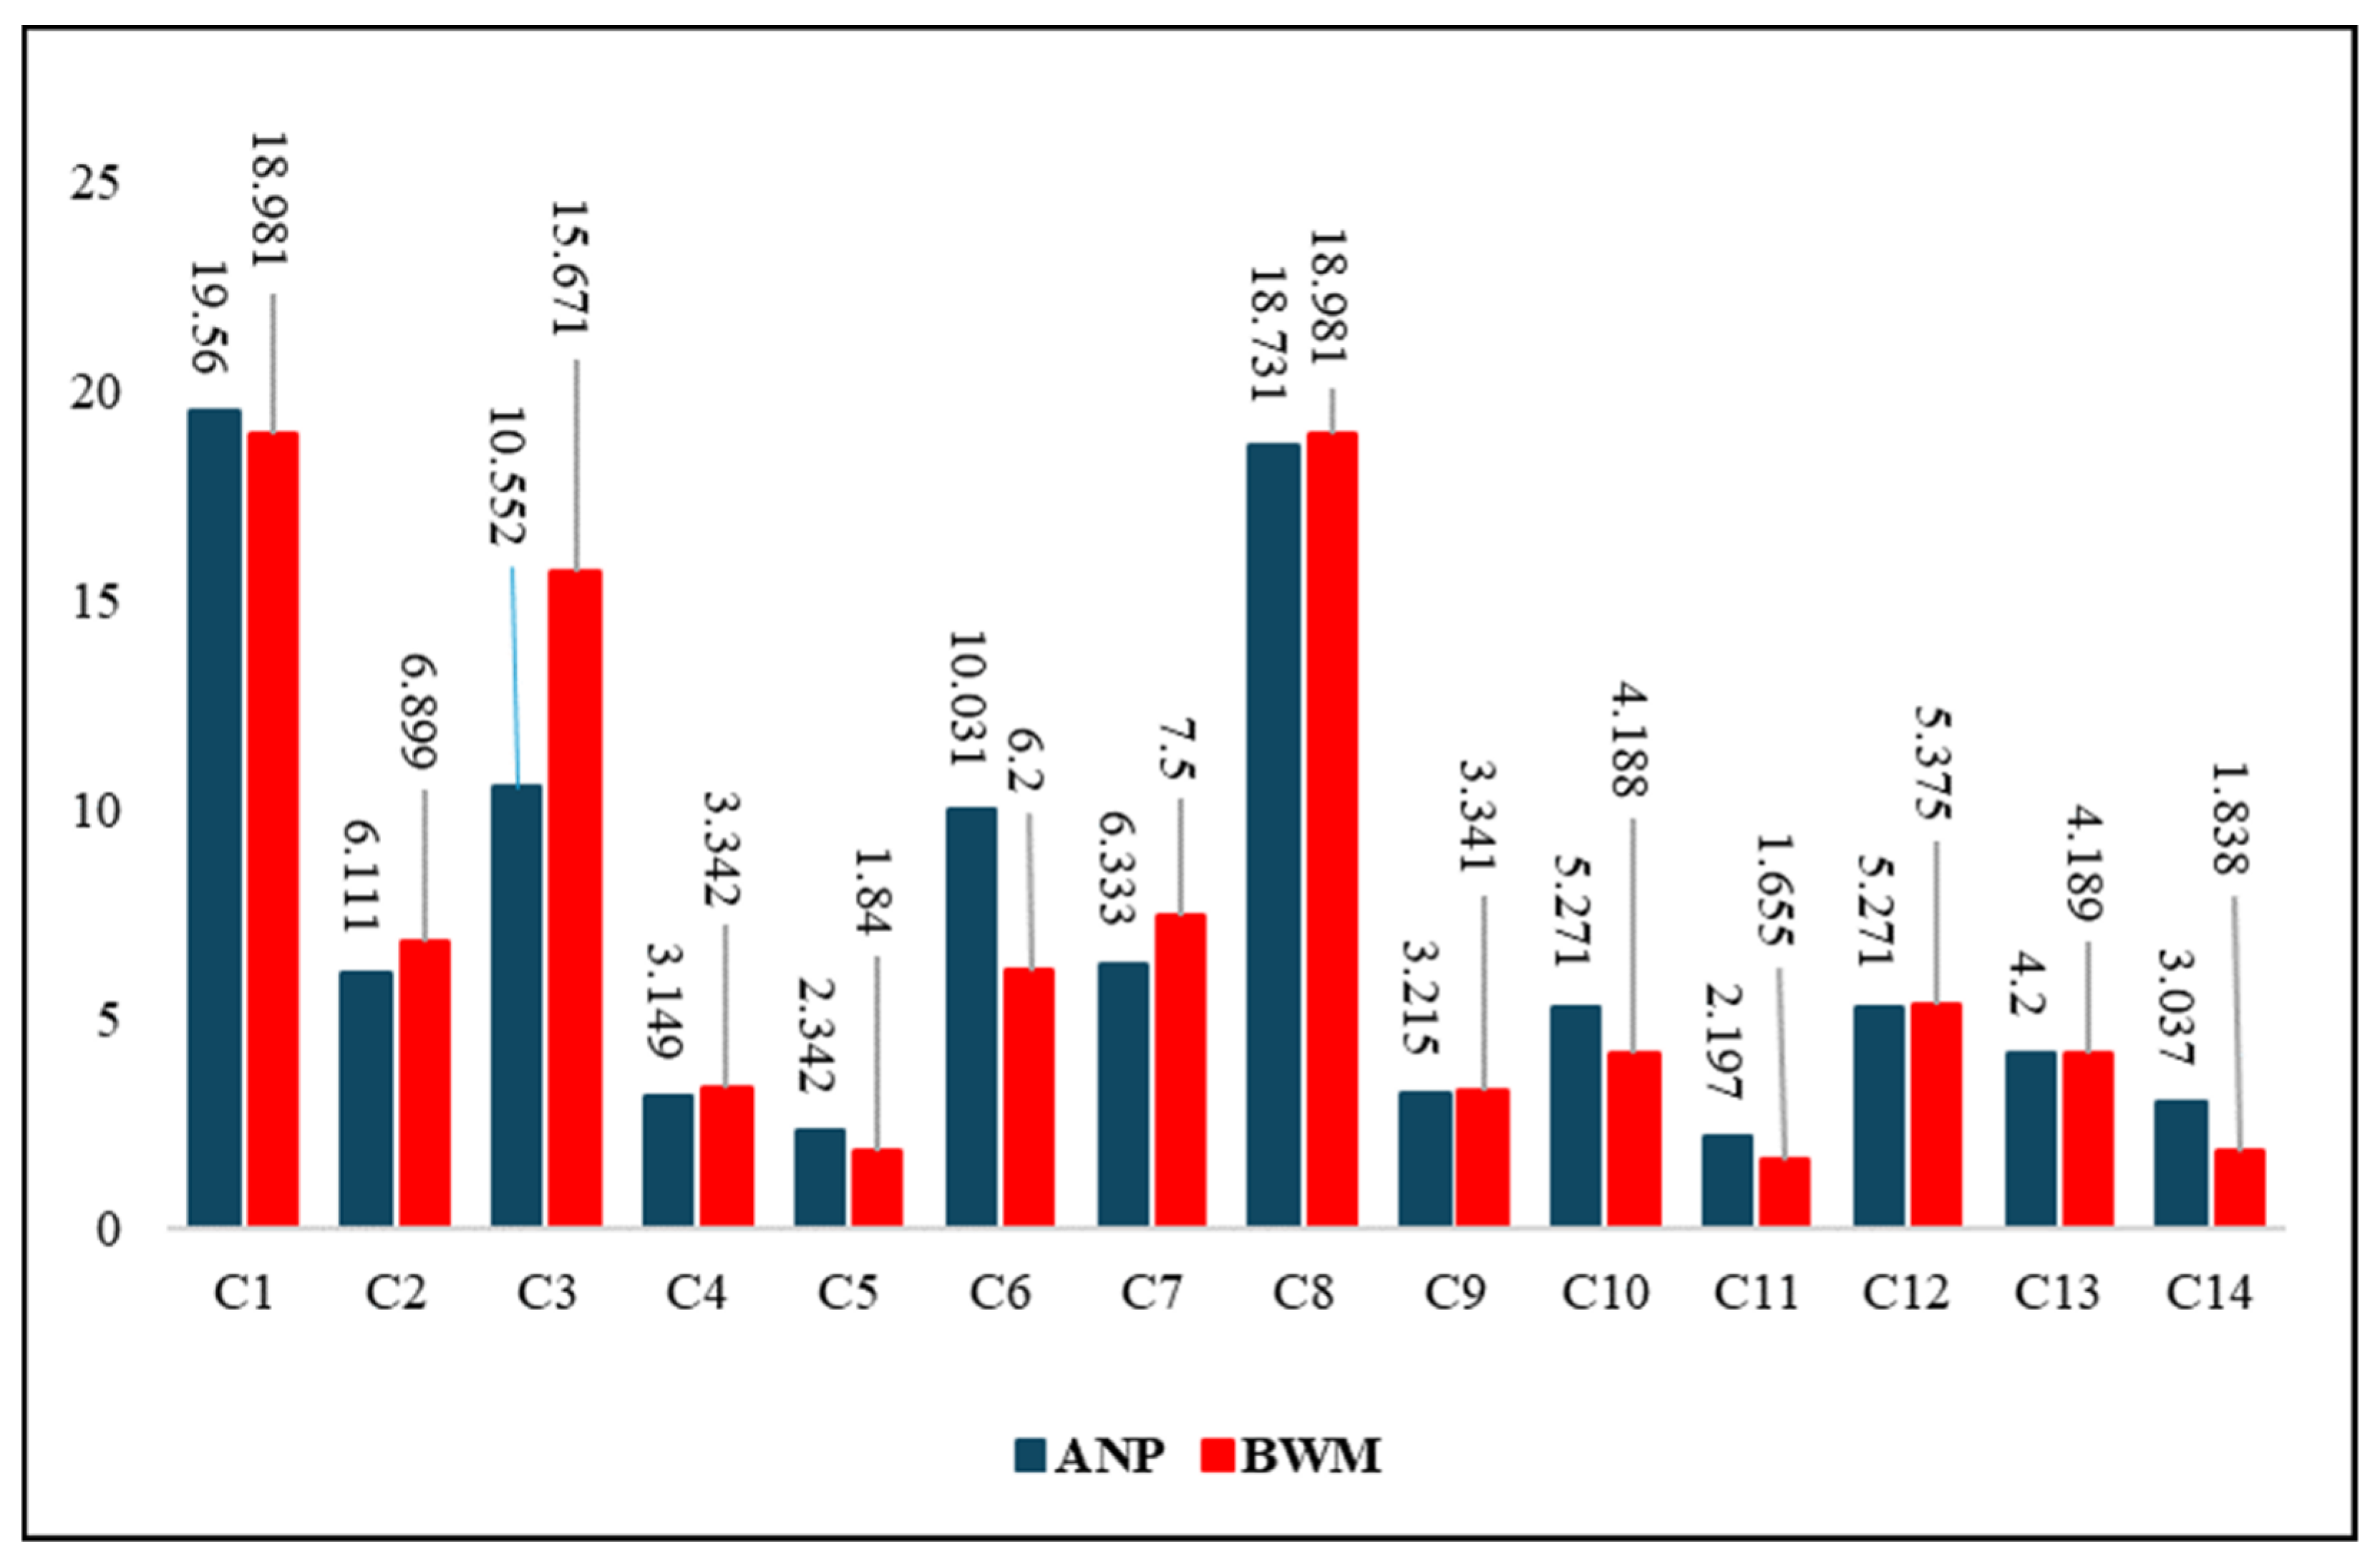
Although we selected 14 criteria, their relative importance values differ. Their relative importance can be estimated by making pairwise comparisons between them. Table 6 shows a comparison matrix of the criteria for ANP methods. Interestingly, the criteria cluster into five main classes: absolutely more important, very strong importance, strong significance, a little more important, and equal importance. There are also four important sub-categories within the main categories. It can be found that C1 is the most significant criterion, followed by C8. In contrast, C11 is the least important, and before that, C5 is the second-least important.
Table 7 and Table 8 are the pairwise comparisons matrices in the BWM. Table 7 shows the superiority of the best criterion over other criteria. In Table 7, C1 and C8 are considered the best criteria. Their preference over other criteria is specified. Table 8 shows the superiority of other criteria over the worst criterion. In Table 8, C11 has been identified as the worst criterion. The superiority of other criteria was identified after they were compared with this criterion.
Figure 3 illustrates the percentage importance of each criterion in estimating resilience and prioritizing regeneration for two methods. It can be seen from the matrices of pairwise comparisons in the ANP method that the most significant criterion was C1, followed by C8, but in the BWM, C1 and C8 have equal importance. The weights of the top criteria in the ANP (C1) and the BWM (C1 and C8) were 19.56 and 18.981, respectively. On the other hand, in the two methods, C11 was the least important criterion, and its weights were 2.197 and 1.655, respectively. This result is consistent with that in Table 6. However, the weights from the BWM were obviously different from those of the ANP. Only two criteria, C13: 0.009 and C12: 0.107, had differences less than 2.2 between the AHP and ANP methods. The inconsistency rates in the ANP and BWM methods were CR = 0.090137 and CR = 0.084627, respectively.

3.2. Spatial Distribution of the Criteria

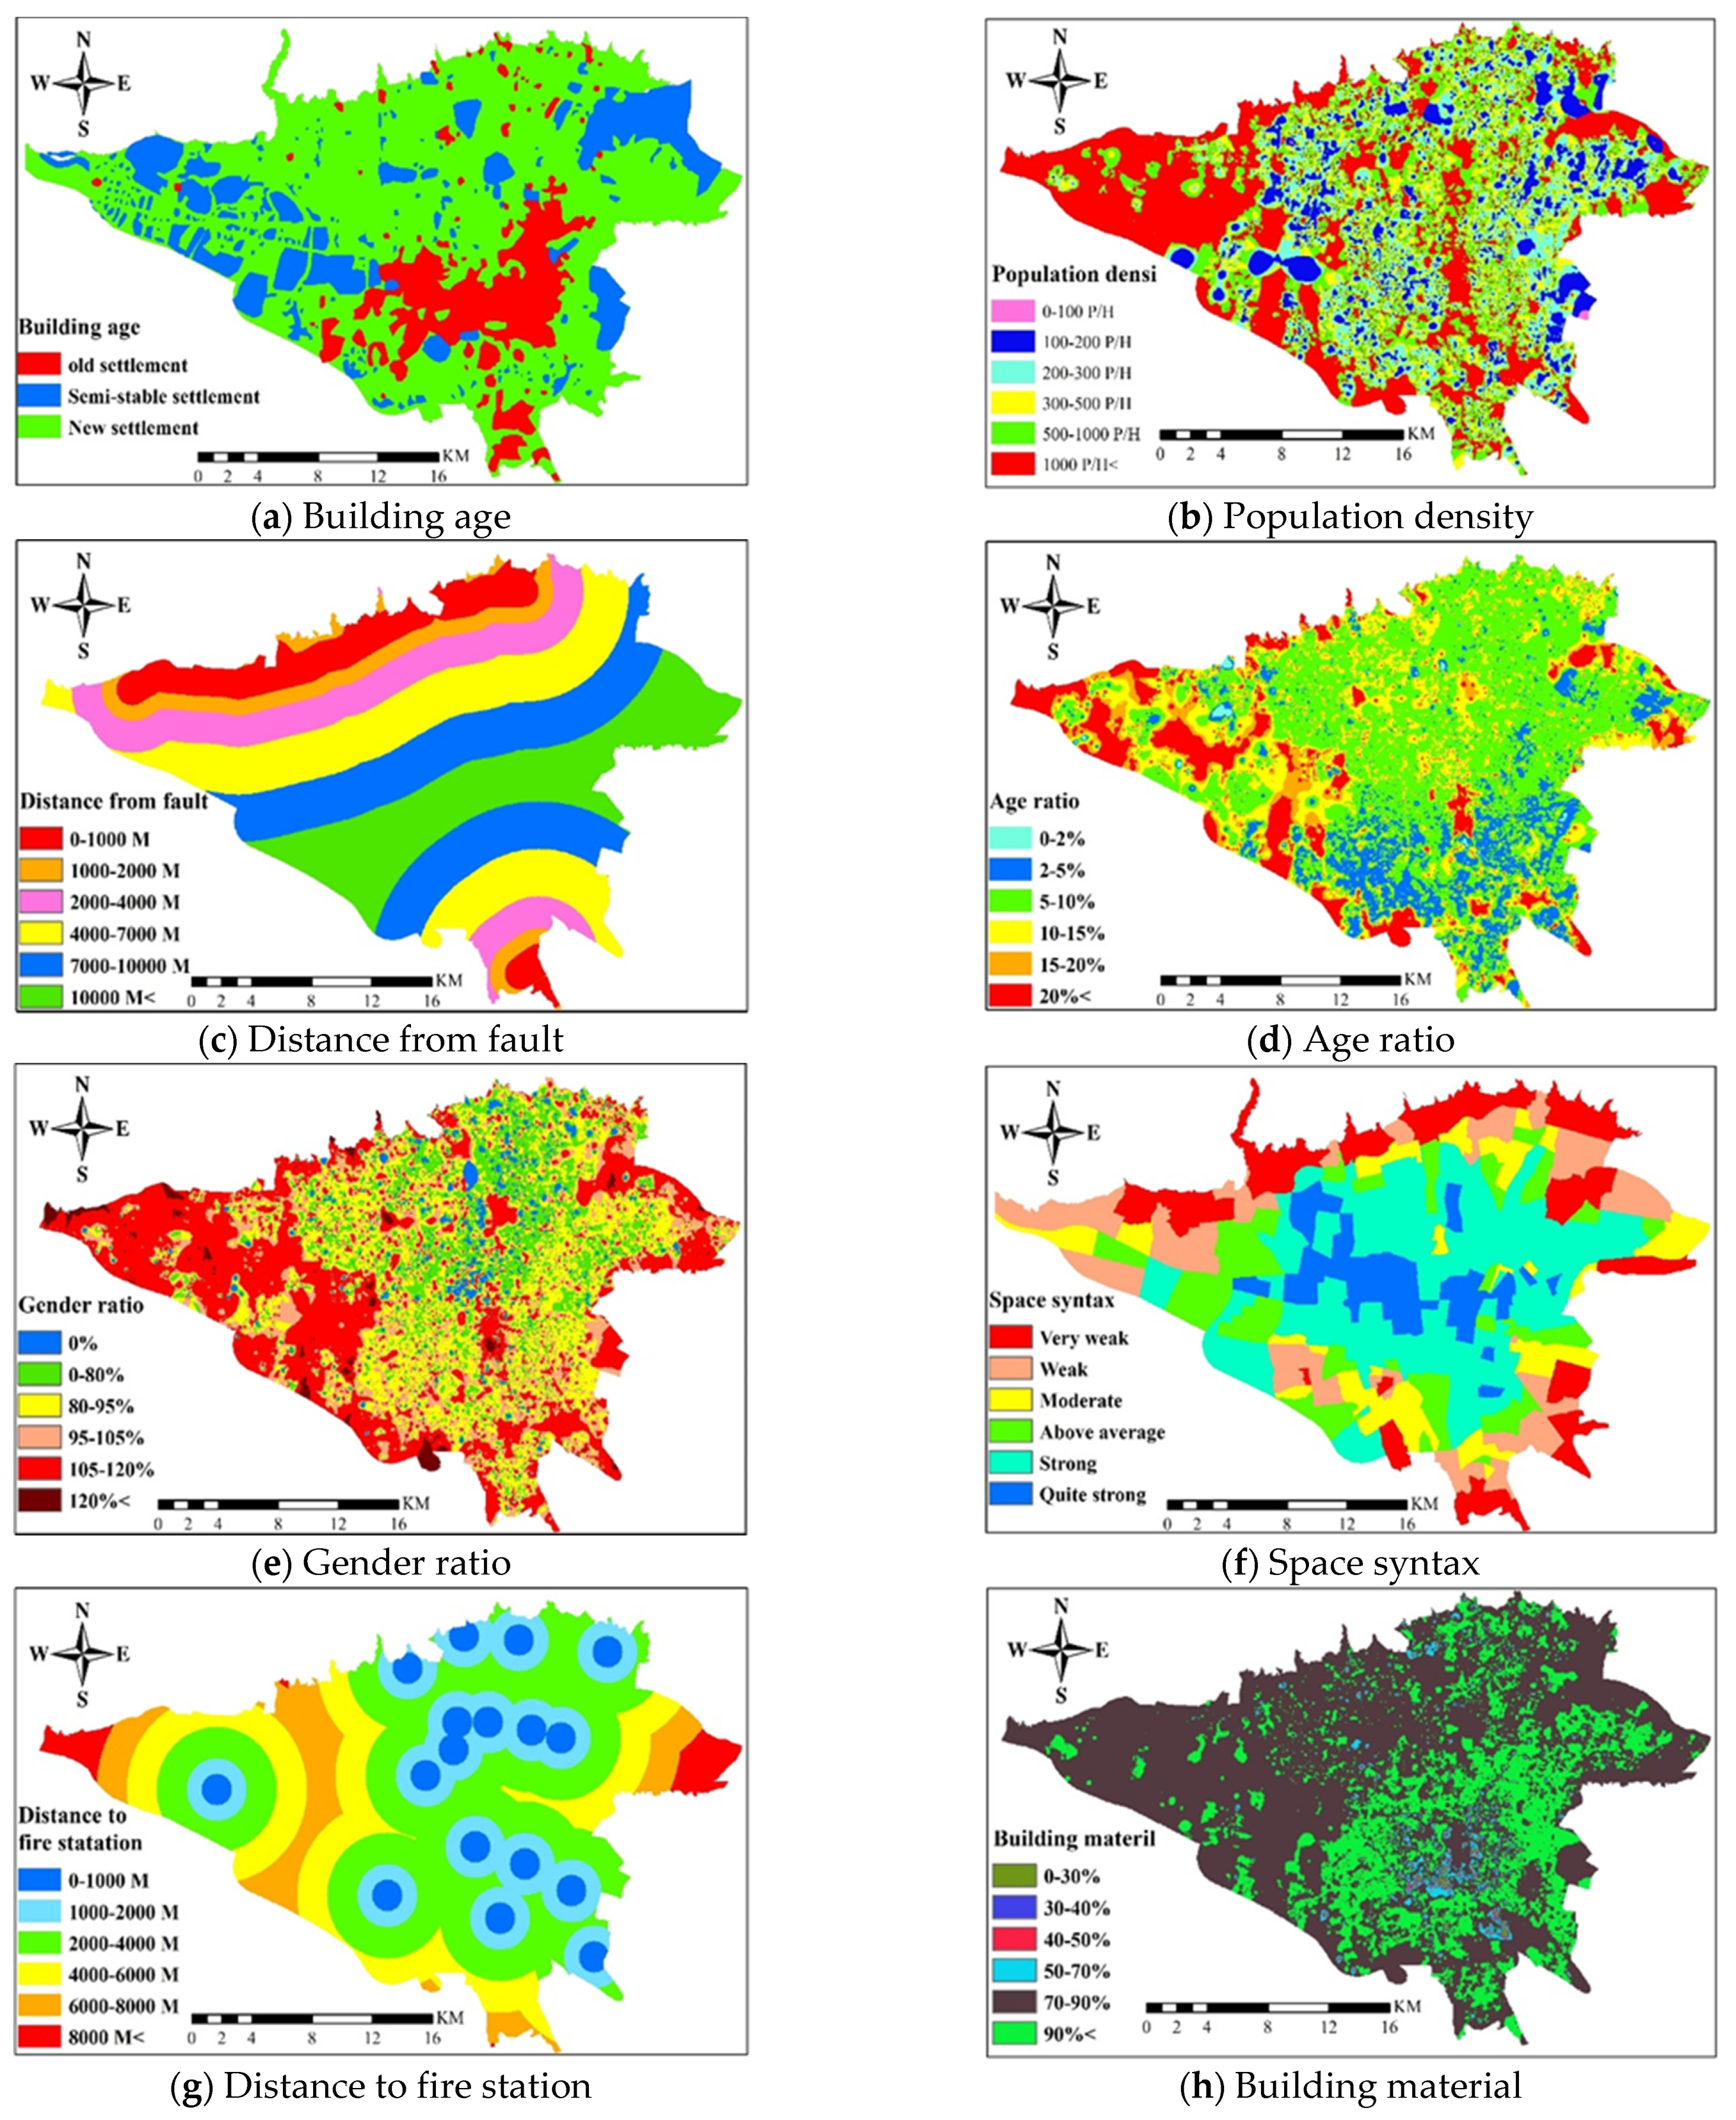
Figure 4 shows the map of the different criteria, including building age, population density, age ratio, gender ratio, space syntax, distance from the fire station, distance from the fault, and building materials. It is shown in Figure 4a that the southeast areas has mostly old buildings (plus isolated parts to the north and south). This can be explained because this region is the downtown area. Some semi-stable areas are in the east and west areas. The rest of the city is mostly new. This can be attributed to the fast urban expansion. Figure 4b shows the population-density map of Tehran. In nearly half of the city, the population density is more than 1000 people per hectare. The city center has a higher population density. The population density in the outskirts is also higher (especially in the West) due to the construction of apartments. Two fault regions are located in the north and south of Tehran. Their distance to the fault is less than 1000 m (Figure 4c). The closer we get to the city center, the more stable the city becomes. The age ratio is shown in Figure 4d. Interestingly, the west of Tehran has a high age ratio in the areas where rich people live. The age ratio is higher in the north of Tehran than in the south. This is because there is a large population of rich elderly people in the west and north of the city of Tehran. In the south of the city, there are lower age ratios in areas where mostly poor people live and have little desire to have children, resulting in a younger population (usually, our age range is between 15 and 65).
The gender-ratio map reveals an interesting pattern (Figure 4e). In the outskirts of Tehran, mainly in the west, there are more women than men, and vice versa in the center. This is because more single men who are Afghan citizens live alone or in groups in the center of the city. They require more convenient access to the workplace and transportation. However, in the western and northern outskirts of the city, rich people and middle-aged and elderly women live alone in apartments. The spatial syntax presents a simple and understandable pattern (Figure 4f). The city centers have the highest-quality communication routes, and the outskirts of the city have the lowest quality. Figure 4g shows the map of the distance from the fire stations. There are fire-station gaps in the west and east of Tehran. On the other hand, the city centers and the north have a better distribution of fire stations. Figure 4h shows the construction-materials map. It is clear that there are good construction materials in more than half of the city. Specifically, 70–90% of the blocks are resistant. Only a few parts of the city center have older materials; in these areas, less than 50% of the building blocks have suitable materials.
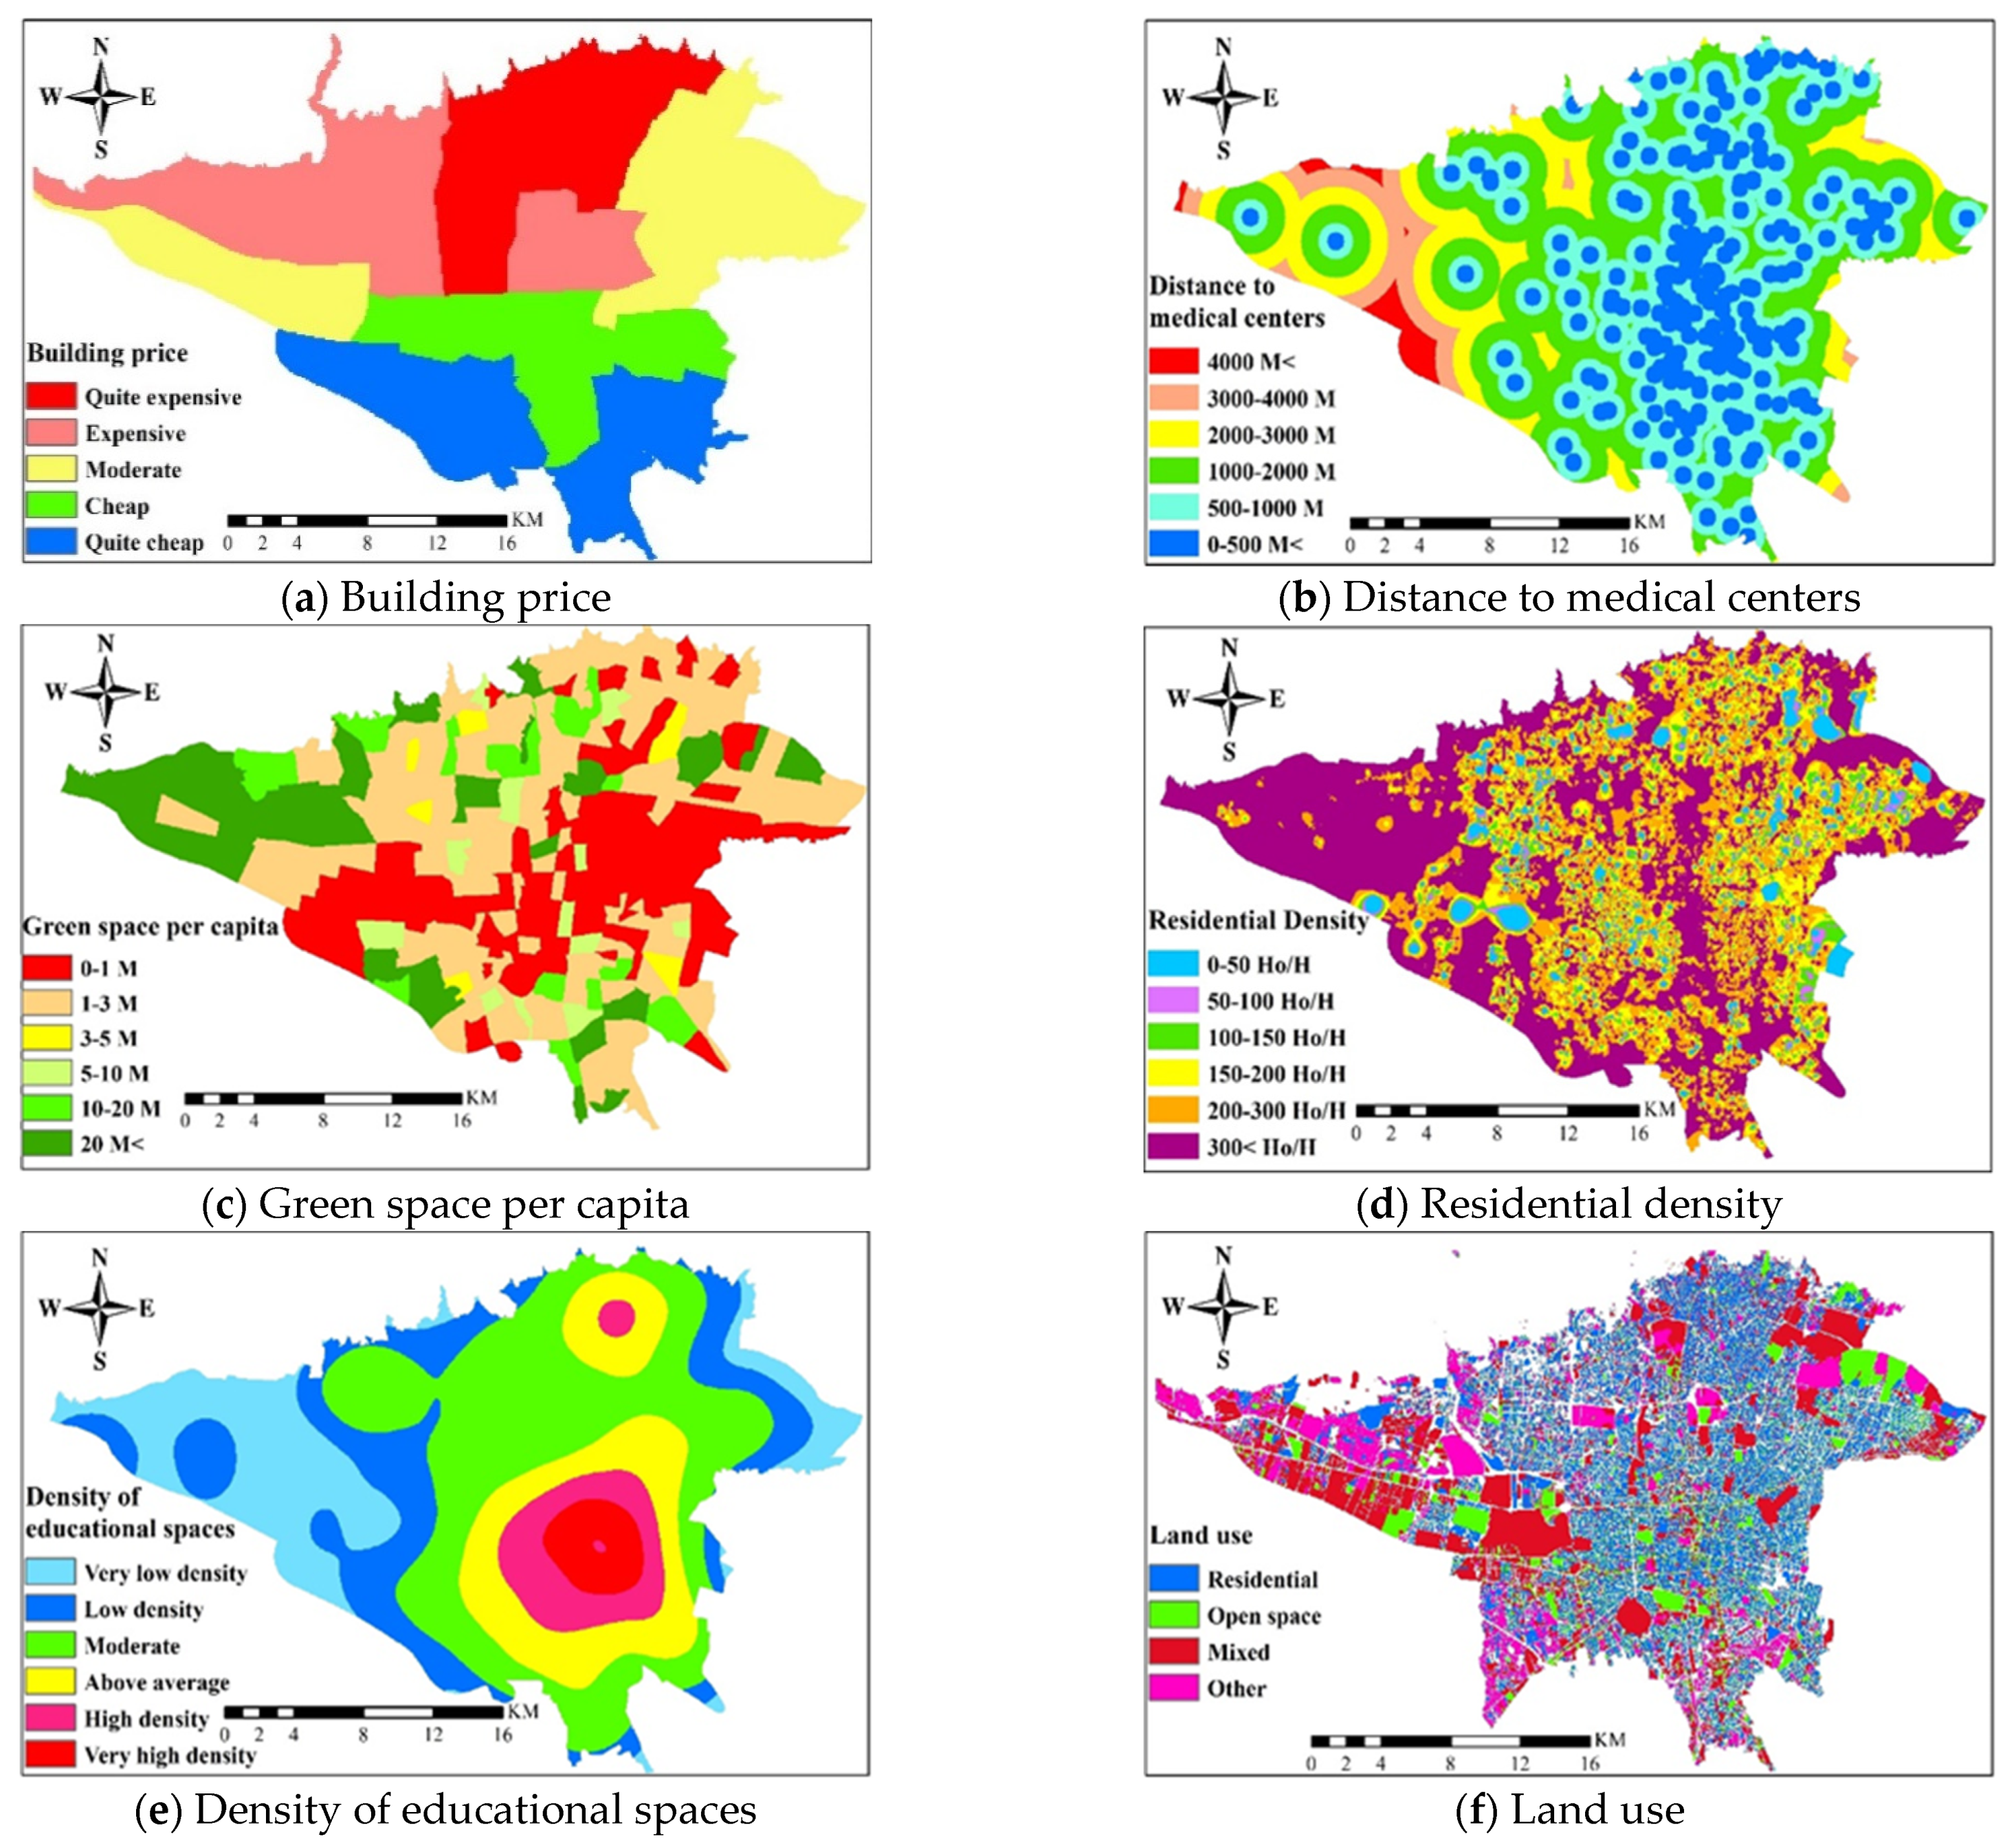
Figure 5 shows the criteria maps, including house prices, distance to medical centers, per capita green space, residential density, the density of educational spaces, and land use. The housing-price map was created based on experience, questionnaires, local research from real-estate agencies, and price analyses in housing-search applications (Figure 5a). Northern Tehran is the most expensive area, while the south is the cheapest. Also, the west is more expensive than the east, and the city center has prices close to those in the west due to its proximity to services. Most of the medical centers are located in the city center, such that those in the city center are within 1000 m of a medical center (Figure 5b). However, the distance to the medical centers increases from the center to the west and is even greater than 4000 m in some areas. Per capita green space is the lowest in the center of Tehran (less than one meter) (Figure 5c). About half of the city has between 1 and 3 m green space per capita. Nearly 85% of Tehran’s metropolis has 0–3 m of green space per capita. However, the per capita green space is very high in the west of Tehran.
The highest area of Tehran is in the north of the city and the west, where there are 300 households per hectare (Figure 5d). This is explained by the prevalence of very high-rise apartments (usually more than ten floors). In the city center, the residential density is lower than in other areas (west, north and south) because there are many other forms of land use/land cover, such as medical, educational, and administrative areas. Figure 5e shows the density of educational spaces. There are very high numbers of educational spaces in the center towards the east and southeast. On the other hand, the western part of Tehran has a low density of educational spaces. Figure 5f shows the land-use pattern. A major part of Tehran is naturally made up of residential land use in the north, south and east. In the periphery (especially in the west), the land use/land cover becomes more diverse.

3.3. Spatial Distribution of Neighborhood Resilience

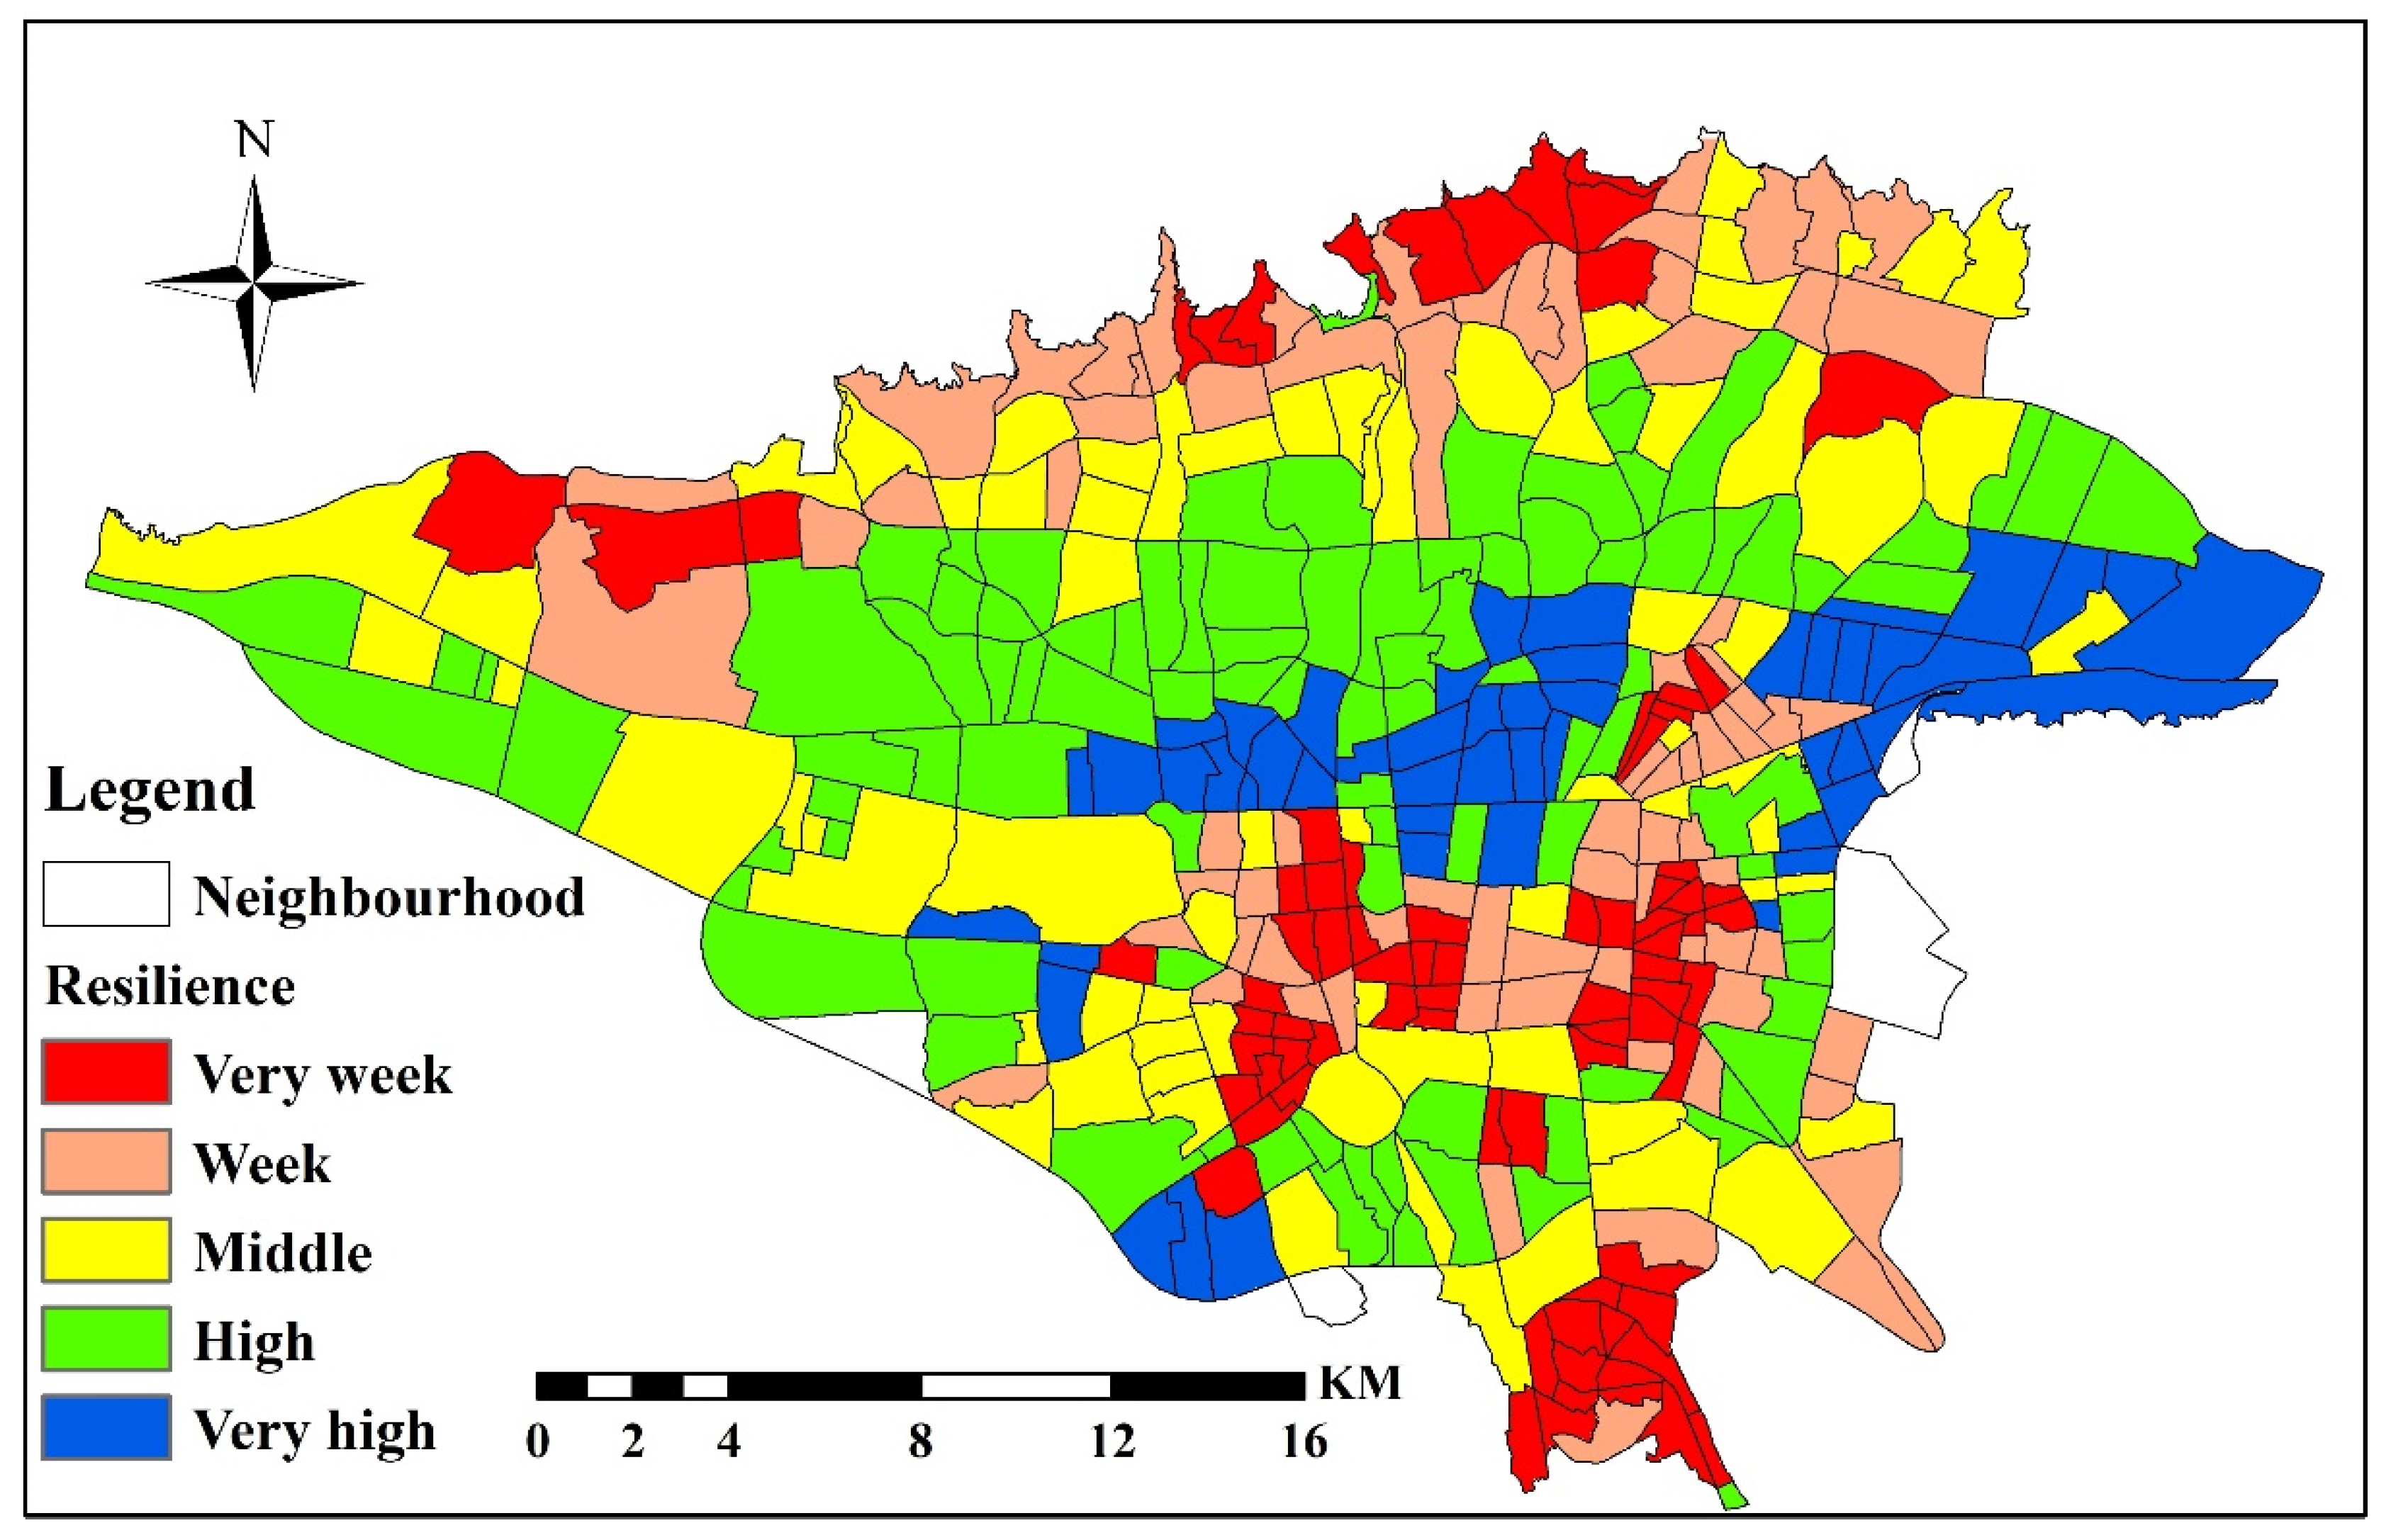
Figure 6 demonstrates the resilience-rank pattern of the Tehran metropolis. Figure 6a shows the resilience map developed using the ANP method. Some areas of the city’s south, northern margins, and center have low resilience based on the ANP method (Figure 6a). The resilience in most of the city’s southern areas is lower than in the northern ones. It is interesting that there are no very-high-resilience neighborhoods in the west or the north edge. Figure 6b shows the resilience pattern determined using the BWM. The majority of neighborhoods with a low level of resilience (low and very low resilience) are in the south, center, and north edge. The neighborhoods with very high resilience are between the city center and the north.
The integrated map shows that the north and south of the city have very weak resilience. The east of the city has a better resilience than the west of the city. It can be found that only a few neighborhoods in the west are very highly resilient according to the ANP method, but no very-high-resilience neighborhood was found by the BWM method. The areas with high and very high resilience are often located in the center towards the north, but the complete opposite is true from the center towards the south. In the north-south division, the city’s northern half has better resilience than the southern half. Also, the pattern shown in this map is more similar to that of the ANP map.
Table 9 shows the number of neighborhoods in each resilience class according to the corresponding two methods. The greatest number of neighborhoods with a “very low” label is 83 and was found according to the combined method, while the lowest number is 28 and was found according to the ANP. On the other hand, the ANP, with 75 neighborhoods, has the greatest number of neighborhoods in the very-high-resilience category. With 43 neighborhoods, the BWM has the fewest neighborhoods in the very-high-resilience category. The numbers of neighborhoods with low and very low resilience for the ANP, the BWM and the combined method are 117, 157 and 155, respectively. On the other hand, the numbers of neighborhoods with high and very high resilience for the ANP, the BWM, and the combined method are 178, 151, and 146, respectively. This implies that the number of neighborhoods is closer when the course classes are employed.
Table 10 shows the first 20 neighborhoods whose resilience rating is between 1–20 based on the two methods and their combined method. The most resilient neighborhood is Iranshahr. The order of neighborhoods in ranks 1 to 5 is the same in all methods, including the combined-results method. Furthermore, it should be noted that the neighborhoods ranked from 6th to 20th show only a small degree of place changes between the methods. This shows the high-resilience quality of these neighborhoods. Therefore, even though the weight and importance of the criteria are different in different methods, these five neighborhoods have maintained their rank order, which, as said, shows their real quality. This means that these areas experience a low degree of impact when any risk event occurs.
Table 11 shows the 20 neighborhoods with the lowest resilience. These low- and very-low-resilience neighborhoods are actually a high priority for regeneration. Sartakht, Mansoorieh, Mongol, and Jalili have the lowest resilience in all the outputs, respectively ranking 1 to 3. They have the lowest resilience rating of all outputs. This places them as being the highest priority for regeneration. It should be noted that the regeneration-priority neighborhoods ranked 1 to 5 somehow match between methods despite the fact that place order changes between 1 to 5. These results are consistent with the results in Figure 6 and Figure 7.
Generally, according to the local residential experiences, the north and west of Tehran are luxury areas, while these lowest-resilience areas are poor areas. The results of this study show that these areas are characterized by proximity to the fault and low per capita green space in the north of the city but by poor space syntax, high housing prices, lack of educational centers, and low density of fire stations in the west. All these factors have caused low or very low resilience in the north and west of Tehran. Assessing neighborhood resilience and regeneration priority requires a set of combined factors to represent neighborhood resiliencies. Therefore, the present models capture the main factors.

3.4. Discussion

MCDM methods have evolved to evaluate urban resilience and regeneration prioritization under environmental changes and risks. However, there are various MCDM methods. Since these methods use different algorithms and their uncertainties, comparing them using several techniques is common practice. In this study, we compared the results of ANP and BWM and their combination. Generally, two MCDMs captured the patterns of the neighborhood resilience and regeneration priorities.
Furthermore, the three outputs ranked the same neighborhood, Sartakht, as the lowest-resilience neighborhood and Iranshahr as the highest-resilience neighborhood, However, there are differences in the number and pattern of neighborhood resilience and regeneration priorities between the three outputs. Also, the results of this study were compared with those of the AHP method [87]. The number of very-low-resilience neighborhoods identified using the ANP is much lower than the numbers identified using the AHP and the BWM. This implies that the west and north of the city have high and higher resilience according to the ANP, which is consistent with the local people’s beliefs because these areas are rich and luxurious to live in. By examining the results of the weights of the different models, it can be concluded that the weights obtained from the AHP and ANP are much closer due to their similar structures. However, the weights obtained from the BWM were much different from those obtained from the AHP and ANP due to their different structures. The difference in weights reached more than five units (in C3) with the BWM compared to the other two methods. Furthermore, there were minimal differences in weights between the AHP and ANP methods. For a small number of criteria (i.e., C5, C6, C7, and C8), the differences between the AHP and ANP methods are greater than 1%. The differences between most criteria are less than 0.1.
The pattern of the ANP map is highly similar to the pattern of the map generated using the AHP method. The main difference is that the number of very-low-resilience neighborhoods identified using the ANP method is less than the number identified using the AHP method. On the other hand, the number of very-high-resilience neighborhoods has increased because a neighborhood in the west is marked as having very high resilience. The resilience pattern generated using BWM is similar to that of the AHP map. Therefore, despite the many MCDMs, the results of one method might be quite different from those of another. This means there are differences in regeneration priority and anticipated costs.
Problems may be due to the interdependence between criteria and alternatives, as well as to the subjectivity of selection of the criteria used to determine resilience ranking. The decision criteria and resilience rank are usually non-quantitative but must be represented mathematically. This could cause inconsistencies between judgment and ranking criteria in different MCDM methods. Furthermore, the overall score is aggregated from all the scores. When the overall score is applied to rank-order calculation and eventual preference, the prescriptions of MCDM need to represent actual or real decision-making processes based in human psychology and behavior [91]. However, it is still difficult to mathematize real human decision-making processes and to provide a clear methodology for weighting coefficients. Thus, an MCDM may create uncertainties when representing the real preferences associated with human decision-making or when aggregating these preferences as per the expectations. A reliable description of human decision-making in MCDA could improve the inconsistency between simulated and observed resilience. Therefore, future research needs to explore whether the representations of the MCDM method, such as criteria selection, preference, and resilience ranking, represent reality as well as possible. Further analysis needs to verify the results and to benchmark issues of resilience ranking in assessing the capabilities of any MCDM.
Despite some differences between the two methods, they yield similar trends and patterns. Resilience maps are useful for urban management and policy. For some low-resilience neighborhoods, urban decision-makers should provide more measures to protect against risk or fault, such as fire and flooding. On the other hand, in urban-regeneration plans, decision-makers can use resilience maps to prioritize the regeneration of poor-resilience neighborhoods.

4. Conclusions

The rapid growth of cities without planning results in difficulties in urban resilience and prioritizing urban regeneration for urban management and planning, especially in developing countries. This study has applied two MCDMs, including the ANP and the BWM (and a comparative study with the AHP) and a combination of the two (the ANP and the BWM), to evaluate the resilience of metropolitan neighborhoods in Tehran. Fourteen criteria were selected to represent the city’s resilience, including building age, population density, distance from fault, etc. Two MCDMs were compared to find the best method for classifying urban resilience and prioritizing neighborhood regeneration. The results showed that the building age in was the most crucial criterion the AHP and the ANP, while the building age and building materials were the most crucial criteria in the BWM. The weights of the most important criterion, building age (C1), were 19.53, 19.56 and 18.98, respectively, according to the AHP, ANP and BWM. In contrast, the weights of the least important criterion, per capita green space (C11), were 2.214, 2.197 and 1.655, respectively. Furthermore, the results indicated that the northern half of Tehran is more resilient than the southern part of the metropolis. Also, resilience in the east of the city was higher than in the west. Furthermore, it should be mentioned that when several methods are available to investigate a subject, the use of a model must be verified. If this is not done, the simultaneous use of multiple models can help to resolve inherent uncertainties, and their combination can improve results. This enables more robust decision-making by applying resilience ranks and regeneration priorities. Quantifying resilience rank and regeneration priority can help the relevant institutions for the planning and management of urban systems for sustainable development. It should be noted at the end that any model has a limited capacity to estimate the needs of the scientific community and solve the general problems of society. Therefore, it is suggested that this kind of research be expanded. In future studies, different criteria should be analyzed in different case studies. The criteria should include flood analysis, heat islands, etc. The approach of increasing the use of satellite images in this type of research will also improve the results.

Author Contributions

Conceptualization, M.M.; methodology, J.H., M.M. and M.R.; Software, J.H. and M.M.; Validation, J.H.; Formal analysis, J.H. and J.W.; Investigation, J.H., A.N.N. and H.M.; Resources, M.S.; Data curation, M.R.; Writing—original draft, J.H., M.S., A.N.N. and H.M.; Writing—review & editing, J.W., R.R., F.D. and M.A.M.; Visualization, J.H.; Supervision, J.W., R.R. and M.A.M. All authors have read and agreed to the published version of the manuscript.

Funding

This research received no external funding.

Data Availability Statement

The raw data supporting the conclusions of this article will be available on request.

Acknowledgments

We would like to thank Seyed Mohammad Haghighi Fard for the invaluable feedback about the AHP data.

Conflicts of Interest

The authors declare that they have no known competing financial interests or personal relationships that could have appeared to influence the work reported in this paper.

References

  1. Wang, X.R.; Hui, E.C.M.; Choguill, C.; Jia, S.H. The New Urbanization Policy in China: Which Way Forward? Habitat Int. 2015, 47, 279–284. [Google Scholar] [CrossRef]
  2. Guan, X.; Wei, H.; Lu, S.; Dai, Q.; Su, H. Assessment on the Urbanization Strategy in China: Achievements, Challenges and Reflections. Habitat Int. 2018, 71, 97–109. [Google Scholar] [CrossRef]
  3. United Nations (UN). World Urbanization Prospects: The 2014 Revision; United Nations: New York, NY, USA, 2014. [Google Scholar]
  4. Elmqvist, T.; Andersson, E.; Frantzeskaki, N.; McPhearson, T.; Olsson, P.; Gaffney, O.; Folke, C. Sustainability and Resilience for Transformation in the Urban Century. Nat. Sustain. 2019, 2, 267–273. [Google Scholar] [CrossRef]
  5. United Nations (UN). 68% of the World Population Projected to Live in Urban Areas by 2050, Says UN. Available online: https://www.un.org/development/desa/en/news/population/2018-revision-of-world-urbanization-prospects.html (accessed on 18 December 2023).
  6. Du, J.; Fu, Q.; Fang, S.; Wu, J.; He, P.; Quan, Z. Effects of Rapid Urbanization on Vegetation Cover in the Metropolises of China Over the Last Four Decades. Ecol. Indic. 2019, 107, 105458. [Google Scholar] [CrossRef]
  7. Manalo, J.A.; Matsumoto, J.; Takahashi, H.G.; Villafuerte, M.Q.; Olaguera, L.M.P.; Ren, G.; Cinco, T.A. The Effect of Urbanization on Temperature Indices in the Philippines. Int. J. Climatol. 2022, 42, 850–867. [Google Scholar] [CrossRef]
  8. Kaviani, A.; Mansourian, H.; Farhoudi, R. Urban Growth Pattern in Tehran City: Sustainability or Unsustainability. J. Urban Manag. Energy Sustain. 2019, 1, 1–12. [Google Scholar]
  9. Baharlou-Houreh, N.; Masaeli, N.; Afshari, E.; Mohammadzadeh, K. Performance Analysis of a Proton Exchange Membrane Fuel Cell with the Stair Arrangement of Obstacles in the Cathode Channel. Int. J. Numer. Methods Heat Fluid Flow 2023, 33, 3940–3966. [Google Scholar] [CrossRef]
  10. Hurlimann, A.; Barnett, J.; Fincher, R.; Osbaldiston, N.; Mortreux, C.; Graham, S. Urban Planning and Sustainable Adaptation to Sea-Level Rise. Landsc. Urban Plan. 2014, 126, 84–93. [Google Scholar] [CrossRef]
  11. Masaeli, N.; Afshari, E.; Baniasadi, E.; Baharlou-Houreh, N. Performance Studies of a Membrane-Based Water and Heat Exchanger Using Serpentine Flow Channels for Polymer Electrolyte Membrane Fuel Cell Application. Appl. Therm. Eng. 2023, 222, 119950. [Google Scholar] [CrossRef]
  12. Robinson, J. Cities in a World of Cities: The Comparative Gesture. Int. J. Urban Reg. Res. 2011, 35, 1–23. [Google Scholar] [CrossRef]
  13. Sadidi, J.; Maleki, M.; Rahmati, M.; Tavakkoli, S.M. Investigating the Role of Faults in the Establishment and Survival of Settlements Using Remote Sensing and Geographic Information System (GIS). The Case of Sahneh County in Iran. J. Settl. Spat. Plan. 2016, 7, 201–206. [Google Scholar]
  14. Kiambi, S.; Alarcon, P.; Rushton, J.; Murungi, M.K.; Muinde, P.; Akoko, J.; Fèvre, E.M. Mapping Nairobi’s Dairy Food System: An Essential Analysis for Policy, Industry and Research. Agric. Syst. 2018, 167, 47–60. [Google Scholar] [CrossRef]
  15. Girard, L.F. Creativity and the Human Sustainable City: Principles and Approaches for Nurturing City Resilience. In Sustainable City and Creativity: Promoting Creative Urban Initiatives. Available online: https://www.taylorfrancis.com/books/e/9781317047957/chapters/10.4324/9781315611464-13 (accessed on 29 October 2018).
  16. Falco, G.J. City Resilience through Data Analytics: A Human-Centric Approach. Procedia Eng. 2015, 118, 1008–1014. [Google Scholar] [CrossRef]
  17. Jia, Z.; Li, S.; Wang, L. Assessment of Soil Heavy Metals for Eco-Environment and Human Health in a Rapidly Urbanization Area of the Upper Yangtze Basin. Sci. Rep. 2018, 8, 3256. [Google Scholar] [CrossRef] [PubMed]
  18. Zhu, S.; Li, D.; Feng, H. Is Smart City Resilient? Evidence from China. Sustain. Cities Soc. 2019, 50, 101636. [Google Scholar] [CrossRef]
  19. Zabaniotou, A. A Systemic Approach to Resilience and Ecological Sustainability During the COVID-19 Pandemic: Human, Societal, and Ecological Health as a System-Wide Emergent Property in the Anthropocene. Glob. Transit. 2020, 2, 116–126. [Google Scholar] [CrossRef] [PubMed]
  20. Abjani, F.; Madhavan, P.; Chong, P.P.; Chinna, K.; Rhodes, C.A.; Lim, Y.A.L. Urbanization and Its Associated Factors Affecting Human Gut Microbiota: Where Are We Heading To? Ann. Hum. Biol. 2023, 50, 137–147. [Google Scholar] [CrossRef]
  21. Sharifi, A.; Yamagata, Y. Resilience-Oriented Urban Planning. In Resilience-Oriented Urban Planning: Theoretical and Empirical Insights; Springer: Berlin/Heidelberg, Germany, 2018; pp. 3–27. [Google Scholar]
  22. Herrman, H.; Stewart, D.E.; Diaz-Granados, N.; Berger, E.L.; Jackson, B.; Yuen, T. What Is Resilience? Can. J. Psychiatry 2011, 56, 258–265. [Google Scholar]
  23. Abdoli, N.; Hosseinzadeh, A. Assessing Spatial Equity of Public Transit Demand Amid COVID-19. In International Conference on Transportation and Development 2021; ASCE: Austin, TX, USA, 2021; pp. 513–520. [Google Scholar]
  24. Masaeli, N.; Afshari, E.; Baniasadi, E.; Baharlou-Houreh, N.; Ghaedamini, M.J.A.E. Experimental Analysis of Water Transfer and Thermal–Hydraulic Performance of Membrane Humidifiers with Three Flow Field Designs. Appl. Energy 2023, 336, 120823. [Google Scholar] [CrossRef]
  25. Farzad Behtash, M.R.; Keynejhad, M.A.; Taghi Pirbabaei, M.; Asgary, A. Evaluation and Analysis of Dimensions and Components of Tabriz Metropolis Resiliency. Honar-Ha-Ye-Ziba Memary Va Shahrsazi 2013, 18, 33–42. [Google Scholar]
  26. Jamil, S. Suffering in Silence: The Resilience of Pakistan’s Female Journalists to Combat Sexual Harassment, Threats and Discrimination. J. Pract. 2020, 14, 150–170. [Google Scholar] [CrossRef]
  27. Kalniete, S.; Pildegovičs, T. Strengthening the EU’s Resilience to Hybrid Threats. Eur. View 2021, 20, 23–33. [Google Scholar] [CrossRef]
  28. Ertan, T.; Eğercioğlu, Y. Historic City Center Urban Regeneration: Case of Malaga and Kemeraltı, Izmir. Procedia-Soc. Behav. Sci. 2016, 223, 601–607. [Google Scholar] [CrossRef]
  29. Durantini, M. Regenerating the Urban Outskirts: A Self-Sufficient Ecovillage in Milan’s Bovisasca Area. Ph.D. Thesis, Politecnico di Torino, Torino, Italy, 2023. [Google Scholar]
  30. Romero-Lankao, P.; Gnatz, D.M.; Wilhelmi, O.; Hayden, M. Urban Sustainability and Resilience: From Theory to Practice. Sustainability 2016, 8, 1224. [Google Scholar] [CrossRef]
  31. Korkmaz, C.; Balaban, O. Sustainability of Urban Regeneration in Turkey: Assessing the Performance of the North Ankara Urban Regeneration Project. Habitat Int. 2020, 95, 102081. [Google Scholar] [CrossRef]
  32. McLafferty, S.L. GIS and Health Care. Annu. Rev. Public Health 2003, 24, 25–42. [Google Scholar] [CrossRef] [PubMed]
  33. Zhao, L.; Mbachu, J.; Liu, Z. Developing an Integrated BIM+GIS Web-Based Platform for a Mega Construction Project. KSCE J. Civ. Eng. 2022, 26, 1505–1521. [Google Scholar] [CrossRef]
  34. Yao, S.; Loo, B.P.; Yang, B.Z. Traffic Collisions in Space: Four Decades of Advancement in Applied GIS. Ann. GIS 2016, 22, 1–14. [Google Scholar] [CrossRef]
  35. Maleki, M.; Asadi, M.; Naghadehi, S.Z.; Khosravi, A.; Wang, J.; Stewart, I.D.; Shakeryari, M. Detecting Local Climate Zone Change and Its Effects on PM10 Distribution Using Fuzzy Machine Learning in Tehran, Iran. Urban Clim. 2023, 49, 101506. [Google Scholar] [CrossRef]
  36. Kazemi Garajeh, M.; Haji, F.; Tohidfar, M.; Sadeqi, A.; Ahmadi, R.; Kariminejad, N. Spatiotemporal Monitoring of Climate Change Impacts on Water Resources Using an Integrated Approach of Remote Sensing and Google Earth Engine. Sci. Rep. 2024, 14, 5469. [Google Scholar] [CrossRef]
  37. Maleki, M.; Van Genderen, J.L.; Tavakkoli-Sabour, S.M.; Saleh, S.S.; Babaee, E. Land Use/Cover Change in Dinevar Rural Area of West Iran During 2000–2018 and Its Prediction for 2024 and 2030. Geogr. Tech. 2020, 15, 93–105. [Google Scholar] [CrossRef]
  38. Wang, J.; Bretz, M.; Dewan, M.A.A.; Delavar, M.A. Machine Learning in Modelling Land-Use and Land Cover-Change (LULCC): Current Status, Challenges and Prospects. Sci. Total Environ. 2022, 822, 153559. [Google Scholar] [CrossRef] [PubMed]
  39. Jasrotia, A.S.; Majhi, A.; Singh, S. Water Balance Approach for Rainwater Harvesting Using Remote Sensing and GIS Techniques, Jammu Himalaya, India. Water Resour. Manag. 2009, 23, 3035–3055. [Google Scholar] [CrossRef]
  40. Li, Y.; Abdelkareem, M.; Al-Arifi, N. Mapping Potential Water Resource Areas Using GIS-Based Frequency Ratio and Evidential Belief Function. Water 2023, 15, 480. [Google Scholar] [CrossRef]
  41. Sun, C.G.; Chun, S.H.; Ha, T.G.; Chung, C.K.; Kim, D.S. Development and Application of a GIS-Based Tool for Earthquake-Induced Hazard Prediction. Comput. Geotech. 2008, 35, 436–449. [Google Scholar] [CrossRef]
  42. Makinano-Santillan, M.; Serviano, J.; Rubillos, C.K.; Amora, A.; Santillan, J.R.; Morales, E.M.; Gingo, A.L. Near-Real Time Hazard Monitoring and Information Dissemination through Integration of Remote Sensing, GIS, Numerical Modelling, Web Applications and Social Media. ISPRS Ann. Photogramm. Remote Sens. Spatial Inf. Sci. 2019, 4, 25–32. [Google Scholar] [CrossRef]
  43. Maleki, M.; Salman, M.; Sahebi Vayghan, S.; Szabo, S. GIS-Based Sinkhole Susceptibility Mapping Using the Best Worst Method. Spat. Inf. Res. 2023, 31, 537–545. [Google Scholar] [CrossRef]
  44. Doan, T.; Guo, X. Understanding Bison Carrying Capacity Estimation in Northern Great Plains Using Remote Sensing and GIS. Can. J. Remote Sens. 2019, 45, 139–162. [Google Scholar] [CrossRef]
  45. Rikalovic, A.; Cosic, I.; Lazarevic, D. GIS Based Multi-criteria Analysis for Industrial Site Selection. Procedia Eng. 2014, 69, 1054–1063. [Google Scholar] [CrossRef]
  46. Karimi, H.; Hossini, H.; Amin, A.A. Municipal Landfill Site Selection and Environmental Impacts Assessment Using Spatial Multi-criteria Decision Analysis: A Case Study. In Computers in Earth and Environmental Sciences; Elsevier: Amsterdam, The Netherlands, 2022; pp. 235–244. [Google Scholar]
  47. Yeh, A.G. Urban Planning and GIS. Geogr. Inf. Syst. 1999, 2, 1. [Google Scholar]
  48. City Resilience Index. Available online: https://www.arup.com/insights/city-resilience-index/#:~:text=The%20City%20Resilience%20Index%20has,measure%20relative%20performance%20over%20time (accessed on 30 June 2024).
  49. Ebrahimi Sirizi, M.; Taghavi Zirvani, E.; Esmailzadeh, A.; Khosravian, J.; Ahmadi, R.; Mijani, N.; Jokar Arsanjani, J. A Scenario-Based Multi-Criteria Decision-Making Approach for Allocation of Pistachio Processing Facilities: A Case Study of Zarand, Iran. Sustainability 2023, 15, 15054. [Google Scholar] [CrossRef]
  50. Khosravian, J.; Qureshi, S.; Rostamzadeh, S.; Moradi, B.; Derakhshesh, P.; Yousefi, S.; Nickravesh, F. Evaluating the Feasibility of Constructing Shopping Centers on Urban Vacant Land through a Spatial Multi-Criteria Decision-Making Model. Front. Sustain. Cities 2024, 6, 1373331. [Google Scholar] [CrossRef]
  51. Lee, G.; Choi, J.; Jun, K.S. MCDM Approach for Identifying Urban Flood Vulnerability under Social Environment and Climate Change. J. Coastal Res. 2017, 79, 209–213. [Google Scholar] [CrossRef]
  52. Aghmashhadi, A.H.; Azizi, A.; Hoseinkhani, M.; Zahedi, S.; Cirella, G.T. Aquaculture Site Selection of Oncorhynchus Mykiss (Rainbow Trout) in Markazi Province Using GIS-Based MCDM. ISPRS Int. J. Geo-Inf. 2022, 11, 157. [Google Scholar] [CrossRef]
  53. Lu, P.; Sun, Y.; Steffen, N. Scenario-Based Performance Assessment of Green-Grey-Blue Infrastructure for Flood-Resilient Spatial Solution: A Case Study of Pazhou, Guangzhou, Greater Bay Area. Landsc. Urban Plan. 2023, 238, 104804. [Google Scholar] [CrossRef]
  54. Vytautas, B.; Marija, B.; Vytautas, P. Assessment of Neglected Areas in Vilnius City Using MCDM and COPRAS Methods. Procedia Eng. 2015, 122, 29–38. [Google Scholar] [CrossRef]
  55. Vijith, H.; Dodge-Wan, D. Modelling Terrain Erosion Susceptibility of Logged and Regenerated Forested Region in Northern Borneo through the Analytical Hierarchy Process (AHP) and GIS Techniques. Geoenvironmental Disasters 2019, 6, 1–18. [Google Scholar] [CrossRef]
  56. Kara, C.; Iranmanesh, A. Modelling and Assessing Sustainable Urban Regeneration for Historic Urban Quarters via Analytical Hierarchy Process. Land 2022, 12, 72. [Google Scholar] [CrossRef]
  57. Shen, L.Y.; Ochoa, J.J.; Shah, M.N.; Zhang, X. The Application of Urban Sustainability Indicators–A Comparison Between Various Practices. Habitat Int. 2011, 35, 17–29. [Google Scholar] [CrossRef]
  58. Haghshenas, H.; Vaziri, M. Urban Sustainable Transportation Indicators for Global Comparison. Ecol. Indic. 2012, 15, 115–121. [Google Scholar] [CrossRef]
  59. Muñoz-Erickson, T.A.; Meerow, S.; Hobbins, R.; Cook, E.; Iwaniec, D.M.; Berbés-Blázquez, M.; Robles-Morua, A. Beyond Bouncing Back? Comparing and Contesting Urban Resilience Frames in US and Latin American Contexts. Landsc. Urban Plan. 2021, 214, 104173. [Google Scholar] [CrossRef]
  60. Maleki, M.; Tavakkoli Sabour, S.M.; Zeaieanfirouzabadi, P.; Raeisi, M. Comparison of Optic and Radar Data for Terrain Feature Extraction. J. RS GIS Nat. Resour. 2018, 9, 93–107. [Google Scholar]
  61. Lak, A.; Gheitasi, M.; Timothy, D.J. Urban Regeneration through Heritage Tourism: Cultural Policies and Strategic Management. J. Tour. Cult. Change 2020, 18, 386–403. [Google Scholar] [CrossRef]
  62. Lak, A.; Hakimian, P.; Sharifi, A. An Evaluative Model for Assessing Pandemic Resilience at the Neighborhood Level: The Case of Tehran. Sustain. Cities Soc. 2021, 75, 103410. [Google Scholar] [CrossRef] [PubMed]
  63. Khankeh, H.R.; Farrokhi, M.; Khanjani, M.S.; Momtaz, Y.A.; Forouzan, A.S.; Norouzi, M.; Saatchi, M. The barriers, challenges, and strategies of COVID-19 (SARS-CoV-2) vaccine acceptance: A concurrent mixed-method study in Tehran City, Iran. Vaccines 2021, 9, 1248. [Google Scholar] [CrossRef]
  64. Ahani, M.; Arjmandi, R.; Hoveidi, H.; Ghodousi, J.; Miri Lavasani, M.R. A multi-objective optimization model for municipal waste management system in Tehran city, Iran. Int. J. Environ. Sci. Technol. 2019, 16, 5447–5462. [Google Scholar] [CrossRef]
  65. Farhadikhah, H.; Ziari, K. Social sustainability between old and new neighborhoods (case study: Tehran neighborhoods). Environ. Dev. Sustain. 2021, 23, 2596–2613. [Google Scholar] [CrossRef]
  66. Motlagh, S.H.B.; Pons, O.; Hosseini, S.A. Sustainability model to assess the suitability of green roof alternatives for urban air pollution reduction applied in Tehran. Build. Environ. 2021, 194, 107683. [Google Scholar] [CrossRef]
  67. Rashidi, M.; Seyedhosseini, S.M.; Naderan, A. Defining Psychological Factors of Cycling in Tehran City. Sustainability 2023, 15, 3264. [Google Scholar] [CrossRef]
  68. Shastri, PC Resilience: Building immunity in psychiatry. Indian J. Psychiatry 2013, 55, 224. [CrossRef]
  69. Marques, T.A.; Thomas, L.; Martin, S.W.; Mellinger, D.K.; Ward, J.A.; Moretti, D.J.; Tyack, P.L. Estimating animal population density using passive acoustics. Biol. Rev. 2013, 88, 287–309. [Google Scholar] [CrossRef] [PubMed]
  70. Gonçalves, D.N.S.; de Morais Gonçalves, C.; de Assis, T.F.; da Silva, M.A. Analysis of the difference between the Euclidean distance and the actual road distance in Brazil. Transp. Res. Procedia 2014, 3, 876–885. [Google Scholar] [CrossRef]
  71. Goldenberg, S.Z.; Douglas-Hamilton, I.; Wittemyer, G. Vertical transmission of social roles drives resilience to poaching in elephant networks. Curr. Biol. 2016, 26, 75–79. [Google Scholar] [CrossRef]
  72. O’donnell, L.; O’donnell, C.; Wardlaw, D.M.; Stueve, A. Risk and resiliency factors influencing suicidality among urban African American and Latino youth. Am. J. Community Psychol. 2004, 33, 37–49. [Google Scholar] [CrossRef]
  73. Abshirini, E.; Koch, D. Resilience, space syntax and spatial interfaces: The case of river cities. A|Z ITU J. Fac. Archit. 2017, 14, 25–41. [Google Scholar] [CrossRef]
  74. Salimi, M.; Al-Ghamdi, S.G. Climate change impacts on critical urban infrastructure and urban resiliency strategies for the Middle East. Sustain. Cities Soc. 2020, 54, 101948. [Google Scholar] [CrossRef]
  75. Gorji, M.A.; Hadavi, N.; Nahavandi, N. Improving urban resilience against climate change through government tax policies to housing companies: A game-theoretic approach. Urban Clim. 2023, 49, 101565. [Google Scholar] [CrossRef]
  76. Ahmadi, R.; Ghahremani, S.; Kivi, S.B.; Bayat, F.; Zareh, N.; Rohani, A.; Janianpour, P. Investigating social factors of residential satisfaction and the impact on housing price in spontaneous settlements in Tehran fringe. Open Access Libr. J. 2022, 9, 1–21. [Google Scholar] [CrossRef]
  77. Honey-Rosés, J. Urban resilience in perspective: Tracing the origins and evolution of urban green spaces in Barcelona. In Urban Resilience to the Climate Emergency: Unravelling the Transformative Potential of Institutional and Grassroots Initiatives; Springer International Publishing: Cham, Switzerland, 2022; pp. 45–63. [Google Scholar]
  78. Kordi, F.; Yousefi, H. Crop classification based on phenology information by using time series of optical and synthetic-aperture radar images. Remote Sens. Appl. Soc. Environ. 2022, 27, 100812. [Google Scholar] [CrossRef]
  79. Bertilsson, L.; Wiklund, K.; de Moura Tebaldi, I.; Rezende, O.M.; Veról, A.P.; Miguez, M.G. Urban flood resilience–A multi-criteria index to integrate flood resilience into urban planning. J. Hydrol. 2019, 573, 970–982. [Google Scholar] [CrossRef]
  80. Apostu, S.A.; Vasile, V.; Vasile, R.; Rosak-Szyrocka, J. Do Smart Cities Represent the Key to Urban Resilience? Rethinking Urban Resilience. Int. J. Environ. Res. Public Health 2022, 19, 15410. [Google Scholar] [CrossRef] [PubMed]
  81. Colding, J. ‘Ecological land-use complementation’ for building resilience in urban ecosystems. Landsc. Urban Plan. 2007, 81, 46–55. [Google Scholar] [CrossRef]
  82. Saaty, T.L.; Vargas, L.G. Decision Making with the Analytic Network Process; Springer Science+Business Media, LLC: Berlin, Germany, 2006; Volume 282. [Google Scholar]
  83. Asadabadi, M.R.; Chang, E.; Saberi, M. Are MCDM methods useful? A critical review of analytic hierarchy process (AHP) and analytic network process (ANP). Cogent Eng. 2019, 6, 1623153. [Google Scholar] [CrossRef]
  84. Maleki, M.; Jozak, A.; Sadidi, J. Identification of sinkhole prone areas in Biston-Paro karst basin. J. Geogr. Stud. Mountainous Areas 2020, 3, 67–80. [Google Scholar]
  85. Kasiri, Z.; Habibnejad Roshan, M.; Roshun, S.H. Groundwater Resources Potential Based on Geographic Information System (GIS) and Remote Sensing (RS) Using Analytic Network Process (ANP) (Case Study: Naz Sari Plain). Geogr. Environ. Plan. 2020, 31, 103–120. [Google Scholar]
  86. Han, Y.; Wang, Z.; Lu, X.; Hu, B. Application of AHP to road selection. ISPRS Int. J. Geo-Inf. 2020, 9, 86. [Google Scholar] [CrossRef]
  87. Haghighi Fard, S.M.; Doratli, N. Evaluation of resilience in historic urban areas by combining multi-criteria decision-making system and GIS, with sustainability and regeneration approach: The case study of Tehran (IRAN). Sustainability 2022, 14, 2495. [Google Scholar] [CrossRef]
  88. Rezaei, J. Best-worst multi-criteria decision-making method. Omega 2015, 53, 49–57. [Google Scholar] [CrossRef]
  89. Rezaei, J. Best-worst multi-criteria decision-making method: Some properties and a linear model. Omega 2016, 64, 126–130. [Google Scholar] [CrossRef]
  90. Lim, Y.J.; Basri, N.A. Sites Selection for a Potential Radioactive Waste Repository in Peninsular Malaysia: GIS-Based Weight Linear Combination and Multi-criteria Decision-Making Analysis. Prog. Nucl. Energy 2022, 149, 104252. [Google Scholar] [CrossRef]
  91. Dhurkari, R.K. MCDM methods: Practical difficulties and future directions for improvement. RAIRO-Oper. Res. 2022, 56, 2221–2233. [Google Scholar] [CrossRef]
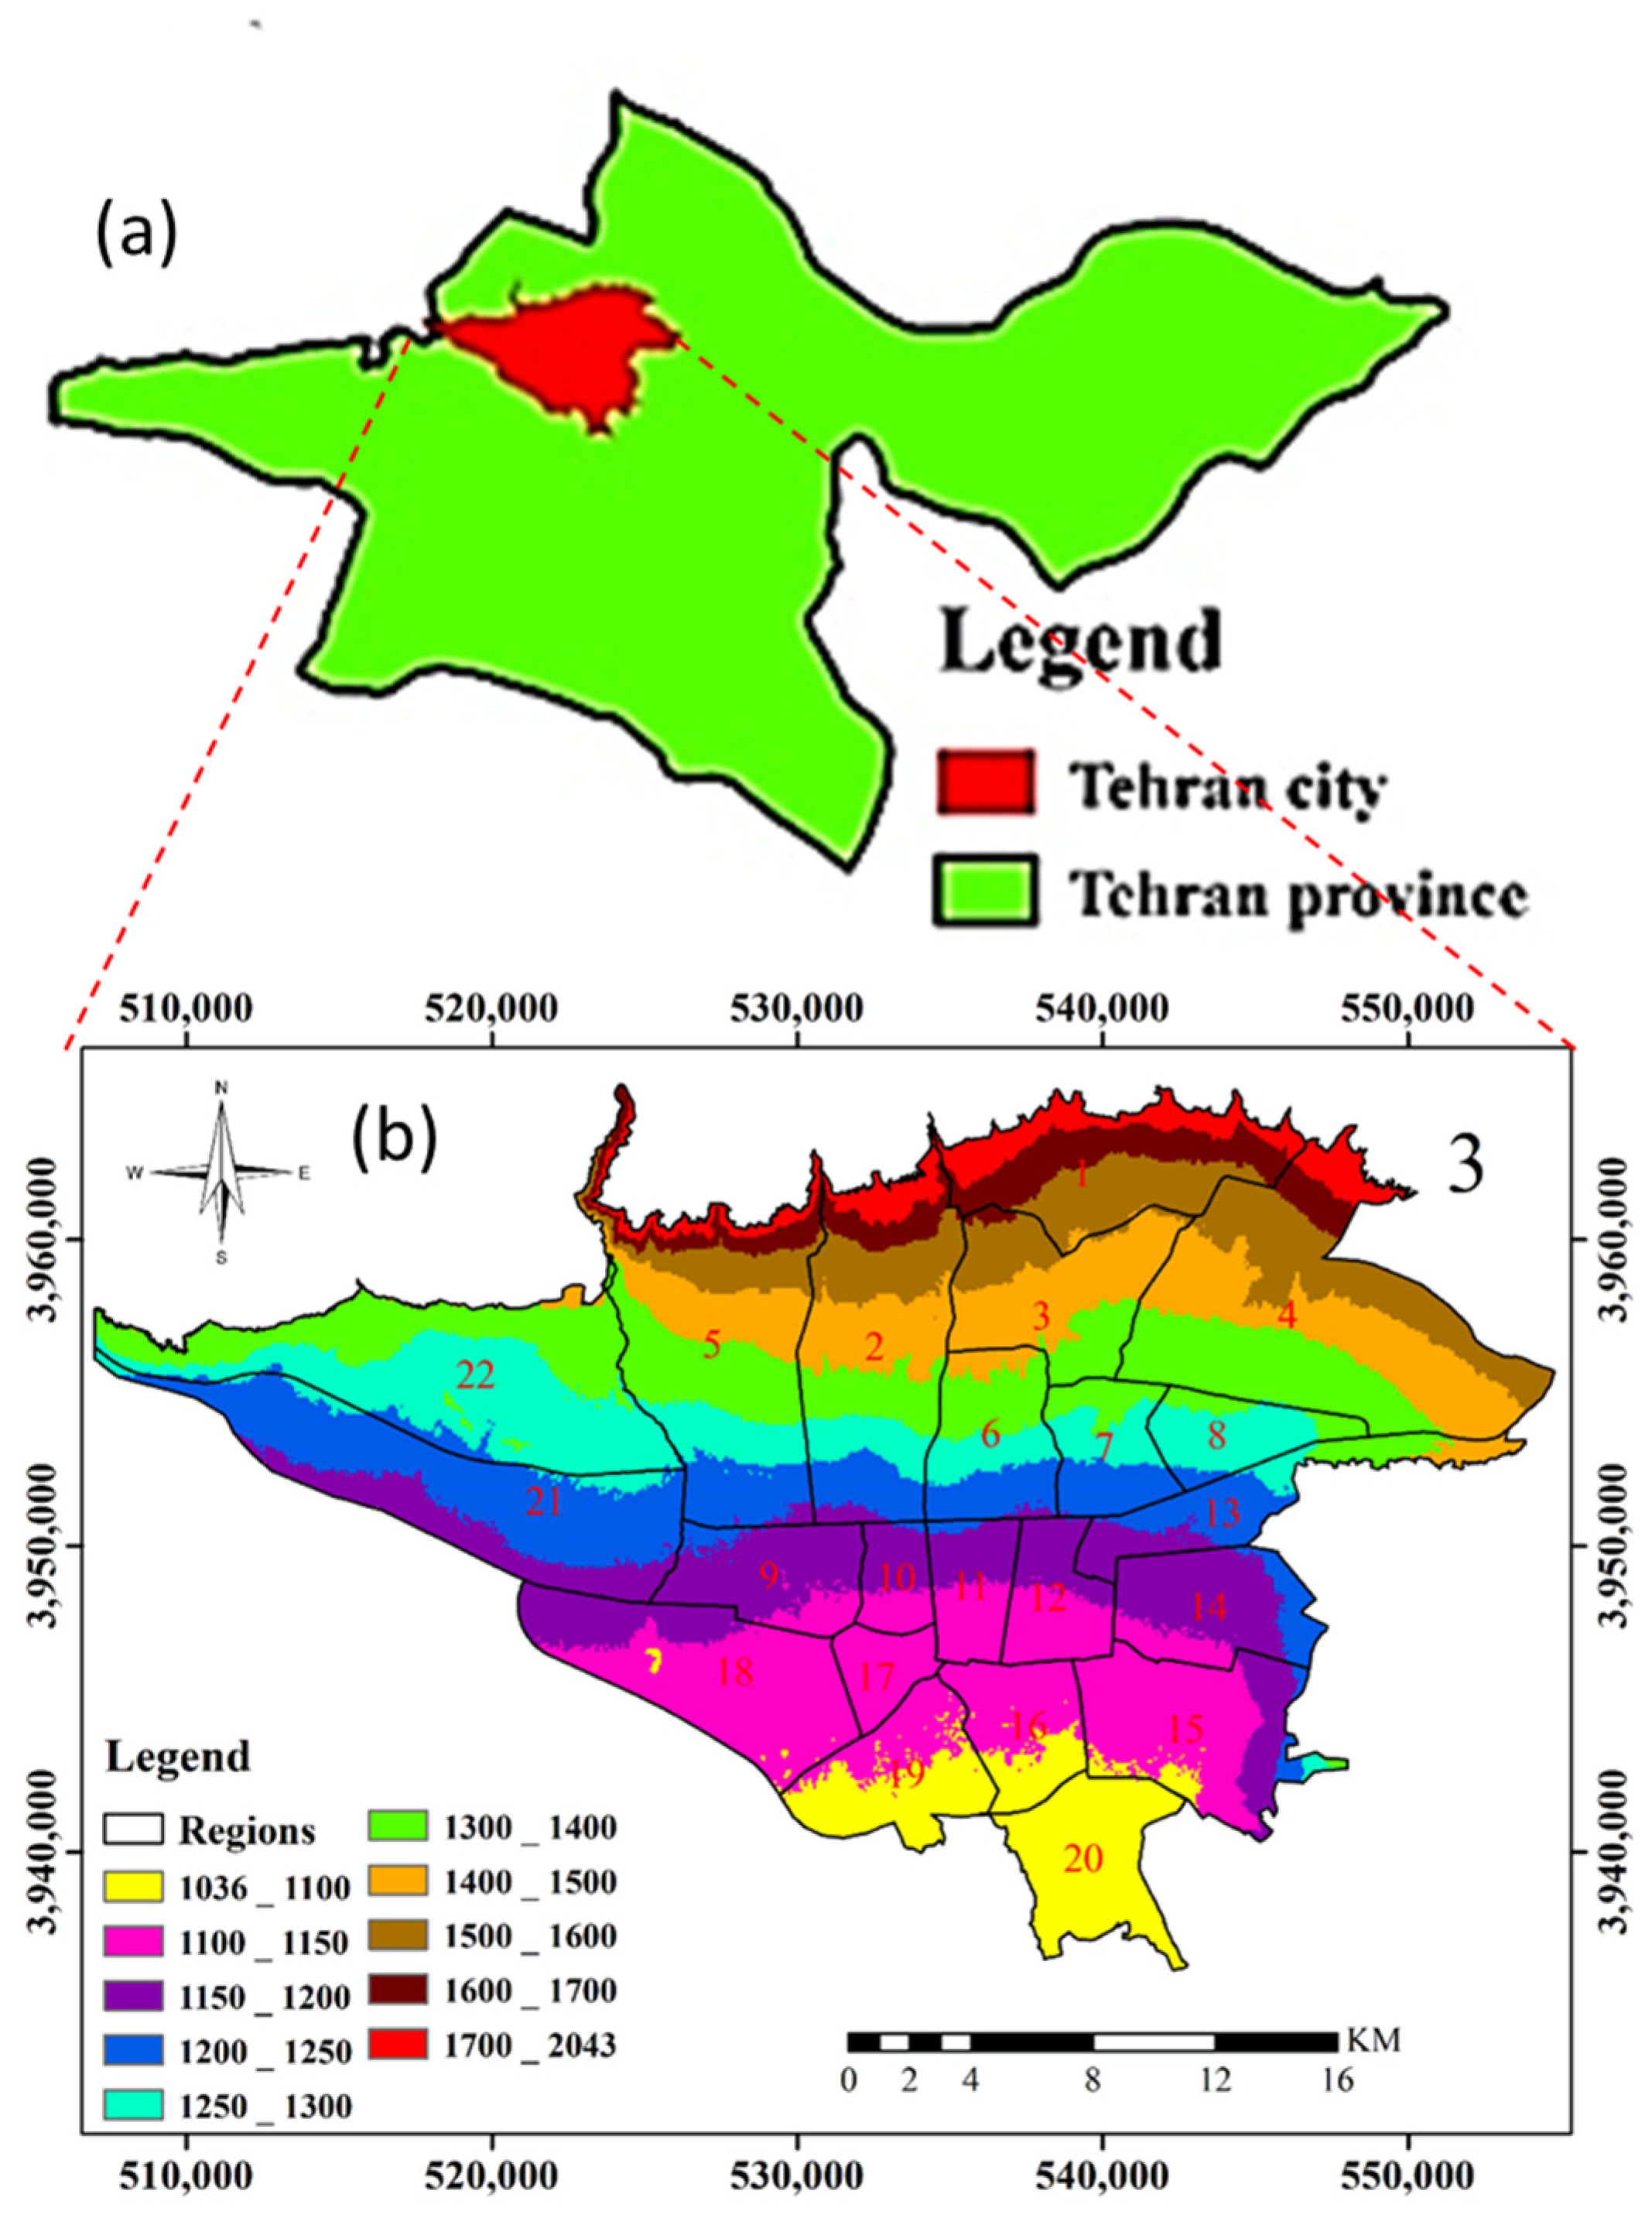
Figure 1. Study area: (a) Tehran province and (b) the Tehran metropolitan and its 22 districts.
Land 13 01008 g001
Figure 2. Flowchart of MCDM implementation.
Land 13 01008 g002
Figure 3. Illustration of criteria weights: ANP (blue) and BWM (red).
Land 13 01008 g003
Figure 4. Criteria’s map.
Land 13 01008 g004
Figure 5. Criteria’s map.
Land 13 01008 g005
Figure 6. Resilience maps of Tehran metropolis.
Land 13 01008 g006
Figure 7. Resilience maps of Tehran metropolis based on combined methods.
Land 13 01008 g007
Table 1. Criteria used for resilience ranking.
CriteriaExplanationFormulaEffectReferences
Building age (C1)Increasing the age of the structure has a negative effect on resilience. The information on this criterion was received from Tehran Municipality. [68]
Population density
(C2)
With the increase in population, the probability of disaster associated with environmental/human-created hazards increases, and the increase in population density has a negative effect on resilience. Population density is calculated by dividing the population by unit area (hectares or kilometers, etc.). P o p d e n s i t y = P o p t o t A r e a ( h a ) [69]
Distance from fault(C3)The distance from a fault is one of the parameters directly related to environmental hazards. It emphasizes the reconstruction of high-risk areas in cases of low security levels in terms of population density, etc. Euclidean distance was used for this measure. d i s t ( p , q ) = ( x p x q ) 2 + ( y p y q ) 2 +[70]
Age Composition (C4)For this criterion, sensitive age groups (young persons less than 14 years old and older persons more than 65 years old) are collected and divided into the total population. Because the population (young and old) are sensitive groups, resilience decreases whenever this ratio increases.Agecompo = Y + O P o p [71]
Gender ratio
(C5)
This criterion is obtained by dividing the population of women by that of men men, and considering that the women’s society is more vulnerable, a high ratio of this index makes this criterion negative for resilience. s e x   r a t i o = w o m e n m e n [72]
Space syntax
(C6)
This criterion shows how each part of the city is connected (streets, metro, BRT, bus). A high value for this index makes this measure positive for resilience because communication is crucial in times of danger. +[73]
Distance to a fire station
(C7)
As the distance from fire stations increases, resilience decreases. Therefore, increasing this index has a negative effect on resilience. Euclidean distance was used for this measure. d i s t p , q = ( x p x q ) 2 + ( y p y q ) 2 [70]
Building materials
(C8)
This criterion shows the percentage of use of resistant materials in each region; the information in this section was obtained from the Iranian Statistics Organization. Increasing the percentage has a positive impact. +/−[74]
Building prices (C9)This criterion was determined based on a field survey, the experience of living in the city, and a price comparison using real-estate price software (Version 2.0). A price increase has a negative effect on resilience (increase in the cost of reconstruction leading to capital lost during natural disasters, etc.). [75,76]
Access to Medical Centers
(C10)
The subject of this criterion is similar to that of criterion 7. d i s t p , q = ( x p x q ) 2 + ( y p y q ) 2 [70]
Green space per capita (C11)This criterion is obtained by dividing the area of green space by the population, and it positively affects resilience; that is, with an increase in green space per capita, resilience increases. +[77,78]
Household density
(C12)
This criterion is evaluated by dividing the number of residential units by the area (the area of each neighborhood or region). An increase in this index had a negative effect because, it increases the risk of more residential units being involved at the same time, and at the same time, more people’s consent should be obtained to make games. H o u d e n s i t y = H o u t o t A r e a ( h a ) [79]
The density of educational centers
(C13)
The density of education centers is directly related to the increase in society’s awareness. Increasing the density of educational spaces has a direct effect on increasing resilience. ω t d t = 1 n j = 1 x ω K x j , t d t = 1 +[80]
Land use (C14)The type of land use determines the level of resilience. Therefore, it has a positive or negative effect based on the land-use type in each environment. +/−[81]
Table 2. Pairwise comparison scale for ANP preferences [84].
Preferences (Oral Assessment)Numerical Rating
Maximum priority9
Very high priority7
High Priority5
Medium priority3
Equal priority1
Preferences between these intervals2, 4, 6, 8
Table 3. RI corresponding to the number of criteria.
N123456789101112131415
RI000.520.881.11.241.341.41.441.481.511.531.551.571.58
Table 4. Information on ANP experts.
ExpertCivilUrban PlanningArchitectureSociologyTransport SpecialistsCrisis ManagementEnvironment
Number3312211
EducationalExpertMasterPhDPostdoc
Number1452
Table 5. Values for calculation of consistency index.
ABW123456789
Consistency   index   ( max   ξ * )0.000.441.001.632.303.003.734.435.23
Table 6. Pairwise comparison matrix of criteria for ANP.
C1C2C3C4C5C6C7C8C9C10C11C12C13C14
C113278231649456
C2--10.5230.510.333213122
C3----144120.5325233
C4------120.3330.3330.14310.520.50.51
C5--------10.250.3330.12510.510.50.51
C6----------120.5325223
C7------------10.333213122
C8--------------1547446
C9----------------10.520.511
C10------------------12112
C11--------------------10.50.51
C12----------------------112
C13------------------------11
C14--------------------------1
Table 7. The superiority of the best criterion over other criteria.
C234567891011121314
W5388351869678
Table 8. The superiority of other criteria over the worst criterion.
C12345678910121314
W9662367945543
Table 9. Number of neighborhoods in each resilience class.
MCDM
Method
Resilience Class
Very LowLowMiddle High Very High
ANP28897710375
BWM6493749843
Combined8372719551
Table 10. Neighborhood resilience ranking.
RankANPBWMCombined
1IranshahrIranshahrIranshahr
2Vali AsrVali AsrVali Asr
3University of TehranUniversity of TehranUniversity of Tehran
4Ghaem Magham-SanaiGhaem Magham-SanaiGhaem Magham-Sanai
5IsmailAbadIsmailAbadIsmailAbad
6FerdowsiParastarFerdowsi
7Laleh ParkImamateAmjadieh-Khaghani
8Amjadieh-KhaghaniFerdowsiParastar
9ImamateAmjadieh-KhaghaniImamate
10ParastarLaleh ParkLaleh Park
11ChoobtarashHakimyeh Behjat Abad
12Behjat AbadBehjat AbadArgentina-Saaei
13ZanjanGolshan Zanjan
14Argentina-SaaeiEastern TehranparsChoobtarash
15Palestine-EnghlabTehran ParsEastern Tehranpars
16Eastern TehranparsShooraTehran Pars
17Western TehranparsSorkheh HesarWestern Tehranpars
18Tehran ParsWestern TehranparsPalestine-Enghlab
19Jahad squareArgentina-SaaeiShoora
20ShooraPalestine-EnghlabGolshan
Table 11. Neighborhoods by regeneration priority.
RankANPBWMCombined
1 Sartakht Sartakht Sartakht
2Mansoorieh and MongolMansoorieh and MongolMansoorieh and Mongol
3 JaliliJaliliJalili
4Eastern Abuzar GolchinEastern Abuzar
5GolchinMazaheriGolchin
6Southern ArmeniansEastern AbuzarMazaheri
7Western Khageh NezamiBuali townDejcom
8 AhangaranAhangaran Imamzadeh Yahya
9 MazaheriSouthern Armenians FiroozAbad
10DejcomMokhaberat town
11Northern ArmeniansDejcom Anbar Naft
12Sarasyabeh DollabNorth MinaTaqiyAbad
13South MinaEastern ParvazSaffaeh-Cheshme Ali
14ShooshNorthern Armenians Alaeen
15Faruzesh-Amir Bahadur Shoosh Shoosh
16North MinaFaruzesh-Amir BahadurRah-Ahan
17Southern SelesabilTaqiyAbad Golab Dareh
18Buali townSouth MinaAgaahi
19Chaharsad DastgahWestern Khageh Nezami Moghadam
20 Agaahi Abshar Southern Armenians
Disclaimer/Publisher’s Note: The statements, opinions and data contained in all publications are solely those of the individual author(s) and contributor(s) and not of MDPI and/or the editor(s). MDPI and/or the editor(s) disclaim responsibility for any injury to people or property resulting from any ideas, methods, instructions or products referred to in the content.