Abstract
The Chinese government’s recent low-income housing scheme aims to tackle housing challenges faced by the urban floating population. A notable shift in this initiative is the focus on the job–housing balance. This study proposes that the spatial interaction between land designated for affordable rental housing and land for commercial facilities serves as a fundamental metric for evaluating this equilibrium, providing insights into the effectiveness of China’s nascent affordable housing efforts. Drawing on post-2021 data, when China’s revamped affordable housing policy took effect, our research examines the spatial distribution of affordable rental housing and commercial service land in Shanghai. By employing coupled coordination models and local entropy metrics, we delve into the supply equilibrium and pragmatic interrelation of these land types. Our findings reveal localized clustering in the spatial arrangement of rental and commercial land within Shanghai. Zones in the urban core exhibit a supply balance, while the peripheries display diminishing accessibility between these land types. Core urban areas have a lower supply balance but higher accessibility, whereas urban fringes face both low supply balance and low accessibility. These study outcomes have significant implications for strategic planning and the construction of affordable rental housing.
1. Introduction
Over the past three decades, China’s urbanization has been significantly shaped by the “floating population”—a term emerging from the nation’s distinctive household registration system. This concept captures the phenomenon where individuals reside away from their registered household location for over six months, encompassing both intra- and interprovincial movements [1]. Driven by the aspiration to enhance living standards and the allure of urban life, this migratory trend has been a key factor in the evolution of the urban housing landscape, especially in cities experiencing net population growth. The evolution of urban housing in China has traversed three distinct epochs: the era of public housing, the phase of unit welfare housing, and the dual-track system of commercial and affordable housing [2]. In 1998, the State Council issued the “Notice on Further Deepening the Reform of the Urban Housing System and Accelerating Housing Construction”, which marked the cessation of the housing welfare system and the inception of the dual-track system. Post-reform, urban housing provisions bifurcated into two streams: the market-driven private sector supplying commercial housing, and the governmental sector ensuring housing for low-income families who are temporarily unable to afford the commercial housing. Affordable housing, initiated in 1994, was earmarked by its restricted area and cost, catering to the urban low- and middle-income demographics and those facing housing adversities. However, the system’s design flaws during its execution phase have sparked debates over its efficiency and equity, as discussed by Qiwu and Yanwen [3]. In 2007, a paradigm shift occurred with the State Council’s “Several Opinions on Solving the Housing Difficulties of Low-income Families in Urban Areas”, transitioning from property-rights-based affordable housing to a low-rent housing system integrating physical rent and financial aid. This marked the beginning of low-rent housing as the linchpin of China’s housing security for the lowest-income urban families. Despite this, local governments, as the sole providers, faced constraints in supply speed and capacity. This led to the integration of low-rent housing into the broader public rental housing system in 2014. The 2010-introduced public rental housing differed from its predecessor by easing tenant income requirements to include lower-middle-income urban families and expanding protection to non-urban residents. It also encouraged the inclusion of new city workers and long-term migrant workers, softening the rigid household registration and income criteria for housing security eligibility. Nonetheless, as a non-mandatory requirement, the urban floating population remained largely sidelined during implementation. In 2021, the State Council’s “Opinions on Accelerating the Development of Affordable Rental Housing” marked a pivotal shift in policy. For the first time, it explicitly recognized the extensive migrant population—including new citizens and the youth—as the primary beneficiaries within China’s housing security system for the “14th Five-Year Plan”(see Table 1). The suite of policies implemented by the government significantly contributes to enhancing the migrant population’s sense of gain and security [4,5].

Table 1.
Main types of affordable housing in China.
The fiscal decentralization reform of 1994, a component of China’s broader socio-economic restructuring, significantly escalated the financial burdens borne by local governments [6]. In response, local authorities have sought alternative fiscal streams, including extra-budgetary funds and non-tax revenues, in order to bolster their coffers. The 2006 “Measures for the Administration of Revenue and Expenditures from the Transfer of State-owned Land Use Rights” endowed local governments with exclusive rights to land transfer revenues, thereby creating an institutional framework that incentivizes land sales as a fiscal strategy. This tax-sharing system has been identified as a catalyst for urban sprawl, prompting local governments to pursue aggressive urban expansion [7]. The transfer of land designated for commercial housing development, primarily managed by the private sector, has emerged as a principal source of local fiscal income [8], illustrating the intricate nexus between housing commercialization and land financialization [9]. While commercial housing contributes to fiscal revenue through land sales, affordable housing, as a public service, is allocated without charge, thereby not directly augmenting land fiscal income. The construction of affordable housing not only strains local finances but also introduces competitive dynamics into the commercial housing market. This relationship is not one of complementarity, mediated by land finance, but rather one of substitution, where both sectors vie for scarce land resources [10]. Consequently, in order to meet the directives of higher-level governments and mitigate land transfer fee losses, local governments frequently allocate low-value-added land for affordable housing construction. This approach adheres to a cost-minimization logic [11], often resulting in the peripheralization of affordable housing areas, thereby fulfilling housing security mandates through policy alienation [12,13]. This selective land allocation strategy directly precipitates the socio-spatial marginalization of the insured groups [14,15], diminishing the subjective well-being of the residents [16]. Research has demonstrated that low- and middle-income individuals, uprooted due to government affordable housing projects, experience a significant degree of job–housing separation, often culminating in job loss [17].
The newly introduced affordable rental housing (ARH) initiative in China marks a departure from previous housing security models. The change is primarily evident in the shift in the housing supply entity. The government now provides policy support in six areas, including land, finance, and taxation, endorsing a market-oriented supply strategy under governmental guidance. Furthermore, the government has clarified that the target demographic for housing security is the extensive urban floating population, advocating for the construction of ARH based on the principle of job–housing balance. The primary beneficiaries of this housing are newly employed young adults, a demographic characterized by lower economic capital but relatively higher cultural capital, with a propensity to migrate towards city centers [18,19]. Additionally, the provision of affordable housing in China does not necessitate negotiations between the government and stakeholders, relying instead on the local government’s land allocation methods [20]. Therefore, evaluating and assessing the job–housing balance of ARH is of practical significance in verifying the effectiveness of current housing security policies.
Before assessing the job–housing balance of ARH, it is crucial that we examine the relationship between the workplaces of new citizens and young adults, who are the primary users of rental housing, and commercial land. These groups often work in sectors such as services, technology, and innovation, which tend to cluster in commercial areas [21,22]. Therefore, their workplaces are closely related to the spatial distribution of commercial land. Additionally, China’s housing policy, especially the ARH policy, emphasizes the placement of rental housing near commercial service areas, industrial parks, and around transit stations in order to promote urban integration and the job–housing balance [23,24]. Hence, urban commercial land is a primary workplace for new citizens and young adults.
This study takes Shanghai as a case to analyze the spatial distribution of ARH land and commercial service land since the implementation of the ARH policy. It employs coupled coordination models to explore the supply relationship between these two types of land, assessing the current state of job–housing balance and potential improvement strategies. Furthermore, it investigates the accessibility between rental and commercial land based on the transportation network, evaluating the connection efficiency and travel convenience for different locations. Finally, this study uses local entropy values and clustering methods to map the relationship between the supply balance of the two types of land and their accessibility, providing a comprehensive evaluation of the city’s rental land supply policy. As the latest evolution in China’s comprehensive housing security system, ARH represents a significant policy shift. This research not only aims to inform nations striving to refine their housing systems about China’s innovative changes and policy objectives, providing a model for other developing countries, but also seeks to assess how well ARH fulfills the job–housing balance policy goal. These findings offer crucial insights for local Chinese governments to timely refine land supply strategies. Additionally, this study introduces a framework for analyzing job–housing land supply and demand balance, identifying regional disparities in urban areas through supply–demand and accessibility lenses. This framework offers valuable guidance and methodologies for further research focused on housing security for the young migrant demographic.
2. Methodology
2.1. Study Area
Shanghai, a leading metropolis in China’s eastern region, exemplifies the rapid development and large-scale construction of affordable rental housing. Selected for this study, Shanghai is a municipality directly under the central government, comprising sixteen districts, one hundred and seven streets, one hundred and seven towns, and two townships (Figure 1). The term “second districts” refers to these 16 districts, while “third counties” denotes the 215 subordinate streets, townships, and towns governed by the 16 districts. For comprehensive details, the Shanghai Civil Affairs Bureau provides extensive information on its administrative structure (https://mzj.sh.gov.cn/MZ_zhuzhan34_0-2-6/20200519/MZ_zhuzhan34_43816.html, accessed on 23 July 2022). The city proper has the third-largest population in the world, with 24.89 million inhabitants in 2021, while the urban area is the most populous in China, with 39,300,000 residents (according to the Shanghai Municipal Bureau of Statistics). Due to its dominant economic role in China, it attracts millions of employees, and over forty percent of the total population is a floating population [25]. In China, the floating population is a significant driver of urbanization and urban development [26]. Therefore, improving the living and working environment for the floating population is crucial for Shanghai’s sustainable development.
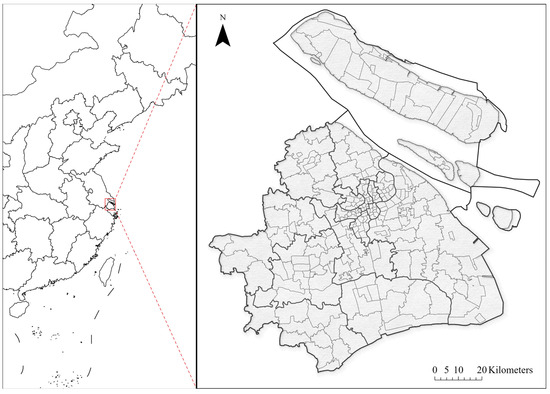
Figure 1.
Regional location.
Recently, various government departments in Shanghai have issued a series of policies regarding ARH, leading to the establishment of a comprehensive policy system for ARH in Shanghai (“Shanghai Affordable Rental Housing Policy”). These plans aim to increase the allocation of land for rent-guaranteed housing within the housing land, and they create a separate plan for land supply for rental housing, focusing on areas like industrial parks, their vicinity, locations near rail transit stations, and key urban development areas [27]. The addresses of these lands are updated yearly, reflecting the planned locations for future ARH developments for employees.
The aim of rental housing is to add more units (rooms), with the expectation of alleviating the housing difficulties of new young workers in Shanghai, who may prioritize the proximity of their residence to their workplace. However, job opportunities are primarily concentrated in developed zones with higher housing prices and lower land supply [28,29], suggesting that there is limited land available for rental housing within these developed zones. The monocentric urban model elucidates the clustering of residential zones in urban settings. This theoretical model, used in urban economics, analyzes the spatial structure and land use patterns within a city [30]. It assumes that cities are centered around a central point, positing that city centers, as hubs of economic activity, generate substantial housing demand. Residents typically live in areas surrounding the central point and commute daily to work. Housing production requires both land and capital, meaning not all workers can live close to their workplaces; some must commute. Commuting is costly, and residents farther from the central area are at a disadvantage compared to those living closer. If commuting costs increase, housing demand in areas far from the central area may decline as residents are unwilling to bear the high commuting costs. Consequently, housing demand diminishes with distance from the center, as commuting costs rise. Residential land is typically centralized to minimize transportation expenses [30]. The presence and location of city centers significantly impact housing land use patterns in cities, with housing sites near city centers generally being of higher value and denser construction. However, this centrality intensifies land use competition, escalates land prices, and limits the availability of land for affordable housing in these prime areas. Consequently, the supply of land for rental housing may primarily be focused in areas distant from the developed zones where more job opportunities are available. Additionally, the commuting time between rental housing and job locations poses a significant challenge for rental housing land planning. Therefore, evaluating job accessibility in rental housing and the spatial distribution of rental housing land and job areas is crucial for identifying any mismatches in Shanghai.
2.2. Data Collection and Processing
This study collected data from three sources. First, the list of rental housing land for employment published by the government was extracted from the Shanghai National Land Database (https://www.landchina.com/ (accessed on 23 July 2022), which contains data on these lands across Shanghai, including their current addresses, construction areas, and population–floor area ratios. Due to the limitations of timely updating and disclosure of government data, these data only cover the Shanghai government’s transfer of land for affordable rental housing from 2017 to 2022. Second, the locations of business function regions were obtained from the Database of Land Use Classification in Shanghai, which includes various land uses accredited by the National Land Planning. Both of the above-mentioned data types can be accessed through the Shanghai Land and Natural Resources website. This database provides up-to-date information on Shanghai’s land use, enabling the analysis of commercial land plot distribution and quantity. It serves as a valuable tool for urban planners and researchers seeking to understand the city’s commercial development landscape. Third, the traffic network for accessibility assessment was sourced from the OSM Map (https://www.openstreetmap.org (accessed on 23 July 2022). The collected data will be categorized based on Shanghai’s traffic tiers to ascertain the permissible speeds across various road network hierarchies, ensuring clarity and precision in urban traffic management. and the velocities of all public transportation modes were configured in accordance with local traffic rules. Upon completing data collection, the quantities of ARH lands and commercial lands were computed and aggregated at the sub-district level utilizing ArcGIS Pro.
2.3. Research Framework
This research introduces a framework to assess the equilibrium of supply and demand for Affordable Rental Housing (ARH) and commercial lands, offering insights into the regional spatial imbalances of job–housing land within cities. The framework encompasses both supply–demand perspectives and accessibility considerations (Figure 2). Initially, kernel density and nearest distance analyses were employed to evaluate the spatial distribution of ARH and commercial service lands post-implementation of ARH policies. Subsequently, the local spatial autocorrelation index was applied to identify and clarify the hot and cold spots of these land types. Utilizing standardized Gi*Z scores from the hot and cold spots analysis, a coupling coordination model was then used to investigate the supply dynamics between ARH and commercial lands, assessing the current state of job–housing supply balance. This study further measured accessibility through OD cost network analysis, based on the regional transportation network, to gauge the efficiency of connections and ease of travel across various locales. Ultimately, a relationship diagram, informed by local entropy values, illustrating the varied structural interplay between the supply balance and accessibility of the two land types was created. By employing clustering methods, the bivariate local Moran’s I coefficient, in conjunction with the predominant land use types identified in the coupled coordination model, effectively regionalized Shanghai’s tertiary districts into distinct areas. The findings provide a basis for optimizing land use planning and policy interventions to enhance job–housing balance and inform housing policy adjustments.
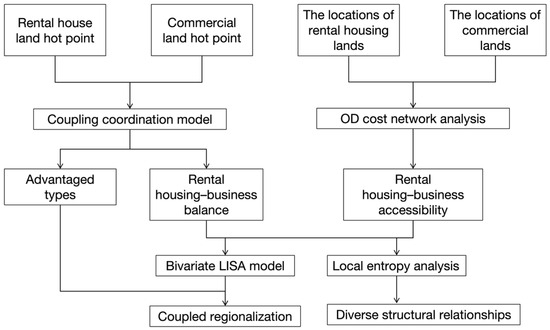
Figure 2.
Research framework.
2.4. Spatial Pattern of Rental House Land and Commercial Land
Firstly, this study employed kernel density estimation and nearest neighbor distance to analyze the spatial distribution features of ARH lands and commercial lands. Kernel density estimation is a spatial smoothing method used to reveal the relative concentration of point data. It is often employed to explore spatial layout trends and characteristics of point data [31]. Kernel density analysis quantifies the density of point-like geographical elements and reveals their agglomeration status in the entire region, making it suitable for investigating the spatial configuration characteristics of rental housing lands and commercial land. The nearest neighbor distance is utilized to examine the spatial dispersion and aggregation of point data. It measures the distances between any point in the evaluation area and its nearest neighbor point, calculates the average of these nearest neighbor distances, and compares this to the nearest neighbor distances from a random distribution to obtain the nearest neighbor index R. When R is less than 1, it indicates an aggregation pattern; when R is greater than 1, it suggests a dispersed pattern; and when R is equal to 1, it signifies a random distribution [31].
Secondly, this study analyzed the degree of spatial agglomeration of ARH lands and commercial lands through spatial autocorrelation. Spatial autocorrelation encompasses global and local spatial autocorrelation. Global spatial autocorrelation employs Moran’s I index to determine whether there is spatial agglomeration in ARH lands and commercial lands. The local spatial autocorrelation index, known as Getis-Ord General Gi* (Gi*Z for short), was employed to further analyze the specific locations of spatial agglomeration, namely the hot and cold spots in the spatial layout of the two lands. If Gi*Z is significantly positive, it indicates a high-value spatial agglomeration, signifying a hot spot; if it is significantly negative, it suggests a low-value spatial agglomeration, indicating a cold spot [32].
2.5. Coupling Coordination Evaluation of Rental Housing Land Hot Point and Commercial Land Hot Point
Drawing from the concepts of capacity coupling and the capacity coupling coefficient model in physics, as well as the research methods of [33,34], this study constructed a coupling degree and coupling coordination degree model. Coupling degree refers to the strength of interactions between systems or elements, reflecting the degree of interdependence and mutual restriction [33]. Coupling coordination degree refers to the degree of favorable coupling in the coupling interaction relationship, which can reflect the quality of coordination [35]. Employing the concept of coupling degree, this study quantified the reciprocal impact between rental housing and commercial land, providing a measure of their interaction. Concurrently, the coordination degree concept was utilized to gauge the symbiotic progress of these land uses, offering insights into their developmental harmony. To achieve this, the calculation of the coupling coordination degree followed the steps below:
Step 1: Construction of the indicator system. In this step, we used the local spatial autocorrelation index, Gi*Z, for ARH lands and commercial lands as their comprehensive scores. The local spatial autocorrelation index can depict the spatial distribution characteristics of ARH land and commercial land within a region. Specifically, it determines their level of aggregation across the area. In the context of the current housing and commercial land distribution, even when land uses are similar, larger towns may exhibit higher values, which can obscure the overall distribution pattern. To address this, our study normalized the results to values per unit area. The comprehensive scores indicate that the spatial patterns of ARH lands and commercial lands are better understood when their location points aggregate more effectively.
Step 2: Data standardization. To standardize the values of each indicator and eliminate the influence of the measurement unit and indicator polarity, we used the range standardization method, taking into account the positive and negative aspects of the indicators [36]. The calculation of Gi*Z yields Z-Score values, which can be normalized to facilitate comparison across varying data magnitudes, thus enhancing the scientific rigor of the analysis. Given that the Z-method is the standard intermediate process for Gi*Z computations, further recalculation of Z-Scores was unnecessary. Instead, the results were directly normalized to fall within the [0, 1] interval, streamlining the process and ensuring consistency in measurement. The standardization formula is as follows:
where vij is the standardized value of the j-th indicator of element i; Vij is the original value of the j-th indicator of element i; and maxVij and minVij are the maximum and minimum values of the j-th indicator of element I, respectively. In this analysis, the Gi*Z statistic served as the sole metric for evaluating ARH and commercial lands. Consequently, standardization was applied exclusively to the Gi*Z values of these land categories.
Step 3: Calculation of coupling coordination degree. The model’s expression, which was used to calculate each subsystem’s coupling degree, is as follows:
where C represents the coupling degree with a value range of 0–1. Indeed, a higher C value indicates a stronger degree of interaction between rental and commercial land, suggesting a more significant relationship in terms of their mutual influence within the urban landscape. This metric is crucial for understanding the dynamics of land use and planning in metropolitan areas. U1 and U2 denote the comprehensive scores of ARH land and commercial land, respectively. These scores are derived from the original Gi*Z values, standardized using the prescribed standardization formula. Therefore, the standardized values, denoted as vij, were employed directly to represent the comprehensive scores for the two land use categories. The formula for calculating the coupling coordination degree is as follows:
where D represents the degree of coupling coordination and T is a comprehensive evaluation index that combines rental housing land and commercial land. A higher D value reflects a more synergistic relationship between ARH and commercial land, indicating a well-coordinated development. This measure is pivotal for evaluating the integration of urban land use. The undetermined coefficients, and , were set to 0.5 because both rental housing land and commercial land are equally important.
Step 4: Classification of Coupling Coordination Degree. Drawing on previous research experience [37] and considering actual research characteristics, this study formulated the following evaluation criteria. A greater C value denotes a more pronounced reciprocal influence between the two land uses, leading to an elevated classification level. The coupling degree falls into four levels: low-level coupling stage (0 < C ≤ 0.3), antagonism stage (0.3 < C ≤ 0.5), run-in stage (0.5 < C ≤ 0.8), and high-level coupling stage (0.8 ≤ C ≤ 1). An elevated D value signifies enhanced coordination between the two land uses, reflecting a higher level of harmonious development. The Coupling Coordination Degree is classified as follows: low degree coordinated coupling (0 < D ≤ 0.3), moderate coordination coupling (0.3 < D ≤ 0.5), highly coordinated coupling (0.5 < D ≤ 0.8), and extremely coordinated coupling (0.8 < D ≤ 1). Further classification was undertaken according to the degree of coordination criteria (Table 2) to evaluate the dominant land use type in the relationship between rental housing land and commercial land. In the table, M denotes the coupling coordination metric for rental housing and commercial land, derived from the variance in their evaluation scores. When 0 ≤ |M| ≤ 0.1, it indicates parity in development benefits between the two land uses, classified as the “synchronous” state. When M > 0.1, rental housing land exhibits a developmental edge, termed as the “superior rental housing land use” state. When M < −0.1, it suggests that commercial land development is more favorable, labeled as the “inferior rental housing land use” state.
Table 2.
Standard for grading the coordination degree between land uses.
2.6. Accessibility between Rental House Land and Commercial Land
This study assessed the accessibility between rental housing land and commercial land in Shanghai, considering both “threshold” and “supply and demand” perspectives. The “threshold” refers to the travel cost incurred by residents to reach the nearest commercial land. This study adopted a network analysis method, termed “OD cost network”, to determine the minimum time cost for any rental housing land location to reach a specific commercial land, thereby measuring accessibility. Utilizing ArcMap network analysis tools, we constructed a time-cost-based network dataset derived from Shanghai City’s road network. In reference to the “Technical Standards for Highway Engineering” (JTGB01-2014) [38], traffic speeds were set based on road grades: 80 km/h for first-class highways, 60 km/h for second-class highways, 40 km/h for third-class roads, 25 km/h for fourth-class roads, and 10 km/h for out-of-class roads. Simultaneously, major water bodies were designated as impassable resistance surfaces. Using the location of rental housing land as the starting point and commercial land location as the destination, we assigned the time–cost attribute from the generated OD line to its corresponding destination point. Subsequently, we employed IDW (Inverse Distance Weight) to visualize travel costs across different districts.
2.7. Spatial Association Analysis between Rental Housing Land and Commercial Land
2.7.1. Bivariate Local Moran’s I
To examine the relationship between the rental housing–business balance and accessibility, we applied the bivariate LISA model [39] to calculate the global and local bivariate spatial Moran’s I coefficients. The formula is as follows:
where I and I’ denote the global and local bivariable Moran’s I coefficients, respectively; N is the number of spatial units (sub-districts in this study); is the spatial weight; is the standardized value of the coordination between rental housing land and commercial land for the i-th district; and is the standardized value of the accessibility between rental housing land and commercial land for the j-th district. The bivariate local Moran’s I coefficient has four categories: high–high (H–H) cluster, high–low (H–L) cluster, low–high (L–H) cluster, and low–low (L–L) cluster.
2.7.2. The Local Entropy Map
Bivariate LISA analysis often assumes a specific relationship form, such as a linear regression model, for all regions. It focuses solely on changes in parameter values. However, this approach may not simultaneously uncover local relationships of varying forms. In contrast to other statistical methods that can only capture linear relationships, entropy can capture diverse structural relationships between two variables. These relationships can be exponential, quadratic, sinusoidal, or even complex and not defined by traditional mathematical functions. In this study, we employed a local entropy map to detect specific local relationships between coordination and accessibility. This method evaluates whether one variable’s values depend on or are influenced by another variable’s values, and whether this relationship varies across geographic space. The end results categorize each input feature into a specific relationship category based on the explanatory variable’s parameter’s reliability in predicting the dependent variable’s parameter. In our research, the balance between rental housing land and commercial land serves as the explanatory variable, while accessibility between the two is the dependent variable. Building on this foundation, we calculated the local entropy value to assess the interplay between supply–demand coordination and accessibility for the two land. This approach facilitates a nuanced exploration of the spatial differentiation inherent in the relationship between supply–demand dynamics and accessibility factors.
Firstly, the Renyi Entropy [40] for the bivariate data (comprising the dependent and independent variables) was calculated using the normalized Minimum Spanning Tree (MST) length for each spatial unit. The entropy can be directly calculated using the following formula:
where represents the shortest spanning tree; denotes n independent observations in a continuous d dimensional space (referred as attribute space). ; c is a constant that depends only on and d; and is the edge power.
Secondly, the entropy value of each spatial unit was transformed into a probability value (p-value) under the null hypothesis. This formed an empirical normal distribution based on the permutation approach. Thirdly, statistical tests were applied to process the p-values. In accordance with [41], three critical significance values (Bonferroni, Bonferroni adjusted for spatial dependence, and FDR) were used on the entropy map to address the multiple-comparison issue. The order of critical p-values, from smallest to largest, was Bonferroni < Bonferroni adjusted for spatial dependence < FDR < significance level α (e.g., 0.05) [42]. Finally, the results were mapped, allowing researchers to locate and interactively examine significant local relationships.
The six categories based on the relationship types were as follows: not significant—the relationship between the variables lacks statistical significance; positive linear—the dependent variable linearly increases with an increase in the explanatory variable; negative linear—the dependent variable linearly decreases with an increase in the explanatory variable; concave—the dependent variable changes following a concave curve as the explanatory variable increases; convex—the dependent variable changes following a convex curve as the explanatory variable increases; and undefined complex—the variables exhibit a significant relationship, but the nature of this relationship cannot be reliably described by any of the other categories.
2.8. Coupled Regionalization from the Perspective of Accessibility, Coordination and Advantaged Types
We classified the relationship between rental housing land and commercial land by considering “accessibility between supply and demand”, “coordination between supply and demand” and “advantaged types among supply and demand”. “Accessibility between supply and demand” refers to the travel cost for residents in rental housing to reach the nearest commercial land. “Coordination between supply and demand” was evaluated using the standardized results of the Gi*Z scores for the coordination degree between rental housing land and commercial land. “Advantaged types among supply and demand” refers to the second-order coupling coordination relationship (see Table 2) between rental housing land and commercial land. Utilizing the four categories of the bivariate local Moran’s I coefficient to analyze the relationship between the two distinct land types, we categorize Shanghai’s third-level districts into twelve unique classifications: H–L–S, H–L–R, and H–L–B; H–H–S, H–H–R, and H–H–B; L–L–S, L–L–R, and L–L–B; and L–H–S, L–H–R, and L–H–B, based on the conceptual mechanism showed in Figure 3. In summary, the bivariate local Moran’s I coefficient delineates four distinct categories: High–High (H–H), High–Low (H–L), Low–High (L–H), and Low–Low (L–L). These categories were further stratified based on three classifications of M values: “synchronous”, “superior rental housing land use”, and “interior rental housing land use”. The classifications of M are denoted by the capital letters S, R, and B, respectively. This stratification results in a total of twelve unique categories, as represented by the equation 4 × 3 = 12. The H–L–S type represents areas with poor accessibility and low coordination between rental housing land and commercial land with synchronous land use. The H–H–R areas show better coordination and accessibility in districts where rental housing land is the dominant land use. However, the L–L–B type suggests relatively high travel costs and an imbalance between rental housing land and commercial land, which can be viewed as an area with low accessibility and imbalanced supply and demand, with lagging rental housing land use. In the L–H–S area, accessibility is low, but coordination is high with synchronous land use.
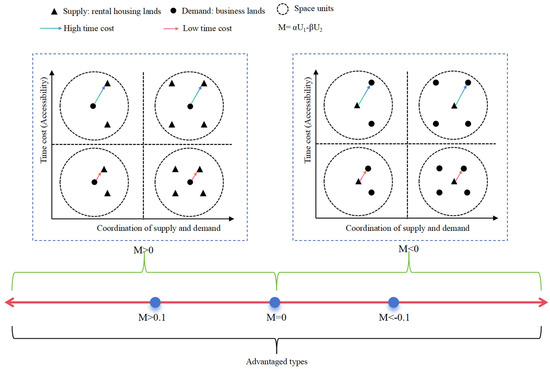
Figure 3.
Conceptual mechanism of relationship-based zoning between rental housing land and commercial land.
3. Result
3.1. Spatial Pattern of Rental Housing Land and Commercial Land
3.1.1. Spatial Pattern of Rental Housing Lands
According to Shanghai’s traffic road network, the city can be classified into five main areas: the urban inner-loop area (within the inner loop road), the urban middle-loop area (between the inner loop road and middle loop road), urban outer loop area (between the middle loop road and outer loop road), suburb areas (between the outer loop road and the beltway), and the urban fringe area (between the beltway and the city boundary). Figure 4 displays the relative proportions of these five main areas at the third-level counties (including streets, townships, and towns) and the distribution of ARH lands. We collected a total of 153 records regarding the allocation of lands for ARH from the published database. In the urban inner loop area of Shanghai, there are seven ARH lands, accounting for 4.57% of the total; in the urban middle loop area, there are thirty-three, accounting for 21.56%; in the urban outer loop areas, there are twenty-eight, accounting for 18.3%; in the suburb areas, there are forty-nine, accounting for 32.02%; and in the urban fringe area, there are thirty-six, accounting for 23.52% (Figure 4).
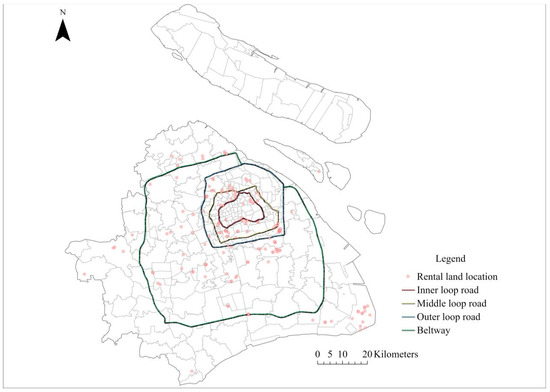
Figure 4.
The locations of affordable rental housing lands.
Nearest neighbor distance analysis reveals R = 0.461096 < 1, with a Z test value of −12.75, passing the test at a significance level of 0.001. This indicates that affordable rental lands in Shanghai exhibit typical cluster distribution characteristics. From a kernel density analysis perspective, the spatial distribution of affordable rental apartments in Shanghai follows a pattern of “four major agglomerations with multiple clusters”. Two of these major agglomerations are situated within the outer loop area, near the central urban region, comprising the areas centered on Dalin Road Street and Caohejin Street. Another agglomeration is found in the eastern part of the outer loop area, with its center at the junction of the Zhangjiang and Kangqiao districts. The final major agglomeration is located in the southeast corner of urban Shanghai, centered in the Nanhui xincheng county. Additionally, there are several counties with relatively larger amounts of housing land. In summary, ARH lands in Shanghai exhibit a spatial clustering, primarily at the periphery of the central urban area and the southeast corner (see Figure 5).
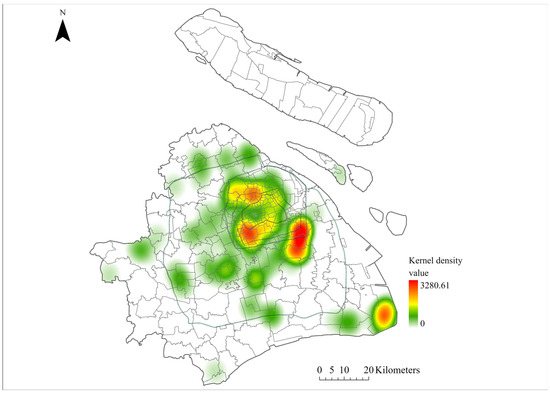
Figure 5.
The kernel density of rental housing lands.
Shanghai’s ARH lands exhibit spatial agglomeration characteristics at the town level. This is evident in the Global Moran’s I value of 0.079238, Z value of 2.9178, and its passing of the 1% significance level test. Local autocorrelation analysis reveals two major hot spot areas and three minor cold spot areas for ARH lands in Shanghai. It distinctly identifies the areas with higher and lower availability of ARH land. The two hot spot areas are situated in the southeast area between the outer loop road and the beltway, as well as the southeast corner of the city. The three major cold spot areas are concentrated in the middle area, particularly around Wanli Street, Daning Road Street, Wujiao Town, and Jiangpu Road Street and Kongjiang Road Street within the inner loop road (see Figure 6).
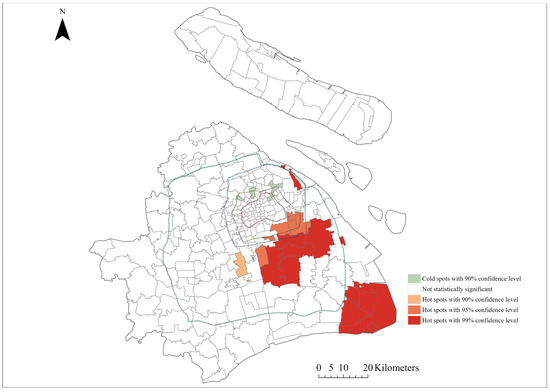
Figure 6.
Local autocorrelation analysis of rental housing lands.
3.1.2. Spatial Pattern of Commercial Lands
Analysis of the nearest neighbor distances for commercial lands in Shanghai reveals a value of R = 0.379165, which is less than 1. The Z test value of −39.83 confirms this result, passing the test at the significance level of 0.001. These findings indicate that Shanghai’s commercial lands exhibit a typical cluster distribution. When viewed through the lens of kernel density analysis, the spatial distribution of commercial lands in Shanghai is characterized by a single large agglomeration. This large agglomeration is situated within the inner loop area, precisely within the central urban region, with its epicenter around Bund Street, Yunyuan Street, Nanjing East Road Street, and North Bund Street. Additionally, some towns exhibit relatively higher quantities of commercial land. In summary, the spatial layout of commercial lands in Shanghai displays a pronounced concentration within the central urban area (refer to Figure 7).
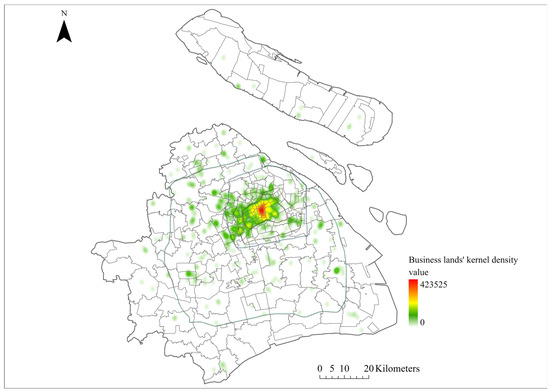
Figure 7.
The kernel density of commercial lands.
The Global Moran’s I value for ARH land in Shanghai is 0.222391, with a Z value of 7.986326. It passes the significance test at the 1% level, confirming the presence of spatial agglomeration characteristics in Shanghai’s commercial lands at the town level. Local autocorrelation analysis reveals a predominant hot spot area for commercial lands in Shanghai, primarily within the outer loop area, encompassing the entire inner loop region (see Figure 8). This once again confirms that the areas with a high concentration in the spatial distribution of commercial lands in Shanghai are primarily situated in the city center.
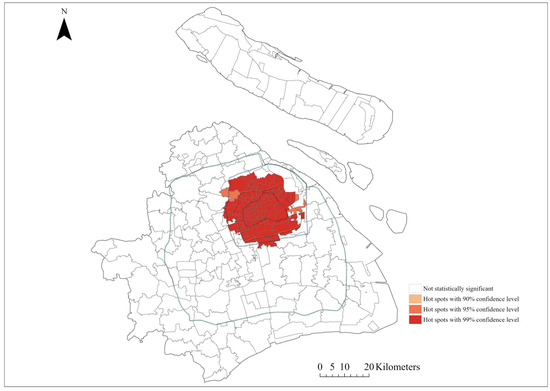
Figure 8.
Local autocorrelation analysis of commercial lands.
3.2. Coupling Coordination Degree of Rental Housing Land and Commercial Land
The average coupling degree between rental housing land and commercial land in Shanghai is 0.75, indicating a relatively high level of coupling (see Figure 9). The majority of towns are in the “run-in coupling” and “high-level coupling” stages, constituting a total of 88.29%. It is important to note that certain areas are in the “low-level coupling” stage, primarily concentrated in the middle loop area, including locations like Pingliang Road Street, Jiangpu Road Street, and Jiaxing Road Street. Regarding towns in the “antagonism stage”, they are also mainly located within the outer loop area. Some of these areas include Xidu Street, Wujin Town, and Zhuangxing Town, which are situated between the outer loop road and the beltway.
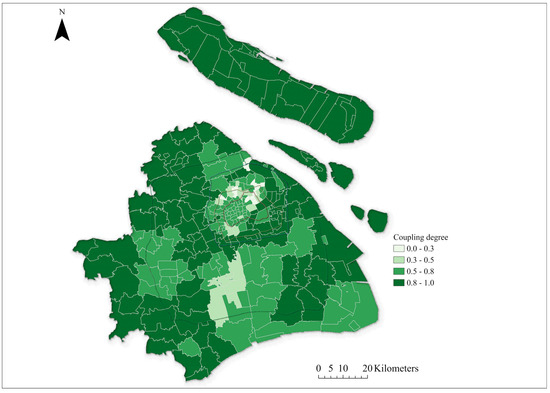
Figure 9.
Coupling degree between rental housing land and commercial land.
The average coupling coordination value in the study area was 0.23, indicating the lowest level of coordination, referred to as Type I. The majority of towns fall into the lowest coordination Type I, making up 74.67%, while 23.58% of towns are categorized as primary coordination Type II. Notably, there are no areas classified as high coordination Type IV. Only a few towns, including Sanlin Town, Beicai Town, and Zhoujiadu Street, fall into the category of relatively high coordination Type III (see Figure 10).
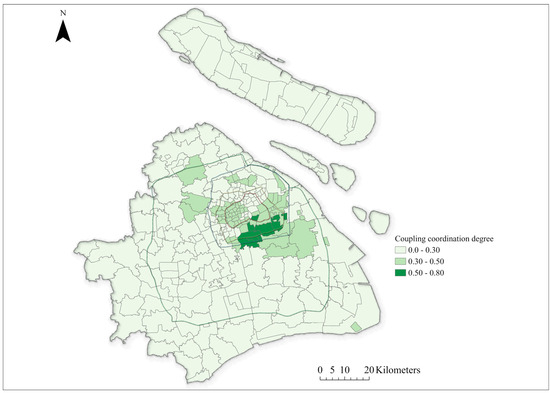
Figure 10.
Coupling coordination degree between rental housing lands and commercial lands.
The majority of districts in the study area fall into either the synchronous or lagging category for commercial land, with a relatively small number of towns categorized as lagging for rental housing land. The rental housing lands with lagging use are predominantly situated in the outer loop area (refer to Figure 11).
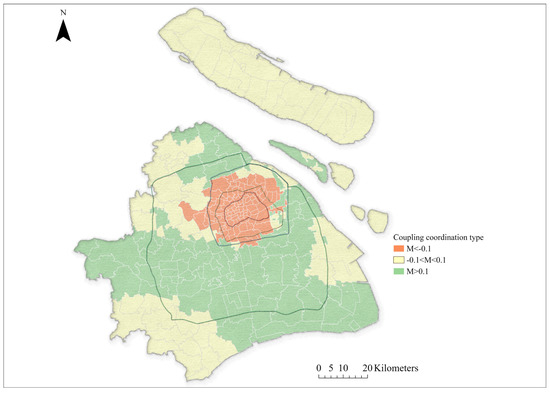
Figure 11.
Coupling coordination type between rental housing lands and commercial lands.
3.3. Rental House Land’s Spatial Accessibility to Commercial Land
The accessibility between rental housing land and commercial land is generally low, with an average travel time of 46.11 min. The minimum travel time is 21.17 min, and the maximum travel time is 91.76 min. Accessibility varies significantly, and its distribution is uneven (see Figure 12). From a town’s perspective, areas with high accessibility are primarily concentrated within the outer loop area and other regions. Accessibility gradually decreases as you move from high-value locations to the surrounding areas. Specifically, within the outer loop area, some areas like Guangzhong Road Street, Gonghexin Road Street, and Pengpu Town, which are also hot spots for commercial lands, exhibit relatively low accessibility values. This study assessed the comprehensive accessibility between all rental and commercial land parcels. The core area’s accessibility is hindered by a river that cuts through it, along with a dense urban structure and narrow thoroughfares limiting vehicular and pedestrian movement. Furthermore, elevated land costs and intense land use competition in the central region result in a markedly lower availability of rental housing compared to the periphery.
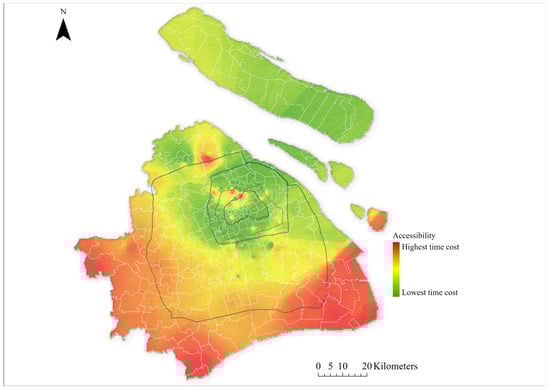
Figure 12.
The accessibility between rental housing land and commercial land.
3.4. The Spatial Relationships between Coordination and Accessibility
The LISA graph obtained through clustering is visually represented in Figure 13. The global bivariate Moran’s I coefficient for coordination and accessibility between rental housing lands and commercial lands in Shanghai is 0.389, indicating a significant positive spatial relationship between them. From Figure 13, we can observe the following: (1) Areas with high–high (H–H) clustering for coordination and accessibility are primarily located within the outer loop road. These areas benefit from adequate rail transit supply and a high level of integration between business and housing. The coordination is strong. (2) Areas with high–low (H–L) clustering for coordination and accessibility are predominantly located in the southeastern part of the urban area, including Nanhui New Town, Wanxiang Town, Xuanguan Town, and Xinchang Town. Additionally, there are scattered areas in the western part of the city, such as Sijin Town. The density of both land uses in these districts is not high, resulting in a relatively balanced relationship between employment and housing. Moreover, due to the underdeveloped transit system in most areas, accessibility is low, leading to an uncoordinated relationship between the balance of employment and housing, and transportation. In the future, these areas should prioritize traffic planning and construction. Because most of these areas already exhibit a good balance between employment and housing, accessibility can be improved through light rail, tram, and other low-capacity transportation modes to cater to the travel requirements of urban residents in the region. (3) Areas with low–high (L–H) clustering for coordination and accessibility are primarily concentrated within the outer loop road and the northern part of the city. These areas have a relatively high commercial land density but exhibit an imbalance between employment and housing. Nevertheless, accessibility in these areas is high, which can help address long-term resident issues. (4) Areas with low–low (L–L) clustering for coordination and accessibility are mainly concentrated in the southern and western parts of the urban area. These areas mainly consist of ruins, scenic spots, and some universities. The degree of coordination between employment and housing is not high in these areas, and there is still an inadequate supply of transportation. Therefore, these areas should also prioritize traffic planning.
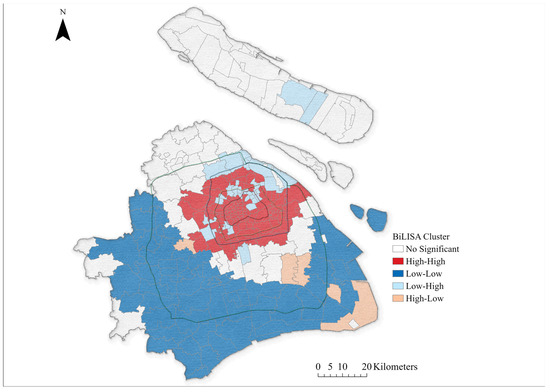
Figure 13.
LISA cluster map between coordination and accessibility.
This study employed a local entropy map to simultaneously detect diverse forms of local bivariate relationships. The results are presented using a legend in Figure 14, which illustrates six types of local bivariate relationships: “positive linear”, “negative linear”, “concave”, “convex”, “undefined complex”, and “not significant”. This study identified six distinct spatial relationships between business–housing balance and accessibility across the districts in Shanghai. Most of the towns in Shanghai exhibited positive linear relationships, with these areas predominantly situated in the western and eastern parts of the urban area. The positive linear relationships indicate that the entropy index (H) of accessibility increases linearly as the entropy index (H) of coordination increases. (2) Negative linear relationships were observed in certain areas scattered throughout the northeast region of Shanghai, notably in the districts of Longhua Street and and Xujiahui Street within the middle loop area. (3) Additionally, a few towns surrounding and adjacent to the central districts, such as Pujiang Town, Wujin Town, Xidu Street, and Meilong Town, exhibited a concave relationship. (4) Some towns located far from the central districts, including Yongfeng Street, Songjiang Industry District, and Bao Town, displayed a convex relationship. Notably, some of these areas, such as Xie Road Street, Dapuqiao Street and Shiquan Road Street, are located in central districts. (5) Interestingly, some towns distant from central districts, such as Haiwan Town, Zhongxing Town, and Shuxin Town, exhibited an undefined complex relationship. Notably, some of these areas, like Lujiazui Street, Waitan Street and Caohejin Street, are located in central districts. (6) Other areas, not mentioned earlier, included districts where no significant relationships were identified. These areas are primarily concentrated in the northern and southern parts of the city.
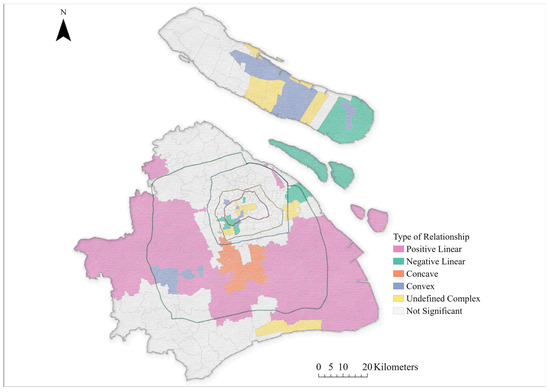
Figure 14.
Types of the relationships between coordination and accessibility.
3.5. Division of Coordination, Accessibility and Dominant Land Type between Rental Housing and Commercial Land
Figure 15 displays the results of dividing Shanghai City space into eight types based on a “coordination–accessibility–dominant land type” perspective (see methods in Table 2 and Figure 3). L–L–L indicates areas with low coordination, low accessibility, and a lagging rental housing land use. There are only 13 such areas, covering 5.6% of town districts, but they are primarily concentrated in the central part of the city. L–L–S represents areas with low coordination, low accessibility, and synchronous land use between rental housing and business. There are 20 such areas, covering 8.7% of town districts, generally located near inaccessible areas, and mainly distributed in areas distant from the central districts. L–L–B represents areas with low coordination, low accessibility, and better rental housing land use. There are 51 such areas, covering 22.2% of town districts, mainly located in the southern part of the urban area. Due to traffic and limited housing space, the L–H–L districts are primarily concentrated in the central urban area, which features well-developed traffic but limited available land for construction. L–H–S represents areas with low coordination, high accessibility, and synchronous land use between rental housing and business. There are 35 such areas, covering 15.2% of town districts, generally located near inaccessible areas and mainly scattered in the northern part of the urban area. The majority of areas near the central city are categorized as L–H–B areas, characterized by relatively well-developed transportation and a greater supply of land. H–H–L denotes areas with high coordination, high accessibility, but a lagging rental housing land use, indicating a shortage of rental housing land supply. However, there are only six H–H–L areas, covering 2.6% of districts, and they are located in the central part of the city. H–H–S represents areas with high coordination, high accessibility, and synchronous land use. Only one town falls into this category, and it is distributed around the urban center.
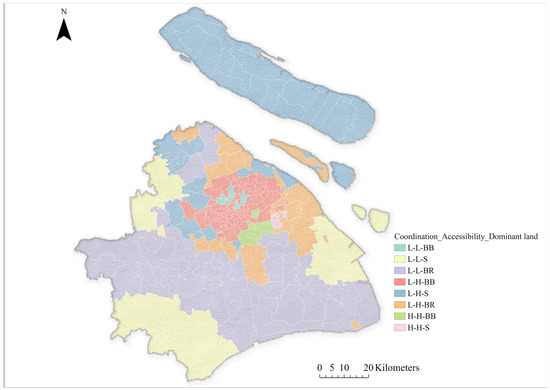
Figure 15.
Regionalization of combining coupling coordination with accessibility.
4. Discussion
The spatial distribution and interaction of ARH and commercial lands in Shanghai, as detailed in the results, offer a nuanced understanding of urban development patterns. These findings can provide insights into urban planning, socio-economic implications, and future development strategies.
The observed clustering of ARH lands primarily at the periphery of the central urban area and the southeast corner, as well as the concentration of commercial lands within the central urban area, reflect a typical urban development pattern. This pattern is often a result of urban development strategies focusing on economic growth and urban vitality in central areas, leading to a concentration of commercial activities and cultural landmarks, as discussed by Ram B. Singh [43]. This spatial arrangement suggests a dichotomy between residential availability and commercial activities, potentially influencing commuting patterns and urban sprawl. The high level of coupling between rental housing and commercial land indicates a strong interdependence. However, the low coordination value suggests a mismatch in the spatial distribution of these land uses. The spatial conditions and urban form significantly influence the compatibility and distribution of mixed land uses, leading to high interdependence but poor spatial coordination [44]. High coupling but low coordination between rental housing and commercial land was observed in Shanghai. This imbalance could lead to inefficiencies in urban functioning, such as increased travel times and reduced accessibility to essential services. The generally low accessibility between rental housing and commercial land, with significant travel times, underscores a critical challenge in urban mobility. This situation can exacerbate socio-economic disparities, as residents in less accessible areas may face greater difficulties in accessing employment and services. In addition, factors like urban population density and infrastructure development [45], which are often unevenly distributed, can also lead to accessibility issues between different land uses such as rental housing and commercial land. To address the accessibility concerns between rental housing and commercial land in Shanghai, a multifaceted approach that integrates urban planning, transportation policy, and technological innovation is required.
The findings from the LISA cluster map and local entropy map provide a detailed understanding of the spatial relationships between coordination (the integration of commercial and housing land uses) and accessibility (ease of movement between these areas) in Shanghai. These relationships are crucial for urban planning and policy-making, as they directly impact the quality of life and economic efficiency of the city.
In the high–high (H–H) clustering, areas within the outer loop road benefit from a robust rail transit supply and a high level of integration between business and housing, indicating strong coordination and accessibility. This suggests that areas with well-developed public transportation and mixed land use exhibit better coordination and accessibility. It highlights the importance of integrated urban development strategies. In the high–low (H–L) clustering, the southeastern part of the urban area, despite having a balanced relationship between employment and housing, suffers from low accessibility due to underdeveloped transit systems. This indicates the need for focused development of public transportation infrastructure in areas where land use is already well-coordinated but accessibility is hindered by transportation limitations. In the low–high (L–H) clustering, areas concentrated within the outer loop road and the northern part of the city have high commercial land density but an imbalance between employment and housing. However, high accessibility is noted, which can mitigate some of the challenges posed by this imbalance. This suggests that even in areas where land use coordination is low, effective transportation can significantly improve accessibility and mitigate some negative impacts. In the low–low (L–L) clustering, the southern and western parts of the urban area, characterized by ruins, scenic spots, and universities, have both low coordination and accessibility. This highlights regions where comprehensive development strategies are needed, focusing on both land use planning and transportation improvements.
This study’s use of a local entropy map to analyze the spatial relationships between business–housing balance and accessibility in Shanghai reveals complex and varied dynamics across the city. The identification of six distinct types of local bivariate relationships provides critical insights for urban planners and policymakers. These findings are crucial for understanding how different urban areas interact and function, impacting the overall urban fabric of Shanghai. Positive linear relationships were predominantly observed in the western and eastern parts of Shanghai, and these areas show a direct, positive correlation between coordination and accessibility. This suggests that as the integration of business and housing land uses improves, so does the ease of access between these areas. Urban development strategies in these regions should continue to promote mixed-use developments and enhance transportation networks to sustain this positive trend. Negative linear relationships were observed in the northeast region, particularly in Longhua Street and Xujiahui Street, and these areas exhibit an inverse relationship between coordination and accessibility. This indicates a potential overemphasis on either housing or commercial land use at the expense of the other, leading to accessibility issues. Strategies should focus on balancing land use to improve coordination without compromising accessibility. Concave relationships were noted in towns adjacent to central districts, and these areas show a complex relationship where improvements in coordination do not linearly translate to better accessibility. This could be due to the saturation of land use or infrastructural limitations. Urban redevelopment and infrastructural upgrades might be necessary to enhance accessibility. Convex relationships were found in towns far from central districts, and improvements in coordination would lead to significant gains in accessibility. These areas likely have an untapped potential for development. Focused investments in infrastructure and mixed-use developments could yield substantial improvements in accessibility. Undefined complex relationships were observed in certain towns distant from central districts that exhibit complex and unpredictable relationships. These areas require detailed, case-by-case analysis to understand the underlying factors affecting their urban dynamics. Tailored, flexible urban planning approaches are needed. Not significant relationships could indicate either a balance or a lack of development in both aspects. Further investigation is needed to understand the specific dynamics and potential of these areas.
The division of Shanghai into eight types based on a “coordination–accessibility–dominant land type” perspective offers a nuanced understanding of urban dynamics. Different areas require tailored strategies. L–L–L areas (low coordination, low accessibility, and lagging rental housing) were concentrated in the central part of the city. These areas suffer from poor integration of housing and commercial land uses, limited accessibility, and a shortage of rental housing. Revitalization projects could be initiated to improve housing availability. Enhancing public transportation and promoting mixed-use developments can improve both accessibility and coordination. L–L–S areas (low coordination, low accessibility, and synchronous land use) were located in peripheral areas. These districts have a balance between housing and business but suffer from poor accessibility and integration. Development of local transportation networks, such as feeder bus services and community shuttles, can improve accessibility. Encouraging local business development can reduce the need for long-distance travel. L–L–B areas (low coordination, low accessibility, and better rental housing) were predominantly found in the southern urban area. These regions have adequate rental housing but lack coordination and accessibility, which can be improved by focusing on developing local employment opportunities to reduce commute times. Improving road infrastructure and public transit options can enhance accessibility. L–H–L and L–H–S areas (low coordination and high accessibility), located in central and northern urban areas, have good transportation but suffer from a mismatch between housing and commercial land uses. Urban planning should focus on rezoning and incentivizing mixed-use developments. Enhancing community facilities can also improve the living environment. L–H–B areas (low coordination, high accessibility, and better commercial land) were found near the central city. These areas have well-developed transportation and commercial land but lack housing options. Policies encouraging the development of affordable housing and residential projects can address this imbalance. Utilizing underused commercial spaces for residential purposes could be explored. H–H–L areas (high coordination, high accessibility, and lagging rental housing) were found in central city areas with good integration and accessibility but a shortage of rental housing. Implementing affordable housing initiatives and regulating real estate markets would prevent the excessive commercialization of residential spaces. H–H–S areas (high coordination, high accessibility, and synchronous land use) was a rare category, represented by only one town, and showed an ideal balance of housing and commercial land uses with excellent accessibility. These areas can serve as models for other parts of the city. Maintaining this balance through careful urban planning and community engagement is crucial.
The spatial mismatch and accessibility issues highlight the necessity for a more holistic approach to urban planning that bridges the gap between residential and commercial areas. The identification of hot and cold spots for both rental housing and commercial lands provides a roadmap for targeted interventions. Developing infrastructure and amenities in cold spot areas, while managing growth in hot spots, could lead to more balanced urban development. The spatial dynamics of rental housing and commercial land have significant implications for the socio-economic fabric of Shanghai. Areas with low accessibility and coordination may face challenges in economic development, social equity, and quality of life [45]. The spatial patterns also have environmental implications. High-density commercial areas may contribute to urban heat islands, while peripheral residential areas might lead to increased vehicle emissions due to longer commutes [43]. What is more, the specific spatial dynamics of rental housing and commercial land ensure that solutions are tailored to the specific needs and characteristics of each area. Shanghai, as China’s economic hub, experiences urban development that is heavily shaped by national directives, including the creation of free trade zones and liberalization efforts. The city’s design and transport infrastructure, particularly its public transit network, profoundly influence the spatial arrangement of residential and commercial areas. Moreover, Shanghai’s demographic composition and level of socioeconomic progress create a distinctive context for urban spatial dynamics. Given these specifics, future urban planning in Shanghai should promote mixed-use developments to enhance coordination and accessibility, thereby integrating living spaces, workplaces, and amenities. Investing in diverse transportation options, including public transit, cycling paths, and pedestrian-friendly streets, can improve accessibility across all areas. Implementing policies that promote affordable housing development, especially in areas with high commercial land density, can alleviate housing shortages. By addressing these spatial relationships, Shanghai can move towards more integrated, accessible, and balanced urban development, enhancing the overall quality of life for its residents. In addition to city-wide considerations, district and county levels must address the imbalance between employment and residence within their towns and villages. Policy adjustments should be made in response to the spatial disparities among these localities.
Figure 7 and Figure 8 illustrate the spatial layout of commercial land in Shanghai, revealing a long-term pattern of expansion from the center outward. This pattern aligns with the monocentric city model, which is consistent with Shanghai’s land use form. The centralization of commercial land supports and verifies the monocentric city model. This spatial structure model provides valuable guidance and reference for studying urban housing land issues in China. The monocentric model explains the formation of land use patterns within the city through the relationship between commuting costs, housing prices, and housing consumption. It also highlights the central role of urban central areas in land use and underscores the significance of commuting costs in shaping urban spatial structure. For housing land, an increase in commuting costs may lead to a decrease in demand for housing far from the city center, as residents are unwilling to bear the high commuting costs. Consequently, housing prices in these areas may decline. Conversely, if commuting costs decrease, living far from the urban center becomes more feasible, potentially increasing housing demand and prices in these areas. Thus, reducing commuting costs or improving accessibility to central areas is a crucial strategy for promoting the construction of affordable housing.
This study also underscores the critical need for a balanced distribution of jobs and housing, particularly in the urban periphery. It identifies a pronounced disparity in the availability and accessibility of rental housing and commercial spaces in these regions, which bears significant consequences for the living standards and societal integration of newcomers and younger demographics. Policymakers are advised to reevaluate land use in suburban areas to foster a cohesive spatial arrangement of residential and commercial zones. Enhancing public transport infrastructure is also crucial for better connectivity between homes and workplaces. Moreover, fiscal incentives and subsidies could stimulate the development of affordable rental properties and business premises in these outskirts. Implementing these strategies may encounter challenges, including financial limitations, subpar infrastructure, and divergent interests between local authorities and developers. Future strategies could involve fostering collaborative efforts among governmental bodies, the private sector, and non-governmental organizations to pool resources; phasing large-scale projects into smaller, feasible segments for incremental improvements; and maintaining policy-making transparency to build public confidence and encourage community involvement.
5. Conclusions
This study introduces an innovative model to dissect the spatial interplay between rental housing and commercial land, assessing the job–housing balance for new citizens and young demographics within the context of Shanghai’s ARH policy. This research reveals significant spatial disparities in the relationship between commercial and rental land across different locations in Shanghai: (1) the spatial distribution of rental and commercial land in Shanghai exhibits a pattern of local clustering; (2) areas with a balanced supply between rental and commercial land are primarily concentrated in the city center; (3) accessibility between rental and commercial lands tends to decrease as one moves towards the outer edges of the city; (4) the city center mainly displays a lower supply balance but higher accessibility, while areas outside the city center, except for the northern part of Chongming County, which shows local low supply balance and high accessibility, generally exhibit low supply balance and low accessibility. The model introduced in this study illuminates the intricate spatial dynamics between housing and commercial zones, a phenomenon prevalent in many fast-growing global cities. The equilibrium of job and housing spaces is pivotal in urban design, significantly influencing the socioeconomic assimilation of new residents and younger cohorts. The identification of spatial variances underscores the necessity to account for land supply equilibrium in urban strategy, vital for cities’ enduring progression worldwide. Concurrently, the disparity in job–housing congruity serves as a critical metric for evaluating a city’s affordable housing agenda, indicating the efficacy of existing policies in addressing job–housing disparities and signaling the need for further urban planning refinements. This holistic methodology not only addresses immediate spatial discrepancies, but also fosters a sustainable framework for future urban development, ensuring that the job–housing balance aligns with the city’s broader socio-economic objectives.
While this study provides valuable insights, it does have limitations. The focus on case studies within specific regions means the methodology may require adaptation to suit diverse environmental and socioeconomic contexts. Data limitations, due to the timing of collection and regional conditions, may affect the research outcomes. Future studies should incorporate broader datasets and longitudinal analyses to overcome these constraints. Moreover, the lack of detailed employment population distribution data necessitates corrections to the supply and demand balance research. With access to such data, subsequent research could employ per capita metrics for leased and commercial land use to thoroughly assess the work–housing balance. Current accessibility measurements, based solely on vehicular speed restrictions due to traffic regulations, may not fully capture actual commuting scenarios. Future efforts should account for real-time commuting accessibility. Additionally, examining the evolution of the work–housing balance and identifying influencing factors will be crucial. Research could also extend to different urban typologies and sizes in order to understand their impact on urban sustainability. Finally, the influence of other urban planning policies, including transportation, land use, and economic strategies, on the affordable housing–job housing equilibrium warrants further exploration.
Author Contributions
Conceptualization, methodology, software, validation, formal analysis, investigation, resources, data curation, and writing—original draft preparation, P.W.; funding acquisition, project administration, data curation, and writing—review and editing, K.L.; conceptualization, writing—review and editing, visualization, supervision, and project administration, W.Z. All authors have read and agreed to the published version of the manuscript.
Funding
Fujian Provincial Foundation for Philosophy and Social Sciences (No. FJ2021C017).
Data Availability Statement
The raw data supporting the conclusions of this article will be made available by the authors on request.
Conflicts of Interest
The authors declare that there are no conflicts of interest.
References
- Liu, T.; Qi, Y.; Cao, G.; Liu, H. Spatial patterns, driving forces, and urbanization effects of China’s internal migration: County-level analysis based on the 2000 and 2010 censuses. J. Geogr. Sci. 2015, 25, 236–256. [Google Scholar] [CrossRef]
- Lee, J. From welfare housing to home ownership: The dilemma of China’s housing reform. Hous. Stud. 2000, 15, 61–76. [Google Scholar] [CrossRef]
- Qiwu, Z.; Yanwen, X. Affordable housing or public rental housing?—Reflections on housing security policy reform. J. Public Adm. 2010, 7, 86–92. [Google Scholar]
- Li, D.; Wang, W.; Huang, G.; Zhou, S.; Zhu, S.; Feng, H. How to enhance citizens’ sense of gain in smart cities? A SWOT-AHP-TOWS approach. Soc. Indic. Res. 2023, 165, 787–820. [Google Scholar] [CrossRef] [PubMed]
- Li, D.; Shang, X.; Huang, G.; Zhou, S.; Zhang, M.; Feng, H. Can Smart City Construction Enhance Citizens’ Perception of Safety? A Case Study of Nanjing, China. Soc. Indic. Res. 2024, 171, 937–965. [Google Scholar] [CrossRef]
- Lu, X.; Jianwen, Z.; Yuxin, S. Local government financial pressure, land finance and housing prices. Rev. Political Econ. 2020, 11, 111–133. [Google Scholar]
- Lin, Y.; Liangwei, Y. Fiscal decentralization and urban expansion—An empirical study based on provincial panel data. Urban Dev. Res. 2018, 25, 97–103. [Google Scholar]
- Hanfei, W.; Changquan, J. China’s land finance in 20 years: Composition and scale (1998–2017). J. Beijing Univ. Technol. (Soc. Sci. Ed.) 2021, 21, 26–38. [Google Scholar]
- Chen, J.; Wu, F. Housing and land financialization under the state ownership of land in China. Land Use Policy 2022, 112, 104844. [Google Scholar] [CrossRef]
- Jin, C.; Choi, M.J. The causal structure of land finance, commercial housing, and social housing in China. Int. J. Urban Sci. 2019, 23, 286–299. [Google Scholar] [CrossRef]
- Xu, Z.; Xiaoping, S.; Xianlei, M. Spatial pattern and influencing factors of affordable housing land allocation—Based on the perspective of spatial mismatch at the provincial, municipal, and county levels. Econ. Geogr. 2022, 42, 184–193. [Google Scholar]
- Yuting, L.; Junli, Q. The strategic choice of affordable housing construction in large cities from the perspective of entrepreneurialism and its social spatial consequences. Hum. Geogr. 2018, 33, 52–59. [Google Scholar]
- Chen, M.; Zhang, W.; Lu, D. Examining spatial pattern and location choice of affordable housing in Beijing, China: Developing a workable assessment framework. Urban Stud. 2015, 52, 1846–1863. [Google Scholar] [CrossRef]
- Ma, Z.; Li, C.; Zhang, J. Affordable housing brings about socio-spatial exclusion in Changchun, China: Explanation in various economic motivations of local governments. Habitat Int. 2018, 76, 40–47. [Google Scholar] [CrossRef]
- Shen, J. Stuck in the suburbs? Socio-spatial exclusion of migrants in Shanghai. Cities 2017, 60, 428–435. [Google Scholar] [CrossRef]
- Liu, Y.; Zhang, F.; Liu, Y.; Li, Z.; Wu, F. The effect of neighbourhood social ties on migrants’ subjective wellbeing in Chinese cities. Habitat Int. 2017, 66, 86–94. [Google Scholar] [CrossRef]
- Yan, Z.; Zhilin, L. A study on housing opportunities and job-housing separation for low- and middle-income residents in Beijing under the background of market transformation. Geogr. Sci. 2018, 38, 11–19. [Google Scholar]
- Wenbing, Z.; Kai, W.; Qian, L.; Si, C. Settlement City: Research on the Supply of Affordable Rental Housing for Newly Employed Youth. Price Theory Pract. 2023, 10, 32–37. [Google Scholar] [CrossRef]
- He, Q.; Zhang, Y. Residential locations and residential moves between the city centre and suburb in Beijing, China. Habitat Int. 2023, 131, 102711. [Google Scholar] [CrossRef]
- Fu, Q.; Lin, N. Local state marketism: An institutional analysis of China’s urban housing and land market. Chin. Sociol. Rev. 2013, 46, 3–24. [Google Scholar] [CrossRef]
- Furlong, A. Unemployment, insecurity, and poor work: Young adults in the new economy. In Handbook of Children and Youth Studies; Springer: Berlin/Heidelberg, Germany, 2015; pp. 531–542. [Google Scholar]
- Ross, M.; Bateman, N. National Service can Connect America’s Young People to Opportunity and Communityand Promote Work of Real Social Value; Brookings Institution: Washington, DC, USA, 2020. [Google Scholar]
- Ta, N.; Chai, Y.; Zhang, Y.; Sun, D. Understanding job-housing relationship and commuting pattern in Chinese cities: Past, present and future. Transp. Res. Part D Transp. Environ. 2017, 52, 562–573. [Google Scholar] [CrossRef]
- Xu, Y.; Zhang, X. The residential resettlement in suburbs of Chinese cities: A case study of Changsha. Cities 2017, 69, 46–55. [Google Scholar] [CrossRef]
- Shen, H.; Xia, L. Research on Social Integration Structure and Path of Floating Population Based on Structural Equation Model: Evidence from China. Soc. Indic. Res. 2023, 165, 607–632. [Google Scholar] [CrossRef]
- Liu, W.; Chen, R. Migration Networks Pattern of China’s Floating Population from the Perspective of Complex Network. Chin. Geogr. Sci. 2023, 34, 327–341. [Google Scholar] [CrossRef]
- Chen, H. Research on the Design of Shanghai Affordable Rental Housing. J. Civ. Eng. Urban Plan. 2023, 5, 40–47. [Google Scholar]
- Chen, M.; Chen, T. Land finance, infrastructure investment and housing prices in China. PLoS ONE 2023, 18, e0292259. [Google Scholar] [CrossRef] [PubMed]
- Chu, M.; Pan, L.; Guo, M.; Xu, L.; Zong, J. Has high housing prices affected urban green development?: Evidence from China. J. Hous. Built Environ. 2023, 38, 2185–2206. [Google Scholar] [CrossRef]
- McCann, P. Modern Urban and Regional Economics; Oxford University Press: New York, NY, USA, 2013. [Google Scholar]
- Xie, Z.; Yan, J. Kernel density estimation of traffic accidents in a network space. Comput. Environ. Urban Syst. 2008, 32, 396–406. [Google Scholar] [CrossRef]
- Bao, Y.; Li, X. Spatial data analysis and spatial models. Geogr. Res. 1999, 18, 185–190. [Google Scholar]
- Song, Q.; Zhou, N.; Liu, T.; Siehr, S.A.; Qi, Y. Investigation of a “coupling model” of coordination between low-carbon development and urbanization in China. Energy Policy 2018, 121, 346–354. [Google Scholar] [CrossRef]
- Yang, C.; Zeng, W.; Yang, X. Coupling coordination evaluation and sustainable development pattern of geo-ecological environment and urbanization in Chongqing municipality, China. Sustain. Cities Soc. 2020, 61, 102271. [Google Scholar] [CrossRef]
- Xiong, J.; Chen, D.; Peng, B.; Deng, S.; Xie, X. Spatio-temporal difference of coupling coordinative degree of ecological carrying capacity in the Dongting Lake region. Sci. Geogr. Sin. 2014, 34, 1108–1116. [Google Scholar]
- Mazziotta, M.; Pareto, A. On a generalized non-compensatory composite index for measuring socio-economic phenomena. Soc. Indic. Res. 2016, 127, 983–1003. [Google Scholar] [CrossRef]
- Shi, T.; Yang, S.; Zhang, W.; Zhou, Q. Coupling coordination degree measurement and spatiotemporal heterogeneity between economic development and ecological environment—Empirical evidence from tropical and subtropical regions of China. J. Clean. Prod. 2020, 244, 118739. [Google Scholar] [CrossRef]
- JTG B01-2014 Translated English of Chinese Standard. JTGB01-2014: Technical Standard of Highway Engineering. Available online: https://www.chinesestandard.net (accessed on 6 July 2024).
- Zhang, Y.; Liu, Y.; Zhang, Y.; Liu, Y.; Zhang, G.; Chen, Y. On the spatial relationship between ecosystem services and urbanization: A case study in Wuhan, China. Sci. Total Environ. 2018, 637, 780–790. [Google Scholar] [CrossRef] [PubMed]
- Rényi, A. On measures of entropy and information. In Volume 1: Contributions to the Theory of Statistics, Proceedings of the Fourth Berkeley Symposium on Mathematical Statistics and Probability, Davis, CA, USA, June 20–July 30, 1960; University of California Press: Berkeley, CA, USA, 1961; pp. 547–562. [Google Scholar]
- Guo, D. Local entropy map: A nonparametric approach to detecting spatially varying multivariate relationships. Int. J. Geogr. Inf. Sci. 2010, 24, 1367–1389. [Google Scholar] [CrossRef]
- Niu, N.; Li, L.; Li, X.; He, J. The structural dimensions and community vibrancy: An exploratory analysis in Guangzhou, China. Cities 2022, 127, 103771. [Google Scholar] [CrossRef]
- Singh, R.B. Urban Development Challenges, Risks and Resilience in Asian Mega Cities; Springer: Berlin/Heidelberg, Germany, 2015. [Google Scholar]
- Mashhoodi, B.; Berghauser Pont, M. Studying land-use distribution and mixed-use patterns in relation to density, accessibility and urban form. In Proceedings of the 18th International Seminar on Urban Form, Montreal, QC, Canada, 26–29 August 2011; pp. 1–19. [Google Scholar]
- Yang, J.; Shi, Y.; Yu, C.; Cao, S.-J. Challenges of Using Mobile Phone Signalling Data to Estimate Urban Population Density: Towards Smart Cities and Sustainable Urban Development; SAGE Publications Sage UK: London, UK, 2020; Volume 29, pp. 147–150. [Google Scholar]
Disclaimer/Publisher’s Note: The statements, opinions and data contained in all publications are solely those of the individual author(s) and contributor(s) and not of MDPI and/or the editor(s). MDPI and/or the editor(s) disclaim responsibility for any injury to people or property resulting from any ideas, methods, instructions or products referred to in the content. |
© 2024 by the authors. Licensee MDPI, Basel, Switzerland. This article is an open access article distributed under the terms and conditions of the Creative Commons Attribution (CC BY) license (https://creativecommons.org/licenses/by/4.0/).