Abstract
During the Second Taiwan Strait Crisis from 1958 to 1979, a large number of underground tunnels were dug to meet the needs of the war on the island of Kinmen, which is located between Taiwan and China, to provide defense, refuge, and transportation of materials. However, the tunnels caused many problems during the post-war development of the island. For example, there are problems of property ownership between underground and aboveground objects, and difficulties in infrastructure construction. Therefore, it is necessary to clarify the relationship between assets of historical significance and value and aboveground objects to ensure that cultural assets are adequately protected and properly planned. In this study, the 3D point cloud model of underground tunnels and the ground surface will be integrated by ground-based lidar technology and analyzed by overlapping with cadastral maps and urban planning maps to obtain accurate spatial relationships. The point cloud data measurements can be used to obtain the location and depth of the tunnels, which can be used as a reference for land disputes, urban planning, engineering design, and preservation or restoration plans for cultural assets.
1. Introduction
During the period from 1958 to 1979, the Second Taiwan Strait Crisis occurred, with Kinmen, located at the forefront of the conflict, witnessing several battles. The most famous of these was the Artillery Battle of 23 August. On 23 August 1958, the People’s Republic of China initiated artillery warfare, which lasted until early October of the same year when the pattern of bombardment was altered to alternate days [1,2]. In response to strategic command, defense, evacuation, and supply needs, numerous underground tunnels and air-raid shelters were excavated in Kinmen. These subterranean structures could facilitate counterattacks during the artillery battles, while the tunnels beneath civilian settlements provided shelters for the populace, each embodying the determination for a prolonged resistance. Today, these tunnels, having witnessed the transition of the people from danger and suffering under bombardment to a peaceful and prosperous coexistence, serve both as tourist attractions and cultural heritage sites. The military use of these tunnels has receded into history, and with the changing needs of societal development, the development and construction on both public and private lands continue to advance. The tunnels, bearing the past and the future, play a critical role in restoring history and educating visitors. Their proper preservation and reuse remain significant challenges. During wartime, due to national emergencies and operational demands, the excavation of tunnels was often conducted without the consent of the landowners, and the detailed locations of these tunnels were not recorded, inadvertently infringing on the rights of the landowners. However, with urban development and the lack of corresponding maps for these underground tunnels, many have been damaged. To better protect these tunnels, accurate acquisition and analysis of relevant spatial data are necessary.
Laser scanning technology, developed in the 1960s, utilizes the energy of radiated light to produce highly coherent and bright laser beams. These beams maintain a narrow focus and reflect efficiently, enabling precise distance measurements. The technology operates by measuring the time-of-flight or phase difference between the emitted and reflected laser light to determine distances accurately [3,4]. Laser scanning is widely used in various fields such as geospatial mapping, architecture, manufacturing, and healthcare. Its applications include creating detailed topographic maps, precise building measurements, quality control in manufacturing, and non-invasive medical imaging [5,6,7]. Continuous advancements enhance its accuracy, speed, and versatility, driving further innovations across industries.
In recent years, 3D laser scanning technology has evolved and commercialized, surpassing traditional manual surveying, digital cameras, and video equipment. Particularly in engineering surveying, terrestrial scanners quickly acquire three-dimensional coordinates of object surfaces without reflective prisms. This technology offers high efficiency, precision, and convenience, enabling rapid acquisition of dense point cloud data that meets stringent accuracy requirements [3,5]. Applications range from topographic mapping and structural analysis to quality control in construction, significantly enhancing engineering workflows. Currently, it is widely applied in various fields including civil engineering construction, maintenance of architectural heritage [8,9], cadastral analysis [10], restoration design simulation estimates [11], disaster and risk assessment surveys, deformation monitoring, crack monitoring, and the preservation of cultural assets [12]. Ruther et al. have advocated for the creation of cultural and landscape preservation databases with spatial information data to implement the digital archiving of cultural assets [13,14,15].
The contemporary practice of utilizing terrestrial LiDAR (Light Detection and Ranging) for collecting spatial data on historical structures has become a norm. The uniqueness of underground tunnels lies in their deep burial beneath the earth’s surface, where traditional surveying methods fall short in accurately and swiftly documenting the entirety of the tunnels. Thus, employing terrestrial LiDAR equipment to work from the ground surface downwards enables the comprehensive recording of both aboveground data and subsurface tunnel data. This study integrates point cloud data from both the surface and the underground tunnels, facilitating precise localization of the tunnels in relation to the surface. This not only reveals the depth of the tunnels but also through the establishment of surface elevation models, allows for the generation of intuitive trend graphs illustrating the relationship between tunnel depth and surface thickness [16,17]. Such analysis provides insights into the spatial relationship between underground tunnels and land topography, as well as information on underground tunnels and land use. Utilizing 3D laser scanning to survey surface structures, such as buildings, enables the acquisition of spatial relationships of these constructions. By transforming the coordinates, point cloud data can be converted into the cadastral coordinate system. This allows for the comparison of buildings with cadastral data, facilitating the clarification of issues related to land ownership and other related matters [18,19,20,21,22,23,24].
2. Materials and Methods
2.1. Study Area Description
Kinmen, located on the western side of Taiwan’s main island and to the east of Xiamen on the Chinese mainland, is only 10 km away from the mainland, as illustrated in Figure 1. During wartime, Kinmen served as the front line, where tunnels were broadly categorized into logistical support tunnels and civil defense combat tunnels. The logistical support tunnels, larger in scale, could accommodate large supply trucks, tanks, and mechanized artillery weapons. Some were even amphibious, allowing supply ships to enter and exit. Starting in 1968, the construction of underground tunnels was initiated based on existing bunkers and air-raid shelters in various villages, connecting them to achieve the tactical goal of “preserving combat power underground and projecting firepower above ground”.
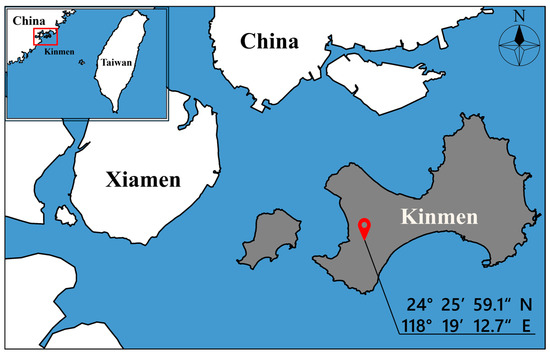
Figure 1.
Location of Kinmen.
To elucidate the spatial relationship between underground tunnels and the surface, this study selected the Jincheng Civil Defense Tunnel in Jincheng Town for analysis. The tunnel spans approximately 2559 m and was commenced on 5 June 1979. It took over one year and two months to complete, with the construction cost exceeding 16.11 million New Taiwanese Dollars at that time. The tunnel features 22 entries and exit points, 2 machine gun bunkers, 7 zigzag shooting positions, one underground well, and a command center. The Jincheng Civil Defense Tunnel was established for purposes of underground transportation, command, and evacuation, and it runs through the center of Jincheng Town, passing significant institutions such as the Jincheng Town Office, Post Office, Agricultural Association, Station, Bank, Taiwan Power Company, Kinmen County Government, and Kinmen High School.
2.2. Research Process
The research process described encompasses steps from setting objectives to data collection, and finally, to the analysis of results. After selecting the target and methodology, the process is sequentially divided into several key phases: collection of tunnel data, collection of surface data, verification of control point data, integration of tunnel and surface point cloud data, and the final analysis and discussion of outcomes.
Collection of tunnel data:
- -
- Tunnel scan data acquisition:
- Collect and analyze point cloud files from previous tunnel scans.
- -
- Tunnel point cloud stitching:
- Stitching the tunnel data obtained from different locations in the past data into a complete tunnel point cloud model.
- Collection of surface data:
- -
- Ground Surface Scanning:
- Scans the surface above the pit to obtain data.
- -
- Surface point cloud stitching:
- Combines surface data scanned from different locations into a complete surface point cloud model.
Verification of control point data:
- -
- The control points are verified by measuring the control points to ensure that the control points have not been moved, changed, or buried, and that the data obtained by scanning meets the requirements to ensure the accuracy of the subsequent coordinate system data.
Integration of tunnel and surface point cloud data:
- -
- The surface and tunnel point cloud models were merged with environmental feature points and assigned TWD97 coordinates through control points for subsequent analysis.
The final analysis and discussion of research results:
- -
- Based on the point cloud model data, the depth judgment analysis is carried out and the tunnel sectional view is made.
- -
- Nesting point cloud data with cadastral map data and plotting and analyzing the cadastral status of the tunnel.
- -
- Elevation models were built from tunnel and surface data to plot trend maps of tunnel height and surface thickness.
- -
- Based on the integrated data, the corresponding part is extracted for analysis, such as the plane location, the depth of the tunnel relative to the surface, and the ownership of the lands, and the final result data are produced.
2.3. Laser Scanning Execution Process
Underground civil defense tunnels differ from traditional surface structures, and the main problems encountered during data collection are their deep subterranean nature, asymmetric spatial dimensions, varying heights, and winding directions. These characteristics make traditional surveying methods, such as topographical surveys and GPS positioning, nearly impossible to fully document these tunnels. Standard surveying equipment often lacks the capability to operate effectively at these depths, complicating the acquisition of accurate measurement data and comprehensive documentation. Varying heights within the tunnels further exacerbate the documentation difficulties. These fluctuations in elevation require specialized equipment and techniques for accurate measurement, as traditional methods are typically designed for relatively uniform surface terrains. Moreover, the winding directions of these tunnels create navigational obstacles. These twists and turns hinder the straightforward application of conventional surveying methods, necessitating innovative approaches to ensure complete and precise documentation.
To overcome these challenges, LiDAR (Light Detection and Ranging) technology has become very important for capturing detailed three-dimensional data of the tunnels. By emitting laser pulses and measuring the time it takes for them to return after hitting a surface, LiDAR can create high-precision point clouds of complex underground environments. By combining these point cloud data with surface point cloud data and integrating surface control surveys to provide absolute coordinates, the coordinates of the underground tunnels can be obtained. Integrating these point cloud data with Geographic Information Systems (GIS) allows for effective management and analysis of the collected data. GIS platforms enable the visualization, interpretation, and sharing of complex spatial information, thereby facilitating better decision-making and planning for maintenance and safety measures. Additionally, due to the conflicts between civil defense tunnels and cadastral maps, topographical maps, urban planning maps, and land use and management aspects, obtaining accurate three-dimensional spatial dimensions will facilitate objective conflict resolution analysis. Therefore, this study utilizes 3D laser scanning technology to perform scans of both underground tunnels and the surface. Through coordinate transformation, the point cloud model is overlaid with cadastral data within a unified coordinate system. This method is intended for subsequent spatial overlay and analysis with cadastral maps, topographical maps, urban planning maps, and other relevant cartographic data.
For underground tunnel scanning, choose a mid-range scanner, the FARO Photon 120 terrestrial LiDAR produced by United States FARO Technologies, Inc. (Lake Mary, FL, USA), which has an effective scanning range of up to 153 m and a scanning speed of 976,000 points per second. Its scanning principle is based on continuous wave phase difference time measurement, covering an effective scanning range of 360° horizontally and 320° vertically. For surface scanning, a long-range scanner is chosen, the Riegl VZ-400 terrestrial LiDAR from RIEGL Laser Measurement Systems in Austria (Horn, Austria), which can reach distances up to 600 m, scanning at a speed of 42,000 points per second based on pulse measurement, with an effective scanning range of 360° horizontally and 100° vertically (Figure 2).
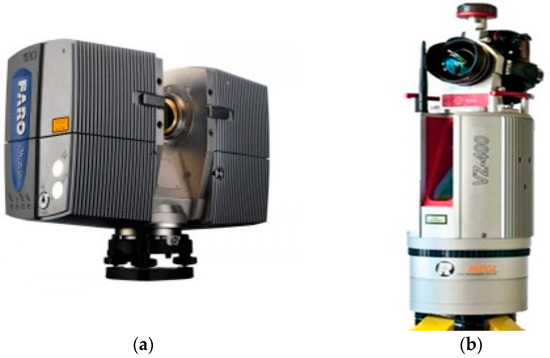
Figure 2.
The laser scanning equipment used. (a) FARO Photon 120 terrestrial LiDAR; (b) Riegl VZ-400 terrestrial LiDAR.
3. Results
3.1. Laser Scanning and Point Cloud Data Processing
3.1.1. The Scanning of Underground Tunnels
The scanning of underground tunnels was conducted using the FARO Photon 120 terrestrial LiDAR equipment, progressing from the tunnel entrance inward. Given that the FARO Photon 120 is a medium-short range phase-based laser scanner, with a scanning distance of 0.6 m to 120 m and a scanning error of ±2 mm, it is suitable for scanning in the confined spaces inside tunnels. Due to the lack of distinct features within the tunnel interiors, conjugate targets were placed to establish common feature points between survey stations. This method provides a reference for stitching between two survey stations (Figure 3). By utilizing the surface point cloud coordinates of the conjugate targets, the spherical center coordinates of the conjugate targets could be deduced. Once the conjugate targets between two adjacent survey stations were fully selected, the corresponding spherical center coordinates were used to stitch the point clouds from the two stations together. This section may be divided by subheadings. It should provide a concise and precise description of the experimental results, their interpretation, as well as the experimental conclusions that can be drawn.
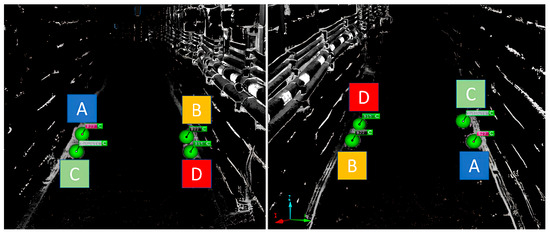
Figure 3.
The conjugate target is used for indirect station merging.
The scanning of the underground tunnels required a total of 143 survey stations. In addition to the existing entrances and exits of the main tunnel, there were several sealed off branch tunnels in the middle, which might lead to private residences, the town hall, post office, agricultural association, banks, the county government, or other important institutions. The results of point cloud splicing are shown in Figure 4.
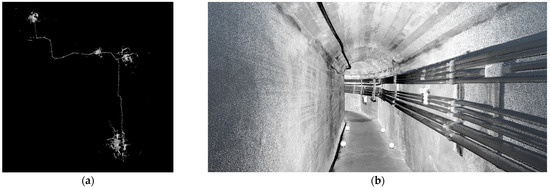
Figure 4.
The results of point cloud splicing. (a) A general map of the results of underground tunnel data; (b) point cloud stitching results internal image.
3.1.2. The Scanning of Ground Surface
The surface scanning was performed using the Riegl VZ-400 terrestrial LiDAR, a pulse-based scanner with a maximum effective scanning distance of approximately 600 m, making it suitable for street scanning. The point cloud stitching method employed is environmental stitching, which involves extracting vector data between survey stations and then performing feature plane matching calculations (Figure 5), thereby assembling a complete point cloud model (Figure 6).
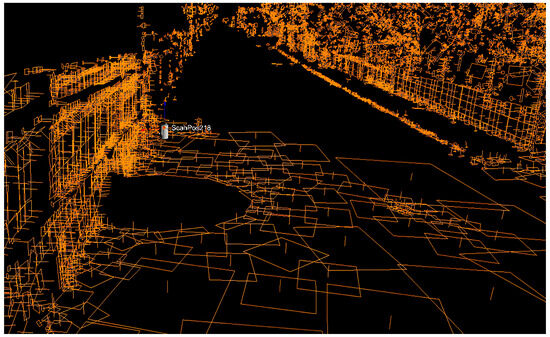
Figure 5.
Vector data for RiSCAN PRO.
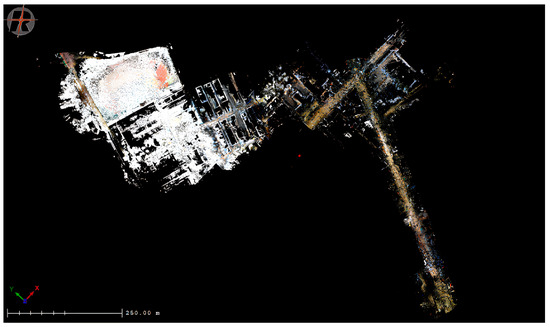
Figure 6.
A general map of the results of the surface data.
The surface scanning operation required a total of 219 survey stations. As the direction of the tunnels could only be roughly understood, the scanning was conducted along the path of the street layout to ensure that complete surface information was preserved, facilitating the subsequent overlaying of cadastral maps.
Due to the elongated and repetitive geometry of tunnels, error propagation may occur during the scan alignment process, affecting the point cloud stitching and making it impossible to provide accurate and reliable 3D data. For these reasons, establishing a reliable control network is crucial, with two main objectives: to check the alignment of the scan data and to provide a reference coordinate system for all acquired data.
Therefore, after completing the separate point cloud datasets for both the underground tunnels and the surface, it is necessary to integrate the results of the underground tunnels with the surface data within the same coordinate system. This integration is achieved by stitching the datasets at the tunnel entrances and exits using the surrounding environment. Subsequently, absolute coordinates are assigned through control points established during the surface scan. This allows for the full visualization and checking of the relative relationship and approximate depth between the underground tunnels and the surface, as well as the alignment of the scan data (Figure 7, Figure 8 and Figure 9).
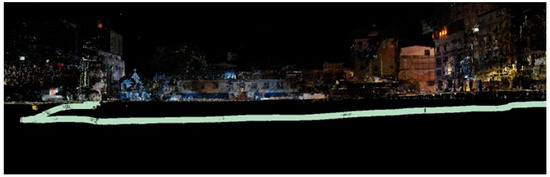
Figure 7.
Sectional view of the entrance to the tunnel.
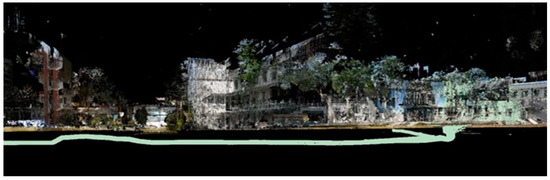
Figure 8.
Sectional view of the Kinmen County Government.
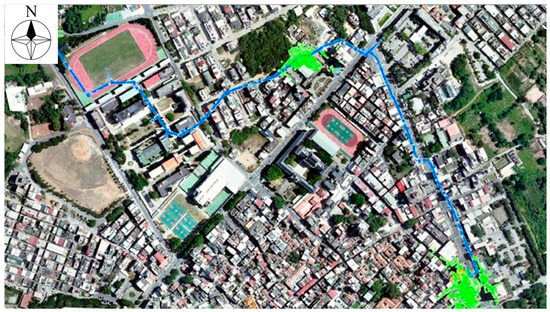
Figure 9.
The actual location of the underground tunnel (blue part is the location of the underground tunnel).
3.2. The Point Cloud Data Are Drawn into a Floor Plan through AutoCAD
In order to accurately calculate the tunnel area, the point cloud data needs to be refined and archived in the RCS file format by ReCap, and then imported into AutoCAD using the attachment function. In CAD, the tunnel boundaries are delineated using the orthogonal projection method (Figure 10). This method provides an accurate representation of the layout and dimensions of the tunnel, making it easy to calculate its general area.
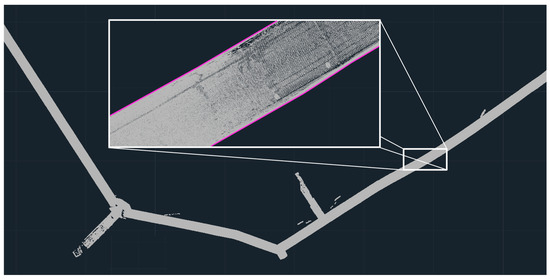
Figure 10.
Imported point cloud into AutoCAD and boundary results drawn in CAD.
Within the study area, there are four land sections: Cheng-Bei, Cheng-Xi, Xiang-An, and Xiang-Rui, as shown in Figure 11. After thinning the point cloud model and delineating the tunnel boundaries within AutoCAD2024, it becomes possible to calculate the area of the tunnels in relation to both public and private lands, as illustrated in Figure 12 and Figure 13. This process enables a precise assessment of how much tunnel space intersects with different types of land ownership, providing valuable data for urban planning, land management, and historical preservation efforts.
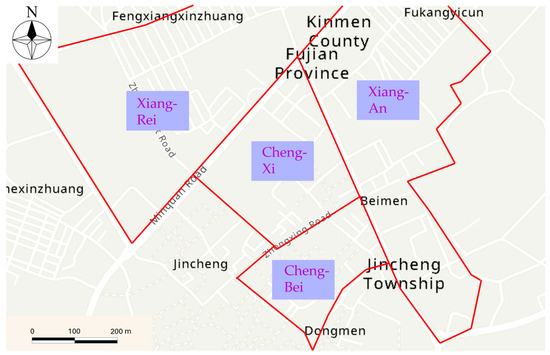
Figure 11.
Cadastral section boundary map of the study area.
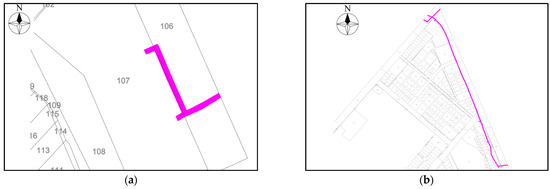
Figure 12.
(a) The tunnel passes through the area of Cheng-Bei; (b) the tunnel passes through the area of Cheng-Xi.
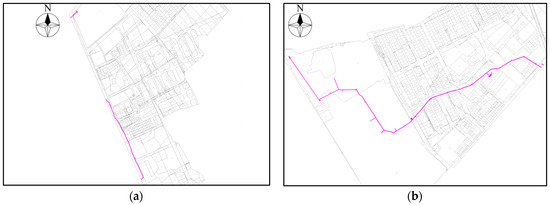
Figure 13.
(a) The tunnel passes through the area of Xiang-An; (b) the tunnel passes through the area of Xiang-Rui.
4. Discussion
4.1. Point Cloud Model Analysis
The variation in the elevation of the tunnels reveals that they are not situated at a uniform depth. Instead, the tunnels fluctuate with the terrain, featuring areas of varying height. The shallowest sections are approximately four meters deep, while the deepest areas reach depths of approximately 20 m, as illustrated in Figure 14. This variation in depth highlights the complexity of the tunnel system and its adaptation to the geographical and topographical conditions of the area.
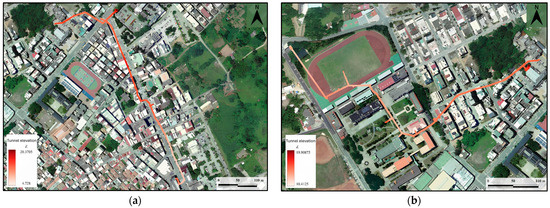
Figure 14.
(a) Tunnel distribution and elevation changes in Cheng-Bei, Cheng-Xi, and Xiang-An; (b) tunnel distribution and elevation changes in Xiang-Rui.
The cross-sectional results reveal variations in tunnel elevation, such as at a point 370 m from the entrance (Figure 15), where the tunnel is 5.4 m below the surface. Due to geological changes or unspecified reasons, the tunnel ascends, reducing the depth to only 2.9 m below the surface. If reconstruction is required at this location, excavating downwards for building foundations would inevitably intersect with the tunnel, potentially causing damage to it. This highlights the importance of precise mapping and understanding of tunnel depths in planning and construction to avoid disrupting existing underground structures.
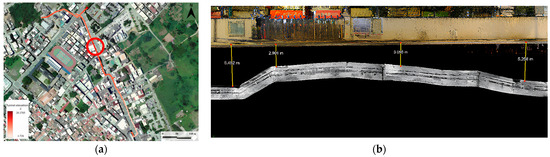
Figure 15.
(a) Tunnel at a point 370 m from the entrance; (b) sectional view of tunnel at a point 370 m from the entrance.
To determine the trend of the orthometric height of the tunnel’s upper edge, it was found that due to significant variations in the surface elevation, the thickness of the soil layer above the tunnel could not be deduced merely from the orthometric height trend. To accurately calculate the thickness of the soil layer above the tunnel, numerical elevation models (digital elevation models, DEMs) of both the tunnel’s upper edge and the surface’s lower edge were created. By subtracting the two models, the difference in elevation between the surface and the tunnel’s upper edge, which represents the soil layer thickness, could be determined. Coupled with the point cloud model, this method provides a more precise understanding of the specific depth information. As shown in Figure 16 and Figure 17, at the shallowest section of the tunnel, the distance from the tunnel to the surface is approximately 1.6 m deep. This approach enables a detailed analysis of the spatial relationship between underground structures and the surface, facilitating informed decision-making for infrastructure development and preservation efforts.
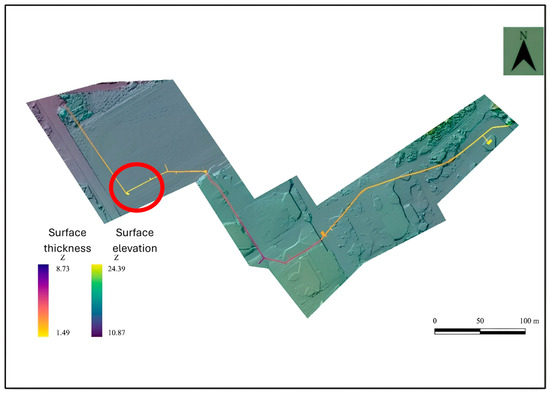
Figure 16.
Trend plot of tunnel relative surface thickness.
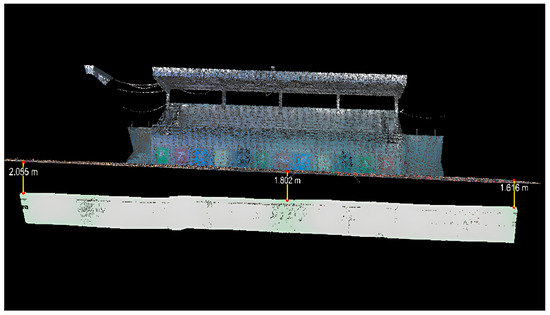
Figure 17.
Sectional view of the shallowest position from the point cloud profile to the surface.
4.2. Point Cloud Model and Cadastral Overplotting Results
From Table 1, it is evident that 20.57% of the tunnels pass through private land, covering an area of 355.91 square meters, with the majority located in the Xiang-Rui and Cheng-Xi sections, as shown in Figure 18 and Figure 19. The tunnels that traverse private property are all situated within residential areas. This information is crucial for understanding the impact of the tunnels on private land use and for facilitating negotiations related to land rights, preservation, and development in these residential zones.

Table 1.
The area and proportion of public and private land passing through by the underground tunnel.
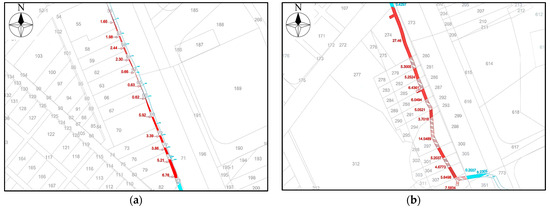
Figure 18.
The numbers in the picture indicate the area of the tunnel to which the arrow is pointing, and the red color is private land, and the blue is public land. (a) The area of private land in Cheng-Xi; (b) the area of private land in Cheng-Xi.
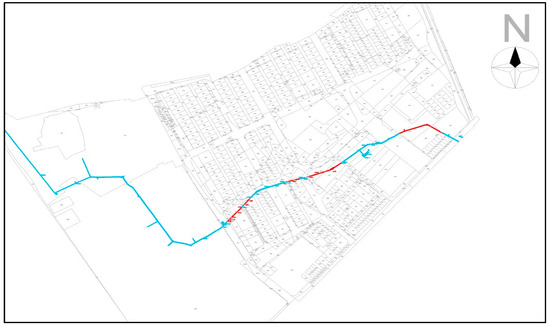
Figure 19.
The area of private land in the Xiang-Rui lot. The red color is private land and the blue is public land.
5. Conclusions
By overlaying the tunnel data with orthophotos, it is possible to discern the tunnels’ locations, directions, and the potential for them to pass beneath buildings. Should there be a likelihood of tunnel crossings, further detailed examinations can be conducted using the data obtained from overlaying the tunnels on cadastral maps. This outcome provides valuable information for engineering departments or development planning agencies as reference material for assessing land development and utilization over broad sections of the area. This approach enhances the accuracy of planning and development strategies by identifying the spatial relationship between underground infrastructure and surface-level land use, ensuring that development efforts are informed and respectful of existing underground features.
This study aims to protect underground cultural assets. By conducting a comprehensive survey and clarifying the precise three-dimensional spatial relationship between Kinmen’s underground tunnels and the land above, accurate, precise, and legal land development or urban modification plans can be executed. Integrating point cloud data from both above and below the surface and assigning absolute coordinates allows for the precise positioning of tunnels in space, providing depth data with greater accuracy than that obtained from topographic maps alone.
During wartime, tunnels excavated for military purposes often disregard the land rights of civilians. Post-war efforts to restore civilian land rights and meet land development needs necessitate comprehensive surveys to clarify the extent of underground tunnels and land ownership. This study provides an effective survey method that can quickly and accurately clarify the 3D spatial relationship between underground tunnels and land ownership boundaries, offering foundational data for effectively resolving land disputes.
Author Contributions
Writing—original draft, W.-C.L.; Writing—review & editing, T.-C.W. All authors have read and agreed to the published version of the manuscript.
Funding
This research received no external funding.
Data Availability Statement
The original contributions presented in the study are included in the article, further inquiries can be directed to the corresponding author.
Conflicts of Interest
The authors declare no conflict of interest.
References
- Lin, H.T. The Cold War between Taiwan and China—The Declassified Documents; Joint Publishing: Hong Kong, China, 2015. [Google Scholar]
- Tsai, H.-M.; Chiang, B.-W. Enclosing resources on the islands of Kinmen and Xiamen: From war blockade to financializingnatural heritage. J. Mar. Isl. Cult. 2014, 3, 69–77. [Google Scholar] [CrossRef]
- Vosselman, G.; Maas, H.-G. Airborne and Terrestrial Laser Scanning; Whittles Publishing: Dunbeath, UK, 2010. [Google Scholar]
- Chiabrando, F.; Turco, M.L.; Rinaudo, F. Modeling The Decay in an Hbim Starting From 3D Point Clouds. A Followed Approach For Cultural Heritage Knowledge. In Proceedings of the 26th International CIPA Symposium 2017, Ottawa, ON, Canada, 28 August–1 September 2017. [Google Scholar]
- Campi, M.; di Luggo, A.; Palomba, D.; Palomba, R. Digital Surveys and 3D Reconstructions for Augmented Accessibility of Archaeological Heritage. Int. Arch. Photogramm. Remote Sens. Spat. Inf. Sci. 2019, XLII-2/W9, 205–212. [Google Scholar] [CrossRef]
- Wehr, A.; Lohr, U. Airborne laser scanning—An introduction and overview. ISPRS J. Photogramm. Remote Sens. 1999, 54, 68–82. [Google Scholar] [CrossRef]
- Gatziolis, D.; Andersen, H.-E. A Guide to LIDAR Data Acquisition and Processing for the Forests of the Pacific Northwest; US Department of Agriculture, Forest Service, Pacific Northwest Research Station: Washington, DC, USA, 2008.
- Baltsavias, E.P. Airborne laser scanning: Basic relations and formulas. ISPRS J. Photogramm. Remote Sens. 1999, 54, 199–214. [Google Scholar] [CrossRef]
- Dell’Amico, A. The Walled City of Verona. Integrated Survey Systems for the Enhancement and Promotion of Verona’s City Walls, Humanities and Digital Technologies for Shaping the Future. In Proceedings of the 29th International CIPA Symposium, Florence, Italy, 25–30 June 2023. [Google Scholar]
- Hwang, L.S.; Liu, P.Y. A study on 3D Stereo Map using Multi-Satellite Measurement and 3D LiDAR technology. Taiwan J. Geoinformatics 2022, 10, 2. [Google Scholar]
- Shan, J.; Toth, C.K. (Eds.) Topographic Laser Ranging and Scanning: Principles and Processing; CRC Press: Boca Raton, FL, USA, 2008. [Google Scholar]
- Boehler, W.; Heinz, G.; Marbs, A. The Potential of Non-Contact Close Range Laser Scanners for Cultural Heritage Recording; CIPA Working Group V: Mainz, Germany, 2001. [Google Scholar]
- Biolo, F.; Guzzetti, F.; Anyabolu, K.L.N. Documenting, Understanding, Preserving Cultural Heritage: Humanities and Digital Technologies for Shaping the Future. In Proceedings of the 29th CIPA Symposium, Florence, Italy, 25–30 June 2023. [Google Scholar]
- Aiello, D.; Bolognesi, C. Reviviendo La Historia: La Reconstrucción Digital Del Convento De Santa María De Las Gracias En Milán. Virtual Archaeolagy Rev. 2020, 11, 106–126. [Google Scholar] [CrossRef]
- Ruther, H.; Chazan, M.; Schroeder, R.; Neeser, R.; Held, C.; Walker, S.J.; Matmon, A.; Horwitz, L.K. Laser scanning for conservation and research of African cultural heritage sites: The case study of Wonderwerk Cave. J. Archaeol. Sci. 2009, 36, 1847–1856. [Google Scholar] [CrossRef]
- Lichti, D.D.; Gordon, S.J.; Stewart, M.P. Ground-based laser scanners: Operation, systems and applications. Geomatics 2002, 56, 21–33. [Google Scholar]
- Doneus, M.; Briese, C.; Fera, M.; Janner, M. Archaeological prospection of forested areas using full-waveform airborne laser scanning. J. Archaeol. Sci. 2008, 35, 882–893. [Google Scholar] [CrossRef]
- Tikhonova, K.V.; Solovyova, Y.S.; Geydor, V.S.; Tikhonov, D.A. Technology of three-dimensional laser scanning of real estate objects (3D modeling) in cadastral activities. IOP Conf. Ser. Earth Environ. Sci. 2021, 937, 042071. [Google Scholar] [CrossRef]
- Kostov, G. 3D Terrestrial Laser Scanning for Cadastral and Design Activities—Performing, Data Processing and Analysis. Storage and Backup in the Light of the Nowadays Cloud Possibilities. FIG WW 2020, September 2020. Available online: https://www.researchgate.net/publication/344172065_3D_terrestrial_laser_scanning_for_cadastral_and_design_activities_-_performing_data_processing_and_analysis_Storage_and_backup_in_the_light_of_the_nowadays_cloud_possibilities (accessed on 2 June 2024).
- Chio, S.-H.; Hou, K.-W. Application of a Hand-Held LiDAR Scanner for the Urban Cadastral Detail Survey in Digitized Cadastral Area of Taiwan Urban City. Remote Sens. 2021, 13, 4981. [Google Scholar] [CrossRef]
- CIPA-ICORP-ISCARSAH 2017 Joint Meeting Committee. CIPA-ICORP-ISCARSAH 2017 Joint Meeting Conference Proceeding. In Proceedings of the ICOMOS India Organized the 19th Triennial General Assembly in Delhi, Delhi, India, 12–15 December 2017. [Google Scholar]
- Chen, J.; Wang, H.; Yang, S. Tightly Coupled LiDAR-Inertial Odometry and Mapping for Underground Environments. Sensors 2023, 23, 6834. [Google Scholar] [CrossRef] [PubMed]
- Saeidian, B.; Rajabifard, A.; Atazadeh, B.; Kalantari, M. Underground Land Administration from 2D to 3D: Critical Challenges and Future Research Directions. Land 2021, 10, 1101. [Google Scholar] [CrossRef]
- Mitasova, H.; Drake, T.G. Quantifying rapid changes in coastal topography using modern mapping techniques and GIS. Environ. Eng. Geosci. 2004, 10, 1–11. [Google Scholar] [CrossRef]


Disclaimer/Publisher’s Note: The statements, opinions and data contained in all publications are solely those of the individual author(s) and contributor(s) and not of MDPI and/or the editor(s). MDPI and/or the editor(s) disclaim responsibility for any injury to people or property resulting from any ideas, methods, instructions or products referred to in the content. |
© 2024 by the authors. Licensee MDPI, Basel, Switzerland. This article is an open access article distributed under the terms and conditions of the Creative Commons Attribution (CC BY) license (https://creativecommons.org/licenses/by/4.0/).