Article

Using Ecological Footprint Analysis to Evaluate Sustainable Development in Lushan County, China

by
Huihui Yang
1,2,
Shuiyu Yan
2,
Na An
1,* and
Qiang Yao
1
1
College of Architecture and Urban Planning, Tongji University, Shanghai 200092, China
2
School of Architecture and Urban Planning, Chongqing University, Chongqing 400044, China
*
Author to whom correspondence should be addressed.
Land 2024, 13(7), 1081; https://doi.org/10.3390/land13071081
Submission received: 3 June 2024 / Revised: 15 July 2024 / Accepted: 16 July 2024 / Published: 18 July 2024
(This article belongs to the Special Issue Landscape Ecological Risk in Mountain Areas)

Abstract

:
Mountain town ecosystems are fragile and highly susceptible to the impacts of human activities and ecological imbalances. This study aimed to improve the traditional ecological footprint (EF) model by incorporating expanded land functions, localised factors, and temporal continuity. Using Lushan County in Sichuan Province as a case study, we calculated spatial and temporal changes from 2009 to 2022 and evaluated sustainable development through four indicators: ecological pressure, ecological sustainability, ecological occupation, and ecological–economic coordination. The results show that from 2009 to 2022, the per capita ecological carbon footprint in Lushan County decreased by 48%, and the ecological carrying capacity declined by 9%. Despite a more than 73% reduction in the ecological surplus, indicating gradual ecological recovery, Lushan County remains in an ecological deficit state with increasing ecological unsustainability. Only forest land is in an ecological surplus state among the six land use categories, while all other categories are in ecological deficit states. Regarding ecological sustainability assessment, Lushan County’s overall land use is in a strong sustainability state, with the sustainable development index gradually improving. However, ecological–economic coordination remains poor, with a high ecological occupation index and significant ecological pressure, indicating an imbalance between economic development and ecosystem protection. For future sustainable development in mountainous areas, Lushan County should focus on reducing the ecological carbon footprint and enhancing the ecological carrying capacity. These research findings provide valuable insights and methodological references for the sustainable development of mountain towns.

1. Introduction

Mountainous town ecosystems have high ecological sensitivity, weak self-repair capacity, and low resistance to disturbances. These towns are easily affected by adverse ecological conditions, topography, vegetation, and hydrological environments, making their ecological environment highly susceptible to damage, notably air pollution and water-related issues [1]. Once the mountain environment is damaged, the extent of the damage and the recovery time are longer than in other regions, severely limiting the healthy development of mountainous towns [2]. Mountainous areas possess diverse ecosystems and abundant valuable resources. Due to their high altitude and relative isolation, they are among the most fragile biogeographical regions in the world. Many mountainous areas have developed nature reserves [2].
Specific research achievements have been made in assessing the sustainability of mountainous towns [3,4,5]. Many scholars have analysed the particularities of sustainable development in mountainous areas, gradually focusing on applying the ecological footprint (abbreviated as EF) in the sustainable development of mountainous towns. The EF, as the land area required for humans to consume resources and purify waste [6,7], reflects human activities’ occupation of natural resources. It considers the degree of natural resource utilisation and its impact on sustainable development in a comprehensive and balanced way. With the development of EF theory, the EF method has been widely applied in domestic and international academia, with research primarily divided into several aspects: First, different scales of EF models, encompassing large-scale global scales [8], national scales [9], medium-scale regional scales [10], urban scales [11], and, in recent years, small-scale household carbon footprints [12] and individual carbon footprints [13]; second, different categories of EF models, expanding to tourism [14], transportation [15], water resources [16], and trade [17] EFs; third, updates to EF calculation methods, such as the integrated method based on the net consumption of specific regions [18], the component method through field surveys and questionnaires [19], and the input–output method based on net resource consumption [20]; fourth, the relationship between EF models and sustainability [21]. For example, V. Niccolucci et al. three-dimensionalised the EF and proposed the concept of EF depth, focusing on the fairness and sustainability of ecological services [22]. Ruževičius used the ecological footprint as an indicator to reflect the degree of sustainable development [23]. Wei modified EF parameter factors based on net primary productivity (NPP) and calculated the improved EF of the Yellow River Delta in China [24]. Wiedmann and Barrett, based on a review of over 150 EF indicators, found that EF can serve as a primary indicator for sustainable development decision-making [25]. Although there are few sustainability assessments of mountainous-town EFs, some scholars have used the EF to assess the impact of urbanisation on mountain resources [26,27], the sustainability of mountain tourism [28], and the ecological recovery after mountain disasters [29].
Despite numerous studies focusing on the relationship between the ecological footprint (EF) and sustainability—such as the introduction of three-dimensional EF and EF depth and the use of EF as a critical indicator for sustainable development decision-making—most of these studies are confined to single-year analyses and lack the long-term dynamic analysis of ecological footprints. Therefore, building on existing research, this study employs the latest statistical and field survey data and localises EF factors according to the study area [30,31]. By analysing long-term EF data, this study reveals the historical changes in EF and predicts future trends. Additionally, this research integrates the calculation of the ecological and economic coordination index, comprehensively considering both ecological and economic factors. This approach provides a more thorough assessment of regional sustainability, addressing the limitations of traditional EF models in terms of single-dimension analysis and dynamic change studies.
China has the most extensive mountain resources globally, with mountainous areas accounting for 69% of the country’s total land area and being home to over 200 million people [32]. China’s rich mountain resources and complex ecological environment have resulted in numerous mountain towns forming unique ecosystems [33]. Therefore, scientifically assessing the level and capacity of regional sustainable development [34] and enhancing the sustainability of mountain towns have gradually become research hotspots and focal points in China’s urban planning field [35]. The study of sustainable mountain towns is significant for improving urban systems’ resilience, sustainability, and adaptability [36,37].
This paper chooses the typical mountain town of Lushan County as the research object, which is of great significance and representativeness. (1) As a typical mountain town, Lushan County has a fragile ecological environment, is vulnerable to interference and damage from the external environment, and urgently needs scientific sustainable development assessment and protection strategies. (2) The 2023 Lushan county Government Work Report highlights the need for Lushan to deepen its green development practices; strengthen ecological protection; and focus on the integrated protection and systematic management of mountains, rivers, forests, farmlands, lakes, and grasslands [38]. It puts forward the need for Lushan County to green the policy direction of the development of Lushan County, emphasising ecological protection and systematic governance, which provides a realistic basis and policy support for this study. (3) Lushan County has apparent advantages in natural resources. However, its degree of resource development and utilisation is not high. It possesses universal mountainous ecological environment characteristics and development dilemmas, and its research results can provide reference and guidance for other similar regions in China, with extensive application value and promotion significance. Therefore, this paper assesses the sustainable development of Lushan County by evaluating the indicators of ecological pressure and the ecological and economic coordination index and proposes a strategy for the future sustainable development of Lushan County to provide a scientific basis and policy recommendations for realising the ecologically sustainable development of mountainous towns and cities represented by Lushan County. The first part of the study analyses the background and objectives of the study; the second part introduces the study area and data sources and constructs an EF evaluation method applicable to mountain towns; the third part provides a detailed analysis of the changes in EF and sustainability indexes in Lushan County from 2009 to 2022; the fourth part discusses the results of the study, points out the limitations of the study, and looks forward to future research directions; Part V summarises the main findings of the study and presents policy recommendations to promote the sustainable development of mountain towns.
The main research objectives of this paper include the following three aspects: (1) Improving traditional EF calculation methods by establishing a mountain EF calculation model better to accommodate the complexity and fragility of mountain ecological environments. (2) Using factors such as ecological pressure, ecological footprint, and eco-economic coordination degree to develop a comprehensive sustainability evaluation model that more thoroughly assesses the sustainability level of mountain towns. (3) Based on the EF research results of Lushan County from 2009 to 2022, the future EF development trend in Lushan County will be predicted, and strategies for future EF improvement will be proposed. It aims to provide references for future ecological protection decision-making.

2. Materials and Methods
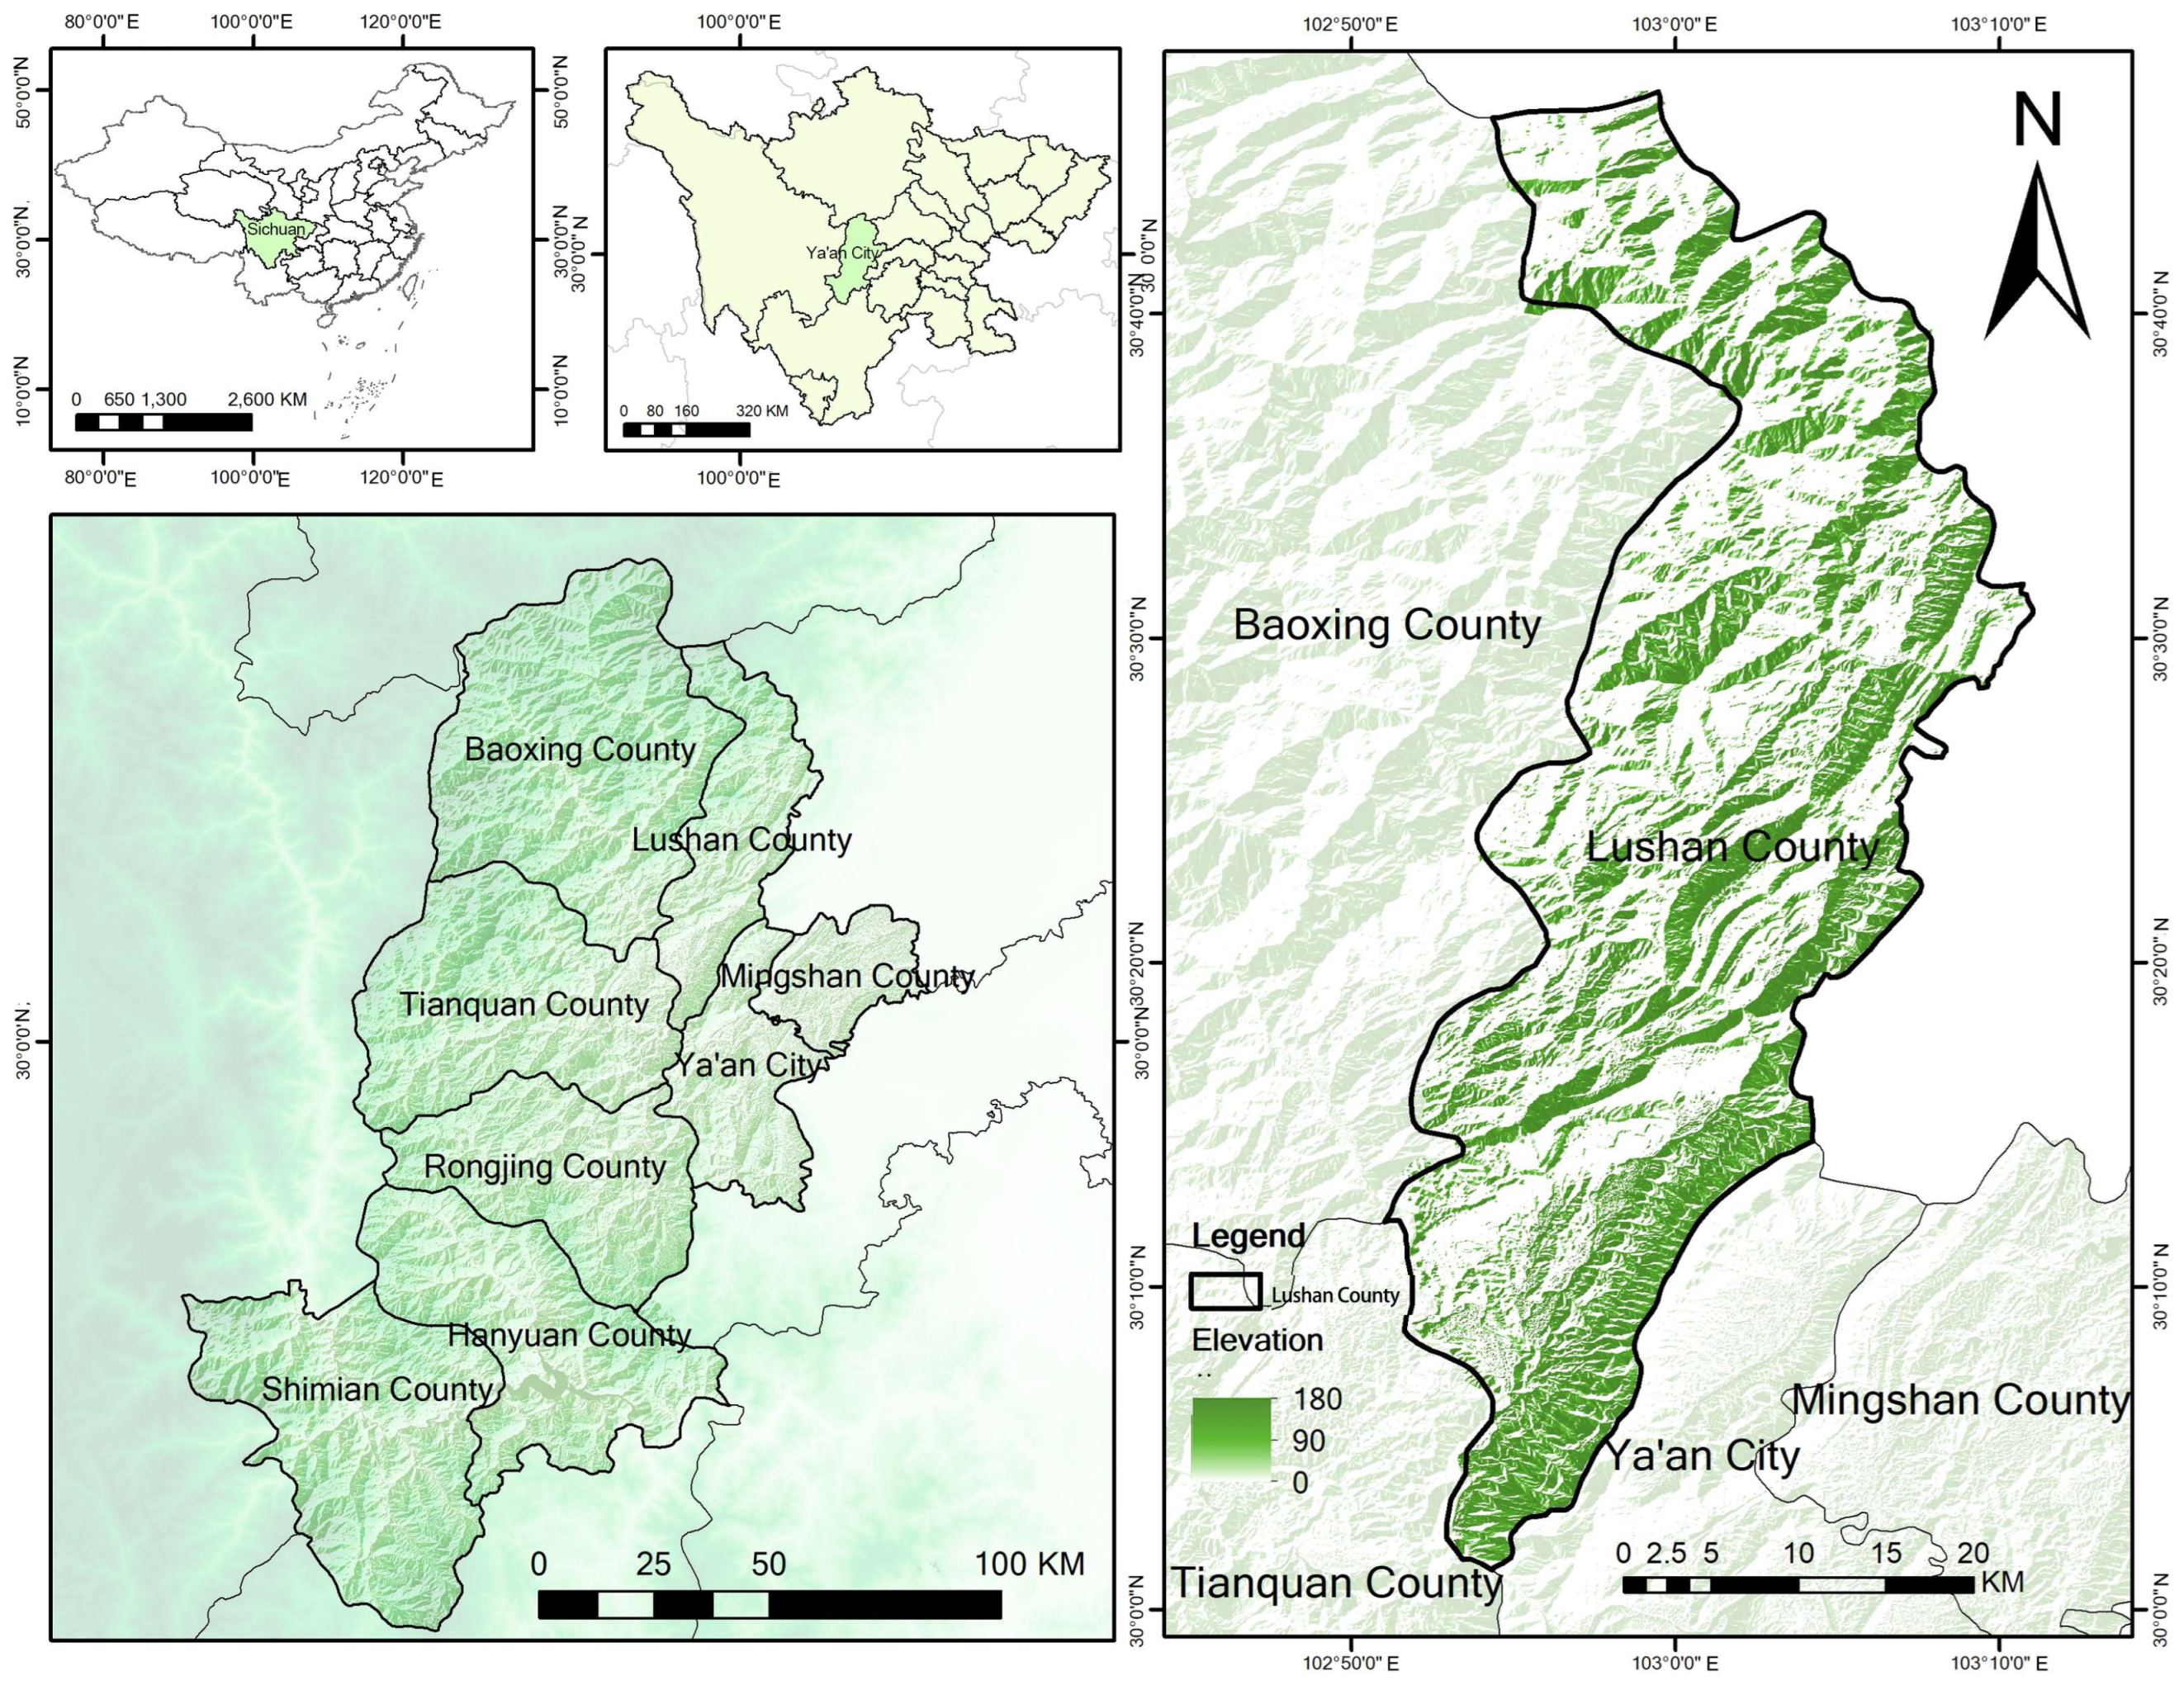
2.1. Study Area

Lushan County is located in Ya’an City, Sichuan Province, China, with geographic coordinates of 102.92 degrees east longitude and 30.15 degrees north latitude. It is situated on the western side of the Sichuan Basin and in the northeastern part of Ya’an City, covering a total area of 1166 km2 (Figure 1). Lushan County is a typical mountain town with an excellent ecological environment, complex terrain, abundant water systems, significant land development potential, and rich natural resources. The county features a wide distribution of high, medium, and low mountains as well as river valleys and terraces. The middle mountain zone accounts for about 73% of the total area, while the high mountain and low mountain zones and flat plains account for about 27% (Figure 1). The overall terrain of Lushan County slopes from high in the north to low in the south, with a mountainous landscape inclining from northwest to southeast, creating a diverse and dynamic topography. The northern and eastern parts of the county consist of high to middle mountainous areas with deep valleys and steep slopes, averaging over 2000 m in elevation and covering more than 90% of the county’s total area. The southern part has an open terrain, with an average elevation below 1000 m, characterised as a low mountain and river valley area, covering about 80 km2 with a relative height difference of 4743 m [39]. The region has abundant hydropower resources, with water resource development reaching 82.8% [40]. In recent years, Lushan County, relying on good ecological environment and rich water bodies, according to local conditions, has vigorously developed its aquaculture industry.
Lushan County has a forest area of 90,872.22 ha, with a standing timber volume of 8.6064 million cubic metres and a bamboo forest area of 6488.2 ha. The county’s forest coverage rate is 76.76%, and the green coverage rate of timber forests is 84.03% [40]. Lushan County, located on the basin’s western edge, enjoys favourable water and heat conditions, fostering abundant plant resources. As of the end of 2017, the county had approximately 8403.88 ha of cropland and had completed the permanent basic cropland delineation plan, ensuring that the county’s cropland retention area is 7000 ha, with an essential cropland protection area of 5800 ha. By the end of 2023, the total population of Lushan County consisted of 44,698 households, amounting to 116,398 people, with a diverse population and numerous ethnic groups. In 2023, Lushan County achieved a Gross Domestic Product (GDP) of CNY 6.83 billion, representing a 5.3% increase from the previous year based on comparable prices. The contributions of the three industrial sectors to economic growth were 19.3%, 25.6%, and 55.1%, respectively, with an industrial structure ratio of 20.7:32.9:46.4 [41].

2.2. Data

The data used in this paper are diverse, including sources such as the Ya’an Statistical Yearbook of China, field surveys in Lushan, and data from the Lushan government website. The specific sources of the data are detailed in Table 1. When data for specific years were missing, interpolation functions were used to fill the gaps. Land use data were sourced from Yang et al.’s research [42].

2.3. Methods

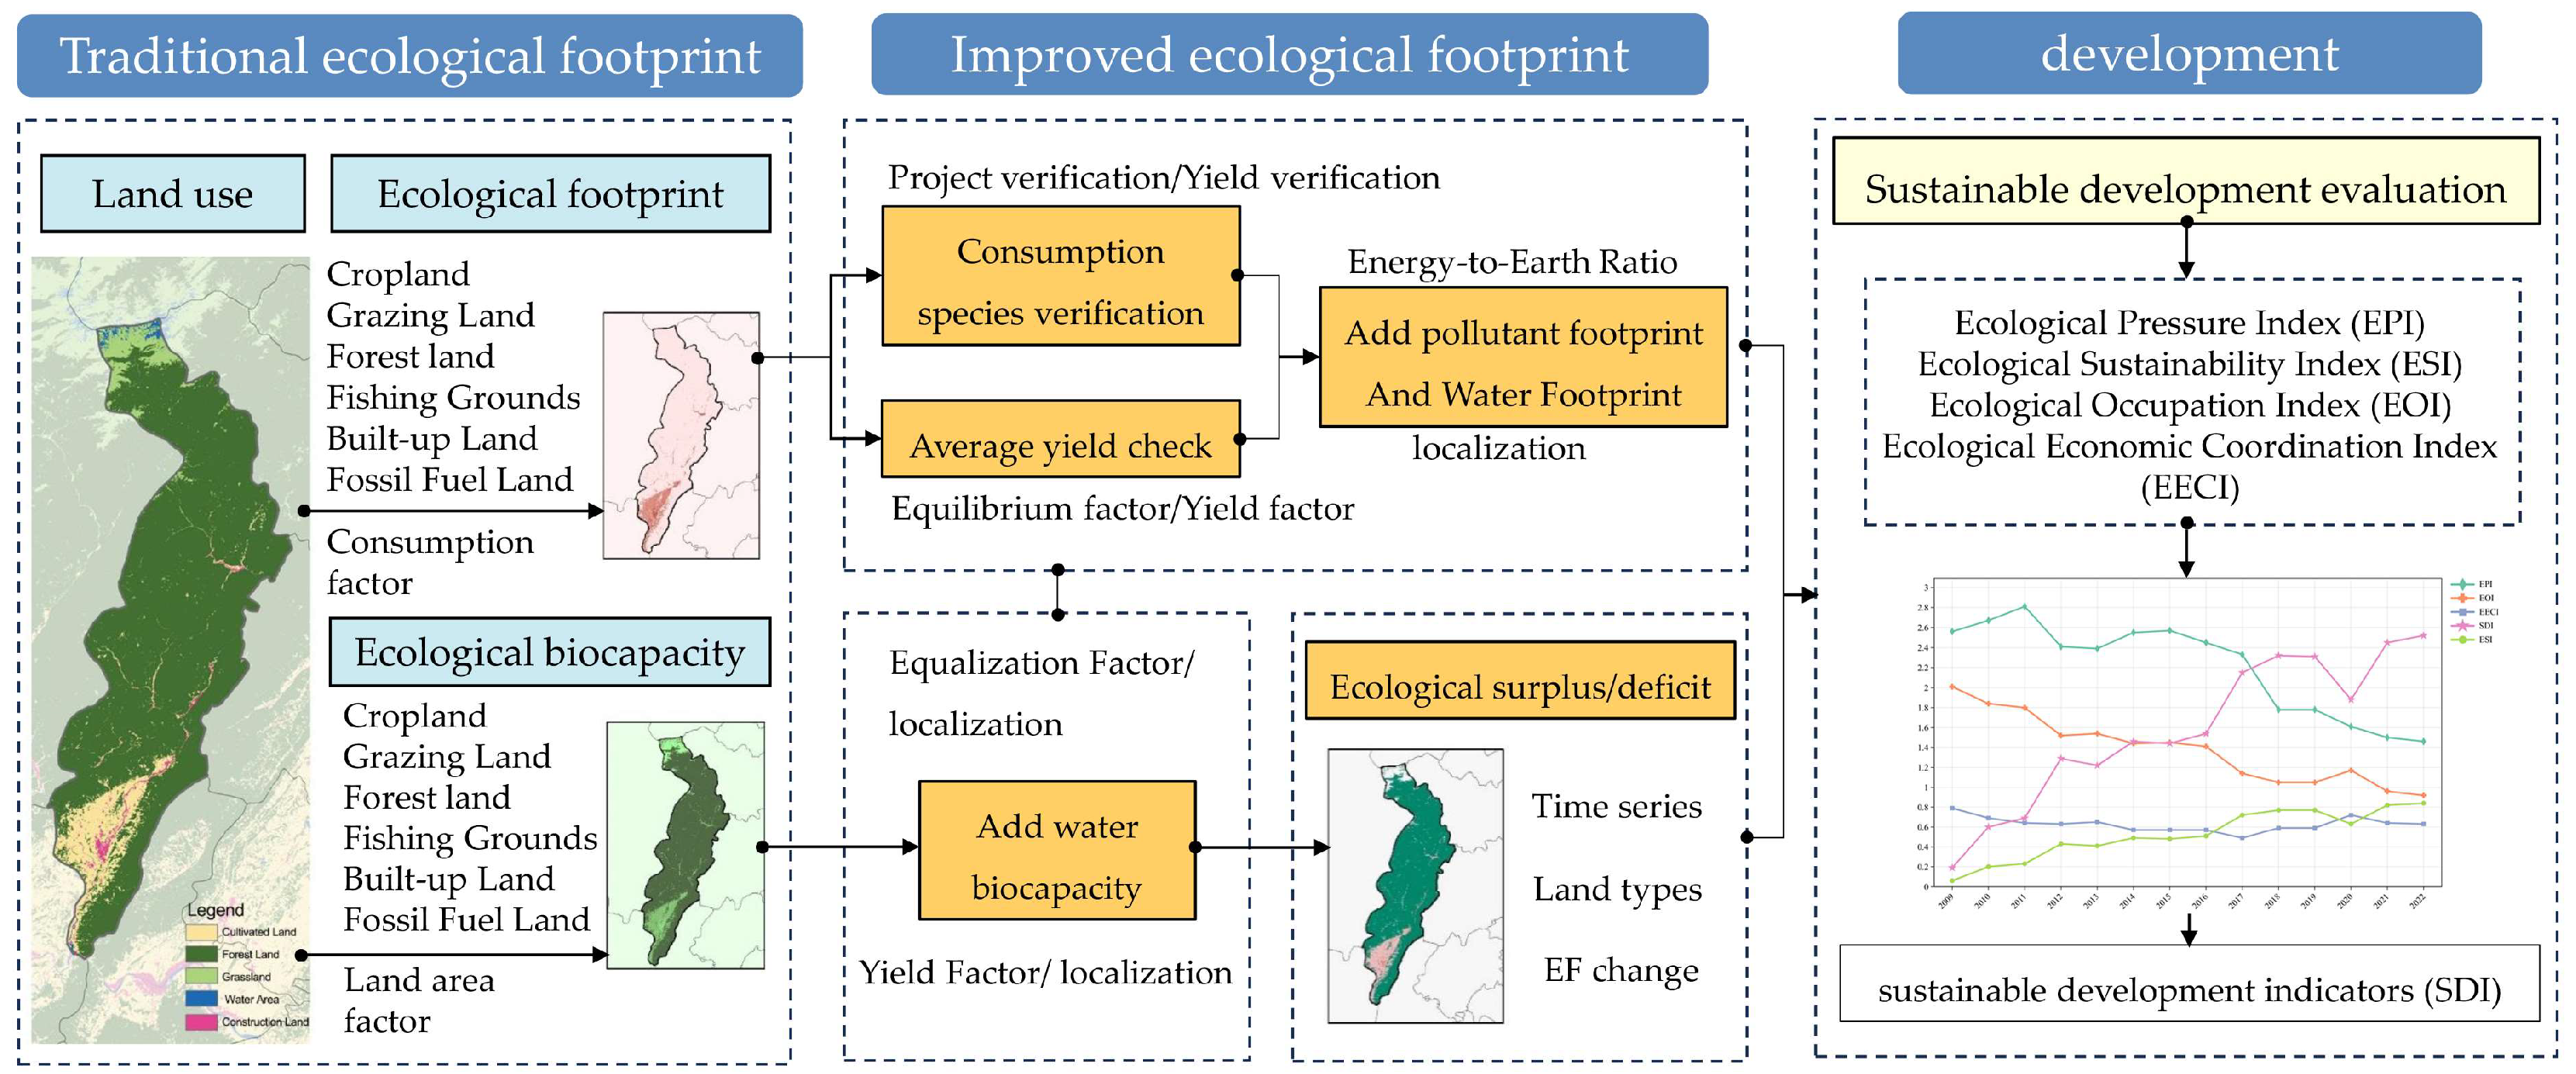
2.3.1. Traditional EF Model

Traditional EF models, developed by William E. Rees [7] and M. Wackernagel [43], calculate the resource consumption and biological productive area required to sustain a specific population and economic scale based on the consumption of particular ecological goods and resources [44]. EF models quantify the net consumption of various items within a region under mutually exclusive land space and allocate consumption types to different categories of biologically productive land. Each biologically productive land area is then multiplied by its respective equivalence factor to convert it into an area with equivalent productivity, and these areas are summed up. The biologically productive land is broadly categorised into the following six types (Table 2).
The calculation formula of EF is as follows:
EF = i = 1 n Ci · Eei Egi
where the following definitions apply:
Ci stands for resource consumption;
Eei stands for the equilibrium factor;
Eqi represents the global average (including cropland, grazing land, forest land, fishing ground, built-up land, and fossil fuel land).
The equivalence factor represents the number of global hectares contained within one hectare of a specific type of productive land [46]. The specific calculation formula is as follows:
E ei = Pi ¯ P ¯ = Qi Si / Qi Si = k P k i · γ k i Si / i k P k i · Y k i Si
where the following definitions apply:
Eei represents the equivalence factor for the global i type of land (s-nhm2/hm2);
P i ¯ is the average productivity of the global i type of productive land (J/hm2);
P ¯ is the average productivity of all types of productive land globally (J/hm2);
Qi is the biological product output of the global i type of land (J);
Si is the biological production area of the global i type of land (hm2);
P k i is the output of the k biological product on the i type of land (kg);
Y k i is the unit calorific value of the k biological product on the i type of land (J/kg).
Due to productivity differences in different regions and environments, even the same type of biologically productive land can have varying productivity under different regional contexts. Therefore, they cannot be directly compared and must use yield factors as conversion coefficients [18], selecting the productivity of a specific range as a standard measure.
The yield factor is the ratio of the average productivity of biologically productive land in a given region to that of the same type of biologically productive land worldwide [47]. It comprehensively reflects the environmental and socio-economic factors of the region. The yield factor has no units, and its specific calculation formula is as follows:
Y F i j = P i j ¯ P i ¯ = Q i j S i j / Q i S i = k P k i γ k i S i k P k i Y k i S i
where the following definitions apply:
Y F i j is the yield factor for the i type of land globally;
P ¯ i j is the average productivity of the i type of land in a given region (J/hm2);
P i ¯ is the average productivity of the i type of land globally (J/hm2);
Q i j is the total biological output of the i type of land in a given region (J);
S i j is the biological production area of the i type of land in a given region (hm2);
P k i is the output of the k biological product on the i type of land (kg);
Y k i is the unit calorific value of the k biological product on the i type of land (J/kg).
Biocapacity represents the maximum population a specific region can sustain without disrupting its ecological environment’s normal development. WCED (World Commission on Environment and Development) research suggests that 12% should be deducted from biocapacity to guarantee sustainable development. The biocapacity calculation formula is as follows:
EC = i = 1 n ( A i EeF i YF i ) · ( 1 12 % )
where the following definitions apply:
EC stands for ecological carrying capacity (hm2);
Ai represents the area of the class i ecosystem;
EeFi represents the equilibrium factor;
YFi represents the yield factor.
The difference between the supply from natural ecosystems and the consumption by the human economic system can indicate the ecological environment’s sustainability. This disparity is denoted as ecological deficit/surplus (abbreviated as ED/ER), and the formula is as follows:
E D / E R = E C E F
where the following definitions apply:
ED stands for the ED.
ER stands for ES.
EC stands for the ecological carrying capacity.
If ED/ER > 0, this indicates an ES. When ED/ER < 0, an ED occurs.
As a measure of the resource consumption and land area required to sustain a specific population and economic scale, the EF can intuitively reflect the impact of the population on environmental resources and assesses the degree of regional ecological sustainability. However, traditional EF models still have some limitations in practical application [48], which are mainly reflected in the following three aspects:
Outdated Data: The data used in traditional EF calculations are based on the 1993 WWF (World Wildlife Fund) Living Planet Report and FAOSTAT (Food and Agriculture Organization of the United Nations Statistical Database). Due to the broad scope of the study subjects, to cover the consumption items of most countries, some detailed types of items were ignored. For instance, legumes were classified only as soybeans. The data from 1993 are now 31 years old, and the average yield of various productive lands has significantly changed under the influence of different environments and technologies. Continuing to use global data is impractical, especially for the small-scale calculations of mountainous towns like Lushan County.
Simplified Land Functions: In the six land types considered in the ecological model, the consideration of land is overly simplistic. Calculations only focus on the area and single function of ecologically productive land without considering the composite functions and quality of the land in mountainous towns. For example, “fishing ground” only considers their function in fishery or aquaculture, while in mountainous towns with limited land water resources, fishing ground may also be used for wastewater disposal, transportation, and other functions. The ecological impact of environmental pollution factors on mountainous towns has not been considered.
Simplistic Calculation Factors: In EF calculations, different types of productive land are converted using equivalence factors, focusing on the EF calculation in a time series but neglecting the impact of temporal changes and spatial variability on conversion factors. In reality, equivalence factors and yield factors also change with time series and mountainous geographical environments.
Based on the above analysis, this paper proposes an improved EF model to address the issues of outdated data, single functions, and superficial factors in the original model. The improvements include updating the original data, expanding land functions, incorporating pollutant footprints, localising factors, and adding temporal continuity to construct the EF model (Figure 2). The EF for each year is calculated, and the sustainable development of Lushan County is further evaluated, making the evaluation scope more widespread, the evaluation subjects more accurate, and the resource allocation more reasonable.

2.3.2. EF Calculation

Regarding the issue of the single consideration of land functions in the original model, given the ecological fragility characteristics of the mountainous environment, which is highly susceptible to environmental pollution, this paper incorporates pollutant factors into the EF model. The EF is calculated by expanding the original EF to include water pollution, air pollution, and solid waste pollution, combined with the ecological characteristics and data of Lushan County. The calculation formula is as follows:
E F n = R C P C E Q i
where the following definitions apply:
EFn is the EF of pollutants (hm2);
RC is the respective emissions of various pollutants (t);
PC is the pollution absorption capacity of various types of land (water area, cultivated land, forest land);
EQi is the equilibrium factor.
Based on the water EF model by Alessandro Galli et al. [30], considering the multifunctionality of the fishing ground in mountainous towns, fishing ground purification and absorption effects on pollutants are expanded. Taking into account the characteristics of pollutants and water resources in Lushan County, the calculation formula is as follows:
EFw = N · efwp = W P × γ w
where the following definitions apply:
EFw refers to the EF of water resources (hm2);
N refers to population;
efwp refers to the EF of water resources per capita (hm2cap−1);
γw refers to the global equilibrium factor of water resources;
W refers to the amount of water resources consumed (m3). P refers to the average global water production capacity (m3/hm2).

2.3.3. Biocapacity Calculation

For the ecological environment of mountainous towns, water resources play a specific ecological role, such as groundwater resources for waste absorption and the overall ecological regulation of water resources [49]. In calculating the carrying capacity of ecologically productive land, Wackernagel only considered the aquaculture area for fishing grounds, ignoring the ecological carrying capacity of the water resources. Therefore, in calculating biocapacity, this paper references Huang Linnan’s calculation of the water resources’ EF and considers the restorative role of water resources in the ecological and economic systems, incorporating water resources’ biocapacity into the biocapacity calculation to refine EF theory further. Related research indicates that to maintain the sustainable development of regional water resources and keep the ecosystem healthy, utilising water resources in regional development should ideally not exceed 40% of the total amount. Based on this consideration, the calculation formula for water resources carrying capacity is as follows:
ECw = N × ecwp = 0.4 × w × r × T P
where the following definitions apply:
ECw represents the water resource carrying capacity (hm2);
N denotes the population;
ecwp signifies the per capita water resource carrying capacity (hm2cap−1);
r represents the water resource equilibrium factor;
w indicates the water resource yield factor;
T is the total water resource amount (m3);
P signifies the global average water resource production capacity (m3hm−2).

2.3.4. Factor Calculation

Given the unique ecological attributes of mountain towns and the specific circumstances of Lushan County, this study has adapted the EF model to local conditions. The adaptation involves using the provincial hectare method to adjust the balance factor, the provincial average productivity method to refine the yield factor, and the carbon sink approach to enhance the energy–land ratio. Additionally, including a time series element in the factor calculations addresses the previous model’s lack of consideration for the temporal variations in conversion factors. It ensures a more accurate EF model that faithfully represents the dynamic changes in Lushan County’s EF.
Concerning the energy-to-land energy consumption ratio, this study adopts the method proposed by Liu et al. [31]. It also applies the carbon sink approach to compute the average energy-to-land ratio for China, aiming to improve the universality and precision of the EF model.
The improved EF model is as follows:
EFG = EF + EFn + EFw
ECG = EC + ECw
E D / E R = E C E F
where the following definitions apply:
EFG refers to the improved EF;
EFn refers to the pollutant EF;
EFw refers to the ecological water footprint;
ECG refers to the improved biocapacity;
EC refers to the conventional biocapacity;
ECw refers to the water biocapacity;
ED′ refers to the enhanced ED;
ER′ refers to the improved ES.

2.3.5. Sustainable Development Assessment

Regional sustainable development is assessed using four key indices: the Ecological Pressure Index (EPI), Ecological Sustainability Index (ESI), ecological occupation index (EOI), and ecological and economic coordination index (EECI).
(1) The EPI is determined by the ratio of EF to biocapacity, and the calculation formula is as follows:
EPI = EF EC
(2) The ESI is determined by the ratio of the regional EF to the sum of the regional EF and biocapacity. Its formula is as follows:
ESI = EC EF + EC
(3) The EOI is calculated as the ratio of the regional EF to the global EF. The formula is as follows (the global per capita EF used in this paper is sourced from the WWF official website):
EOI = EF / E F
(4) The EECI is defined as the ratio of EPI to EOI, with the formula being as follows:
EECI = EOI / EPI
(5) The EPI, EOI, and EECI are chosen to establish sustainable development indicators (SDIs). Among these, the EPI acts as a negative indicator, while the EOI and EECI are positive. These three indicators undergo standardisation, resulting in the calculation formula for the sustainable development index (SDI):
SDI = EPI max EPI EPI max E PI min + EOI max EOI EOI max E OI min + EECI max EECI EECI max E ECI min
Here, max and min represent the maximum and minimum values, respectively. The standards for sustainable development evaluation levels are based on the global EF and biocapacity data provided by the World Wide Fund for Nature (WWF 2004) [50], which established the criteria for sustainable development evaluation levels. The classification levels for the EPI, ESI, EOI, EECI, and SDI are shown in Table 3.

3. Results

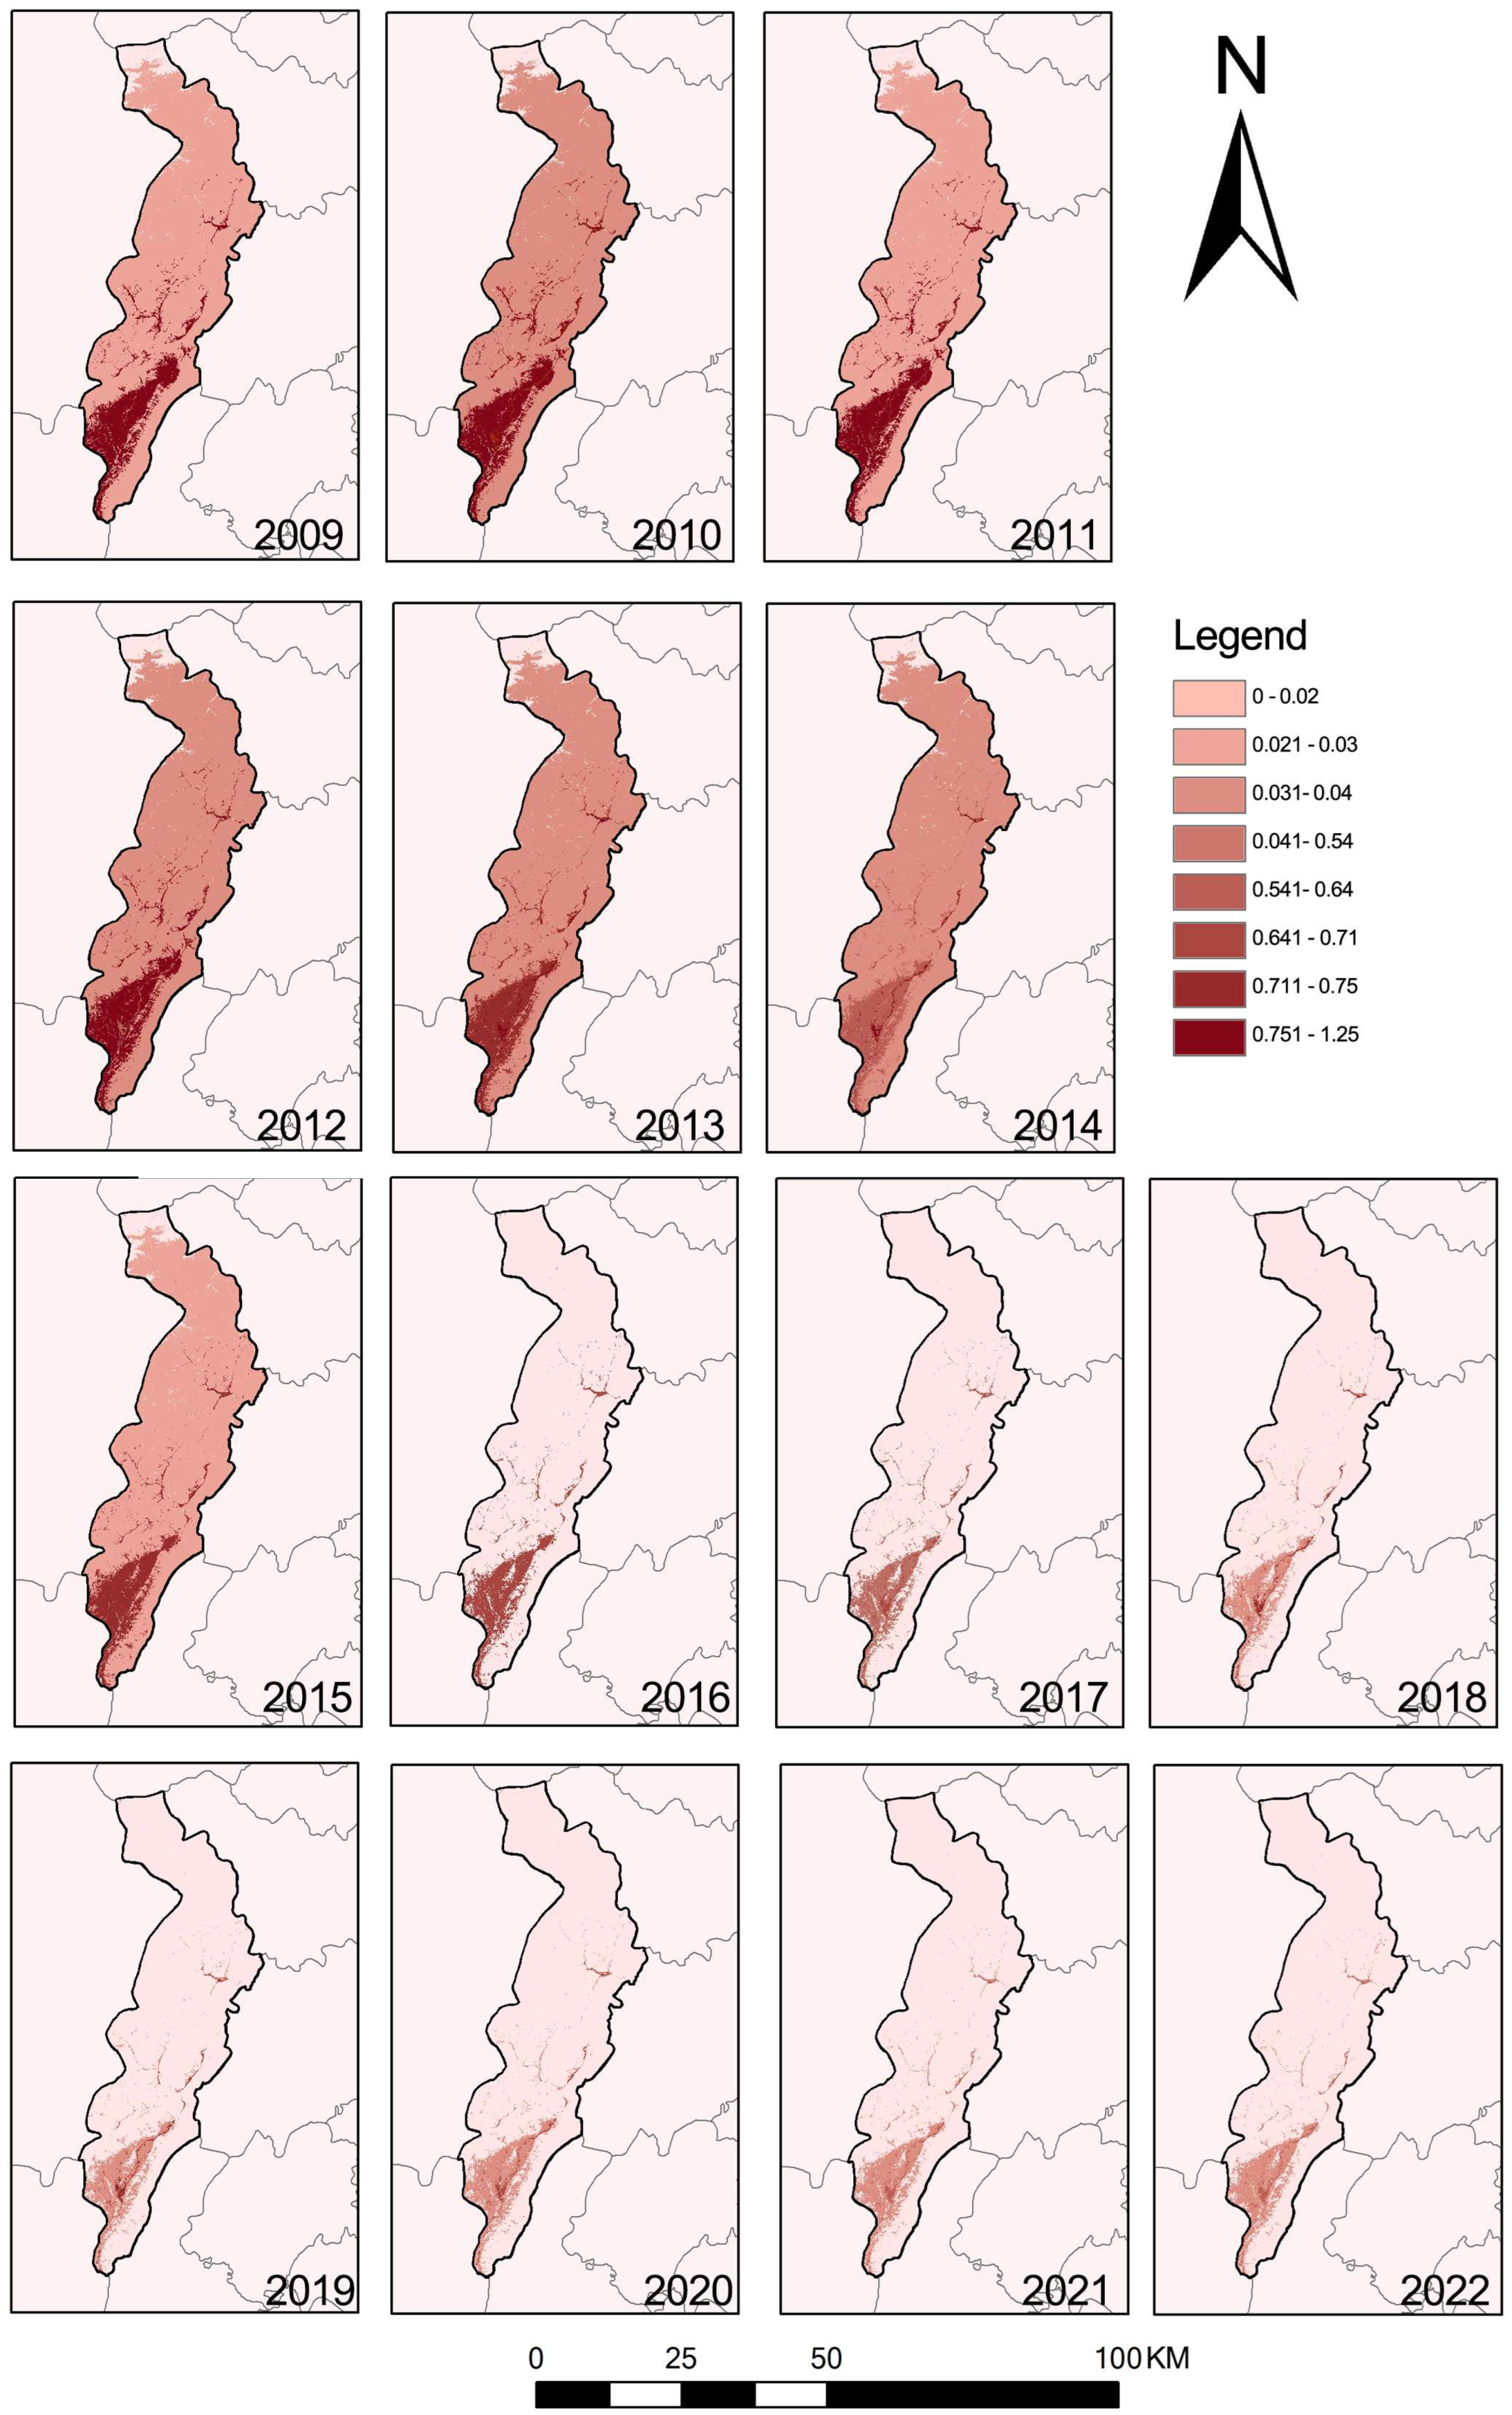
3.1. Per Capita EF Trends

According to the EF calculation model, the annual per capita EF in Lushan County was computed, as shown in Figure 3. Considering that built-up land and fossil fuel land are almost entirely derived from construction land, both built-up land and fossil fuel land are represented as construction land in Figure 3 [51]; these two categories are represented together in Figure 3. In the figure, the depth of the red colour is directly proportional to the size of the EF; the darker the red, the larger the EF, and the lighter the red, the smaller the EF.
As shown in Figure 3, the per capita EF in Lushan County gradually declined between 2009 and 2022, from 1.89 ha/capita in 2009 to 0.99 ha/capita in 2022, an overall decrease of 48%. However, the total EF shows a slight increase in 2011 and 2013. Fishing ground shows the most significant decrease, close to 90 per cent, followed by forest land (85 per cent decrease), grazing land (83 per cent decrease), and cropland (63 per cent decrease). These changes indicate that Lushan County has focused on ecological and environmental protection and pollution control during the past 14 years, thus slowing down the depletion of EF.
Specifically, in Lushan County’s EF, construction land accounts for the largest share, reaching 58%. This indicates that the primary source of EF in Lushan County is construction land, mainly due to the energy consumption (including coal, natural gas, liquefied petroleum gas, oil, and electricity) associated with it. Changes in EF are positively correlated with the human consumption of ecological products and damage to the ecological environment. Ya’an City Statistical Yearbook shows that aquatic product consumption in Lushan County decreased from 4260 tonnes in 2009 to 1588 tonnes in 2022, a decrease of nearly 60%, which may lead to a decrease in fishing ground EF. Meanwhile, meat consumption decreased by 44% from 10,657 tonnes in 2009 to 6000 tonnes in 2022. This indicates that the dietary structure of Lushan County residents has changed in recent years, with a decrease in meat production and consumption, leading to a decrease in per capita EF for grazing land.

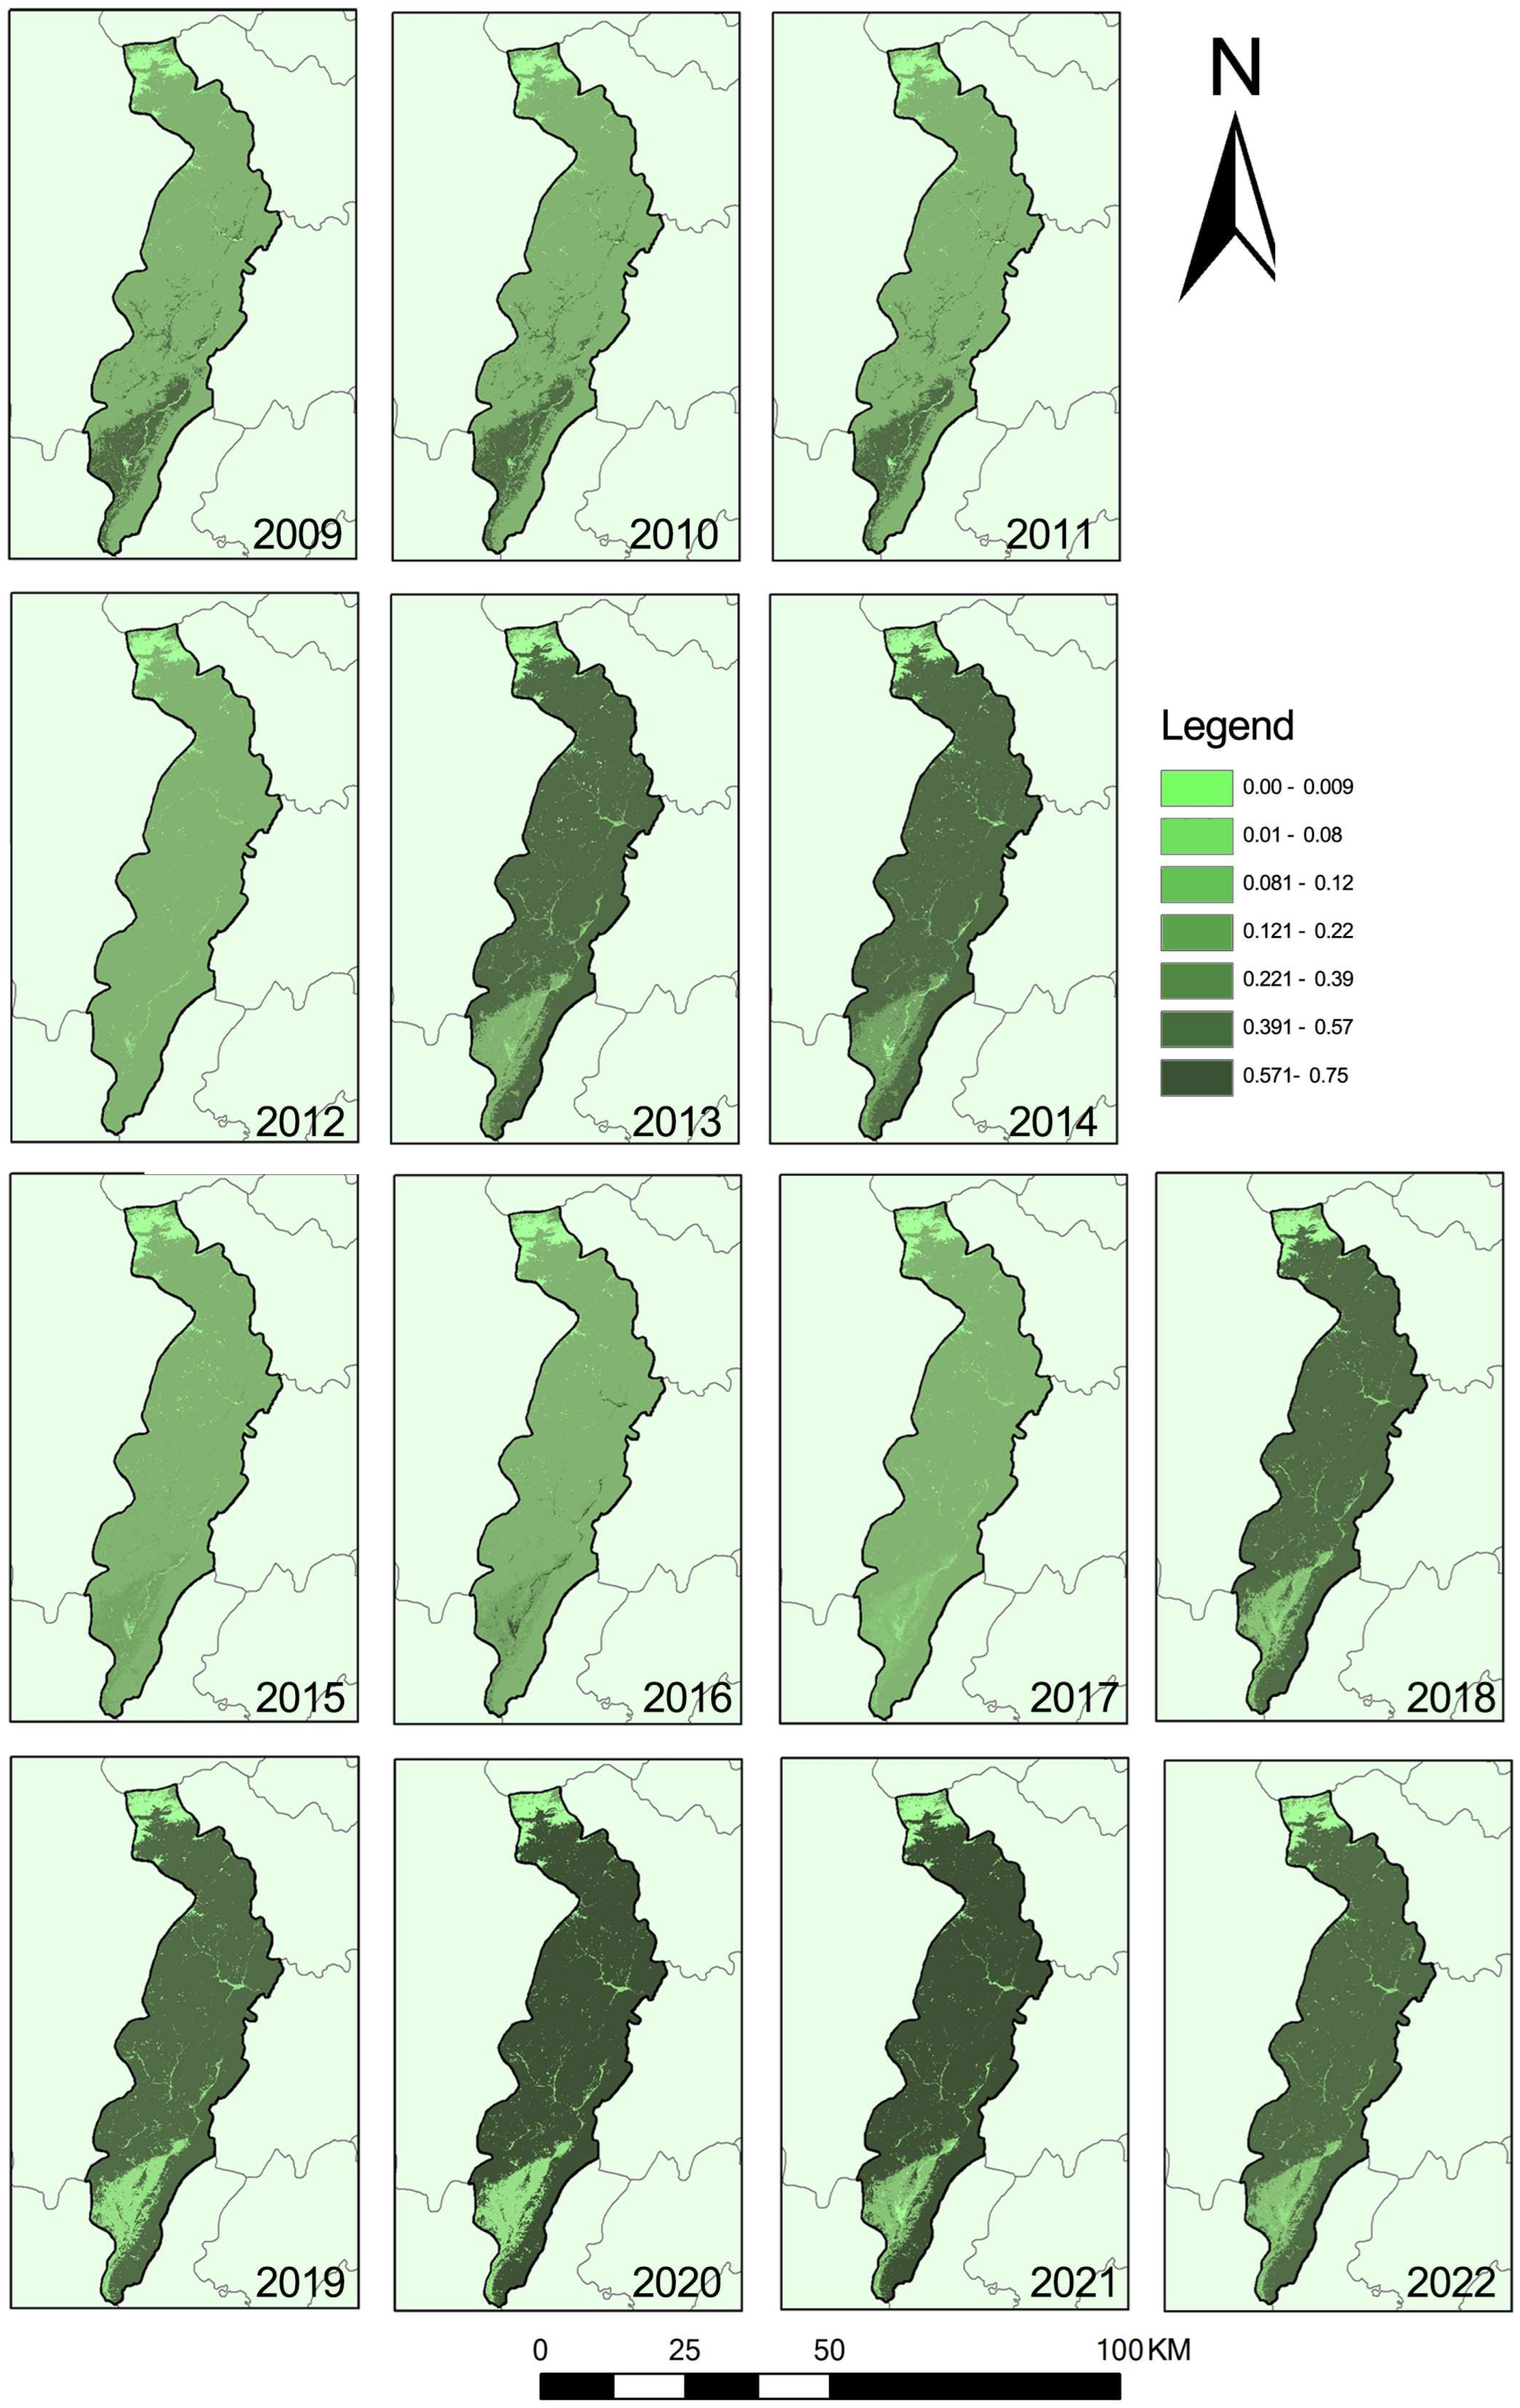
3.2. Per Capita Biocapacity Trends

The EF calculation model determined the per capita biocapacity in Lushan County each year (Figure 3). Considering that the ecological carrying capacity of fossil fuel land is derived from forest land [43], Figure 4 represents forest land and fossil fuel land together. In the figure, the depth of the green colour is directly proportional to the size of the EF; the darker the green, the larger the EF, and the lighter the green, the smaller the EF.
As can be seen from Figure 4, the ecological carrying capacity (biocapacity) per capita in Lushan County showed a small fluctuation change between 2009 and 2022, with an overall decrease of 9% from 0.73 hm2/capita in 2009 to 0.68 hm2/capita in 2022, which indicates that the ecological carrying capacity of the land is shrinking. Among the various types of land, forest land has the most significant ecological carrying capacity, accounting for 40 per cent of the total ecological carrying capacity. Although there was a slight decrease between 2015 and 2017, forest land’s biological carrying capacity increased significantly, by almost five times. In contrast, livestock and agricultural land’s biological carrying capacity decreased by 15 per cent and 78 per cent, respectively. Combined with the data from the Ya’an Statistical Yearbook, although the land area of grazing land hardly changed much (increased by 1%), the production of livestock products such as beef decreased by nearly 40%, indicating the deterioration in the quality of the grazing land. The area of cropland decreased by 47%, which indicates that the destruction of agricultural land in Lushan County in recent years was serious, leading to a decrease in the area of sowing and a substantial decline in agricultural products, which brought about a decline in the ecological carrying capacity.

3.3. ED/ES Dynamics per Capita

Using the EF calculation model, the annual per capita biocapacity in Lushan County was determined, as shown in Figure 5. In Figure 5, red represents an ED, while green represents an ES. The depth of the colour is directly proportional to the size of the EF or deficit; the darker the green, the larger the ES, and the lighter the green, the smaller the ES. The same applies to the EF, with darker red indicating a more significant deficit and lighter red indicating a smaller deficit.
From Figure 5, it can be seen that Lushan County’s EF is significantly greater than its biocapacity. Between 2009 and 2022, Lushan County was consistently in an ED state. The deficit decreased from −1.15 hectares per person in 2009 to −0.31 hectares per person in 2022, a reduction of 73%. This indicates that although the county is still in an ED state, the deficit is gradually decreasing, and the ecological environment is progressively recovering. Among the various land use types, forest land has been in an ES state since 2013, with the ES gradually increasing, indicating a high level of sustainability and a well-maintained ecological environment for forest land. However, all other land types remain in an ED state.

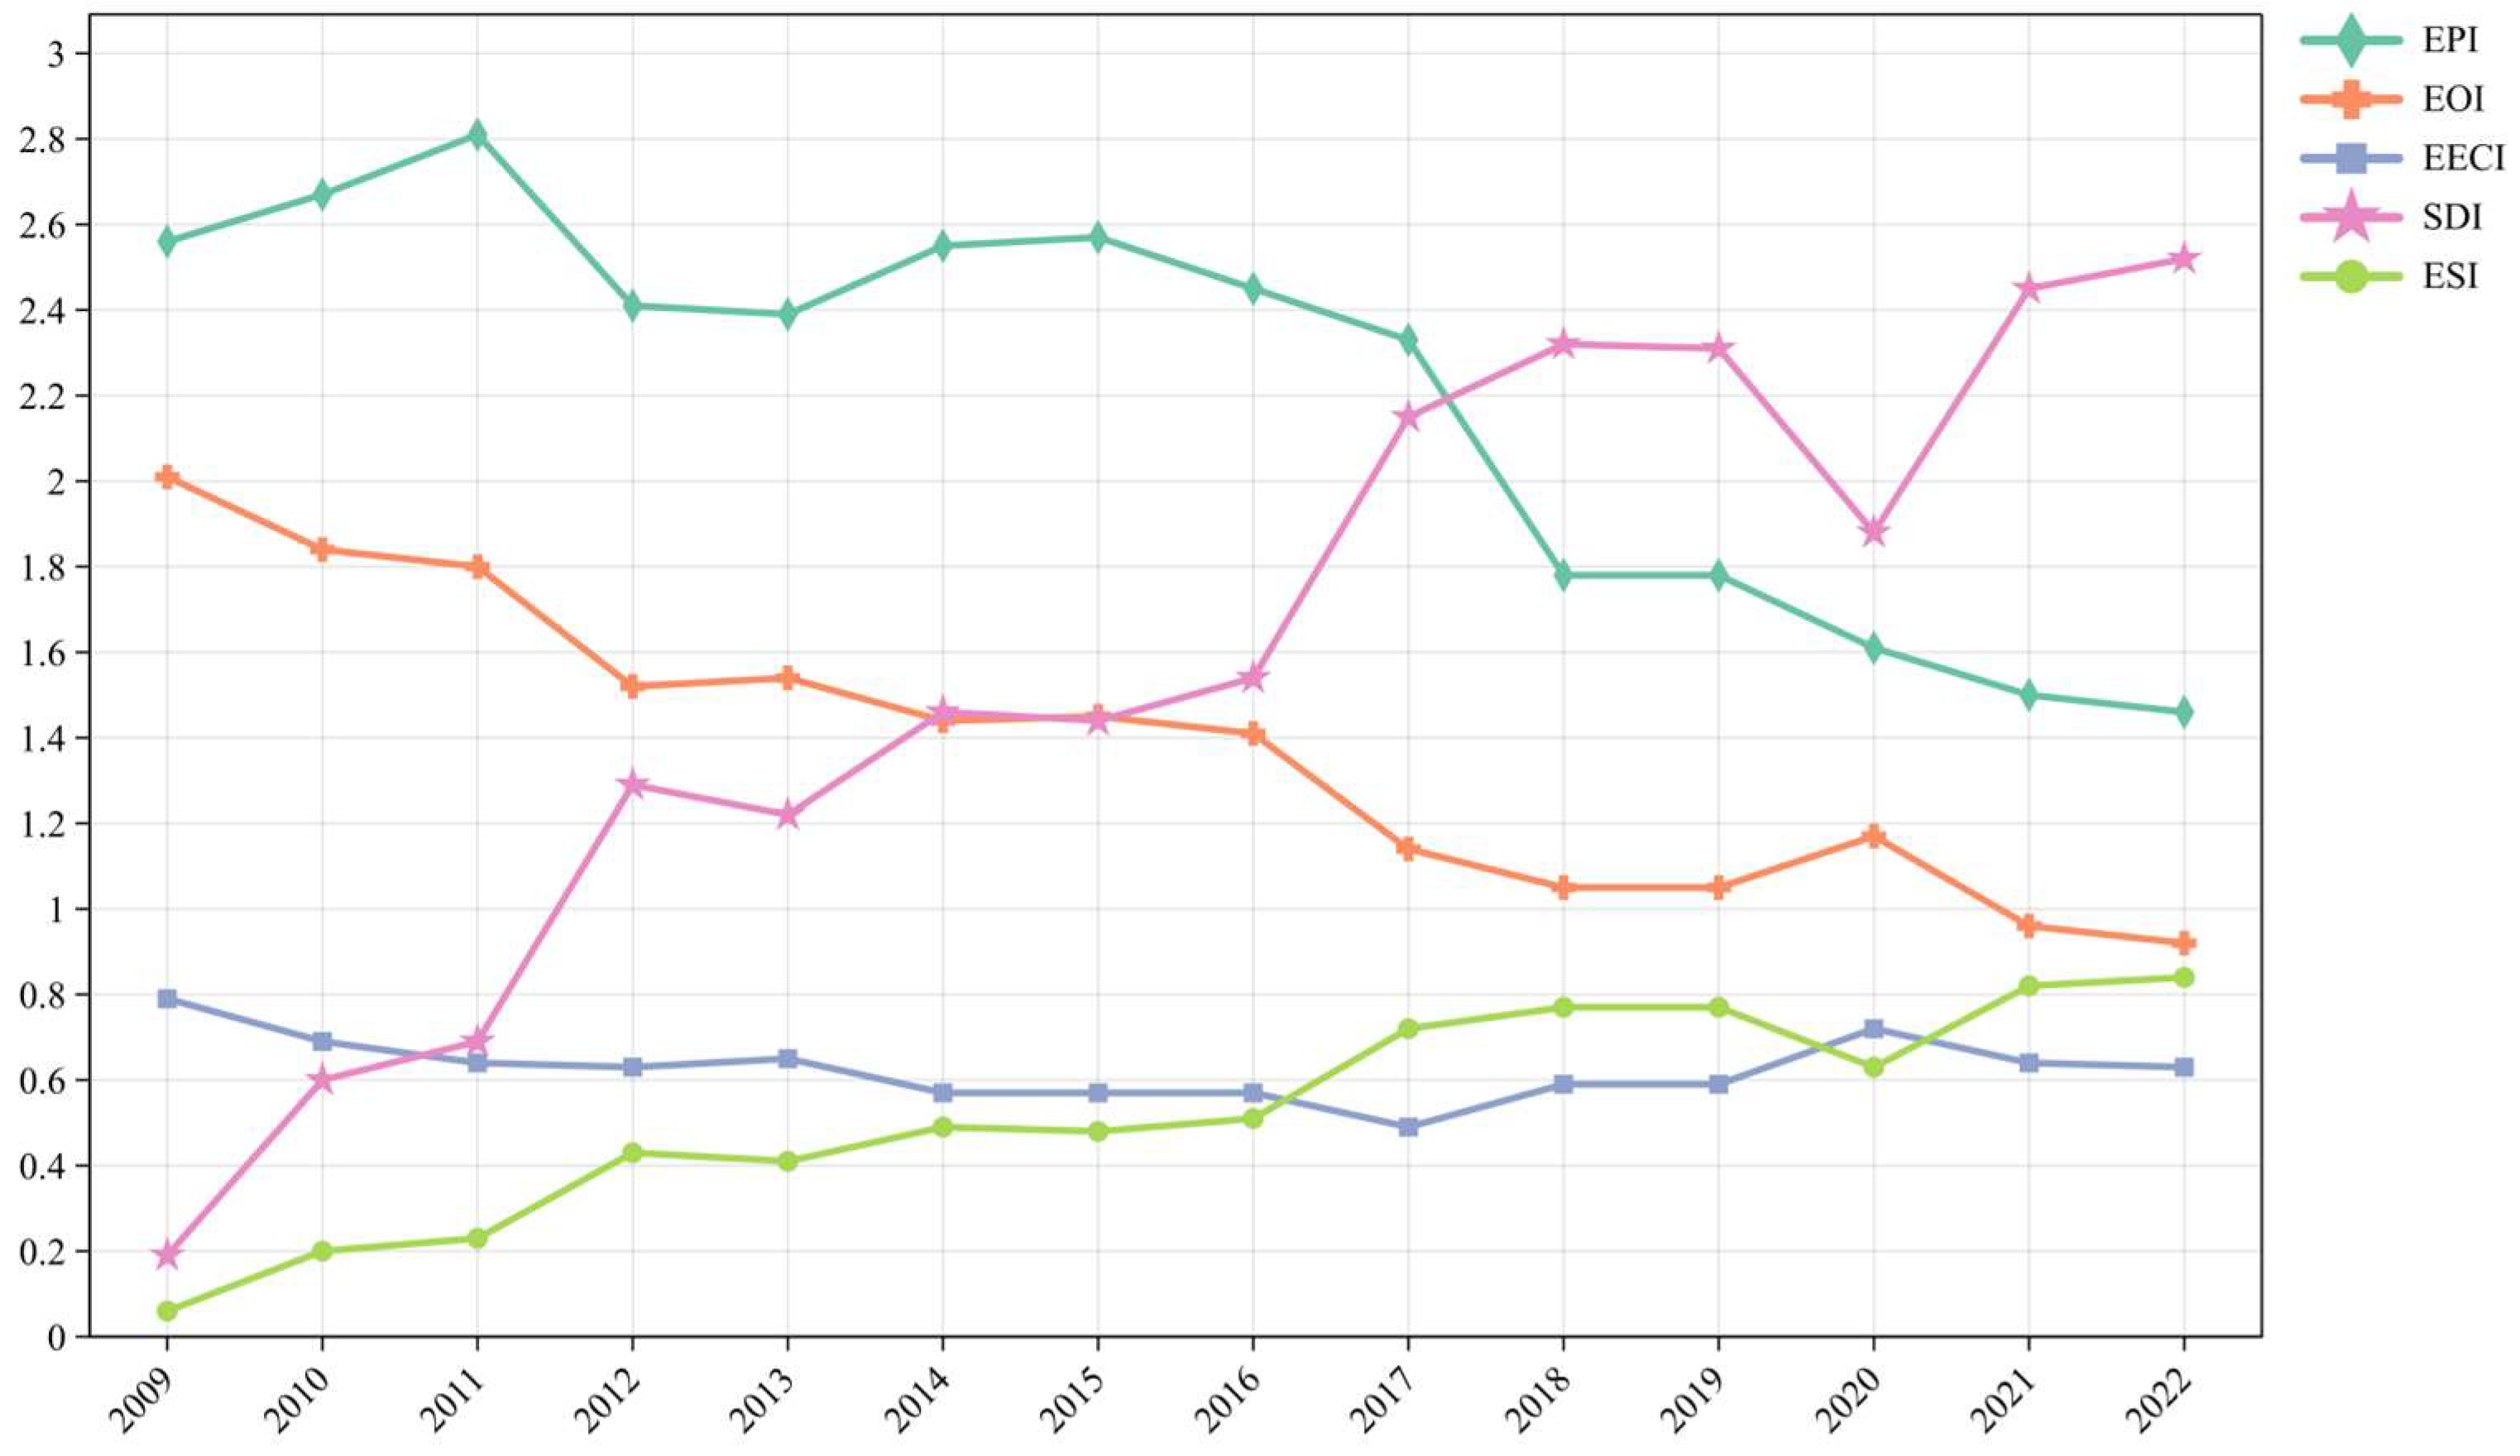
3.4. Sustainable Development Assessment in Lushan County

The calculated results for Lushan County are shown in Table 4 and Figure 6:
Overall, Lushan County is currently in a relatively sustainable ecological state. Although the EPI remains highly insecure, it has decreased by 38% in recent years, indicating that ecological pressure is gradually easing. The EOI was in a relatively affluent state before 2020, but since 2021, it has deteriorated to a relatively poor state, reflecting that Lushan County’s EF is worse than the global average. The overall EOI has shown a downward trend of 50%, indicating a worsening trend requiring a further reduction in EF and ecological occupation. The ESI has increased by 37%, shifting from a strongly unsustainable state to a strongly sustainable state, indicating an improvement in the ecological sustainability of Lushan County. However, the EECI has consistently been in a poor state, decreasing from 0.79 to 0.63, a reduction of 20%. This indicates poor coordination between economic development and the ecological environment in Lushan County, with continued deterioration. It suggests that the excessive use of ecological resources has led to an imbalance between ecology and economy, necessitating greater emphasis on the coordination between ecological protection and economic development. Since 2016, Lushan County’s ESI has gradually increased, demonstrating strong sustainability. The SDI of Lushan County has improved from a poor sustainability state to an excellent one, indicating initial success in sustainable development. However, the county still faces significant ecological pressure and issues with ecological–economic coordination.

4. Discussion

4.1. Improvements in the EF Method for Mountainous Cities

To accurately measure the sustainability of mountain towns, this paper constructs a sustainable development model that combines the EPI and EECI to assess the sustainable development level of mountain towns. In commonly used EF models, the equivalence factors, yield factors, and energy–land ratios are mainly derived from Wackernagel’s global factors, with average productivity based on the global average land productivity. These macro factors and models are more suitable for international-level EF analysis but can introduce certain biases when analysing smaller-scale city or county levels. Different countries have significant variations in natural geographic conditions and socio-economic development levels [52], not to mention the ecological environments of mountain towns. Therefore, globally unified equivalence factors, yield factors, and energy–land ratios are unsuitable for EF calculations in small, complex terrain regions (provinces, cities, and counties).
Considering the uniqueness of mountain towns, this paper employs methods such as updating original data, expanding land functions, localising processing factors, and ensuring temporal continuity. The latest yearbook data are used to update existing EF data, ensuring the timeliness and accuracy of the data. In addition to traditional land functions, pollution treatment and water resource absorption functions are included to account for the ecological pressure of mountain towns comprehensively. Key factors such as equivalence factors, yield factors, and energy–land ratios are localised for China [33]. The provincial hectare method is used to improve equivalence factors, the national average productivity method to improve yield factors, and the carbon sink method to calculate the energy–land ratio, constructing localised EF factors. Time series and spatial distribution are incorporated into EF calculations, fully considering time series using different equivalence factors and yield factors annually to calculate EF accurately. It ultimately generates the mountain town EF model.
Compared to other EF models [53], the mountain town EF model constructed in this paper provides a more accurate measure of the sustainable development level of mountain towns and offers a scientific basis for ecological environment management in mountain towns. By comprehensively considering ecological pressure and ecological economic coordination, this improved model provides a more comprehensive and detailed method for evaluating the sustainable development of mountain towns.

4.2. Future Trends in EF Development

From 2009 to 2022, Lushan County’s EF showed a gradual decline. Although the per capita EF has decreased by 48%, the decline in biocapacity has resulted in Lushan County remaining in an ED state, facing significant ecological pressure. In the future, with the further deepening of ecological protection measures, it is expected that the EF will continue to decline, and the gap between EF and biocapacity will further narrow. Secondly, regarding changes in land use types, the EF of fishing ground and cropland has decreased the fastest, reflecting Lushan County’s effectiveness in water resource management and protection. However, the EF of cropland still accounts for a large proportion, indicating that ecological protection efforts should prioritise the restoration of degraded farmland. There is considerable room for improvement in managing and optimising agricultural land. Enhancing cropland productivity and promoting sustainable agricultural technologies can further reduce the EF of cropland [54].
Moreover, the biocapacity of forest land has significantly increased, and its EF has gradually decreased, indicating the success of Lushan County’s reforestation and forest land protection policies. Through various projects such as biodiversity conservation, the protection of small population species, and the restoration of essential ecosystems, Lushan County has strengthened the protection and management of forest resources, consolidating forest quality [55]. Over the past decade, Lushan County has consistently adhered to an ecology-first, green, and low-carbon development path, promoting the coordinated development of economic and ecological civilisation construction and ensuring that the county’s air quality, surface water quality, and forest coverage rate have all met 35 environmental standards at a 100% compliance rate [56]. In 2022, the provincial government named Lushan County a “Provincial Ecological County” [57]. The significant proportion of the EF from fossil fuel land suggests that Lushan County needs to intensify efforts to optimise its energy structure and promote the use of renewable energy. Since 2018, Lushan County has gradually advanced coal reduction efforts, closing coal mines and increasingly focusing on environmental protection to reduce reliance on traditional fossil fuels [58]. However, the decrease in the biocapacity of built-up land and grazing land shows that the land in Lushan County is gradually being degraded, putting the ecosystem in an unsustainable state and potentially leading to insufficient biocapacity. The overall decline in per capita biocapacity in Lushan County is closely related to the deterioration of farmland quality and the destruction of the ecological environment. Despite the success of forest land protection policies, the overall decline in biocapacity continues to pose issues of unsustainable land use.
From an overall ecological sustainability assessment perspective, since 2013, the ecological deficit of construction land has gradually decreased. This indicates that Lushan County has taken specific measures to reduce fossil fuel use, which have begun to show positive results. Lushan County’s ecological environment has achieved sustainability but still faces significant challenges. Despite the decline in the EPI, ecological pressure remains high. Future efforts should focus on policy guidance and technological innovation to reduce resource consumption and optimise resource allocation. While the EOI is relatively favourable, continuous efforts are needed to maintain and enhance this advantage. The decline in the EECI warns of the imbalance between economic development and ecological protection. To ensure long-term ecological security and sustainability, it is essential to continue implementing targeted measures and policies to improve the balance between economic development and ecological protection, enhance the ecological efficiency of economic activities, and achieve a win–win situation for both the economy and the environment.

4.3. Future Sustainability Development Strategies

The case of Lushan County indicates that despite the ongoing decline in EF and biocapacity, further efforts are required to promote ecological restoration projects, such as reforestation, grazing land restoration, and water resource management, to achieve sustainable development. Additionally, greater emphasis should be placed on promoting green technologies and using renewable energy to reduce reliance on fossil fuels, enhancing the ecosystem’s recovery capacity and biocapacity. Through scientifically sound land management and ecological protection measures, it is possible to further narrow Lushan County’s ED and gradually restore its ecological environment.
For Lushan County’s future economic development, it is essential to maintain growth while focusing on the coordinated development of the ecological economy. Traditional economic growth models often come at the expense of high resource consumption and environmental burden. Future development should shift towards green and circular economy models. By optimising industrial structure and fostering technological innovation, resource utilisation efficiency and the ecological benefits of economic activities can be improved. For instance, promoting the development of ecological agriculture, green industry, and tourism can facilitate the transformation and upgrading of economic growth modes. Additionally, the government should increase investment in the environmental protection industry and green technologies, guiding enterprises and society to participate in ecological protection, thereby jointly promoting sustainable economic development.
Achieving sustainability requires broad public participation and enhanced social awareness. Lushan County should strengthen ecological civilisation education, raising residents’ awareness of environmental protection and sustainable development concepts. Through community activities, promotional education, and policy guidance, the public should be encouraged to participate actively in ecological protection and resource conservation. The government should also improve the social security system and enhance public service levels, ensuring that economic development benefits reach all residents, thereby improving social welfare. Furthermore, emphasis should be placed on strengthening regional cooperation, learning from the successful experiences of other regions, collectively addressing ecological environmental challenges, and promoting regional sustainable development.
Thus, combining the case of Lushan County, the future sustainable development model for mountain towns should be based on ecological protection, guided by a green economy, and guaranteed by social participation. Through collaborative efforts in various aspects, the harmonious development of the economy, society, and environment can be achieved. This approach enhances mountain towns’ comprehensive competitiveness and contributes positively to global ecological and environmental protection and sustainable development.

4.4. Limitations

This paper employs an improved EF method to evaluate the sustainability of mountain towns. By conducting a spatiotemporal analysis of the EF in Lushan County, the paper analyses the annual EF and sustainability indices, providing reasonable development recommendations for future sustainability assessments of mountain towns. However, the study has certain limitations: (1) Data Source Limitations: Some data used in this study are derived from statistical yearbooks, which may have issues such as missing or incomplete data. Additionally, the study focuses solely on Lushan County, a single mountain town, which limits the generalisability of the findings. (2) On-site Survey Data Limitations: Part of the data used in this study come from on-site surveys, which may have issues such as data loss. (3) Diversity of Land Functions: Considering the diverse functions of productive land in mountain towns, future research should incorporate more land functions into EF calculations.
Future research can overcome these limitations by improving data collection tools and methods, increasing data verification and calibration steps, expanding the scope of study subjects, and enhancing the adaptability and precision of the models. A more comprehensive analysis of different recommendations and policies can be conducted by combining hypothetical scenarios. This approach will allow for a more thorough and accurate assessment of the sustainability of mountain towns, providing robust support for the development of more scientific ecological protection and development policies.

5. Conclusions

This paper enhances the ecological footprint (EF) model by incorporating ecological and economic coordination indices to assess the ecological sustainability of mountain towns quantitatively. Using Lushan County as a case study, the model provides a future sustainable development framework. The results show that (1) from 2009 to 2022, the total per capita ecological footprint of Lushan County decreased by 48% from 2009, the per capita biological carrying capacity decreased by 9%, and the ecological deficit decreased by 73%. In 2022, Lushan County was still in the state of ecological deficit. (2) Lushan County is currently in a good state of ecological sustainability, where the EPI declined by 38%, which indicates that ecological pressure is gradually slowing down. The EOI showed a downward trend of 50%, indicating a gradual deterioration; the ESI increased by 37%, indicating an improvement in ecological sustainability; and the EECI decreased by 20%, which indicates that Lushan County’s economic development is poorly coordinated with the ecological environment and continues to deteriorate. (3) With the further deepening of ecological protection measures in Lushan County, it is expected that the ecological footprint of Lushan County will continue to show a downward trend in the future, with insufficient biological carrying capacity, and the gap between the ecological footprint and biological carrying capacity will be further reduced. (4) In the future sustainable development model of Lushan County, it will be necessary to promote ecological restoration projects further, focus on the coordinated development of ecology and economy, strengthen the education of ecological civilisation, and improve the residents’ awareness of environmental protection and the concept of sustainable development.

Author Contributions

Conceptualisation and visualisation: H.Y., S.Y. and N.A.; methodology and writing: H.Y., N.A. and Q.Y.; audit and funding acquisition: S.Y. and Q.Y.; supervision: S.Y. All authors have read and agreed to the published version of the manuscript.

Funding

This research was funded by the National key R&D plan “Joint Research and Demonstration for Carbon Reduction Key Technologies in Urban areas and Neighborhoods” (NO.2022YFE0208700); the Humanities and Social Science Foundation for Ministry of Education, Youth project, China, grant number 23YJCZH275; the National Natural Science Foundation of China, grant number 52278071; the Art Science Planning Foundation of Shanghai, China, grant number YB2022-G-088.

Data Availability Statement

The original contributions presented in the study are included in the article, further inquiries can be directed to the corresponding author.

Acknowledgments

The authors would like to thank the anonymous reviewers for their comments and suggestions.

Conflicts of Interest

The authors declare no conflicts of interest.

References

  1. Borsdorf, A.; Stötter, J.; Grabherr, G.; Bender, O. Impacts and Risks of Global Change. In Impact of Global Changes on Mountains; CRC Press: Boca Raton, FL, USA, 2014; ISBN 978-0-429-17291-5. [Google Scholar]
  2. Jansky, L.; Ives, J.D.; Furuyashiki, K.; Watanabe, T. Global Mountain Research for Sustainable Development. Glob. Environ. Chang. 2002, 12, 231–239. [Google Scholar] [CrossRef]
  3. Badar, R.N.; Bahadure, S.P. Assessing Tourism Sustainability in Hill Towns: Case Study of Shimla, India. J. Mt. Sci. 2020, 17, 2241–2261. [Google Scholar] [CrossRef]
  4. Qin, Y.; Luo, G.; Li, Y.; Tan, Q.; Zheng, C.; Yu, M.; Liao, J.; Li, M. Assessment of Sustainable Development of Rural Settlements in Mountainous Areas: A Case Study of the Miaoling Mountains in Southwestern China. Land 2022, 11, 1666. [Google Scholar] [CrossRef]
  5. Yang, M.; Zhao, Y.; Zhao, T. Landscape Evaluation of Rural and Small Towns in Siming Mountain of Zhejiang Based on Landscape Performance. E3S Web Conf. 2020, 143, 01034. [Google Scholar] [CrossRef]
  6. Borucke, M.; Moore, D.; Cranston, G.; Gracey, K.; Iha, K.; Larson, J.; Lazarus, E.; Morales, J.C.; Wackernagel, M.; Galli, A. Accounting for Demand and Supply of the Biosphere’s Regenerative Capacity: The National Footprint Accounts’ Underlying Methodology and Framework. Ecol. Indic. 2013, 24, 518–533. [Google Scholar] [CrossRef]
  7. Wackernagel, M.; Rees, W. Our Ecological Footprint: Reducing Human Impact on the Earth; New Society Publishers: Gabriola, BC, Canada, 1998; ISBN 978-0-86571-312-3. [Google Scholar]
  8. Wackernagel, M.; Monfreda, C.; Schulz, N.B.; Erb, K.-H.; Haberl, H.; Krausmann, F. Calculating National and Global Ecological Footprint Time Series: Resolving Conceptual Challenges. Land. Use Policy 2004, 21, 271–278. [Google Scholar] [CrossRef]
  9. Solarin, S.A.; Tiwari, A.K.; Bello, M.O. A Multi-Country Convergence Analysis of Ecological Footprint and Its Components. Sustain. Cities Soc. 2019, 46, 101422. [Google Scholar] [CrossRef]
  10. Hopton, M.E.; White, D. A Simplified Ecological Footprint at a Regional Scale. J. Environ. Manag. 2012, 111, 279–286. [Google Scholar] [CrossRef] [PubMed]
  11. Ryu, H.C. Modeling the per Capita Ecological Footprint for Dallas County, Texas: Examining Demographic, Environmental Value, Land-Use, and Spatial Influences; Texas A&M University: College Station, TX, USA, 2005. [Google Scholar]
  12. Caird, S.; Roy, R. Household Ecological Footprints—Demographics and Sustainability. J. Env. Assmt. Pol. Mgmt. 2006, 8, 407–429. [Google Scholar] [CrossRef]
  13. Verhofstadt, E.; Van Ootegem, L.; Defloor, B.; Bleys, B. Linking Individuals’ Ecological Footprint to Their Subjective Well-Being. Ecol. Econ. 2016, 127, 80–89. [Google Scholar] [CrossRef]
  14. Gössling, S.; Hansson, C.B.; Hörstmeier, O.; Saggel, S. Ecological Footprint Analysis as a Tool to Assess Tourism Sustainability. Ecol. Econ. 2002, 43, 199–211. [Google Scholar] [CrossRef]
  15. Gassner, A.; Lederer, J.; Kanitschar, G.; Ossberger, M.; Fellner, J. Extended Ecological Footprint for Different Modes of Urban Public Transport: The Case of Vienna, Austria. Land. Use Policy 2018, 72, 85–99. [Google Scholar] [CrossRef]
  16. Wang, H.; Huang, J.; Zhou, H.; Deng, C.; Fang, C. Analysis of Sustainable Utilization of Water Resources Based on the Improved Water Resources Ecological Footprint Model: A Case Study of Hubei Province, China. J. Environ. Manag. 2020, 262, 110331. [Google Scholar] [CrossRef] [PubMed]
  17. Destek, M.A.; Sinha, A. Renewable, Non-Renewable Energy Consumption, Economic Growth, Trade Openness and Ecological Footprint: Evidence from Organisation for Economic Co-Operation and Development Countries. J. Clean. Prod. 2020, 242, 118537. [Google Scholar] [CrossRef]
  18. Wackernagel, M.; Monfreda, C.; Erb, K.-H.; Haberl, H.; Schulz, N.B. Ecological Footprint Time Series of Austria, the Philippines, and South Korea for 1961–1999: Comparing the Conventional Approach to an ‘Actual Land Area’ Approach. Land Use Policy 2004, 21, 261–269. [Google Scholar] [CrossRef]
  19. Barrett, J.; Simmons, C. An Ecological Footprint of the UK: Providing a Tool to Measure the Sustainability of Local Authorities; Stockholm Environment Institute: Stockholm, Sweden, 2003. [Google Scholar]
  20. Wiedmann, T.; Minx, J.; Barrett, J.; Wackernagel, M. Allocating Ecological Footprints to Final Consumption Categories with Input–Output Analysis. Ecol. Econ. 2006, 56, 28–48. [Google Scholar] [CrossRef]
  21. Jie, H.; Khan, I.; Alharthi, M.; Zafar, M.W.; Saeed, A. Sustainable Energy Policy, Socio-Economic Development, and Ecological Footprint: The Economic Significance of Natural Resources, Population Growth, and Industrial Development. Util. Policy 2023, 81, 101490. [Google Scholar] [CrossRef]
  22. Niccolucci, V.; Bastianoni, S.; Tiezzi, E.B.P.; Wackernagel, M.; Marchettini, N. How Deep Is the Footprint? A 3D Representation. Ecol. Model. 2009, 220, 2819–2823. [Google Scholar] [CrossRef]
  23. Ruževičius, J. Ecological Footprint as an Indicator of Sustainable Development. Econ. Manag. 2010, 15, 711–718. [Google Scholar]
  24. Wei, Z.; Jian, Z.; Sun, Y.; Pan, F.; Han, H.; Liu, Q.; Mei, Y. Ecological Sustainability and High-Quality Development of the Yellow River Delta in China Based on the Improved Ecological Footprint Model. Sci. Rep. 2023, 13, 3821. [Google Scholar] [CrossRef]
  25. Wiedmann, T.; Barrett, J. A Review of the Ecological Footprint Indicator—Perceptions and Methods. Sustainability 2010, 2, 1645–1693. [Google Scholar] [CrossRef]
  26. Ding, Y.; Peng, J. Impacts of Urbanization of Mountainous Areas on Resources and Environment: Based on Ecological Footprint Model. Sustainability 2018, 10, 765. [Google Scholar] [CrossRef]
  27. Yang, Y.; Ling, S.; Zhang, T.; Yao, C. Three-Dimensional Ecological Footprint Assessment for Ecologically Sensitive Areas: A Case Study of the Southern Qin Ling Piedmont in Shaanxi, China. J. Clean. Prod. 2018, 194, 540–553. [Google Scholar] [CrossRef]
  28. Cole, V. Using Ecological Footprint Analysis to Measure Sustainability in a Himalayan Tourist Centre; University of Manitoba: Winnipeg, MB, Canada, 2000. [Google Scholar]
  29. An, N.; Zeng, W.; Yang, B. Research on Geo-Ecological Restoration of Mountain Towns Upon the Influence of Earthquake Disasters—A Case Study of 4.20 Lushan Earthquake; Doha, Qatar, 2020. Available online: https://isocarp.org/app/uploads/2021/06/ISOCARP_2020_An_380.pdf (accessed on 28 June 2024).
  30. Galli, A.; Wiedmann, T.; Ercin, E.; Knoblauch, D.; Ewing, B.; Giljum, S. Integrating Ecological, Carbon and Water Footprint into a “Footprint Family” of Indicators: Definition and Role in Tracking Human Pressure on the Planet. Ecol. Indic. 2012, 16, 100–112. [Google Scholar] [CrossRef]
  31. Liu, M.; Li, W.; Zahng, D.; Su, N. The Calculation of Equivalence Factor for Ecological Footprints in China: A Methodological Note. Front. Environ. Sci. Eng. 2015, 9, 1015–1024. [Google Scholar] [CrossRef]
  32. Liu, J.; Raven, P.H. China’s Environmental Challenges and Implications for the World. Crit. Rev. Environ. Sci. Technol. 2010, 40, 823–851. [Google Scholar] [CrossRef]
  33. Liu, Y.; Li, L. Mountainous City Featured Landscape Planning Based on GIS-AHP Analytical Method. ISPRS Int. J. Geo-Inf. 2020, 9, 211. [Google Scholar] [CrossRef]
  34. Mikulčić, H.; Wang, X.; Duić, N.; Dewil, R. Environmental Problems Arising from the Sustainable Development of Energy, Water and Environment System. J. Environ. Manag. 2020, 259, 109666. [Google Scholar] [CrossRef] [PubMed]
  35. Yang, E.; Yao, Q.; Long, B.; An, N.; Liu, Y. Progress in the Research of Features and Characteristics of Mountainous Rural Settlements: Distribution, Issues, and Trends. Sustainability 2024, 16, 4410. [Google Scholar] [CrossRef]
  36. Wang, Y.; Xiang, P. Urban Sprawl Sustainability of Mountainous Cities in the Context of Climate Change Adaptability Using a Coupled Coordination Model: A Case Study of Chongqing, China. Sustainability 2019, 11, 20. [Google Scholar] [CrossRef]
  37. Han, C.; Wang, G.; Yang, Y. An Assessment of Sustainable Wellbeing and Coordination of Mountain Areas: A Case Study of Qinba Mountain Area in China. Ecol. Indic. 2023, 154, 110674. [Google Scholar] [CrossRef]
  38. Lushan County People’s Government 2023 Lushan County Government Work Report. Available online: http://www.yals.gov.cn/gongkai/show/8bef5172c5b40b216fb6cad29080d691.html (accessed on 26 June 2024).
  39. Lushan County People’s Government Geographical Overview. Available online: http://www.yals.gov.cn/lushan/e49fddb5-8787-4f21-93a6-9896130cff2d.html (accessed on 28 June 2024).
  40. Lushan County People’s Government Humanities Overview. Available online: http://www.yals.gov.cn/lushan/83cb8992-02eb-4829-9ba5-405fb4e4cfde.html (accessed on 27 June 2024).
  41. Lushan County People’s Government Economic Overview. Available online: http://www.yals.gov.cn/lushan/e52c550a-7d24-494c-8679-d790281074b2.html (accessed on 27 June 2024).
  42. Yang, J.; Huang, X. The 30 m Annual Land Cover Dataset and Its Dynamics in China from 1990 to 2019. Earth Syst. Sci. Data 2021, 13, 3907–3925. [Google Scholar] [CrossRef]
  43. Wackernagel, M.; Yount, J.D. The Ecological Footprint: An Indicator of Progress Toward Regional Sustainability. Env. Monit. Assess. 1998, 51, 511–529. [Google Scholar] [CrossRef]
  44. Li, R.; Wang, X.; Wang, Q. Does Renewable Energy Reduce Ecological Footprint at the Expense of Economic Growth? An Empirical Analysis of 120 Countries. J. Clean. Prod. 2022, 346, 131207. [Google Scholar] [CrossRef]
  45. Chuai, X.; Huang, X.; Lu, Q.; Zhang, M.; Zhao, R.; Lu, J. Spatiotemporal Changes of Built-Up Land Expansion and Carbon Emissions Caused by the Chinese Construction Industry. Environ. Sci. Technol. 2015, 49, 13021–13030. [Google Scholar] [CrossRef] [PubMed]
  46. Hardin, G. Paramount Positions in Ecological Economics. Ecological economics: The Science and Management of Sustainability; Columbia University Press: New York, NY, USA, 1991; pp. 47–57. [Google Scholar]
  47. Rees, W.; Wackernagel, M. Urban Ecological Footprints: Why Cities Cannot Be Sustainable—And Why They Are a Key to Sustainability. In Urban Ecology; Marzluff, J.M., Shulenberger, E., Endlicher, W., Alberti, M., Bradley, G., Ryan, C., Simon, U., ZumBrunnen, C., Eds.; Springer: Boston, MA, USA, 2008; pp. 537–555. ISBN 978-0-387-73411-8. [Google Scholar]
  48. Senbel, M.; McDaniels, T.; Dowlatabadi, H. The Ecological Footprint: A Non-Monetary Metric of Human Consumption Applied to North America. Glob. Environ. Chang. 2003, 13, 83–100. [Google Scholar] [CrossRef]
  49. Viviroli, D.; Archer, D.R.; Buytaert, W.; Fowler, H.J.; Greenwood, G.B.; Hamlet, A.F.; Huang, Y.; Koboltschnig, G.; Litaor, M.I.; López-Moreno, J.I.; et al. Climate Change and Mountain Water Resources: Overview and Recommendations for Research, Management and Policy. Hydrol. Earth Syst. Sci. 2011, 15, 471–504. [Google Scholar] [CrossRef]
  50. Westveer, J.; Freeman, R.; McRae, L.; Marconi, V.; Almond, R.E.A.; Grooten, M. A Deep Dive into the Living Planet Index: A Technical Report; WWF: Gland, Switzerland, 2022. [Google Scholar]
  51. Chuai, X.; Gao, R.; Huang, X.; Lu, Q.; Zhao, R. The Embodied Flow of Built-up Land in China’s Interregional Trade and Its Implications for Regional Carbon Balance. Ecol. Econ. 2021, 184, 106993. [Google Scholar] [CrossRef]
  52. Nie, W.; Shi, Y.; Siaw, M.J.; Yang, F.; Wu, R.; Wu, X.; Zheng, X.; Bao, Z. Constructing and Optimizing Ecological Network at County and Town Scale: The Case of Anji County, China. Ecol. Indic. 2021, 132, 108294. [Google Scholar] [CrossRef]
  53. Li, Y.; Guo, T.T.; Li, P.P. Evaluation Analysis of Ecological Footprint Model. Appl. Mech. Mater. 2011, 99–100, 487–490. [Google Scholar] [CrossRef]
  54. Liu, C.; Cutforth, H.; Chai, Q.; Gan, Y. Farming Tactics to Reduce the Carbon Footprint of Crop Cultivation in Semiarid Areas. A Review. Agron. Sustain. Dev. 2016, 36, 69. [Google Scholar] [CrossRef]
  55. Ya’an Daily Client Lushan: Green Development and Ecological Economy Go Hand in Hand. Available online: https://wap.beiww.com/zsya/xw/jd/202304/t20230412_1153661.html (accessed on 28 June 2024).
  56. Ya’an Municipal Ecological Environment Bureau Lushan County Explores How to Use the “Green Content” of the Ecological Environment to Enhance the “Gold Content” of Economic Development. Available online: https://sthjj.yaan.gov.cn/xinwen/show/1d787865e7f0be93049d7b713b4b59ef.html (accessed on 28 June 2024).
  57. Sichuan Provincial Government Gazette Decision on Naming the Second Batch of Provincial-Level Ecological Counties. Available online: https://www.sc.gov.cn/10462/11555/11562/2023/1/9/da1781f1bfbe49ed81c9ad19873ec0a9.shtml (accessed on 28 June 2024).
  58. Martire, S.; Castellani, V.; Sala, S. Carrying Capacity Assessment of Forest Resources: Enhancing Environmental Sustainability in Energy Production at Local Scale. Resour. Conserv. Recycl. 2015, 94, 11–20. [Google Scholar] [CrossRef]
Figure 1. Lushan County location.
Land 13 01081 g001
Figure 2. Calculation model of EF in mountain towns.
Land 13 01081 g002
Figure 3. Changes in per capita EF in Lushan County from 2009 to 2022.
Land 13 01081 g003
Figure 4. Per capita biocapacity by land use categories from 2009 to 2022.
Land 13 01081 g004
Figure 5. Per capita ED/ES by land use categories from 2009 to 2022.
Land 13 01081 g005
Figure 6. Sustainable development assessment in Lushan County (2009–2022).
Land 13 01081 g006
Table 1. Data sources for the study.
DataSource
National Average Yield“China Agricultural Yearbook”, “Compilation of National Agricultural Product Cost-Benefit Data”, “China Fisheries Yearbook”, “China Forestry Yearbook”, “China Statistical Yearbook”
Biological Products in Lushan County“Ya’an Statistical Yearbook” from 2009 to 2022, “Lushan County Statistical Yearbook” from 2009 to 2022
Energy Types in Lushan County“Ya’an Statistical Yearbook” from 2009 to 2022, “Statistical Bulletin of National Economic and Social Development of Lushan County”, on-site data collected by Lushan County Economic and Technological Bureau
Pollutants in Lushan County“Ya’an Statistical Yearbook” from 2009 to 2022, on-site data collected by Lushan County Environmental Protection Bureau
Land Area in Lushan County“Ya’an Statistical Yearbook” from 2009 to 2022, “Annual Statistical Report on Urban (County) Construction in Sichuan Province” from 2009 to 2022, remote sensing image interpretation of Lushan County from 2009 to 2022
Table 2. Definitions of various types of land for EF.
Land TypeDefinition
CroplandThe land is used for growing various crops and providing primary food and plant products for humans.
Grazing landLand is mainly used for grazing livestock, such as cattle and sheep, providing meat and other animal products for humans.
Forest landRefers to natural or artificial forests that provide various products for human production and living, including timber, bamboo, nuts, etc.
Built-up landThe land is occupied by various engineering facilities and residential activities, including land used for hydropower generation. Most built-up land is converted from cropland [43,45].
Fossil fuel landRefers to the area required to absorb the CO2 produced from the combustion of fossil fuels, indicating the land’s carbon sequestration capacity. In EF calculations, forests generally have the highest CO2 sequestration capacity [43].
Fishing groundThe space required for fishing.
Table 3. Classification and criteria for comprehensive assessment of sustainable development.
IndicatorLevelCriteria
EPIExtremely Unsafe>2.00
Very Unsafe2.00–1.51
Somewhat Unsafe1.50–1.01
Slightly Unsafe1.00–0.81
Somewhat Safe0.80–0.51
Very Safe<0.50
ESIHighly Unsustainable<0.2
Moderately Unsustainable0.2–0.35
Weakly Unsustainable0.35–0.5
Weakly Sustainable0.5–0.65
Moderately Sustainable0.65–0.8
Highly Sustainable>0.8
EOIVery Poor<0.5
Poor0.51–1.00
Somewhat Wealthy1.01–2.00
Wealthy2.01–3.00
Very Wealthy3.01–4.00
Extremely Wealthy>4.00
EECIVery Poor Coordination<1.00
Poor Coordination1.01–2.00
Fair Coordination2.01–3.00
Good Coordination3.01–4.00
Very Good Coordination4.01–8.00
Excellent Coordination>8.00
SDIVery Poor Sustainability<0.63
Poor Sustainability0.63–0.89
Fair Sustainability0.90–1.30
Good Sustainability1.31–1.62
Very Good Sustainability1.63–2.11
Excellent Sustainability>2.11
Table 4. Sustainable development ratings in Lushan County (2009–2022).
EPIEOIEECISDIESI
2009Extremely UnsafeWealthyVery Poor CoordinationVery Poor SustainabilityModerately Unsustainable
2010Extremely UnsafeSomewhat WealthyVery Poor CoordinationVery Poor SustainabilityModerately Unsustainable
2011Extremely UnsafeSomewhat WealthyVery Poor CoordinationVery Poor SustainabilityModerately Unsustainable
2012Extremely UnsafeSomewhat WealthyVery Poor CoordinationVery Poor SustainabilityModerately Unsustainable
2013Extremely UnsafeSomewhat WealthyVery Poor CoordinationVery Poor SustainabilityModerately Unsustainable
2014Extremely UnsafeSomewhat WealthyVery Poor CoordinationVery Poor SustainabilityModerately Unsustainable
2015Extremely UnsafeSomewhat WealthyVery Poor CoordinationVery Poor SustainabilityModerately Unsustainable
2016Extremely UnsafeSomewhat WealthyVery Poor CoordinationVery Poor SustainabilityModerately Unsustainable
2017Extremely UnsafeSomewhat WealthyVery Poor CoordinationPoor SustainabilityModerately Unsustainable
2018Very UnsafeSomewhat WealthyVery Poor CoordinationPoor SustainabilityHighly Unsustainable
2019Very UnsafeSomewhat WealthyVery Poor CoordinationPoor SustainabilityHighly Unsustainable
2020Very UnsafeSomewhat WealthyVery Poor CoordinationPoor SustainabilityHighly Unsustainable
2021Very UnsafeSomewhat WealthyVery Poor CoordinationPoor SustainabilityHighly Unsustainable
2022Very UnsafeSomewhat WealthyVery Poor CoordinationPoor SustainabilityHighly Unsustainable
Disclaimer/Publisher’s Note: The statements, opinions and data contained in all publications are solely those of the individual author(s) and contributor(s) and not of MDPI and/or the editor(s). MDPI and/or the editor(s) disclaim responsibility for any injury to people or property resulting from any ideas, methods, instructions or products referred to in the content.

