Article

Spatial Identification and Evaluation of Land Use Multifunctions and Their Interrelationships Improve Territorial Space Zoning Management in Harbin, China

1
School of Public Administration and Law, Northeast Agricultural University, Harbin 150036, China
2
School of College of Economics and Management, Northeast Agricultural University, Harbin 150036, China
3
Zhou Enlai School of Government, Nankai University, Tianjin 300071, China
*
Authors to whom correspondence should be addressed.
These authors contributed equally to this work.
Land 2024, 13(7), 1092; https://doi.org/10.3390/land13071092 (registering DOI)
Submission received: 27 May 2024 / Revised: 7 July 2024 / Accepted: 12 July 2024 / Published: 19 July 2024

Abstract

:
Quantitative assessment and trade-off/synergy analysis of land use multifunctions can effectively identify regional conflicts and dominant functions, providing decision support for promoting sustainable socio-economic and land use development. However, current research in this field still faces challenges due to coarse scale of studies and limited availability of accurate data. Taking Harbin City as a research case, this research employed an improved mutation level method, Pearson correlation analysis, and a multi-scale geographically weighted regression model to comprehensively investigate the profiling of land use multifunctions and their trade-off /synergy relationships. The comparative advantage theory was adopted to identify dominant functional zones using the NRCA index at a grid scale, in order to achieve a territorial spatial functional zoning delineation. The results showed that there were intricate trade-off/synergy relationships among production–living–ecology functions. Moreover, the types and intensity of trade-off/synergy evolved continuously with socio-economic development and regional resource endowment disparities. Due to its exceptional resource endowment, the agricultural dominated, urban dominated, and ecological dominated functional areas accounted for a significant proportion of 29%, 7%, and 26%, respectively. However, owing to the intricate trade-offs/synergies inherent in land use multifunctions, only a mere 2% (agricultural), 1% (urban), and 1% (ecological) of the area were identified as Optimization Guidance Zones. Conversely, Remediation Improvement Zones constituted the largest share at 63% of the total area, with agricultural, urban, and ecological Remediation Improvement Zones accounting for approximately 33%, 12%, and 18%, respectively. Based on the results of the type and intensity of trade-off/synergy among production–living–ecological functions, as well as the dominant zones and the integrated territorial spatial functional zoning delineation, this article provided targeted recommendations for the sustainable development of the region. These recommendations took into account both resource endowment and socio-economic development characteristics specific to the study area. The study aims to contribute to related research gaps, while providing valuable insights for other regional studies.

1. Introduction

As the cornerstone of human survival and development, land possesses the capacity to offer diverse products and services to meet different human needs, collectively known as land use multifunctions [1,2]. For a long time, rapid urbanization and industrialization have significantly transformed the structure and functional characteristics of land use systems [3,4]. In this process, issues such as urban sprawl, continuous farmland shrinkage, habitat fragmentation, and environmental degradation have become increasingly prominent [5,6,7], posing a serious threat to the well-being of human societies and presenting a formidable challenge to sustainable development [8,9]. Against this background, current research in the field of land change science and sustainable development has focused on the interrelationships between land use functions and their mechanisms [10,11]. The comprehensive analysis of the intrinsic links and mutual influences among different land use functions, along with the exploration of effective integration and coordination strategies for these functions, aims to address conflicts and contradictions in the land use process. This endeavor holds profound significance in fostering harmonious coexistence between human society and the natural environment, as well as realizing synergistic development encompassing economic, social, and environmental aspects.
The identification and assessment of the primary functions of land use, as well as their interconnections, are imperative for upholding sustainable land use patterns in the region [12,13]. The concept of land use functions (LUFs) originated from extensive research on the multifunctionality of agricultural land, and the Organisation for Economic Co-operation and Development (OECD) expanded this analytical framework to encompass various types of land use in 2001. Subsequently, the LUF analytical framework underwent further refinement and development based on the Sustainability Assessment Tool for Environmental, Social, and Economic Impacts of Multifunctional Land Use in the European Region (SENSOR) in 2004 [14,15]. Currently, scholars generally categorize land use functions (LUFs) into three main functions, namely economic, social, and ecological dimensions, which represent the sustainable development aspect of land resources [16,17]. Two main approaches are mainly employed to assess LUFs. In one approach, different land use types are reclassified based on their functions to achieve integration with the land use classification system at the raster scale. While this method can demonstrate the multifunctional characteristics of land, it fails to capture the quality and interactions of LUFs due to its limited ability in integrating socio-economic factors [18,19]. Another approach is to construct a multi-factor indicator system based on statistical data for comprehensive assessment purposes. Although this method provides a holistic view of LUF levels, its research tends to focus on administrative units due to data limitations and overlooks highly heterogeneous land use issues [20,21]. In fact, according to the Third Law of Geography, neighboring units tend to interact and relate to each other more closely and frequently than units that are farther away [22]. Therefore, the potential influence of proximity factors and spatial autocorrelation should be fully considered when exploring the trade-off and synergistic relationship between LUFs [10,23,24,25]. The development of multivariate geospatial data and geospatial modeling techniques has greatly promoted the feasibility of quantitative evaluation of LUFs on a specific geographic unit or grid scale. This method can effectively overcome the limitations of multi-criteria evaluation methods, and gradually become an important tool for identifying LUFs and their trade-offs/synergies on a fine scale [26,27,28].
The diversity and complexity of human demands on land have resulted in intricate trade-offs or synergistic relationships between land use functions in both temporal and spatial dimensions [29,30]. Trade-offs arise from the fact that enhancing one function may entail a reduction in another, indicating the presence of functional competition. Conversely, synergies are observed when two or more functions experience simultaneous increases and decreases, revealing a coordinated and harmonious symbiosis between them [28,31]. Currently, various statistical analyses, such as correlation analysis [32], spatial clustering analysis [33], and coupled coordinate model [34], etc., have been employed to quantify the trade-off/synergistic relationships among multifunctions of land use. However, most studies mainly focus on the analysis of correlation coefficients between different functions, while neglecting the presentation of spatial results, which hinders the implementation of fine-scale functional management countermeasures. However, land use management has evolved from a singular focus on maximizing production to the integration of multiple benefits, including economic growth, social progress, and ecological protection [35]. Therefore, it is crucial to emphasize in-depth analysis of trade-offs and synergies to elucidate the competing objectives of multifunctional land use in different regions and accordingly configure land use preferences to promote sustainable land use [36].
Territorial spatial planning serves as an effective management tool for coordinating the achievement of sustainable development goals in socio-economic and land use systems [37]. By identifying multifunctional land uses and exploring trade-offs/synergies between functions, potential land use conflicts can be identified [30,38]. The integration of these approaches provides a robust basis for spatial zoning. With the deepening promotion of the strategy of revitalizing old industrial bases in northeast China, together with the construction of the Northeast Asia Economic and Trade Area and the implementation of the Belt and Road Initiative, Harbin has accelerated the pace of economic development, expanded urban scale, and intensified agricultural activities. However, this progress has also led to a more pronounced land use contradiction between regional economy, society, and ecology. To comprehensively address this issue, this study takes Harbin as a research object and quantitatively identifies trade-offs and synergies in land use functions at a grid scale from the perspective of “production–living–ecology” based on sustainable development’s three pillars theory. Building upon these findings, territory spatial zoning is proposed alongside target management policies. The research objectives are as follows: (1) to quantitatively identify the spatial and temporal characteristics of multifunctional land use in Harbin from 2000 to 2020 at a grid scale using multi-source data and geospatial models; (2) to elucidate the types and intensities of trade-offs/synergies in land use functions; and (3) to propose a novel territorial spatial function zoning scheme based on dominant functional areas, accompanied by targeted management measures. These analyses may contribute to promoting the coordinated development of LUFs and achieving the sustainable utilization of land resources.

2. Materials and Methods

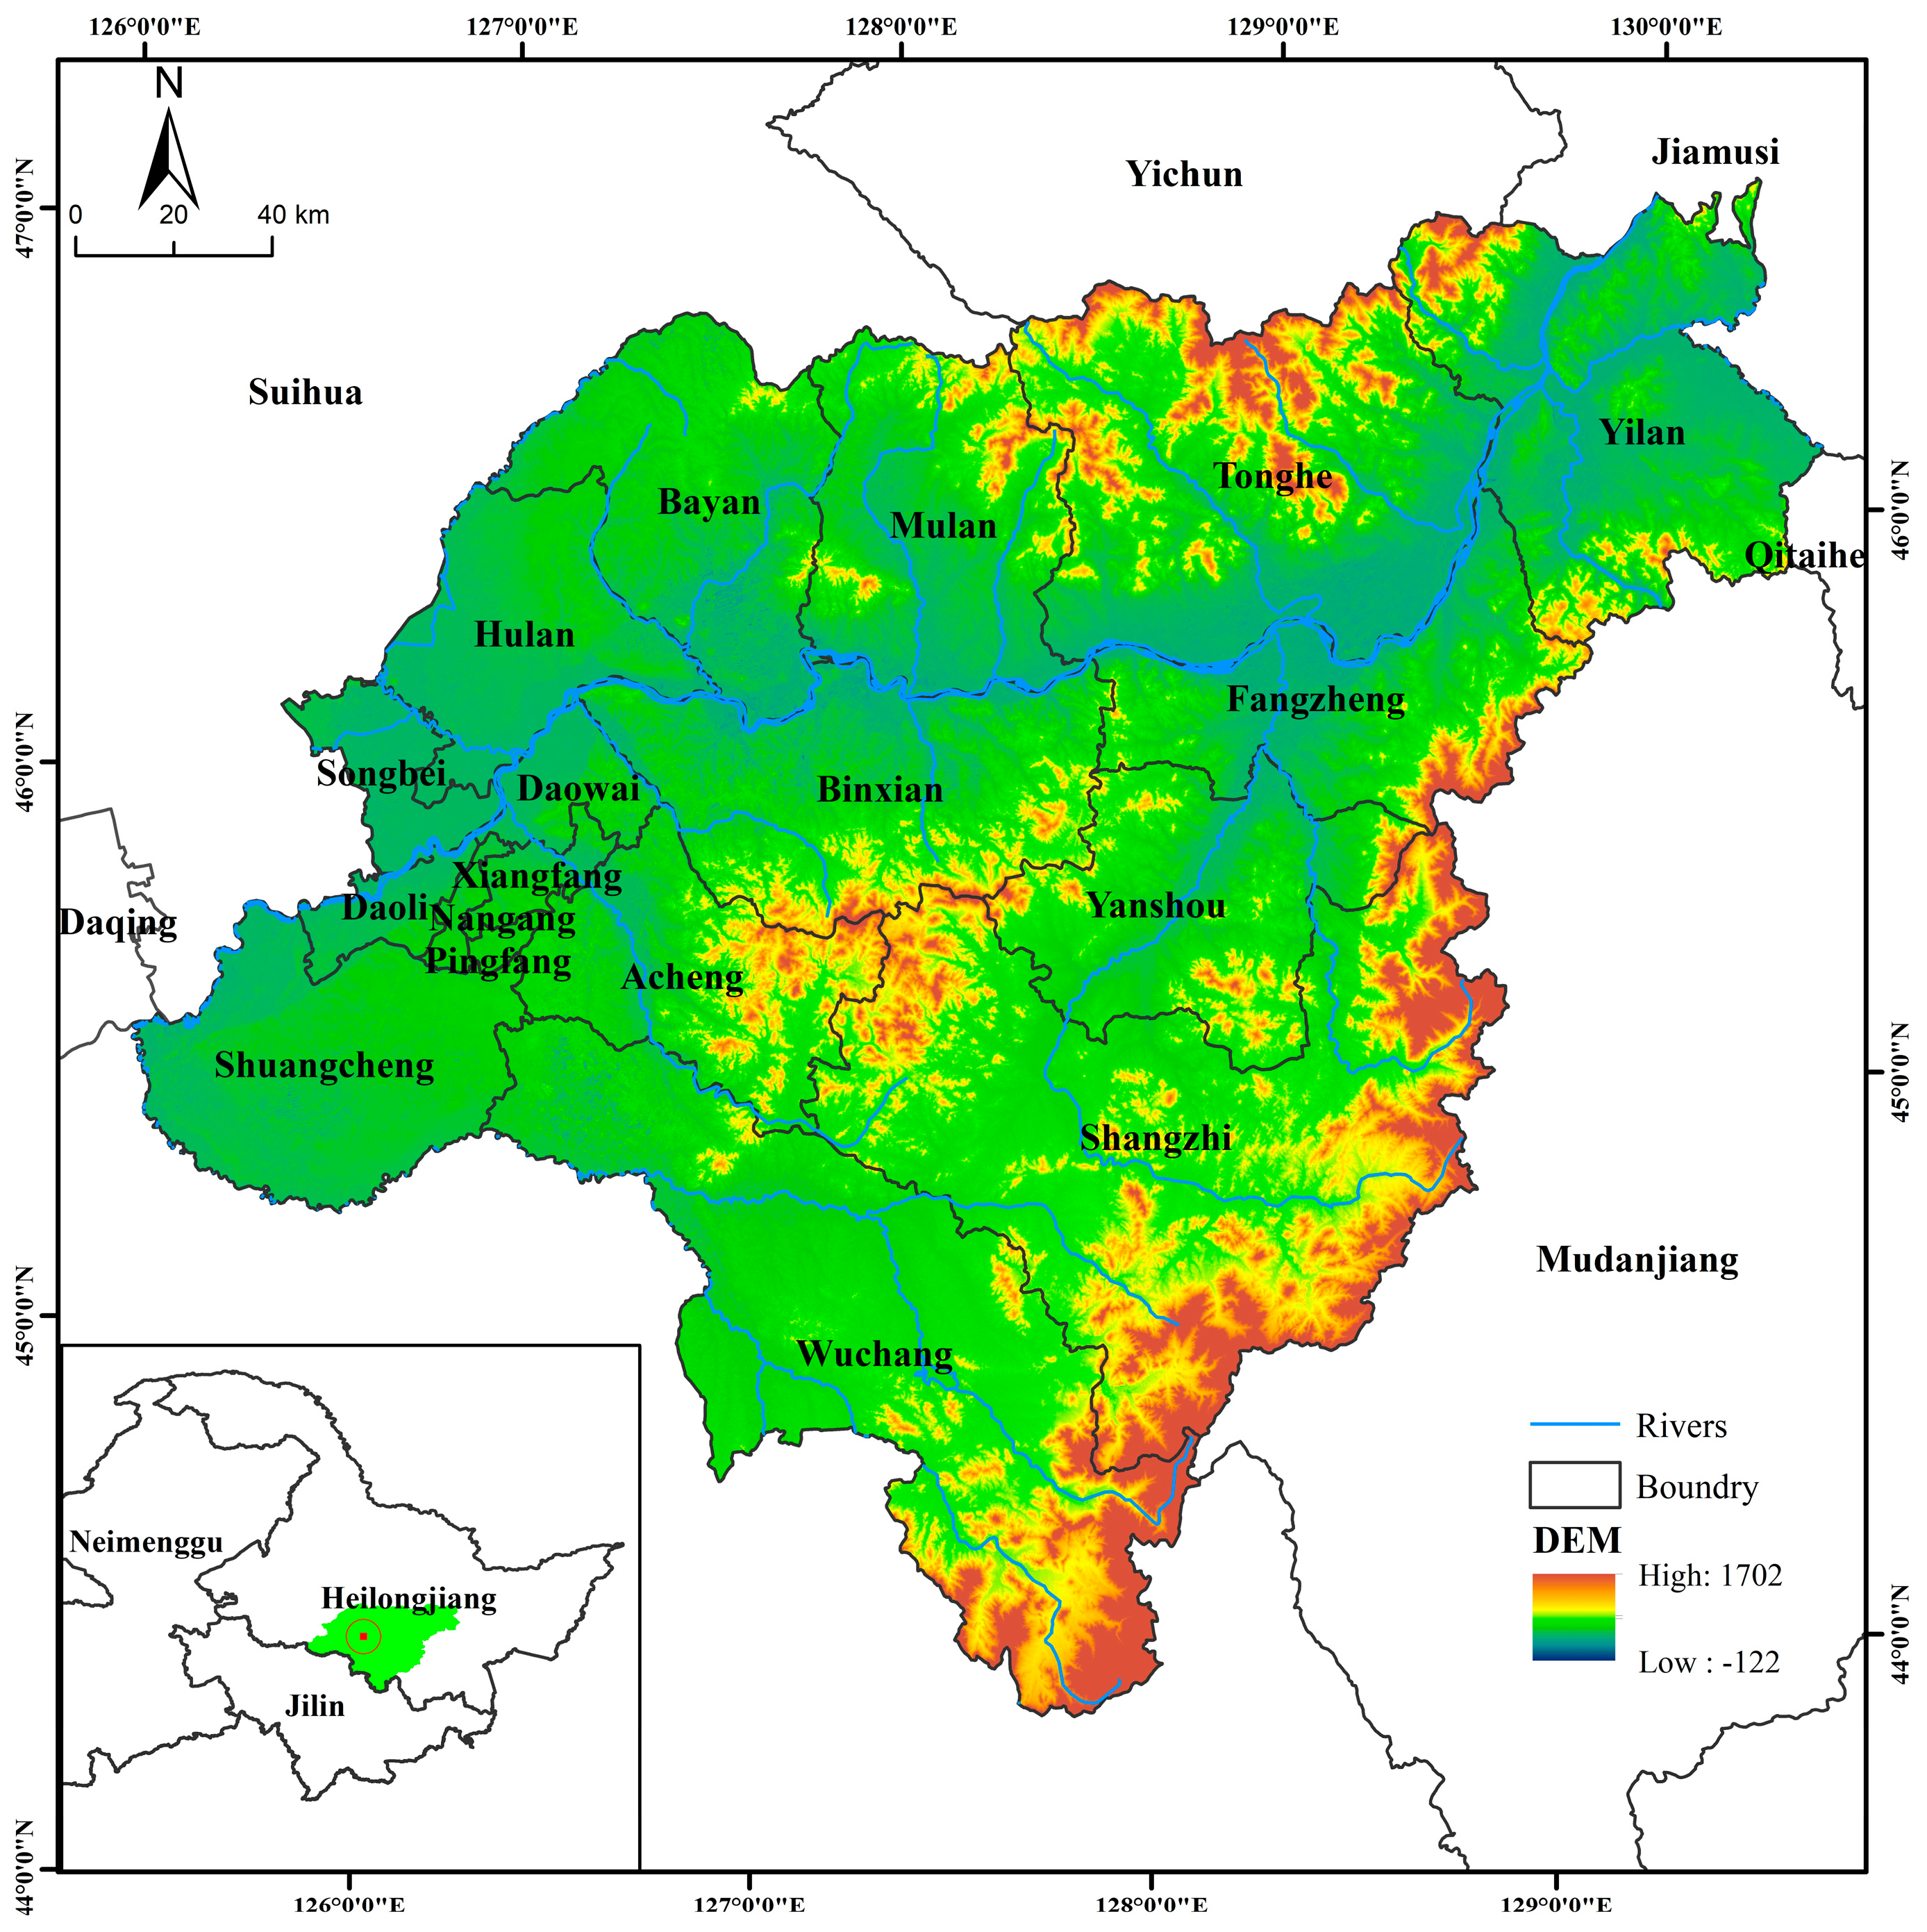
2.1. Study Area and Data Source

Harbin, located in northeast China, is the capital of Heilongjiang Province and serves as an important international comprehensive transport hub for the first Eurasian continental bridge and air corridor. Its geographical coordinates range from 125°42′ E to 130°10′ E and from 44°04′ N to 46°40′ N (Figure 1). The city is flanked by the Zhangguangcailing Branch Hills to the southeast, Lesser Khingan Mountains to the north, and Songhua River flowing through its central region. With moderate mountain heights, extensive rivers, and vast plains, Harbin has a temperate continental monsoon climate, characterized by an average annual temperature of about 5.6 °C and an average annual rainfall of about 423 mm. Its abundant natural resources and fertile black soils make it an important area for biodiversity conservation and food production in China. However, rapid urbanization and intensive agricultural development have led to increased encroachment on ecological areas with significant changes in land use cover. As a result, conflicts between production, livelihoods and ecology are emerging, posing a serious threat to sustainable regional development.
The spatial data used in this study mainly included DEM, land use, meteorological information, soil, the Normalized Difference Vegetation Index (NDVI), and other relevant datasets. Land use was categorized into six classes: cropland, forest, grassland, water bodies, built-up areas, and unused land. Specifically for built-up areas, it was further classified into urban development zones, rural settlements, as well as independent industrial and mining sites based on the research objectives. The socio-economic data, mainly including cereal production and forest products, were obtained from the Harbin City Statistical Yearbook, with interpolation for missing data in some years. The indicators mentioned above were normalized by using min–max normalization, thus making the value of each indicator range from 0 to 1. The weight coefficients of each function category and subindicators were comprehensively determined by government policy makers and urban planners. Each quantitative evaluation result of the LUFs was eventually exported as a spatial map through ArcGIS platform. Finally, the results are implemented to the grid cells by means of zonal statistics. Specific sources and data processing methods were shown in Table 1. To facilitate standardized measurement, this paper integrated multi-source data into a 1 km × 1 km spatial grid within the same coordinate system.

2.2. Methods

2.2.1. Quantitative Identification of Land Use Functions

From the perspective of sustainable land development, taking into account the unique characteristics of land resource endowment in Harbin City, a comprehensive land evaluation index system based on the “production–living–ecology” framework was constructed in this paper (as presented in Table 2).
(1) The production function of land use is designed to be represented by two aspects, namely the agricultural production and industrial and service production. For agricultural production, the main goal is to provide primary agricultural products and services for human survival and development. Industrial and service production is more reflected in the economic value of people’s livelihood. The main agricultural land use types in Harbin are farmland and forest; thus, the production function involved in this study mainly refers to food supply and forest product provisioning. The normalized vegetation cover index and the economic distribution of forests was used to achieve it [39].
(2) Living space primarily serves as housing, focusing on enhancing residents’ quality of life and pursuing intangible benefits. The concentration of residents in certain areas, such as cities, is closely linked to regional economic development and transportation conditions. The development of non-agricultural industries and the construction of transportation infrastructure have effectively ensured people’s livelihood Liveness level [40]. This study characterizes the living function based on five dimensions: economic development level, transport safety capacity, population carrying capacity, human health and recreation, and provision of work. To measure the economic development level and population carrying capacity, night lighting data and the distribution of construction land across different land use types were utilized [41]; while traffic coverage was employed to reflect the regional transport infrastructure and its corresponding service level [28]. Human health and recreation, and provision of work are characterized by socio-economic data.
(3) Ecological space is an essential prerequisite for achieving high quality production and living standards in the region, and its primary function is ecological conservation. Harbin City has exceptional ecological resources that play a key role in climate regulation, soil conservation, biodiversity preservation, and water yield. Therefore, this study divided the ecological function into these four secondary categories and completed their calculation using the InVEST model.

2.2.2. Improved Mutation Level Method

The mutation level method is a comprehensive evaluation approach that decomposes evaluation objectives into multi-level contradictions. It then uses mutation theory in conjunction with fuzzy mathematics to rank and analyze the evaluation objectives. By effectively identifying optimal solutions within multidimensional spaces, the mutation level method provides a more objective calculation and evaluation methodology [42]. In this study, the power function was adopted as the fitting function to solve the problem of high initial mutation score. Firstly, a stepped evaluation index system was constructed to calculate the initial mutation evaluation value for each land use function using the normalization formula of the mutation model. Then, the improved mutation evaluation value was obtained by considering the functional relationship between the initial mutation evaluation value and the underlying index membership degree (Table 3).
Since there was no complementary relationship between the functional indicators of land use, the average value of the improved mutation score was chosen as the final value of each sub-function in this study. The calculation formula was as follows:
L U F p = x a + x b 2
L U F l = x a + x b + x c + x d + x e 5
L U F e = x a + x b + x c + x d 4
where LUFp, LUFl, and LUFe represented the assessed value of Production, Living, and Ecology, respectively; x a , x b , x c , x d denoted the improved mutation evaluation values of corresponding sub-functions, respectively.

2.2.3. Trade-Offs/Synergies between Land Use Functions

The land use multifunctions of the grids were extracted, and the Spearman rank correlation coefficient was employed to calculate the trade-offs or synergistic relationships within the multifunctions. The calculation formula was as follows:
r s X i , Y i = 1 6 1 n P i Q i n n 2 1 P
where r s X i , Y i denoted the rank correlation coefficient, which takes values in the range [−1,1]; P i was the rank in the sequence {( X i ) } ; Q i represented the rank order; and n the number of observations. The significance of the trade-off and synergy relationship between functions was determined using multivariate geographically weighted regression. If the correlation coefficient between different land use multifunctions was negative and passed the significance test in MGWR, it indicated a trade-off relationship between them. Moreover, a stronger trade-off relationship was indicated by a larger absolute value of the negative correlation coefficient. Conversely, if the correlation coefficient was positive and passes the test, it suggested a synergistic relationship between them. Additionally, a stronger synergistic relationship was indicated by a larger positive value.
The Spearman rank correlation coefficient can only capture the static trade-off and synergy relationship at a certain moment, making it challenging to comprehensively depict the spatio–temporal evolution of these relationships. To address this limitation, this study introduces the TSC as a measure for characterizing their spatio–temporal dynamics at the grid scale. The calculation formula was given below.
T S C = E S i , t 2 E S i , t 1 E S j , t 2 E S j , t 1
where E  Si,t2 and ESi,t1 denoted the multifunctional values of land use for category i in period t2 and t1 while ESj,t2 and ESj,t1 represented the multifunctional values of land use for category j in period t2 and t1, respectively. If TSC > 0, it indicated a positive correlation and a synergistic relationship between ESi and ESj, otherwise there was a trade-off relationship. An increase in both land use multifunctionality was denoted as synergy (++), while a decrease in both was also denoted as synergy (−−). If the former increases and the latter decreases, it was recorded as a trade-off (+−); conversely, if the former decreases and the latter increases, it was also recorded as a trade-off (−+).
In addition, to provide a more comprehensive characterization of the spatial distribution of trade-off and synergies, this study used the Trade-off Synergy Index (TSI) as a metric to quantify variations in the strength of the trade-off/synergy relationship across regions. The calculation formula was as below:
T S I = 1 E S i E S j
where ∆ESi and ∆ESj represented the disparity between the multifunction value of category i and that of category j during the two respective periods. The TSI, which stands for Trade-off Synergy Index, was a normalized index ranging from 0 to 1. A higher value indicated stronger trade-offs or synergies among multifunctions, whereas a lower value indicated the opposite.

2.2.4. Spacial Zoning Based on Land Use Multifunctions

Incorporating dominant functional zones and Trade-offs/synergies between land use multifunctions into the national spatial planning and management system can effectively capture the specific trajectories and orientations of spatial management, thereby significantly improving land use efficiency in the national space and optimizing the quality of management decisions [36]. To achieve this goal, we draw upon the concept of comparative advantage theory and employ the NRCA index to identify dominant functional areas [43,44]. The formula was as fellows:
  N R C A j i = U j i U U i × U j U × U
where N R C A j i was the NRCA index, U j i denoted the value of the function j in grid I, Ui was the sum of all the functions in grid i; Uj represented the value of the function j in all grids, and Ui was the sum of all the functions in all grid. If NRCA > 0, it indicated that grid cell i possessed a comparative advantage for a certain function; conversely, it did not.
The regions with a single advantage can be divided into agricultural dominant functional area, urban dominant functional area, and ecological dominant functional area. In addition, if there are two different advantages in a region, it can be divided into agricultural–urban dominant functional area, urban–ecological functional area, and agricultural–ecological functional area and there is almost no region with three advantages at the same time.
On the basis of the above partition scheme, the result of space partition is finally determined according to the trade-offs/synergy relationship. Firstly, the trade-offs/synergies of LUF changes are divided into three types: no trade-offs between LUF changes, single-class trade-off of LUF changes, and multifunctional trade-offs. Among them, there is no trade-off relationship between LUF changes, indicating that there is a cooperative relationship or an unrelated relationship between LUFs. The single type of trade-off of LUF variation means that there are trade-offs between the dominant function of territorial space and other functions. The multifunctional trade-offs indicate that there are trade-offs between all LUF changes. Secondly, the layer with trade-offs/synergies of LUF changes was spatially overlaid with the dominant functional zoning layer to obtain the final functional zoning results (Figure 2). Specifically, synergistic development zones were designated for dominant functional areas without any trade-off relationships; optimization and guidance zones were assigned to dominant functional areas with a single type of trade-off relationship; and restoration and improvement zones were allocated to dominant functional areas with multifunctional trade-offs.

3. Results

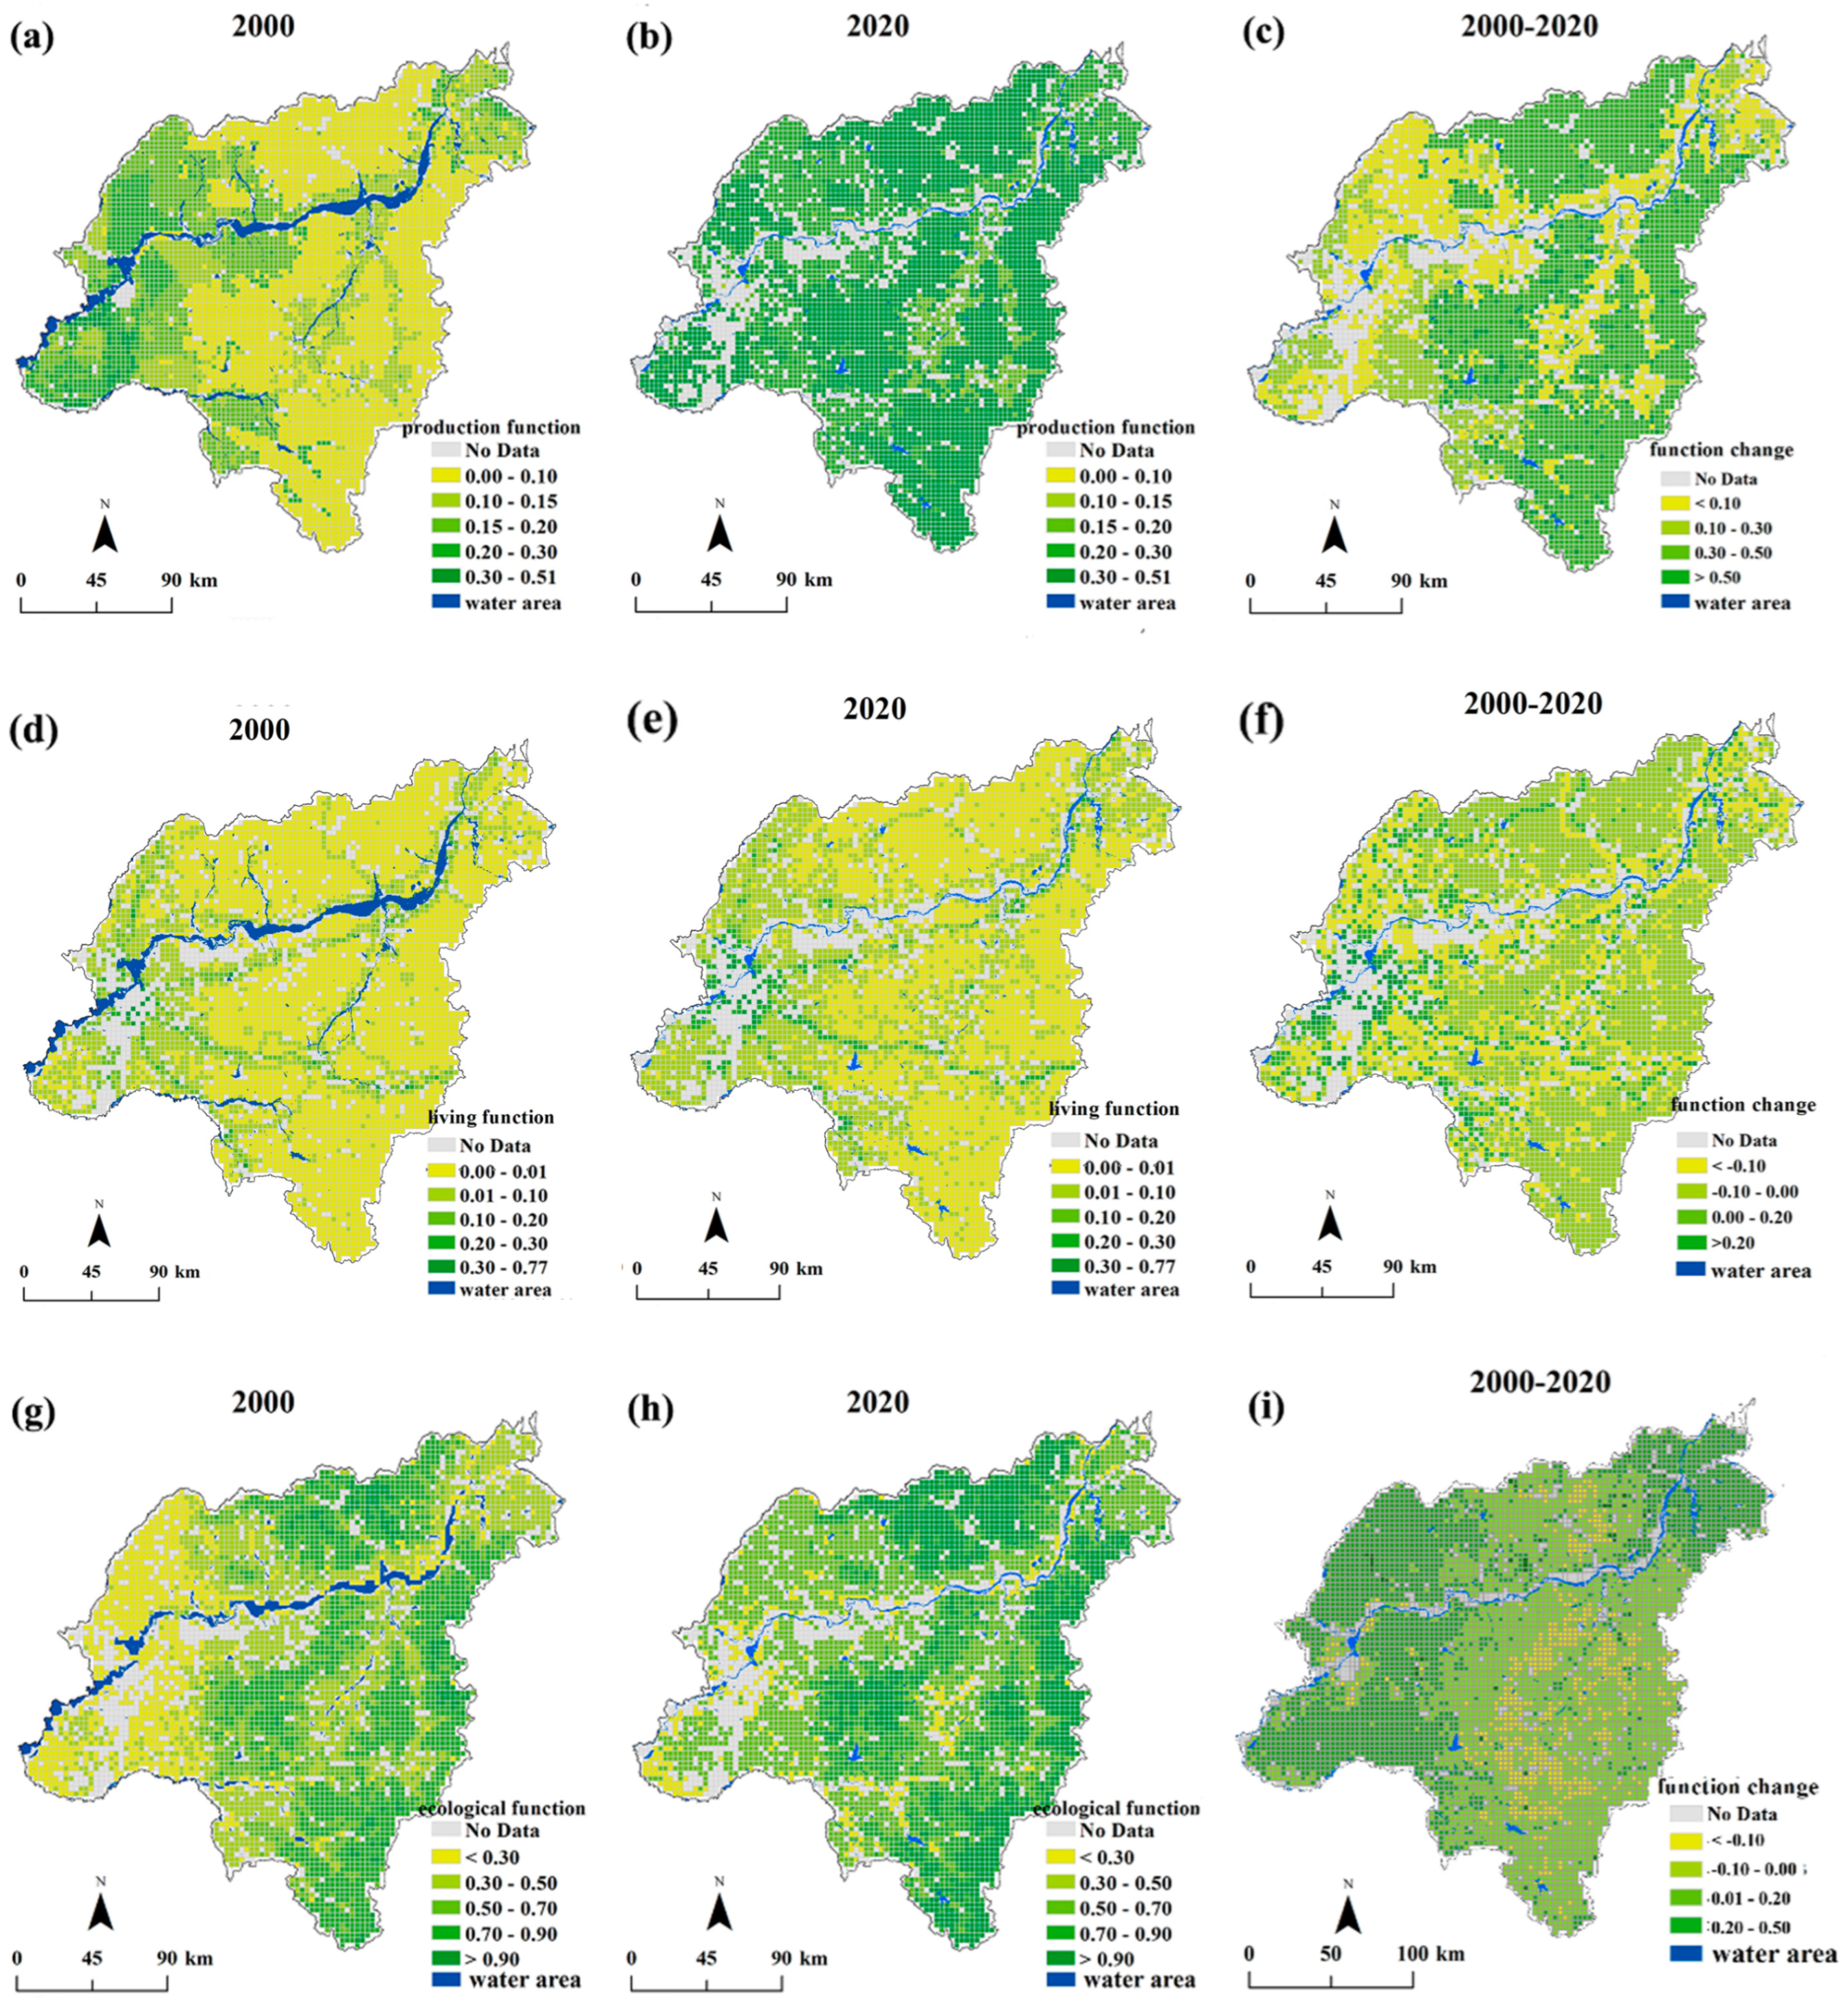
3.1. Spatio–Temporal Evolution of Land Use Multifunctions

According to the constructed “Production–Living–Ecology” function evaluation index system (Table 2), the multifunctional indices in 2000 and 2020 were measured by Equations (1)–(3). Due to the difficulty of obtaining the data of tidal flats and unused land, meanwhile some outliers in the improved mutation level method are eliminated, the land use function values in these areas are replaced by null values. The specific spatio–temporal distribution pattern was shown in Figure 3. The subsequent calculation of the trade-off/synergy relationship takes more consideration of the dynamic change in the land use function value in time, so the null value will not affect the identification of the trade-off/synergy relationship and the dominant functional zones.

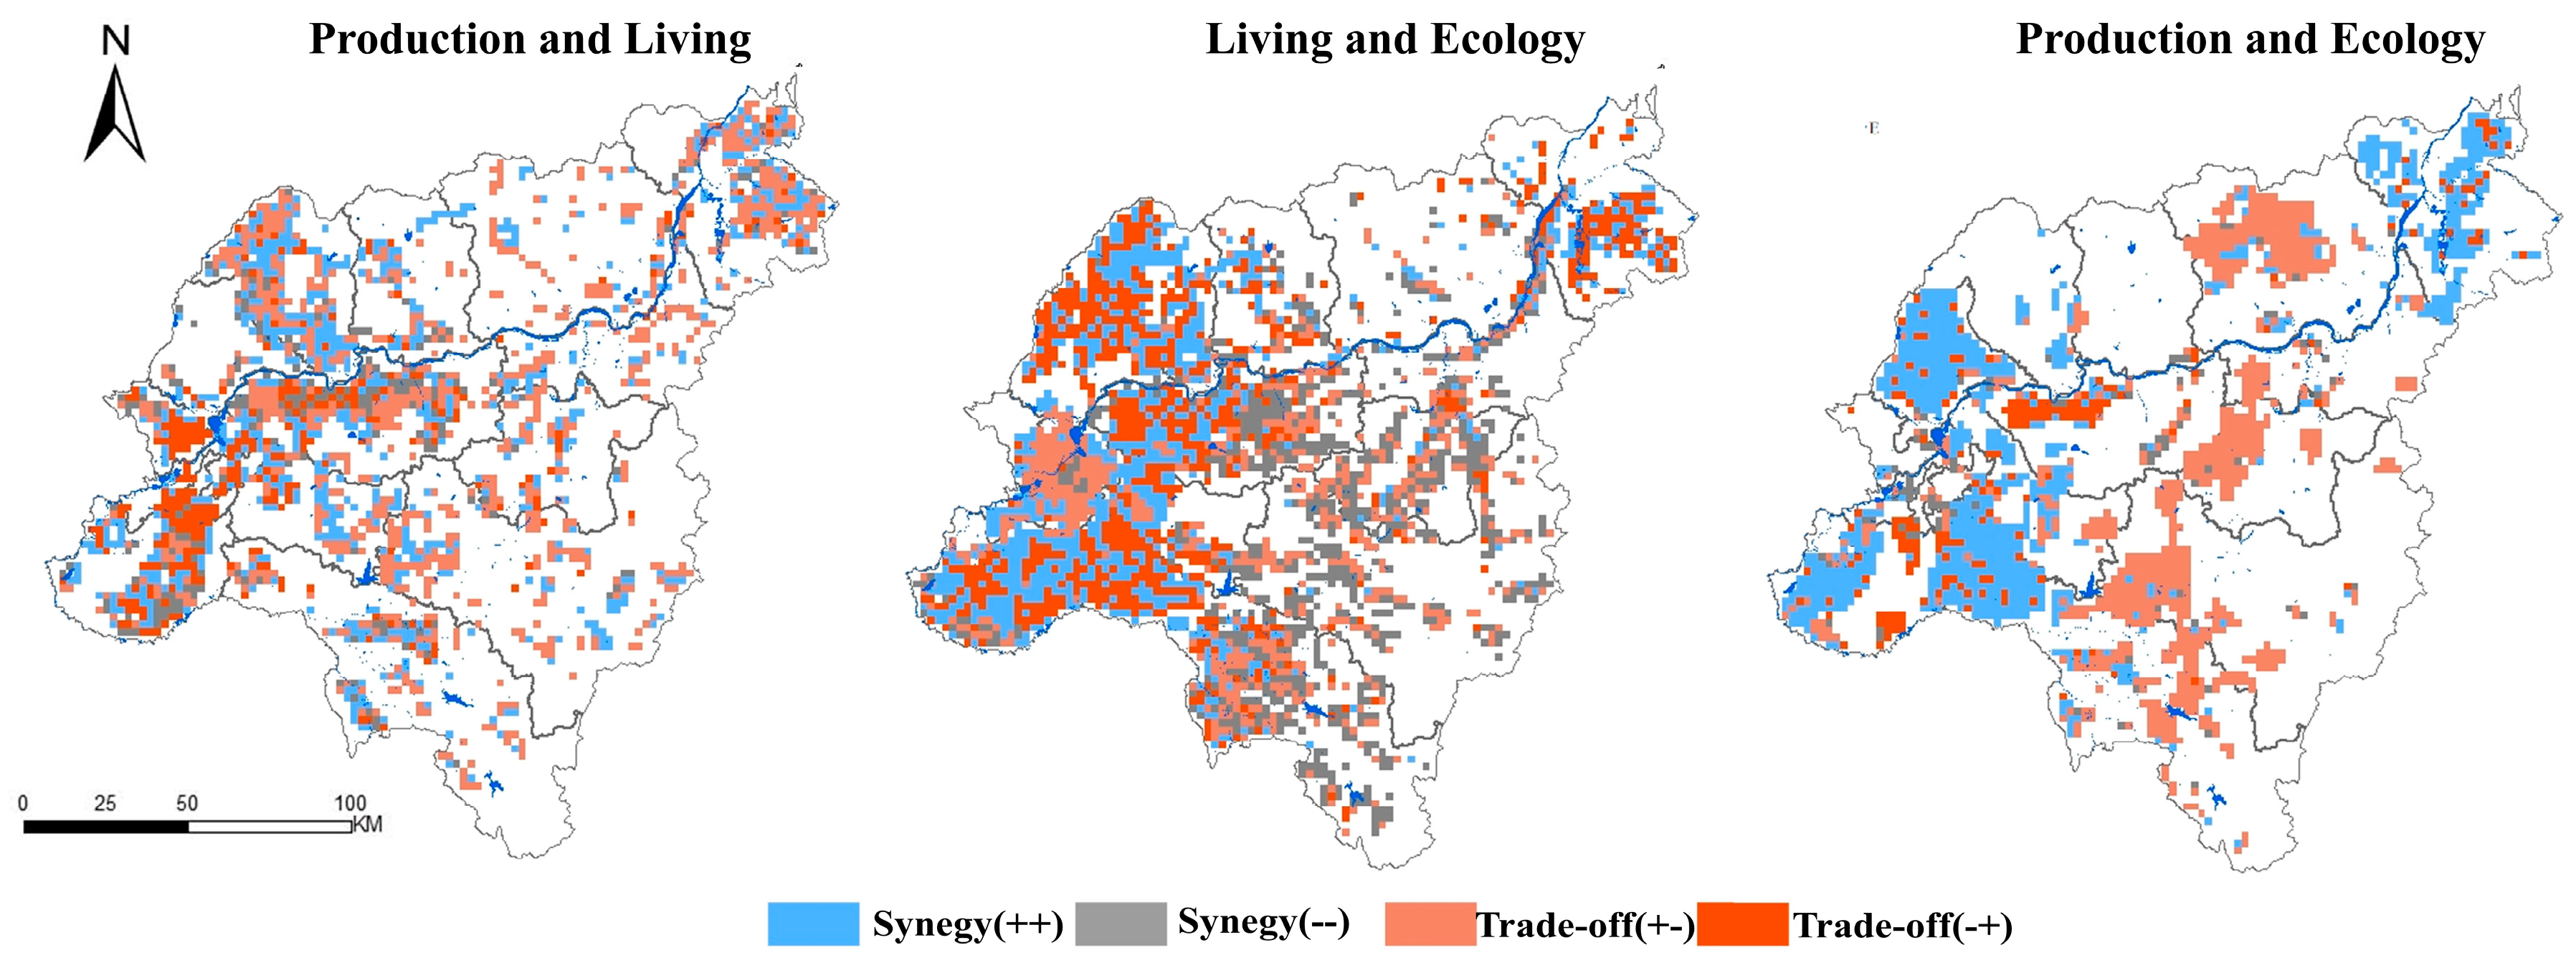
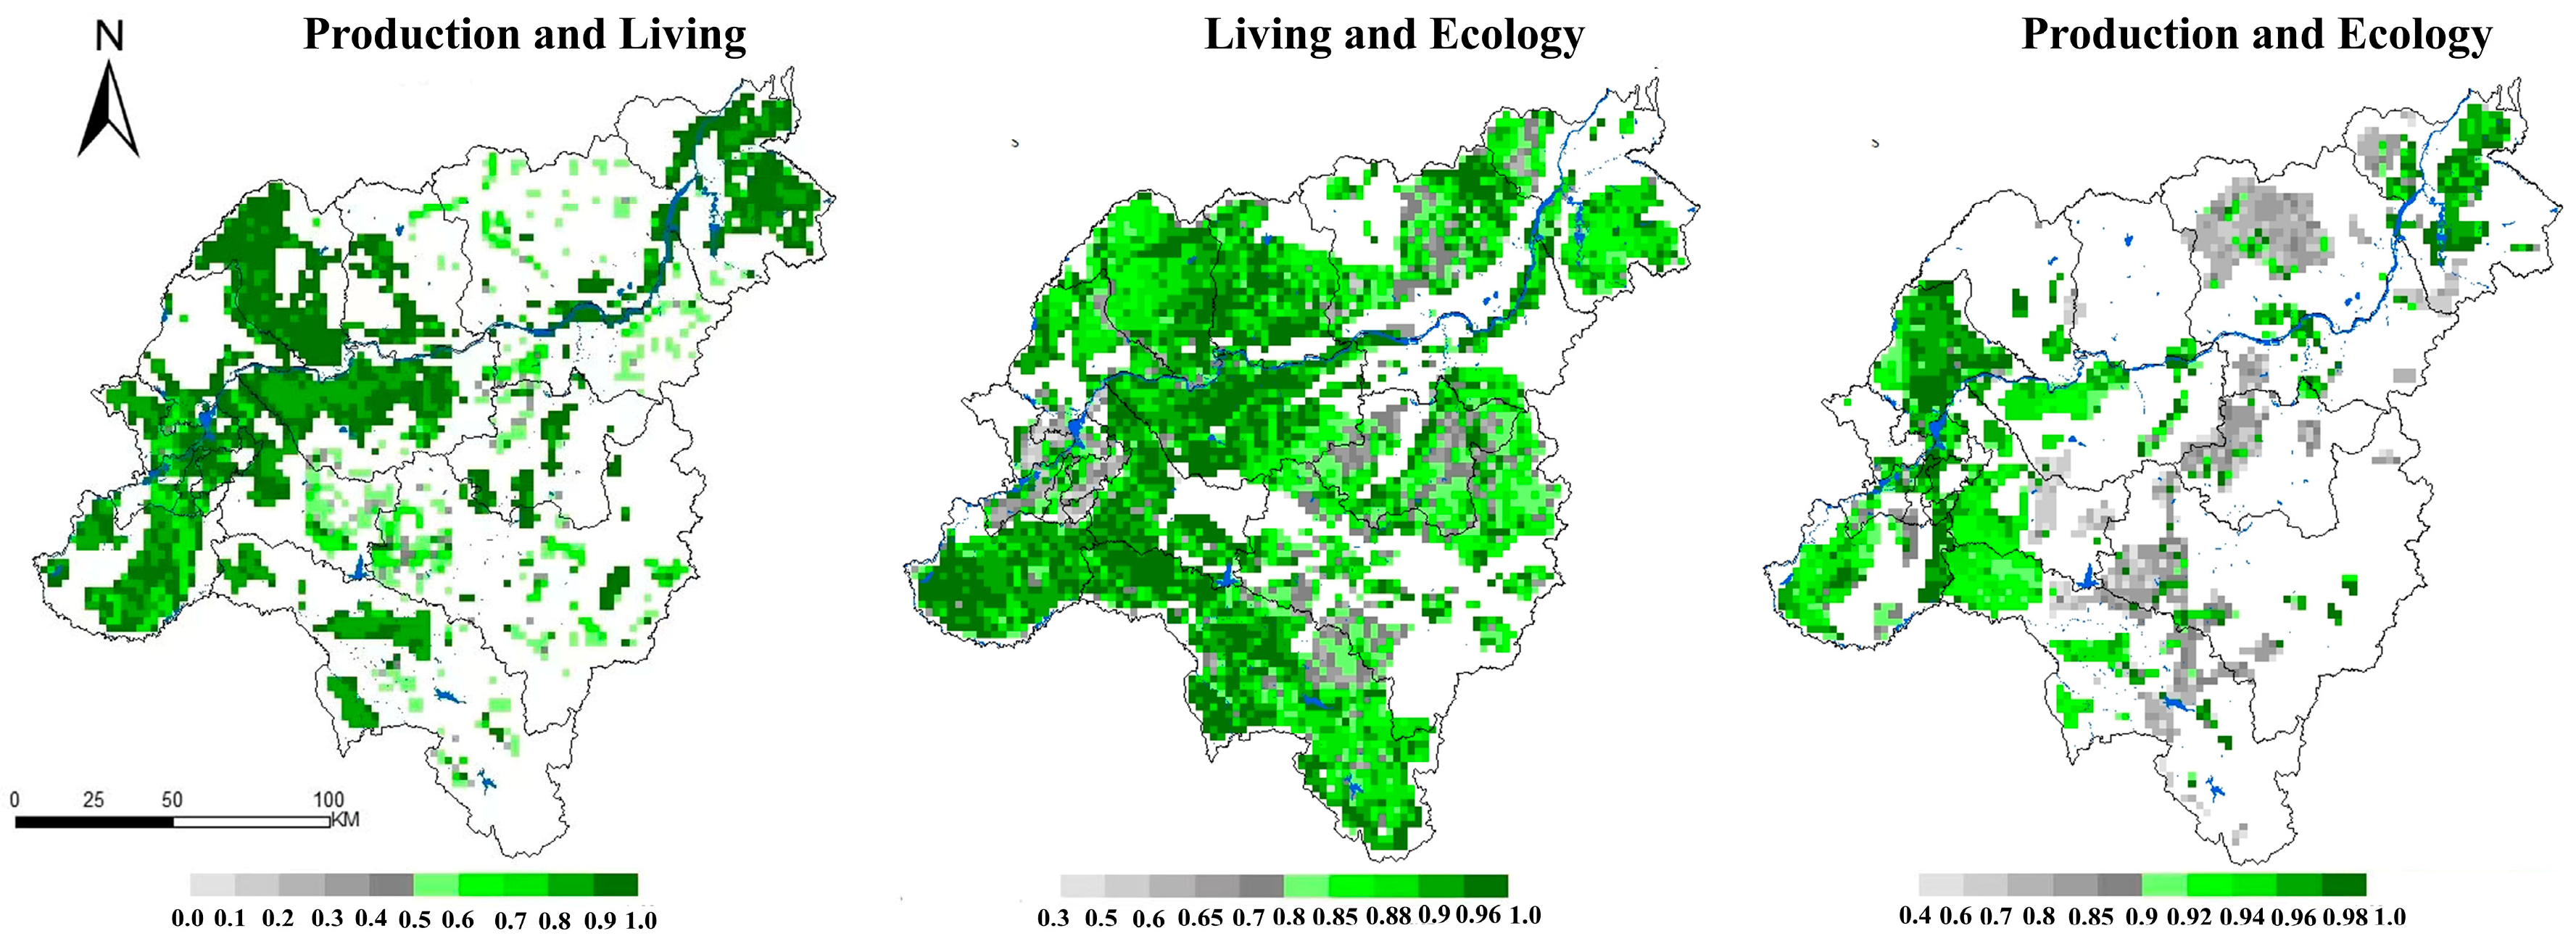
3.2. Trade-Off and Synergy Relationships between Multifunctions

The Spearman rank correlation coefficient model was used to assess the correlation between the two-way functions, as shown in Table 4. The type and strength of the trade-off and synergistic relationships were shown in Figure 4 and Figure 5, respectively.
Temporal dimension: Overall, there was a trade-off between the production–living–ecology functions in the study area, indicating an increasing prominence of conflicts among them. Specifically, the synergistic relationship observed between the production–living function in 2000 (coefficient = 0.489) had turned into a trade-off relationship in 2020 (coefficient = −0.414), indicating a gradual escalation of their contradiction over time. The trade-off relationship between the living–ecological function had remained constant; however, the trade-off coefficient had decreased from −0.641 in 2000 to −0.591 in 2020, suggesting a slight downward trend in conflict intensity. In addition, the production–ecological function shifted from a trade-off relationship (coefficient = −0.467) in 2000 to a synergistic relationship (coefficient = 0.691) in 2020, showing a clear inclination towards ecological or eco-industrial development. The correlation coefficients between the functional changes from 2000 to 2020 indicated that the intensity of change was highest (coefficient = −0.225) between the production and ecological functions, followed by a moderate intensity of change (coefficient = −0.087) between the production and living functions, while the lowest intensity of change (coefficient = 0.14) was observed between the living and ecological functions, indicating synergistic changes.
Spatial dimensions:
(1) The production–living function was predominantly characterized by a trade-off relationship (+−) with an area share of 13.7%, mainly distributed in the northwestern and northeastern regions of the study area, especially where the Xiaoxinganling Mountains merged with the plains. This was followed by a synergistic relationship (++) with an area share of 11.2%, which showed a more dispersed distribution pattern. There was also a trade-off type (−+), mainly concentrated in the periphery of Harbin City. In terms of spatial intensity distribution, trade-off relationships exhibited a significantly higher intensity than synergistic relationships.
(2) The spatial distribution of trade-offs and synergies in living–ecological functions was evenly distributed, with the trade-off area accounting for 24.2% and the synergy area for 24.8%. In the western part of the study area, the main urban area exhibited a trade-off (+−) pattern, while its periphery exhibits a nested pattern consisting of both trade-off (−+) and synergy (++) types, which were also concentrated in a small area in the northeastern corner of the study area. A mosaic pattern consisting of synergy (−−) and trade-off (+−) types was observed in the central low hills. In terms of distribution intensity, most parts of the study area showed high intensity levels in their trade-off/synergistic relationships, with greater intensity observed in the plains compared to the hills.
(3) The Living–ecological functions were predominantly expressed as synergistic (++) types, with sporadic occurrences of trade-off (−+) types within them in the plain area, and as trade-off (+−) types in the central low hill area. The proportions of synergistic and trade-off areas were 15.5% and 16.1%, respectively. In terms of distribution intensity, the distribution intensity of synergistic relationships was significantly higher than that of trade-off relationships in mountainous regions, while a decreasing gradient was observed from urban construction land to cultivated land.

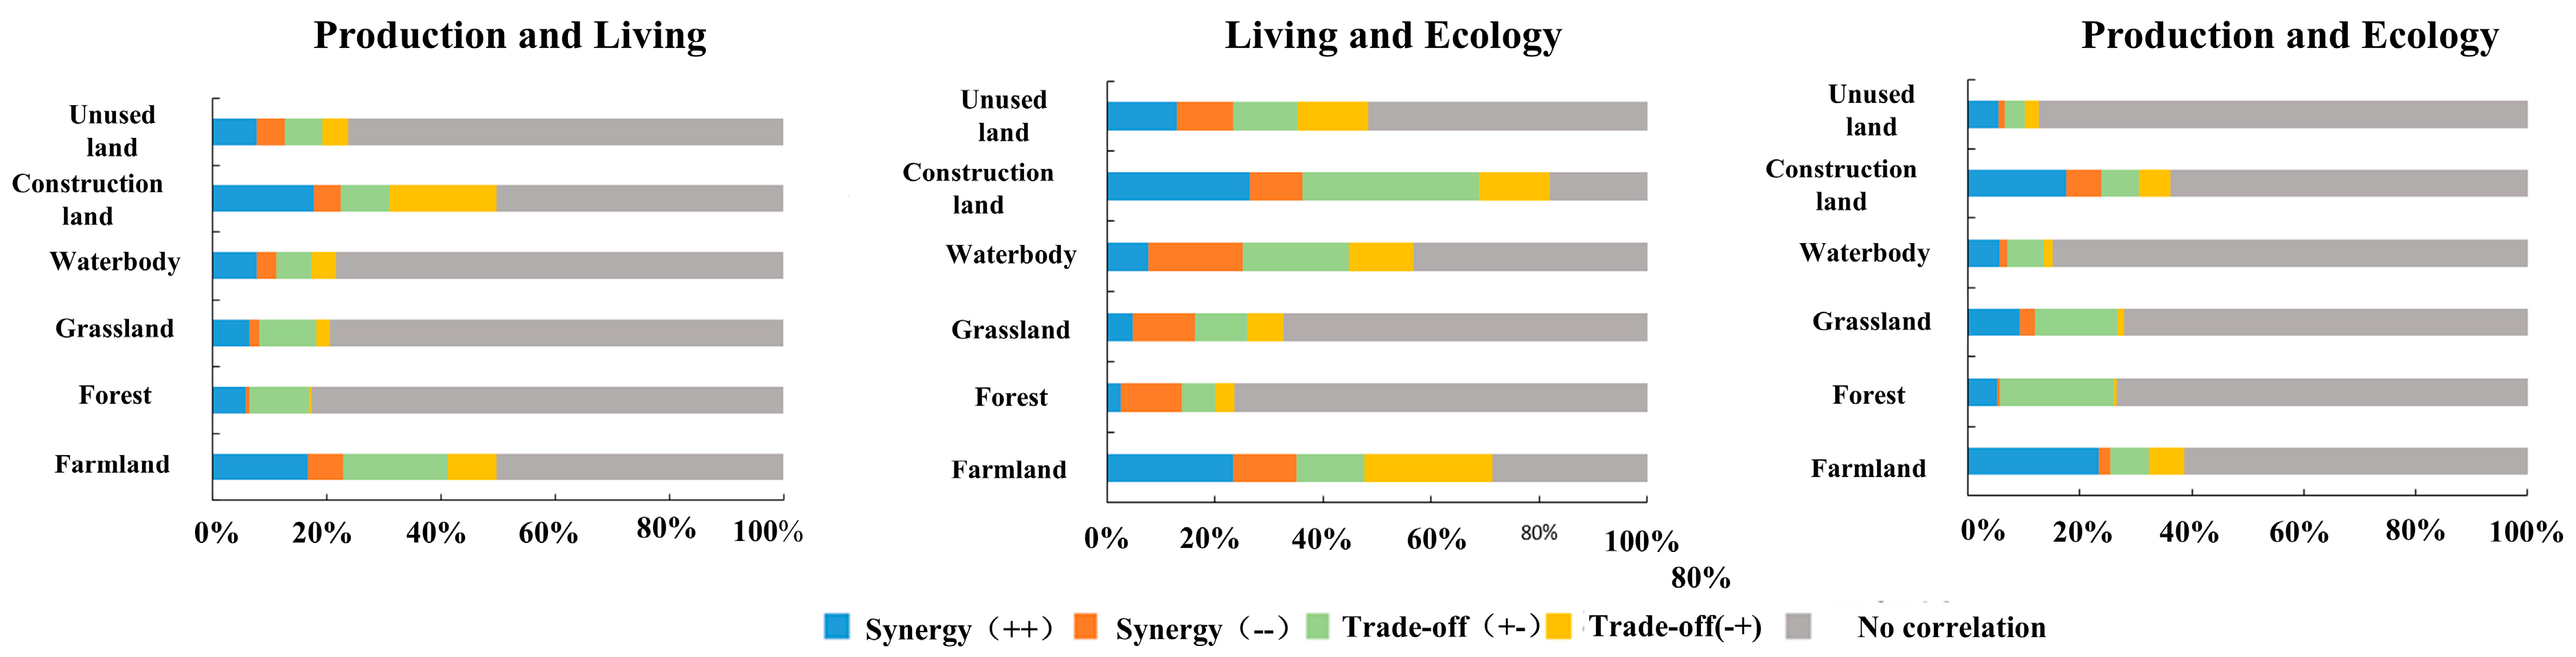
3.3. Trade-Off/Synergy Types of Multifunctions in Different Land Uses

(1) In terms of the production–living function, the highest proportion of trade-off area was found in construction land (27.4%), which was predominantly characterized by the trade-off (−+) type. Arable land followed with a trade-off area share of 27.1%, dominated by the trade-off (+−) type. The synergy relationship between these two types of land use was relatively balanced, both being dominated by the synergy (++) type (Figure 6).
(2) From a living–ecological function perspective, construction land exhibited the highest proportion of both trade-offs and synergies, accounting for 45.8% of trade-offs predominantly of the (+−) type, and 36.2% of synergies predominantly of the (++) type. Farmland ranked second with 36.3% of trade-offs predominantly of the (−+) type, and 35% of synergies predominantly of the (++) type.
(3) In terms of the production–living function, forest exhibited the highest proportion of trade-off area at 20.8%, predominantly characterized by the trade-off (+−) type. Grassland followed with 15.9% of its trade-off area, while arable land showed the largest share of synergistic area with 25.5%, mainly dominated by the synergistic (++) type, closely followed by built-up land with 23.9% of its total area.

3.4. Spatial Zoning Based on Multifunctions and Trade-Off/Synergy

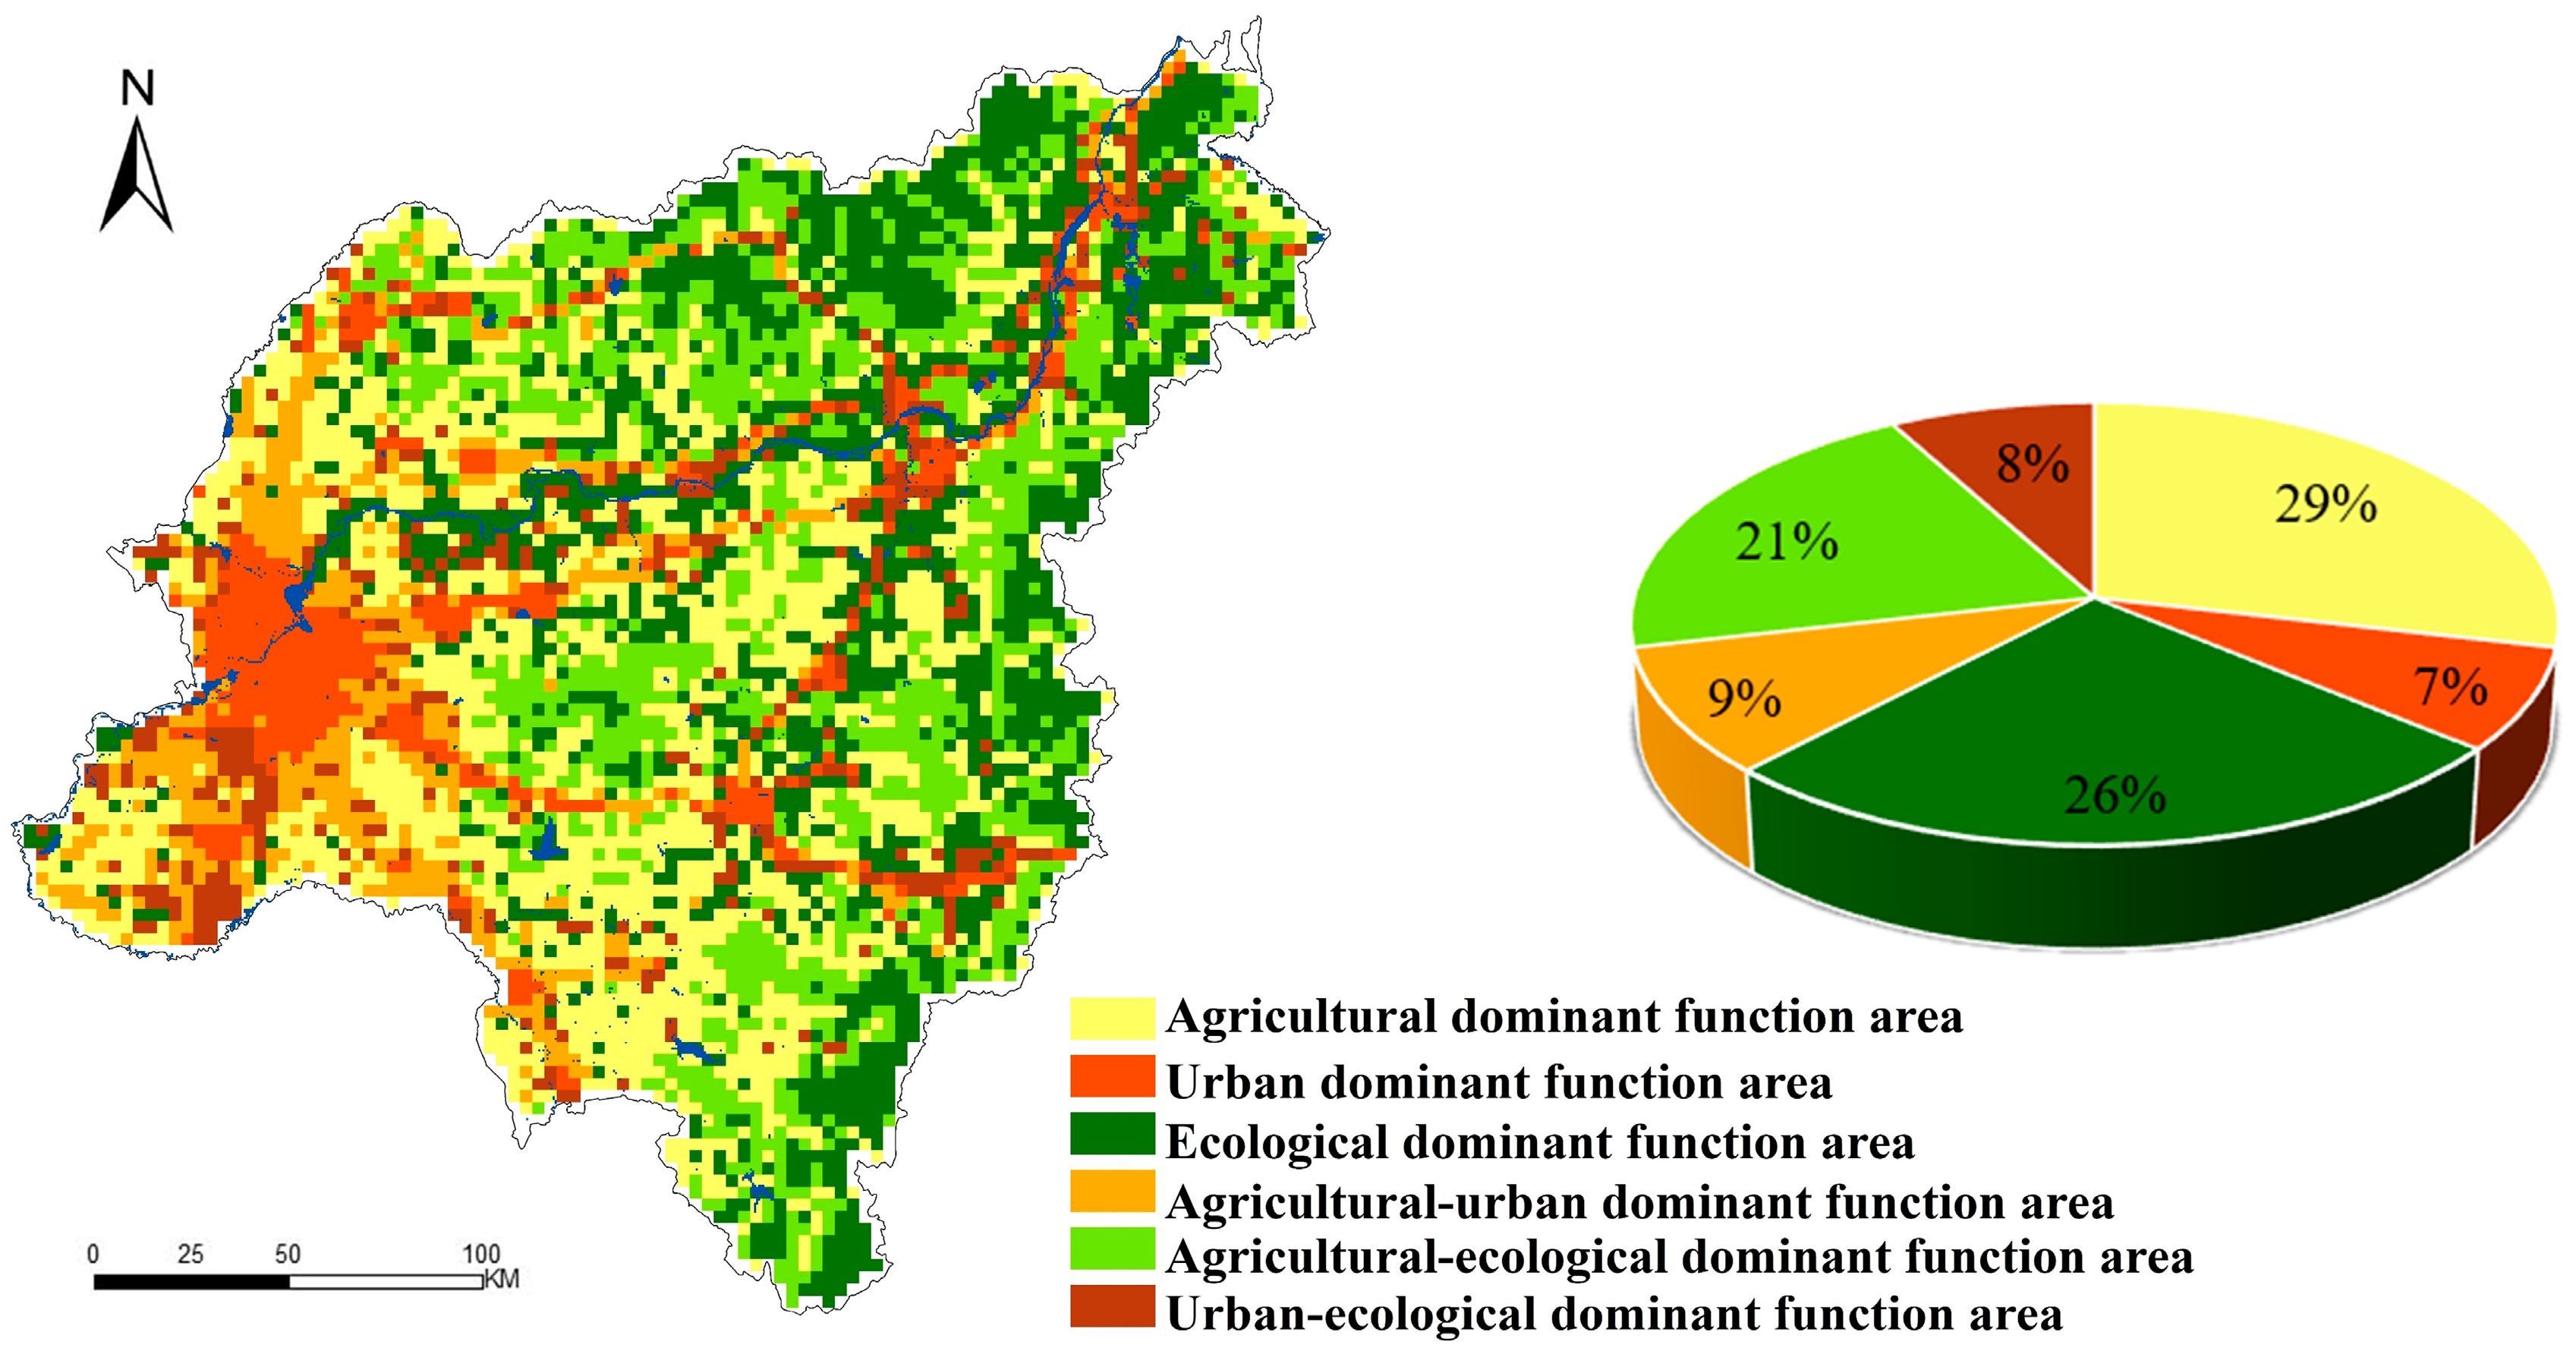
3.4.1. Identification of Dominant Functional Zones

The distinct dominant functional zones within Harbin were identified by means of the NRCA index, as illustrated in Figure 7.
(1) Agricultural dominant functional areas accounted for 29% of the total area, primarily distributed in the western plains and the transition zones from hills to plains. (2) Urban dominant functional areas constituted 7% of the total area, predominantly located in Harbin City. (3) Ecological dominant functional areas comprised 26% of the total area, mainly situated in the northern part of Lesser Khingan Mountains and southeastern periphery of Laoya Mountain. These regions possess high terrain elevation with minimal human interference and robust ecological protection measures. (4) Agricultural–urban dominant functional areas covered 9% of the total area, primarily arranged radially around urban dominant functional areas. (5) Agricultural–ecological dominant functional areas accounted for 21% of the total area, positioned between agricultural dominant functional areas and ecological dominant functional areas. (6) Urban–ecological dominant functional areas covered at least 8% of the total area, mainly aligned along transportation routes.

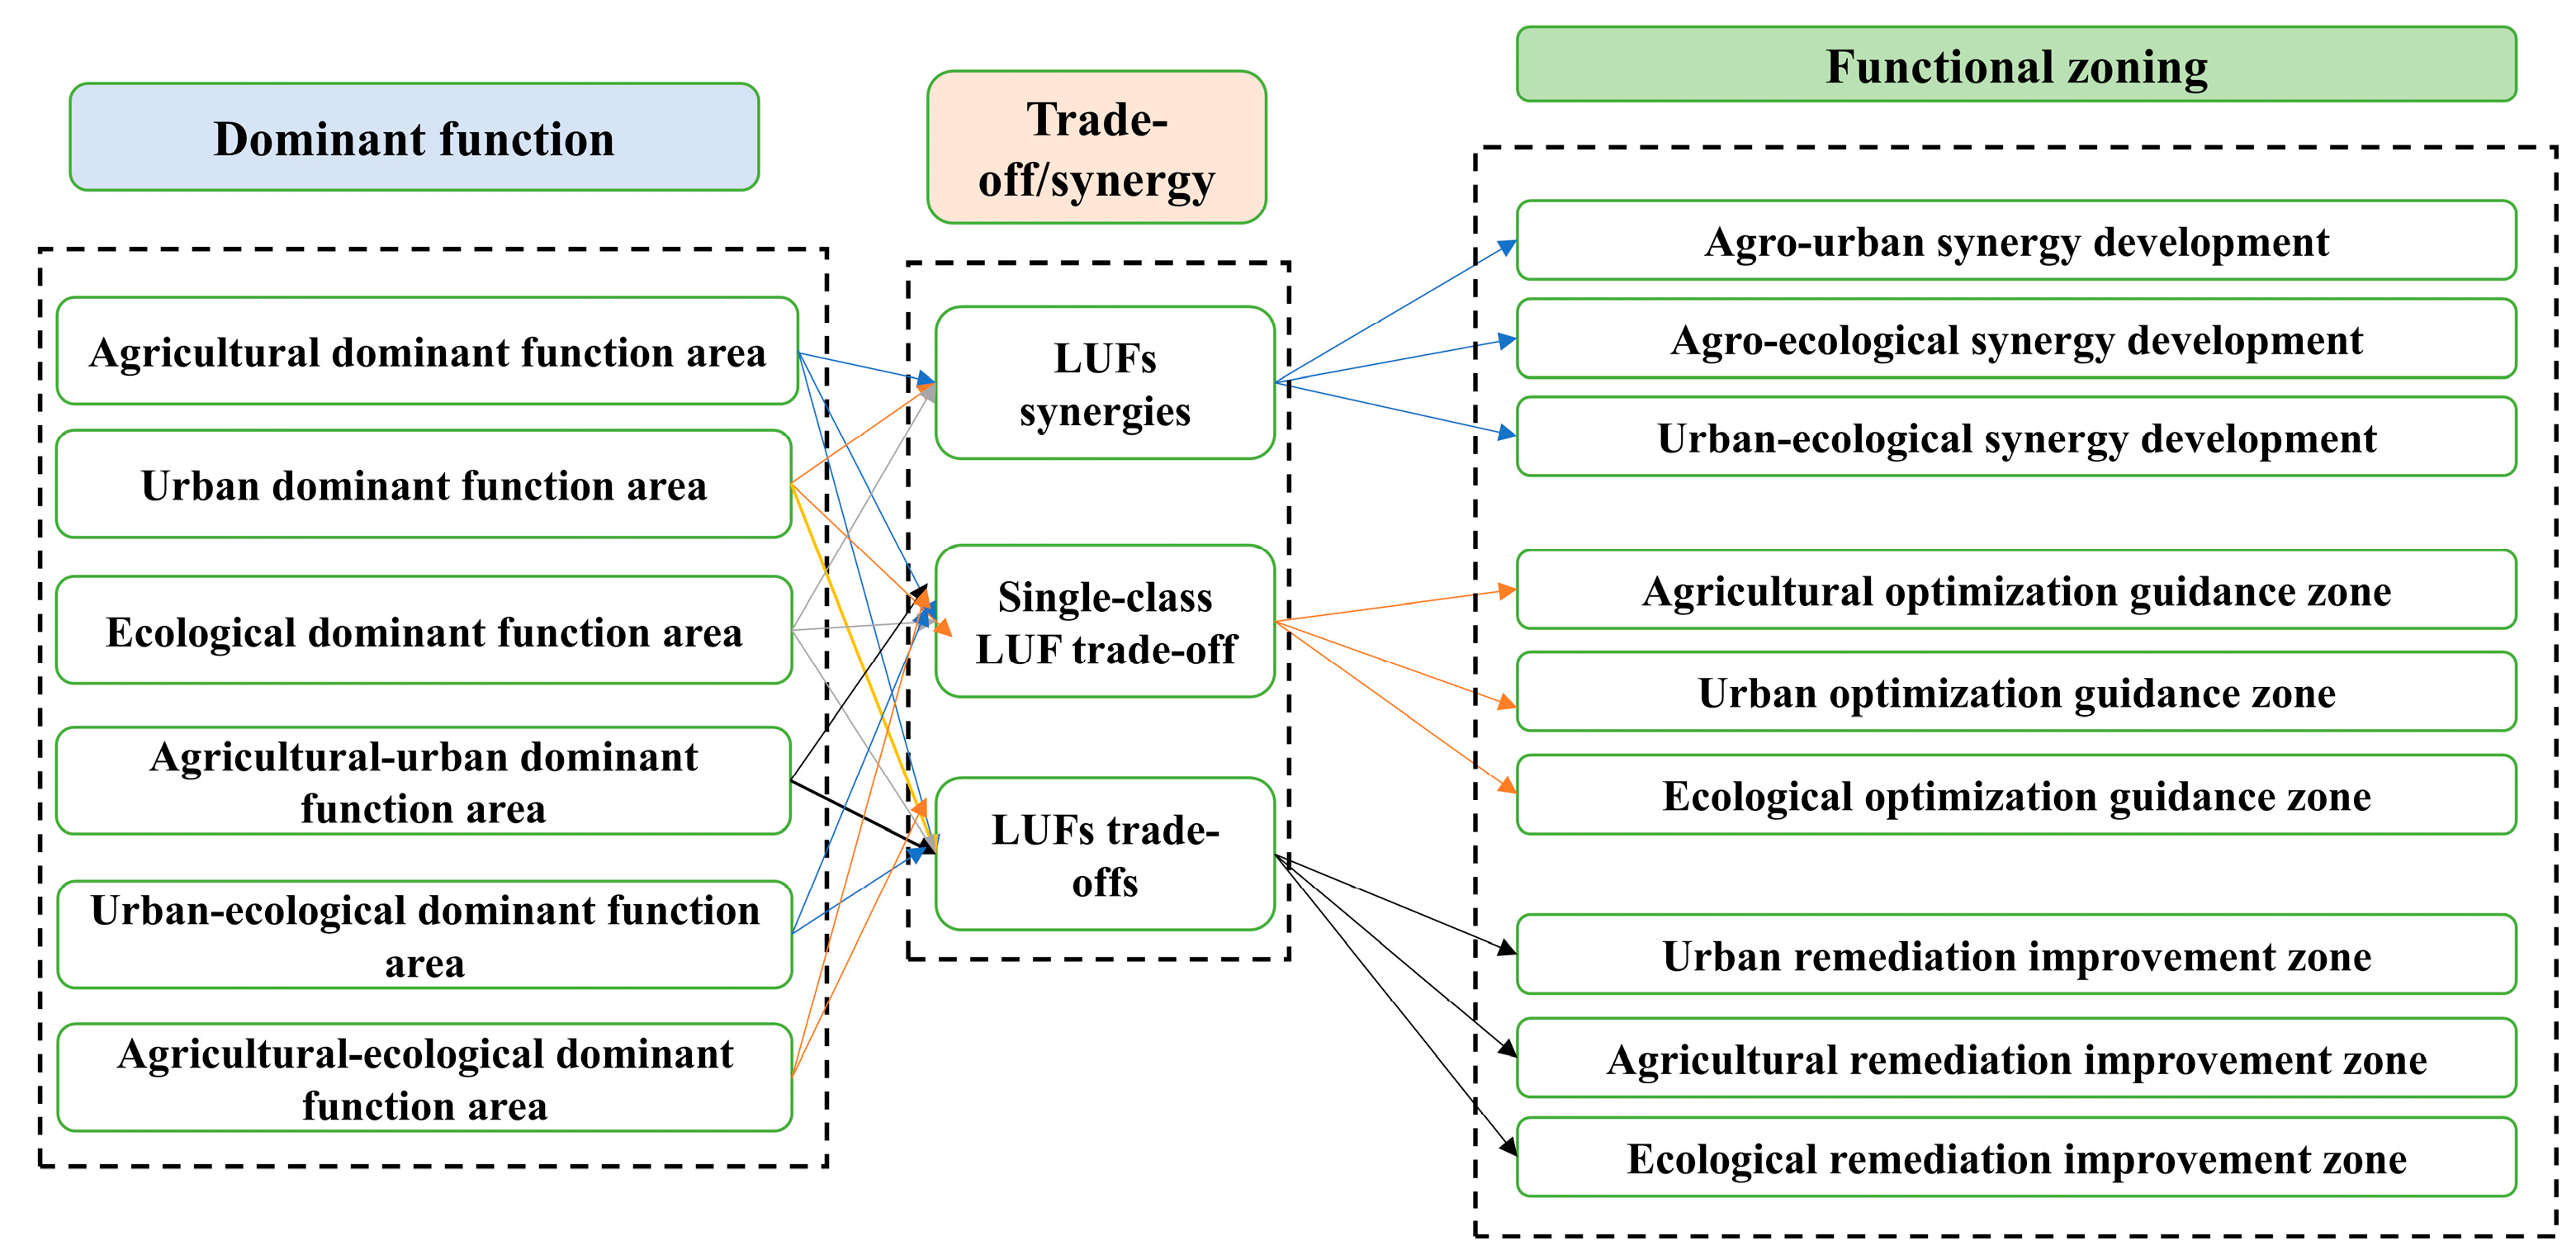
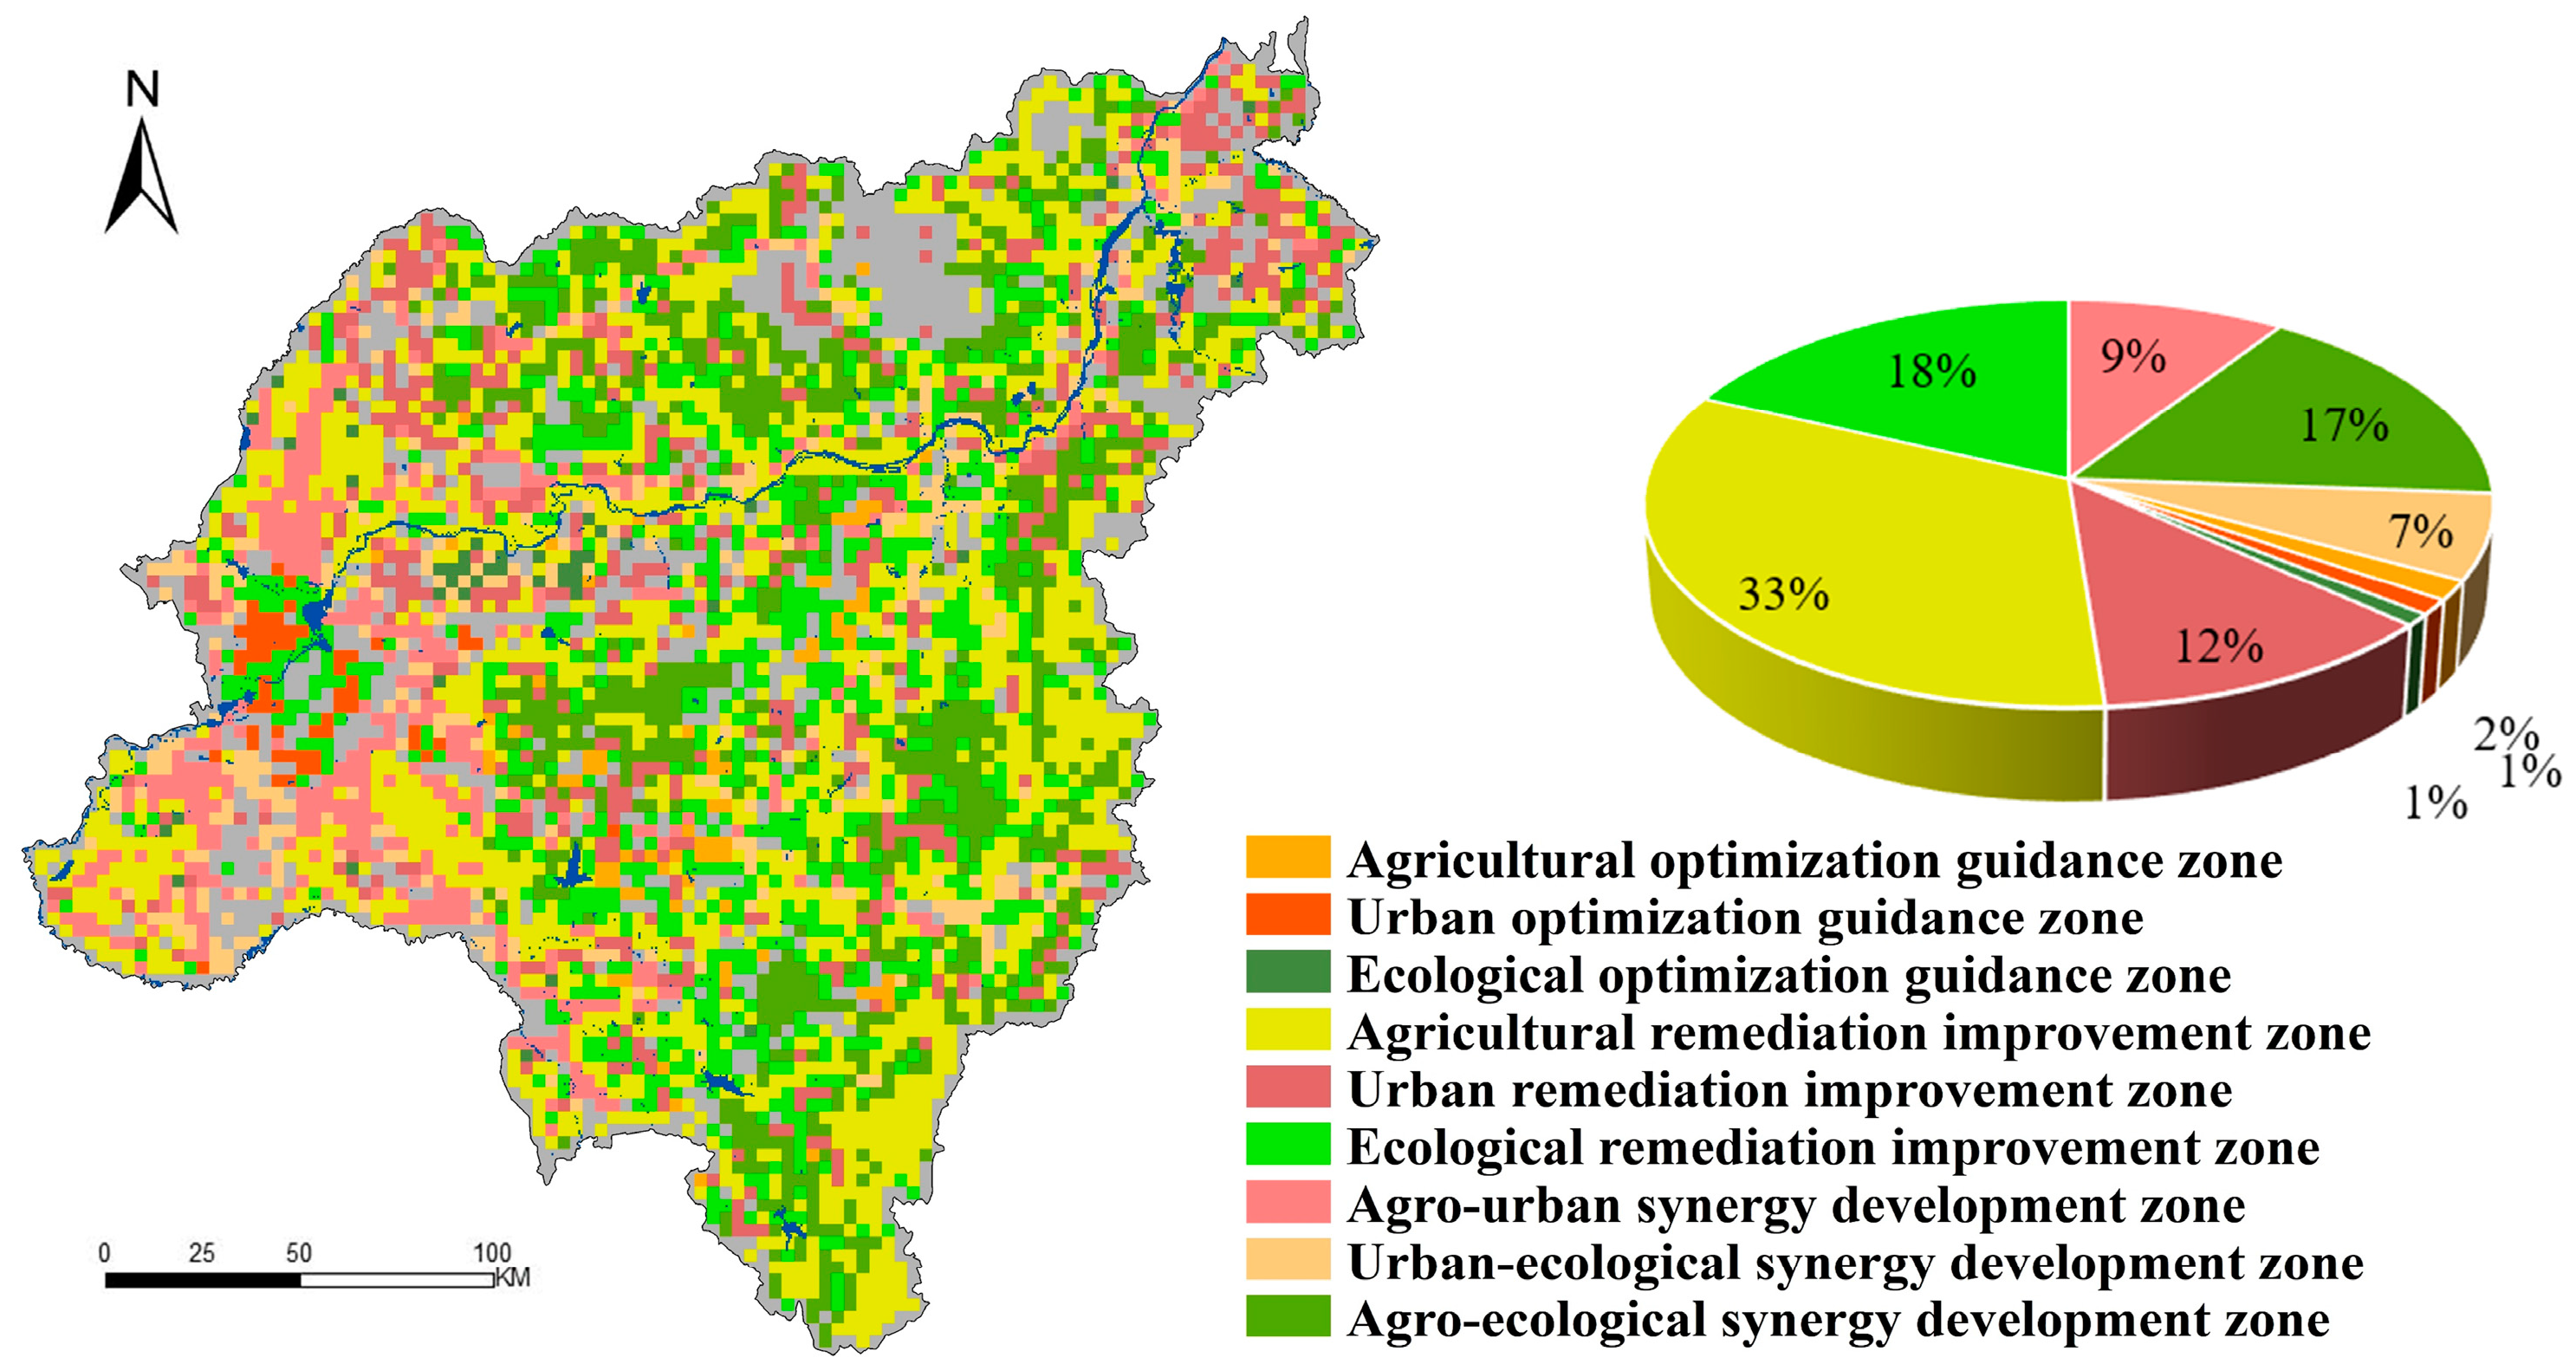
3.4.2. Integrated Territorial Spatial Functional Zoning

According to the classification rules in Figure 2, a total of nine grid-scale territorial spatial functional zones were classified in the study area, as shown in Figure 8. The gray area in the figure indicates that there is no obvious trade-off/synergy relationship between the land use function values (which has not passed the significance test in MGWR), so it is a null value in the spatial overlay analysis.
There were significant differences in the quantitative structure and spatial distribution of the nine spatial functional zones:
(1) The agricultural optimization and guidance zones, urban optimization and guidance zones, and ecological optimization and guidance zones constitute a relatively small proportion of the total area (2%, 1%, and 1%, respectively). Their distribution is rather sporadic, necessitating attention towards safeguarding and promoting their respective beneficial functions.
(2) The agricultural remediation improvement zones covered 33% of the total area, primarily located in the Songnen Plain in the western part of the study area and on sloping farmland in the central region where low hills transition into plains. Due to limited ecological land availability in the Songnen Plain and vulnerable habitats caused by soil erosion on sloping farmland within central low hills, sustainable agricultural development is severely constrained. Urban remediation improvement zones, accounting for approximately 12% of the total area, are primarily distributed around small towns. These areas require comprehensive improvement strategies based on factors such as population density, industrial development potential, and economic growth prospects. Ecological remediation improvement zones, covering about 18% of the total area, were located in ecologically dominant peripheral regions. These areas were susceptible to negative impacts from expanding industrial and agricultural activities and therefore required enhanced protection measures.
(3) The agricultural–urban synergistic development zones, urban–ecological synergistic development zones, and agricultural–ecological synergistic development zones exhibit a dispersed distribution pattern, encompassing approximately 30% of the total area. These regions demonstrate a more advanced model of agricultural production and management, leveraging the geographical advantages of central cities and counties to propel their economic growth while effectively fulfilling their ecological protection function.

4. Discussions

4.1. Mechanisms for Trade-Offs/Synergies of Land Use Multifunctions

Land use is a deliberate and systematic process aimed at managing and transforming land over the long term or in cycles [20,45]. A deeper understanding of the underlying mechanisms that govern trade-off/synergy between diverse functions can facilitate the systematic advancement of multifunctionality in land use [46]. Differences in human needs and preferences for different land use functions are at the root of multifunctional conflicts [47]. As shown in Figure 6, the land use functions exhibit intricate trade-off/synergy relationships across different land use types. The trade-off relationship between the production–living function and the production–ecological function in all land use types is predominantly characterized by a trade-off (+−) pattern. Conversely, only the living–ecological function in built-up areas is predominantly characterized by a trade-off (+−) pattern, while other land use types are predominantly characterized by a trade-off (−+) pattern. The study reveals that as society and economy progress, the phenomenon of production and living encroaching upon ecological space is gaining increasing significance. However, the concept of ecological civilization is gradually taking root in people’s consciousness, and the positive synergy between production–ecology and living–ecology is also emerging prominently. This finding is consistent with the conclusions of numerous studies [48,49], and further substantiates the complex trade-offs and synergistic relationships between land use functions arising from diverse needs and their dynamics in response to socio-economic development. From 2000 to 2010, Harbin underwent a period of rapid urbanization and agricultural intensification, with regional development primarily focusing on economic growth while neglecting ecological environmental protection. However, since 2015, driven by the ongoing advancement of ecological civilization construction, people’s materialistic pursuits have shifted towards a desire for a pristine ecology. As a result, the government has implemented a series of policies aimed at strengthening regional ecological environmental protection and restoration. In the spatial dimension, variations in topography and resource endowments, as well as divergent socio-economic development aspirations among regions, have resulted in heterogeneous regional trade-off/synergy types and their respective intensities, as shown in Figure 4 and Figure 5. The Songnen Plain in the west, with its exceptional soil and water resources, has evolved into an urban and agricultural agglomeration area characterized by intricate, high-intensity trade-off synergies. Conversely, the Lesser Khingan Mountains in the north, the Laoya Mountains in the southeast, and the low hills in the center are ecological conservation areas due to their undulating topography and dense forests. These areas primarily exhibit lower intensity of both production–ecological trade-off relationships (+−) and living–ecological synergy relationships (−−).

4.2. Land Use Multifunctional Zoning and Policy Suggestions

The identification and assessment of multifunctions contribute to the recognition of regional variations and dominance of land use functions, while trade-off/synergy analysis aids in identifying conflicts in land use [18,50]. The integration of both approaches provides a robust foundation for integrated territorial spatial functional zoning, facilitating coordinated sustainable development of socio-economic and land use systems [28,51]. The study area exhibits a substantial endowment of resources, with agricultural dominant, urban dominant, and ecological dominant functional zones accounting for 29%, 7%, and 26% of the region, respectively. Collectively, these zones encompass approximately 62% of the total area. However, owing to the intricate trade-offs/synergies inherent in land use multifunctions, only a mere 2% (agricultural), 1% (urban), and 1% (elological) of the area were identified as Optimization Guidance Zones. Conversely, Remediation Improvement Zones constituted the largest share at 63% of the total area, with agricultural, urban, and ecological Remediation Improvement Zones accounting for approximately 33%, 12%, and 18%, respectively.
The Agricultural Remediation Improvement Zones primarily encompass the Songnen Plain in the western region, as well as sloping farmlands located within the central hilly and low mountains. Given the limited ecological land availability in the Songnen Plain, exacerbated by urban expansion, intensified agricultural production, and climate warming and drying trends, arable land use faces the dilemma of high intensity use, vulnerability to drought, and the risk of agricultural non-point source pollution. The central hilly and low mountains are characterized by severe soil erosion and represent a typical area of black soil degradation in the north east, exhibiting a highly vulnerable eco-environment. Therefore, the sustainable development of agriculture in these regions is severely constrained. Hence, it is imperative to enhance the optimal allocation of soil and water resources, establish robust ecological networks, implement comprehensive measures for agricultural non-point pollution prevention and control, as well as undertake integrated initiatives to mitigate soil and water erosion in small watersheds, etc. The Urban Remediation Improvement Zones are primarily concentrated around small towns. Due to disparities in resource allocation and socio-economic development, these regions experience significant population mobility and low industrial efficiency. Therefore, comprehensive upgrading strategies should be formulated based on factors such as population density and potential for industrial and agricultural development. The Ecological Remediation Improvement Zones are primarily situated in peripheral regions with distinct ecological advantages. These areas are vulnerable to urban expansion and socio-economic development, resulting in unstable land use functions. Therefore, it is imperative to reinforce legal and policy protection measures while promoting the green transformation of the economy and the conversion of ecological resource assets within the region.
In practical management, the natural resource management department needs to integrate different management tools, especially in areas where land use conflicts are more intense. Planning, as a policy tool, plays a pivotal role in the regulation and optimization of land use. Adhering to the principle of prioritizing planning fosters the implementation of macro-level land use zoning and facilitates the effective integration of scientific research with practical application. China has successfully implemented comprehensive national spatial planning across all levels, encompassing not only meticulous land resource plans but also strategic frameworks for future sustainable development and ecological equilibrium. Currently, efforts are focused on further promoting modernized territorial spatial governance within this overarching blueprint while ensuring its efficient execution. The findings from this study can offer valuable decision-making support for subsequent refinement of territorial spatial governance. Farmers, urban dwellers, governments, developers, and other stakeholders play crucial roles in the process of land development and utilization [51]. However, conflicting interests often arise among these actors, leading to heightened land use disputes. The primary objective of conflict management is to facilitate mutual understanding among diverse perspectives and foster collaborative relationships for reaching coherent decisions on land development [52]. Achieving this necessitates the active participation of all stakeholders. Last but not least, appropriate entry criteria or boundaries are an important prerequisite for differentiated management. Establish a comprehensive standard system incorporating mandatory indicators, developmental indicators (development intensity, plot ratio), and holistic indicators to enhance land utilization efficiency and promote sustainable human–land relationships.

4.3. Advantages and Limitations

The present study integrates Pearson correlation analysis, the Improved Mutation Level Method and the Comparative Advantage Theory to conduct refined territorial spatial functional zoning at the grid scale, thereby providing precise decision support for regional territorial spatial planning and sustainable development [53,54]. The results demonstrate that there is a complex trade-off/synergy relationship among the production–living–ecological functions of land use. The types and intensity of these trade-offs/synergies vary with socio-economic development and disparities in resource endowments across regions. These findings further substantiate that conflicting land use functions stem from divergent human needs and preferences. In contrast to research on integrated territorial spatial control zoning based on land use multifications at administrative boundary scales, this paper uncovers the spatial and temporal evolution characteristics of multifunctional trade-off/synergistic relationships and identifies Optimization Guidance Zones, Remediation Improvement Zones, as well as Synergy Development Zones at a grid scale.
Above findings provide a more accurate basis for decision-making in sustainable development management [55,56]. However, due to limitations in data accessibility and spatialization of indicators, this study has only selected eleven evaluation indicators from production, life, and ecology categories to construct a multifunctional evaluation indicator system, resulting in somewhat preliminary evaluation results. In the future, it is necessary to further refine additional indicators based on the integration of multi-source data to enhance the accuracy of the evaluation results. Furthermore, due to space constraints, this study did not analyze the prediction and early warning of land use functions under different future development scenarios. Therefore, more research should be conducted in this area to provide a robust decision-making foundation for integrated territorial spatial functional control zoning.

5. Conclusions

Taking Harbin City as a case study, this paper employed an improved mutation level method, Pearson correlation analysis, multi-scale geographically weighted regression model, and NRCA index to conduct the identification of land use multifunctions and their trade-offs/synergies at a grid scale, as well as integrated territorial spatial functional zoning. The key findings are summarized below.
(1) From 2000 to 2020, the production function exhibited an upward trend, with a concentration of growth in the forest areas. The change in the living function was not statistically significant, while the ecological function primarily resided within the forest and displayed a slight declining pattern. Overall, there was a trade-off relationship among the production–living–ecology functions. This conflict between them was relatively prominent and had undergone dynamic changes over the past two decades.
(2) The production–living function was predominantly characterized by a trade-off (−+) pattern in the plains and a trade-off (+−) pattern in the low hills, with a significantly higher intensity of the trade-off relationship compared to the synergistic relationship. The living–ecological function exhibited a nested pattern of both trade-off (−+) and synergy (++) relationships in the plains, while displaying synergy (−−) and trade-off (+−) relationships in the low hills, with higher intensity observed for both. The production–ecological function primarily manifested as a synergistic (++) relationship in the plains and trade-off (+−) in the low hills, with much a stronger intensity of synergistic relationships compared to that of trade-offs.
(3) The study area exhibits a substantial endowment of resources, with agricultural dominant, urban dominant, and ecological dominant functional zones accounting for 29%, 7%, and 26% of the region, respectively. Collectively, these zones encompass approximately 62% of the total area. However, owing to the intricate trade-offs/synergies inherent in land use multifunctions, only a mere 2% (agricultural), 1% (urban), and 1% (ecological) of the area were identified as Optimization Guidance Zones. Conversely, Remediation Improvement Zones constituted the largest share at 63% of the total area, with agricultural, urban, and ecological Remediation Improvement Zones accounting for approximately 33%, 12%, and 18%, respectively. The diverse requirements and preferences of humans for various land use functions have resulted in ongoing conflicts regarding land multifunctions. Therefore, it is imperative to harmonize territorial spatial planning and sustainable development strategies by considering regional resource endowments, topography, climate conditions, and socio-economic progress.
(4) Although the article has some limitations, it provides a zoning scheme reference for the improvement of territory spatial planning and management. There are still some important directions for future research that can be further explored. Such as the improvement of multi-source data and assessment methods. Massive high-resolution remote sensing data can also be used for fine quantification of LUFs. Another focus is the optimization of the territorial spatial functional zoning scheme. Because of the complexity of the actual situation, the study of territorial spatial regionalization still faces many challenges from academic research to practical operation. The connection and transmission of functional zones and control rules is the key to improving the territorial space planning and management.

Author Contributions

Conceptualization, F.G. and Y.Z. (Yafang Zhao); methodology, Y.Z. (Yafang Zhao) and J.Z.; software, Y.Z. (Yafang Zhao) and F.G.; resources, X.Z. and H.L.; data curation, Y.Z. (Yafang Zhao); writing—original draft preparation, Y.Z. (Yafang Zhao) and J.L.; writing—review and editing, J.L.; visualization, Y.Z. (Yucheng Zhan); supervision, J.L. All authors have read and agreed to the published version of the manuscript.

Funding

This research was funded by National Natural Science Foundation of China (U21A20238) and Heilongjiang Provincial Key Laboratory of Soil Protection and Remediation.

Institutional Review Board Statement

Not applicable.

Informed Consent Statement

Not applicable.

Data Availability Statement

The data presented in this study are available on request from the corresponding author. The data are not publicly available due to the ongoing nature of the research.

Acknowledgments

We thank our colleagues for their insightful comments on an earlier version of this manuscript.

Conflicts of Interest

The authors declare no conflicts of interest.

References

  1. Wiggering, H.; Dalchow, C.; Glemnitz, M.; Helming, K.; Müller, K.; Schultz, A.; Stachow, U.; Zander, P. Indicators for multifunctional land use—Linking socio-economic requirements with landscape potentials. Ecol. Indic. 2006, 6, 238–249. [Google Scholar] [CrossRef]
  2. Pérez-Soba, M.; Petit, S.; Jones, L.; Bertrand, N.; Briquel, V.; Omodei-Zorini, L.; Contini, C.; Helming, K.; Farrington, J.H.; Mossello, M.T.; et al. Land use functions—A multifunctionality approach to assess the impact of land use changes on land use sustainability. In Sustainability Impact Assessment of Land Use Changes; Springer: Berlin/Heidelberg, Germany, 2008; pp. 375–404. [Google Scholar]
  3. Mustard, J.F.; Defries, R.S.; Fisher, T.; Moran, E. Land-use and land-cover change pathways and impacts. In Land Change Science: Observing, Monitoring and Understanding Trajectories of Change on the Earth’s Surface; Springer: Berlin/Heidelberg, Germany, 2012; pp. 411–429. [Google Scholar]
  4. Qu, Y.; Long, H. The economic and environmental effects of land use transitions under rapid urbanization and the implications for land use management. Habitat Int. 2018, 82, 113–121. [Google Scholar] [CrossRef]
  5. Liang, C.; Penghui, J.; Manchun, L.; Liyan, W.; Yuan, G.; Yuzhe, P.; Nan, X.; Yuewei, D.; Yuewei, D.; Qiuhao, H. Farmland protection policies and rapid urbanization in China: A case study for Changzhou City. Land Use Policy 2015, 48, 552–566. [Google Scholar] [CrossRef]
  6. Scanes, C.G. Human activity and habitat loss: Destruction, fragmentation, and degradation. In Animals and Human Society; Elsevier: Amsterdam, The Netherlands, 2018; pp. 451–482. [Google Scholar]
  7. Long, H.; Kong, X.; Hu, S.; Li, Y.J.L. Land use transitions under rapid urbanization: A perspective from developing China. Land 2021, 10, 935. [Google Scholar] [CrossRef]
  8. Johansen, P.H.; Ejrnæs, R.; Kronvang, B.; Olsen, J.V.; Præstholm, S.; Schou, J.S.; Johansen, S.K. Exploring the interdisciplinary potential of the Agenda2030—Interactions between five Danish societal demands for sustainable land use. Land Use Policy 2020, 94, 104501. [Google Scholar] [CrossRef]
  9. Meng, J.; Cheng, H.; Li, F.; Han, Z.; Wei, C.; Wu, Y.; You, N.W.; Zhu, L. Spatial-temporal trade-offs of land multi-functionality and function zoning at finer township scale in the middle reaches of the Heihe River. Land Use Policy 2022, 115, 106019. [Google Scholar] [CrossRef]
  10. Liu, C.; Xu, Y.; Huang, A.; Liu, Y.; Wang, H.; Lu, L.; Sun, P.; Zheng, W. Spatial identification of land use multifunctionality at grid scale in farming-pastoral area: A case study of Zhangjiakou City, China. Habitat Int. 2018, 76, 48–61. [Google Scholar] [CrossRef]
  11. Aznar-Sánchez, J.A.; Piquer-Rodríguez, M.; Velasco-Muñoz, J.F.; Manzano-Agugliaro, F. Worldwide research trends on sustainable land use in agriculture. Land Use Policy 2019, 87, 104069. [Google Scholar] [CrossRef]
  12. Li, S.; Zhu, C.; Lin, Y.; Dong, B.; Chen, B.; Si, B.; Li, Y.; Deng, X.; Gan, M.; Zhang, J.; et al. Conflicts between agricultural and ecological functions and their driving mechanisms in agroforestry ecotone areas from the perspective of land use functions. J. Clean. Prod. 2021, 317, 128453. [Google Scholar] [CrossRef]
  13. Wang, L.; Hu, Q.; Liu, L.; Yuan, C.J.L. Land Use Multifunctions in Metropolis Fringe: Spatiotemporal Identification and Trade-Off Analysis. Land 2022, 12, 87. [Google Scholar] [CrossRef]
  14. Schößer, B.; Helming, K.; Wiggering, H. Assessing land use change impacts—A comparison of the SENSOR land use function approach with other frameworks. J. Land Use Sci. 2010, 5, 159–178. [Google Scholar] [CrossRef]
  15. Fan, Y.; Gan, L.; Hong, C.; Jessup, L.H.; Jin, X.; Pijanowski, B.C.; Sun, Y.; Lv, L. Spatial identification and determinants of trade-offs among multiple land use functions in Jiangsu Province, China. Sci. Total Environ. 2021, 772, 145022. [Google Scholar] [CrossRef] [PubMed]
  16. Tu, S.; Long, H.; Zhang, Y.; Ge, D.; Qu, Y. Rural restructuring at village level under rapid urbanization in metropolitan suburbs of China and its implications for innovations in land use policy. Habitat Int. 2018, 77, 143–152. [Google Scholar] [CrossRef]
  17. Gao, Y.; Wang, Z.; Xu, F. Geospatial characteristics and the application of land use functions in the Yangtze River Economic Belt, China: Perspectives on provinces and urban agglomerations. Ecol. Indic. 2023, 155, 110969. [Google Scholar] [CrossRef]
  18. De Groot, R.J.L. Function-analysis and valuation as a tool to assess land use conflicts in planning for sustainable, multi-functional landscapes. Landsc. Urban Plan. 2006, 75, 175–186. [Google Scholar] [CrossRef]
  19. Lovell, S.T. Multifunctional urban agriculture for sustainable land use planning in the United States. Sustainability 2010, 2, 2499–2522. [Google Scholar] [CrossRef]
  20. Paracchini, M.L.; Pacini, C.; Jones, M.L.M.; Pérez-Soba, M. An aggregation framework to link indicators associated with multifunctional land use to the stakeholder evaluation of policy options. Ecol. Indic. 2011, 11, 71–80. [Google Scholar] [CrossRef]
  21. Hu, W.; Zhang, S.; Song, Y.; Liu, T.; Lin, Y.; Zhang, A. Effects of Multifunctional Rural Land Use on Residents’ Wellbeing: Evidence from the Xinzhou District of Wuhan City, China. Sustainability 2018, 10, 3787. [Google Scholar] [CrossRef]
  22. Zhu, A.X.; Lu, G.; Liu, J.; Qin, C.Z.; Zhou, C. Spatial prediction based on Third Law of Geography. Ann. GIS 2018, 24, 225–240. [Google Scholar] [CrossRef]
  23. Lyu, Y.; Wang, M.; Zou, Y.; Wu, C. Mapping trade-offs among urban fringe land use functions to accurately support spatial planning. Sci. Total Environ. 2022, 802, 149915. [Google Scholar] [CrossRef] [PubMed]
  24. Fan, Y.; Jin, X.; Gan, L.; Jessup, L.H.; Pijanowski, B.C.; Lin, J.; Yang, Q.; Lyu, L. Dynamics of spatial associations among multiple land use functions and their driving mechanisms: A case study of the Yangtze River Delta region, China. Environ. Impact Assess. Rev. 2022, 97, 106858. [Google Scholar] [CrossRef]
  25. Wang, Y.; Cheng, L.; Zheng, Y.; Wang, J.; Cui, H. Evolution of land use functions and their trade-offs/synergies relationship in resource-based cities. Ecol. Indic. 2024, 165, 112175. [Google Scholar] [CrossRef]
  26. Gao, Y.; Wang, Z.; Zhang, L.; Chai, J. Spatial identification and multilevel zoning of land use functions improve sustainable regional management: A case study of the Yangtze River Economic Belt, China. Environ. Sci. Pollut. Res. 2023, 30, 27782–27798. [Google Scholar] [CrossRef]
  27. Luo, J.; Zhang, X.; Shi, P. Land Use Multi-Functionality and Zoning Governance Strategy of Densely Populated Areas in the Upper Reaches of the Yellow River: A Case Study of the Lanzhou–Xining Region, China. Land 2022, 11, 897. [Google Scholar] [CrossRef]
  28. Zhang, Y.; Long, H.; Tu, S.; Ge, D.; Ma, L.; Wang, L. Spatial identification of land use functions and their tradeoffs/synergies in China: Implications for sustainable land management. Ecol. Indic. 2019, 107, 105550. [Google Scholar] [CrossRef]
  29. Vlek, P.L.; Azadi, H.; Bhaduri, A.; Bharati, L.; Braimoh, A.; Martius, C.; Sunderland, T.C.; Taheri, F. The trade-offs in multi-purpose land use. Land degradation and the Sustainable Development Goals. In Land Degradation and the Sustainable Development Goals: Threats and Potential Remedies; International Centre for Tropical Agriculture (CIAT): Cali, Colombia, 2018. [Google Scholar]
  30. Yang, Y.; Ren, X.; Yan, J. Trade-offs or synergies? Identifying dynamic land use functions and their interrelations at the grid scale in urban agglomeration. Cities 2023, 140, 104384. [Google Scholar] [CrossRef]
  31. Rallings, A.M.; Smukler, S.M.; Gergel, S.E.; Mullinix, K. Towards multifunctional land use in an agricultural landscape: A trade-off and synergy analysis in the Lower Fraser Valley, Canada. Landsc. Urban Plan. 2019, 184, 88–100. [Google Scholar] [CrossRef]
  32. Zhu, C.; Dong, B.; Li, S.; Lin, Y.; Shahtahmassebi, A.; You, S.; Zhang, J.; Gan, M.; Yang, L.; Wang, K. Identifying the trade-offs and synergies among land use functions and their influencing factors from a geospatial perspective: A case study in Hangzhou, China. J. Clean. Prod. 2021, 314, 128026. [Google Scholar] [CrossRef]
  33. Huang, S.; Wang, Y.; Liu, R.; Jiang, Y.; Qie, L.; Pu, L. Identification of land use function bundles and their spatiotemporal trade-offs/synergies: A case study in Jiangsu coast, China. Land 2022, 11, 286. [Google Scholar] [CrossRef]
  34. Han, Z.; Meng, J.; Zhu, L.; Cheng, H.; Wu, Y.; Wei, C. Quantifying trade-offs of land multifunctionality evaluated by set pair analysis in ecologically vulnerable areas of northwestern China. Land Degrad. Dev. 2022, 33, 1999–2013. [Google Scholar] [CrossRef]
  35. Xue, M.; Wang, H.; Wei, Y.; Ma, C.; Yin, Y. Spatial characteristics of land use multifunctionality and their trade-off/synergy in urumqi, China: Implication for land space zoning management. Sustainability 2022, 14, 9285. [Google Scholar] [CrossRef]
  36. Zhang, J.; Li, S.; Lin, N.; Lin, Y.; Yuan, S.; Zhang, L.; Zhu, J.; Wang, K.; Gan, M.; Zhu, C. Spatial identification and trade-off analysis of land use functions improve spatial zoning management in rapid urbanized areas, China. Land Use Policy 2022, 116, 106058. [Google Scholar] [CrossRef]
  37. Liu, Y.; Zhou, Y. Territory spatial planning and national governance system in China. Land Use Policy 2021, 102, 105288. [Google Scholar] [CrossRef]
  38. Liu, J.; Jin, X.; Xu, W.; Yang, F.; Wang, S.; Zhou, Y. Assessing trade-offs and synergies among multiple land use functional efficiencies: Integrating ideal reference and key indicators for sustainable landscape management. Appl. Geogr. 2023, 158, 103037. [Google Scholar] [CrossRef]
  39. Li, B.; Chen, D.; Wu, S.; Zhou, S.; Wang, T.; Chen, H. Spatio-temporal assessment of urbanization impacts on ecosystem services: Case study of Nanjing City, China. Ecol. Indic. 2016, 71, 416–427. [Google Scholar] [CrossRef]
  40. Li, Q.; Zhou, Y.; Xu, T.; Wang, L.; Zuo, Q.; Liu, J.; Su, X.; He, N.; Wu, Z. Trade-offs/synergies in land-use function changes in central China from 2000 to 2015. Chin. Geogr. Sci. 2021, 31, 711–726. [Google Scholar] [CrossRef]
  41. Liu, C.; Xu, Y.; Lu, X.; Han, J. Trade-offs and driving forces of land use functions in ecologically fragile areas of northern Hebei Province: Spatiotemporal analysis. Land Use Policy 2021, 104, 105387. [Google Scholar] [CrossRef]
  42. Cao, K.; Batty, M.; Huang, B.; Liu, Y.; Yu, L.; Chen, J. Spatial multi-objective land use optimization: Extensions to the non-dominated sorting genetic algorithm-II. Int. J. Geogr. Inf. Sci. 2011, 25, 1949–1969. [Google Scholar] [CrossRef]
  43. Meyfroidt, P.; Lambin, E.F.; Erb, K.-H.; Hertel, T. Globalization of land use: Distant drivers of land change and geographic displacement of land use. Curr. Opin. Environ. Sustain. 2013, 5, 438–444. [Google Scholar] [CrossRef]
  44. Xu, L.; Dong, J.; Li, L.; Zhang, J. Characteristics and optimization of geographical space in urban agglomeration in the middle reaches of the Yangtze River based on the function zoning. Econ. Geogr. 2017, 37, 76–83. [Google Scholar]
  45. Ahern, J. Spatial concepts, planning strategies, and future scenarios: A framework method for integrating landscape ecology and landscape planning. In Landscape Ecological Analysis: Issues and Applications; Springer: Berlin/Heidelberg, Germany, 1999; pp. 175–201. [Google Scholar]
  46. Wang, L.; Zheng, H.; Wen, Z.; Liu, L.; Robinson, B.E.; Li, R.; Li, C.; Kong, L. Ecosystem service synergies/trade-offs informing the supply-demand match of ecosystem services: Framework and application. Ecosyst. Serv. 2019, 37, 100939. [Google Scholar] [CrossRef]
  47. Sayer, J.; Sunderland, T.; Ghazoul, J.; Pfund, J.-L.; Sheil, D.; Meijaard, E.; Venter, M.; Boedhihartono, A.K.; Day, M.; Garcia, C.; et al. Ten principles for a landscape approach to reconciling agriculture, conservation, and other competing land uses. Proc. Natl. Acad. Sci. USA 2013, 110, 8349–8356. [Google Scholar] [CrossRef] [PubMed]
  48. Li, X.; Fang, B.; Yin, R.; Rong, H. Spatial-temporal change and collaboration/trade-off relationship of” production-living-ecological” functions in county area of Jiangsu province. J. Nat. Resour. 2019, 34, 2363–2377. [Google Scholar]
  49. Qing, K.; Guo, Q.; Yi, D.; Yang, Z. Tradeoffs/synergies analysis of” Production-Living-Ecological” functions in Shanxi province. J. Nat. Resour. 2021, 36, 1195–1207. [Google Scholar]
  50. Zou, L.; Liu, Y.; Wang, J.; Yang, Y. An analysis of land use conflict potentials based on ecological-production-living function in the southeast coastal area of China. Ecol. Indic. 2021, 122, 107297. [Google Scholar] [CrossRef]
  51. Van Broekhoven, S.; Vernay, A. Integrating functions for a sustainable urban system: A review of multifunctional land use and circular urban metabolism. Sustainability 2018, 10, 1875. [Google Scholar] [CrossRef]
  52. Skogen, K.J.S.; Resources, N. Adapting adaptive management to a cultural understanding of land use conflicts. Soc. Nat. Resour. 2003, 16, 435–450. [Google Scholar] [CrossRef]
  53. Queiroz, C.; Meacham, M.; Richter, K.; Norström, A.V.; Andersson, E.; Norberg, J.; Peterson, G. Mapping bundles of ecosystem services reveals distinct types of multifunctionality within a Swedish landscape. AMBIO 2015, 44, 89–101. [Google Scholar] [CrossRef] [PubMed]
  54. Peng, J.; Hu, X.; Qiu, S.; Meersmans, J.; Liu, Y. Multifunctional landscapes identification and associated development zoning in mountainous area. Sci. Total Environ. 2019, 660, 765–775. [Google Scholar] [CrossRef] [PubMed]
  55. Zhou, D.; Xu, J.; Lin, Z. Conflict or coordination? Assessing land use multi-functionalization using production-living-ecology analysis. Sci. Total Environ. 2017, 577, 136–147. [Google Scholar] [CrossRef] [PubMed]
  56. Qu, Y.; Wu, M.; Zhan, L.; Shang, R. Multifunctional Evolution and Allocation Optimization of Rural Residential Land in China. Land 2023, 12, 339. [Google Scholar] [CrossRef]
Figure 1. Location of Harbin.
Land 13 01092 g001
Figure 2. Rules for the functional zoning of the territorial space.
Land 13 01092 g002
Figure 3. (ai) Spatio–temporal distribution of ”Production–Living–Ecology” functions.
Land 13 01092 g003
Figure 4. Trade-off/synergy type of multifunctions in land use.
Land 13 01092 g004
Figure 5. Trade-off/synergy strength of multifunctions in land use.
Land 13 01092 g005
Figure 6. Trade-off/synergy types of multifunctions in different land uses.
Land 13 01092 g006
Figure 7. Spatial pattern of dominant functional zones.
Land 13 01092 g007
Figure 8. Territorial spatial functional zones in the study area.
Land 13 01092 g008
Table 1. Data sources and description.
Data NameData FormatsData Sources
Land use/cover dataRaster data (30 m × 30 m)Data Center for Resources and Environmental Sciences, Chinese Academy of Sciences
(RESDC) (https://www.resdc.cn/) (accessed on 12 April 2024)
NDVIRaster data (30 m × 30 m)Land Processes Distributed Active Archive Center (https://Ipdaac.usgs.gov/) (accessed on 12 April 2024)
Road netsVector data (1:10,000)Harbin Bureau of Planning and Natural Resources Department of Natural
DMSP/OLS night-time lightRaster data (1000 m × 1000 m/500 m × 500 m)Data Center for Resources and Environmental Sciences, Chinese Academy of Sciences (RESDC) (https://www.resdc.cn/) (accessed on 12 April 2024)
SoilVector data (1000 m × 1000 m)Chinese Soil Database (https://vdb3.soil.csdb.cn/) (accessed on 12 April 2024)
Climate station
records
of precipitation
SiteMeteorological data center of China Meteorological Administration (https://data.cma.cn/) (accessed on 12 April 2024)
DEM Raster data (30 m × 30 m)Geospatial Data Cloud (https://www.gscloud.cn/ (accessed on 12 April 2024)
Net Primary
Productivity (NPP)
Raster data (500 m × 500 m)Land Processes Distributed Active Archive Center (https://Ipdaac.usgs.gov/ (accessed on 12 April 2024)
Socio-economic dataHarbin City Statistical YearbookHarbin Bureau of Statistics (https://si12333.cn/ (accessed on 12 April 2024)
Table 2. Indicators system and quantification method for assessing LUFs.
Primary FunctionSecondary
Function
Evaluation MethodsExplanations
ProductionGrain productionGPi = GPsum N D V I i N D V I s u m GPsum represents the total regional grain production. NDVIi and NDVIsum represent NDVI for grid i and the sum of NDVI for the study area.
Forest product
provisioning
F o r e x = F o r e j F T j F T x F o r e x and F o r e j are the forest product yield at grid x and county j; F T x and F T j are the forest amount at grid x and county j, respectively.
Living Level of economic development E c o n x = N G D P j c j H S I j c x H S I x Econx denotes non-agricultural economic density at grid x; NGDPj denotes the non-agricultural GDP of county j; cx and cj are the area of urban built-up land and independent industrial and mining land of grid x and county j, respectively; HSIx and HSIj represent the human settlement index of grid x and county j, respectively.
Traffic support capabilityPi = m = 1 5 w m r m G i wm and rm represent the weight and length of the road type m, respectively; Gi represents the area of grid i. The weights of railway, expressway, national road, provincial road, and main urban road are 0.35, 0.25, 0.2, 0.15, and 0.05, respectively.
Population carrying capacityNullA specialization method based on the DMSP/OLS Night-time Satellite data and urban-rural built-up land.
Human health and recreationNullAverage rate of participation in basic pension insurance, basic medical care insurance, and unemployment insurance.
Provision of workNullTotal employed population/total area of land.
EcologyCarbon
Sequestration
CS = i = 0 j A i C i   a b o v e + C i   b e l o w + C i   s o i l + C i   d e a d Ai represents the area of land use type i; Ciabove, Cibelow, Cisoil, Cidead, respectively, represent the above-ground biological carbon density, underground biological carbon density, carbon density in soil, and carbon density of dead matters.
Soil retention capacity S R = R K L S ( 1 C P ) SR is the soil retention capacity in t/(ha year); R is the rainfall erosion factor; K is the soil erodibility; LS is the slop length and steepness factor; C denotes cover and management factor; and P is conservation practice factor.
Habitat quality Q = H x i ( 1 D x j z D x j z + k z )Q is the value of habitat quality; Hxj is the habitat suitability of land use type j; k is the half saturation constant; z is a scaling parameter that reflects the spatial heterogeneity, and Dxj denotes the total threat level in grid x with land use type j.
Water yield Y x j = 1 A E T x j P x × P x Yxj is the water yield (mm) of grid x for land use type j; AETxj is the actual evapotranspiration (mm) of grid x for the land use type j; and Px is the average annual precipitation (mm) of grid x.
Table 3. Fit function of initial mutation values of different land use functions to the underlying affiliation values.
FunctionsFitting FunctionCorrelation Coefficient
Grain Production, Economic Development, Carbon Sequestrationy = 0.98923x ^ 0.465840.99756
Forest product, Traffic support capability, Soil retention capacityy = 0.98999x ^ 0.306140.99587
Population carrying capacity, Habitat quality, Provision of worky = 0.99244x ^ 0.233560.99746
Water yield, Human health, and recreationy = 0.99517x ^ 0.191750.99914
Table 4. Overall measurement of multifunctional trade-offs/synergies in land use.
Land Use Function Type200020202000–2020
Production–Living0.495 **−0.438 **−0.083 **
Living–Ecology−0.660 **−0.597 **0.012 *
Production–Ecology−0.467 **0.691 **−0.225 **
Note: **, p < 1%; *, p < 5%.
Disclaimer/Publisher’s Note: The statements, opinions and data contained in all publications are solely those of the individual author(s) and contributor(s) and not of MDPI and/or the editor(s). MDPI and/or the editor(s) disclaim responsibility for any injury to people or property resulting from any ideas, methods, instructions or products referred to in the content.

