


Characterization and Geomorphic Change Detection of Landslides Using UAV Multi-Temporal Imagery in the Himalayas, Pakistan


 and
and 
Abstract
:1. Introduction
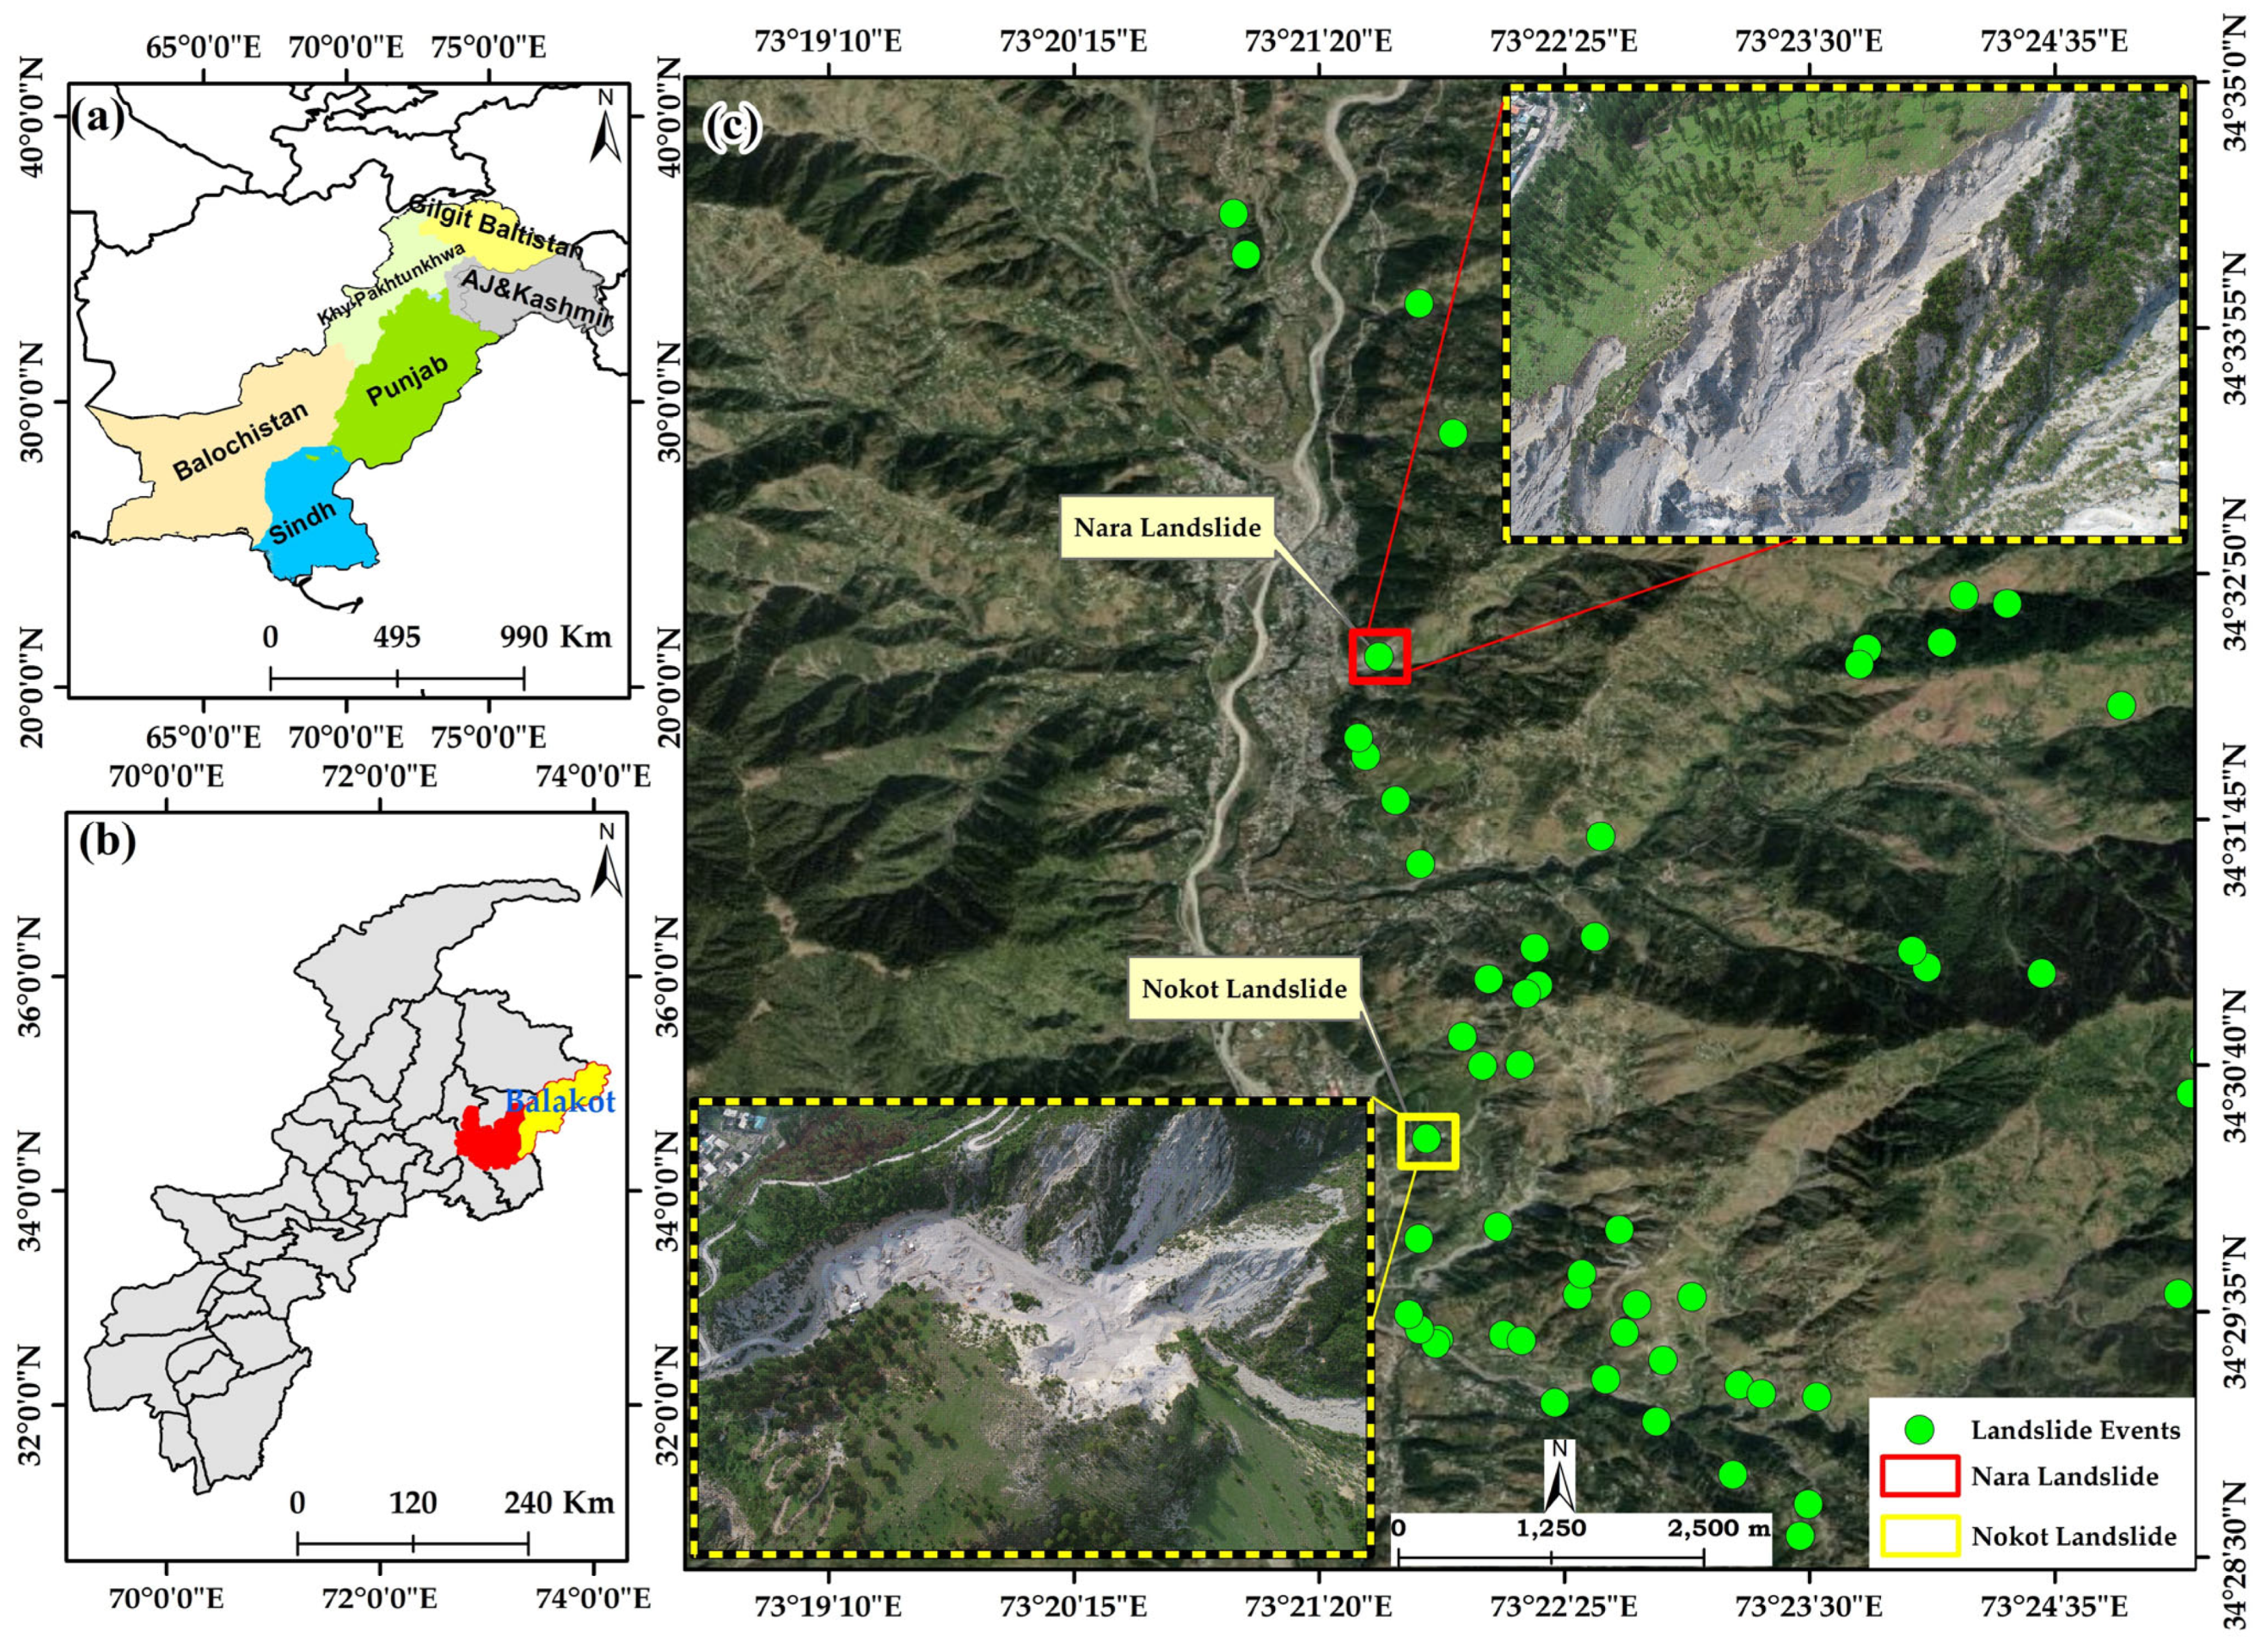
Study Area
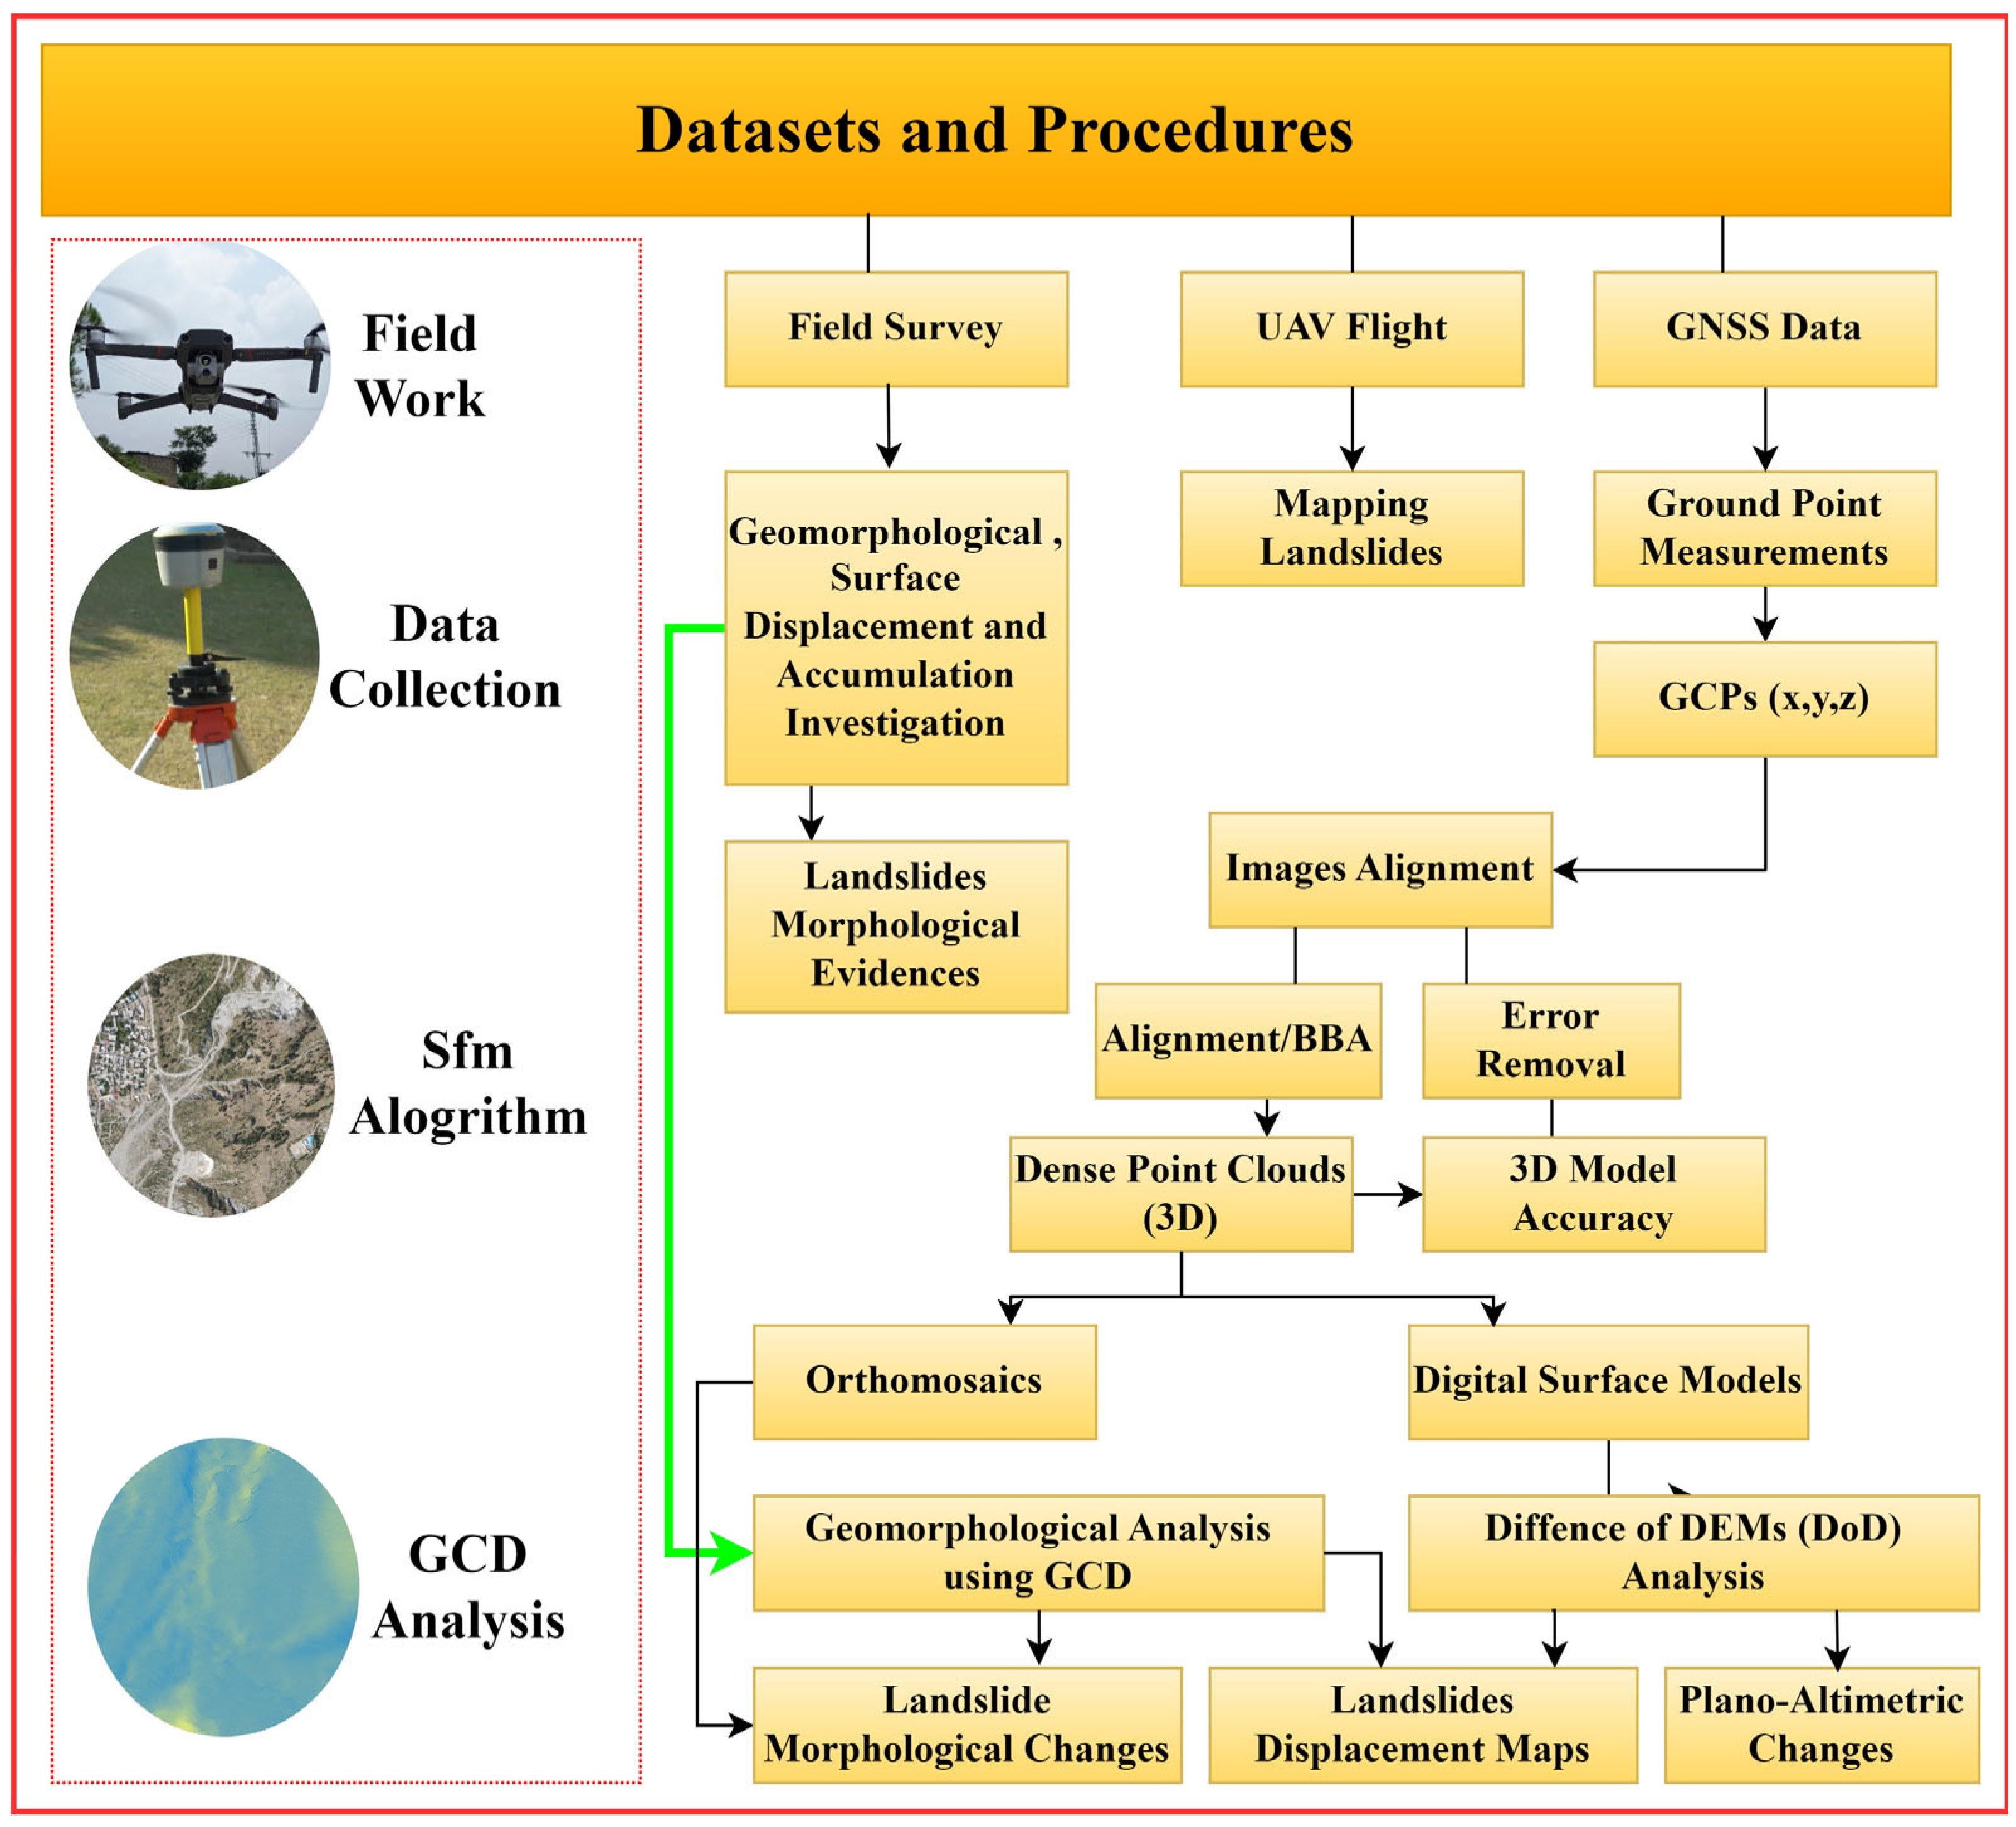
2. Materials and Methods
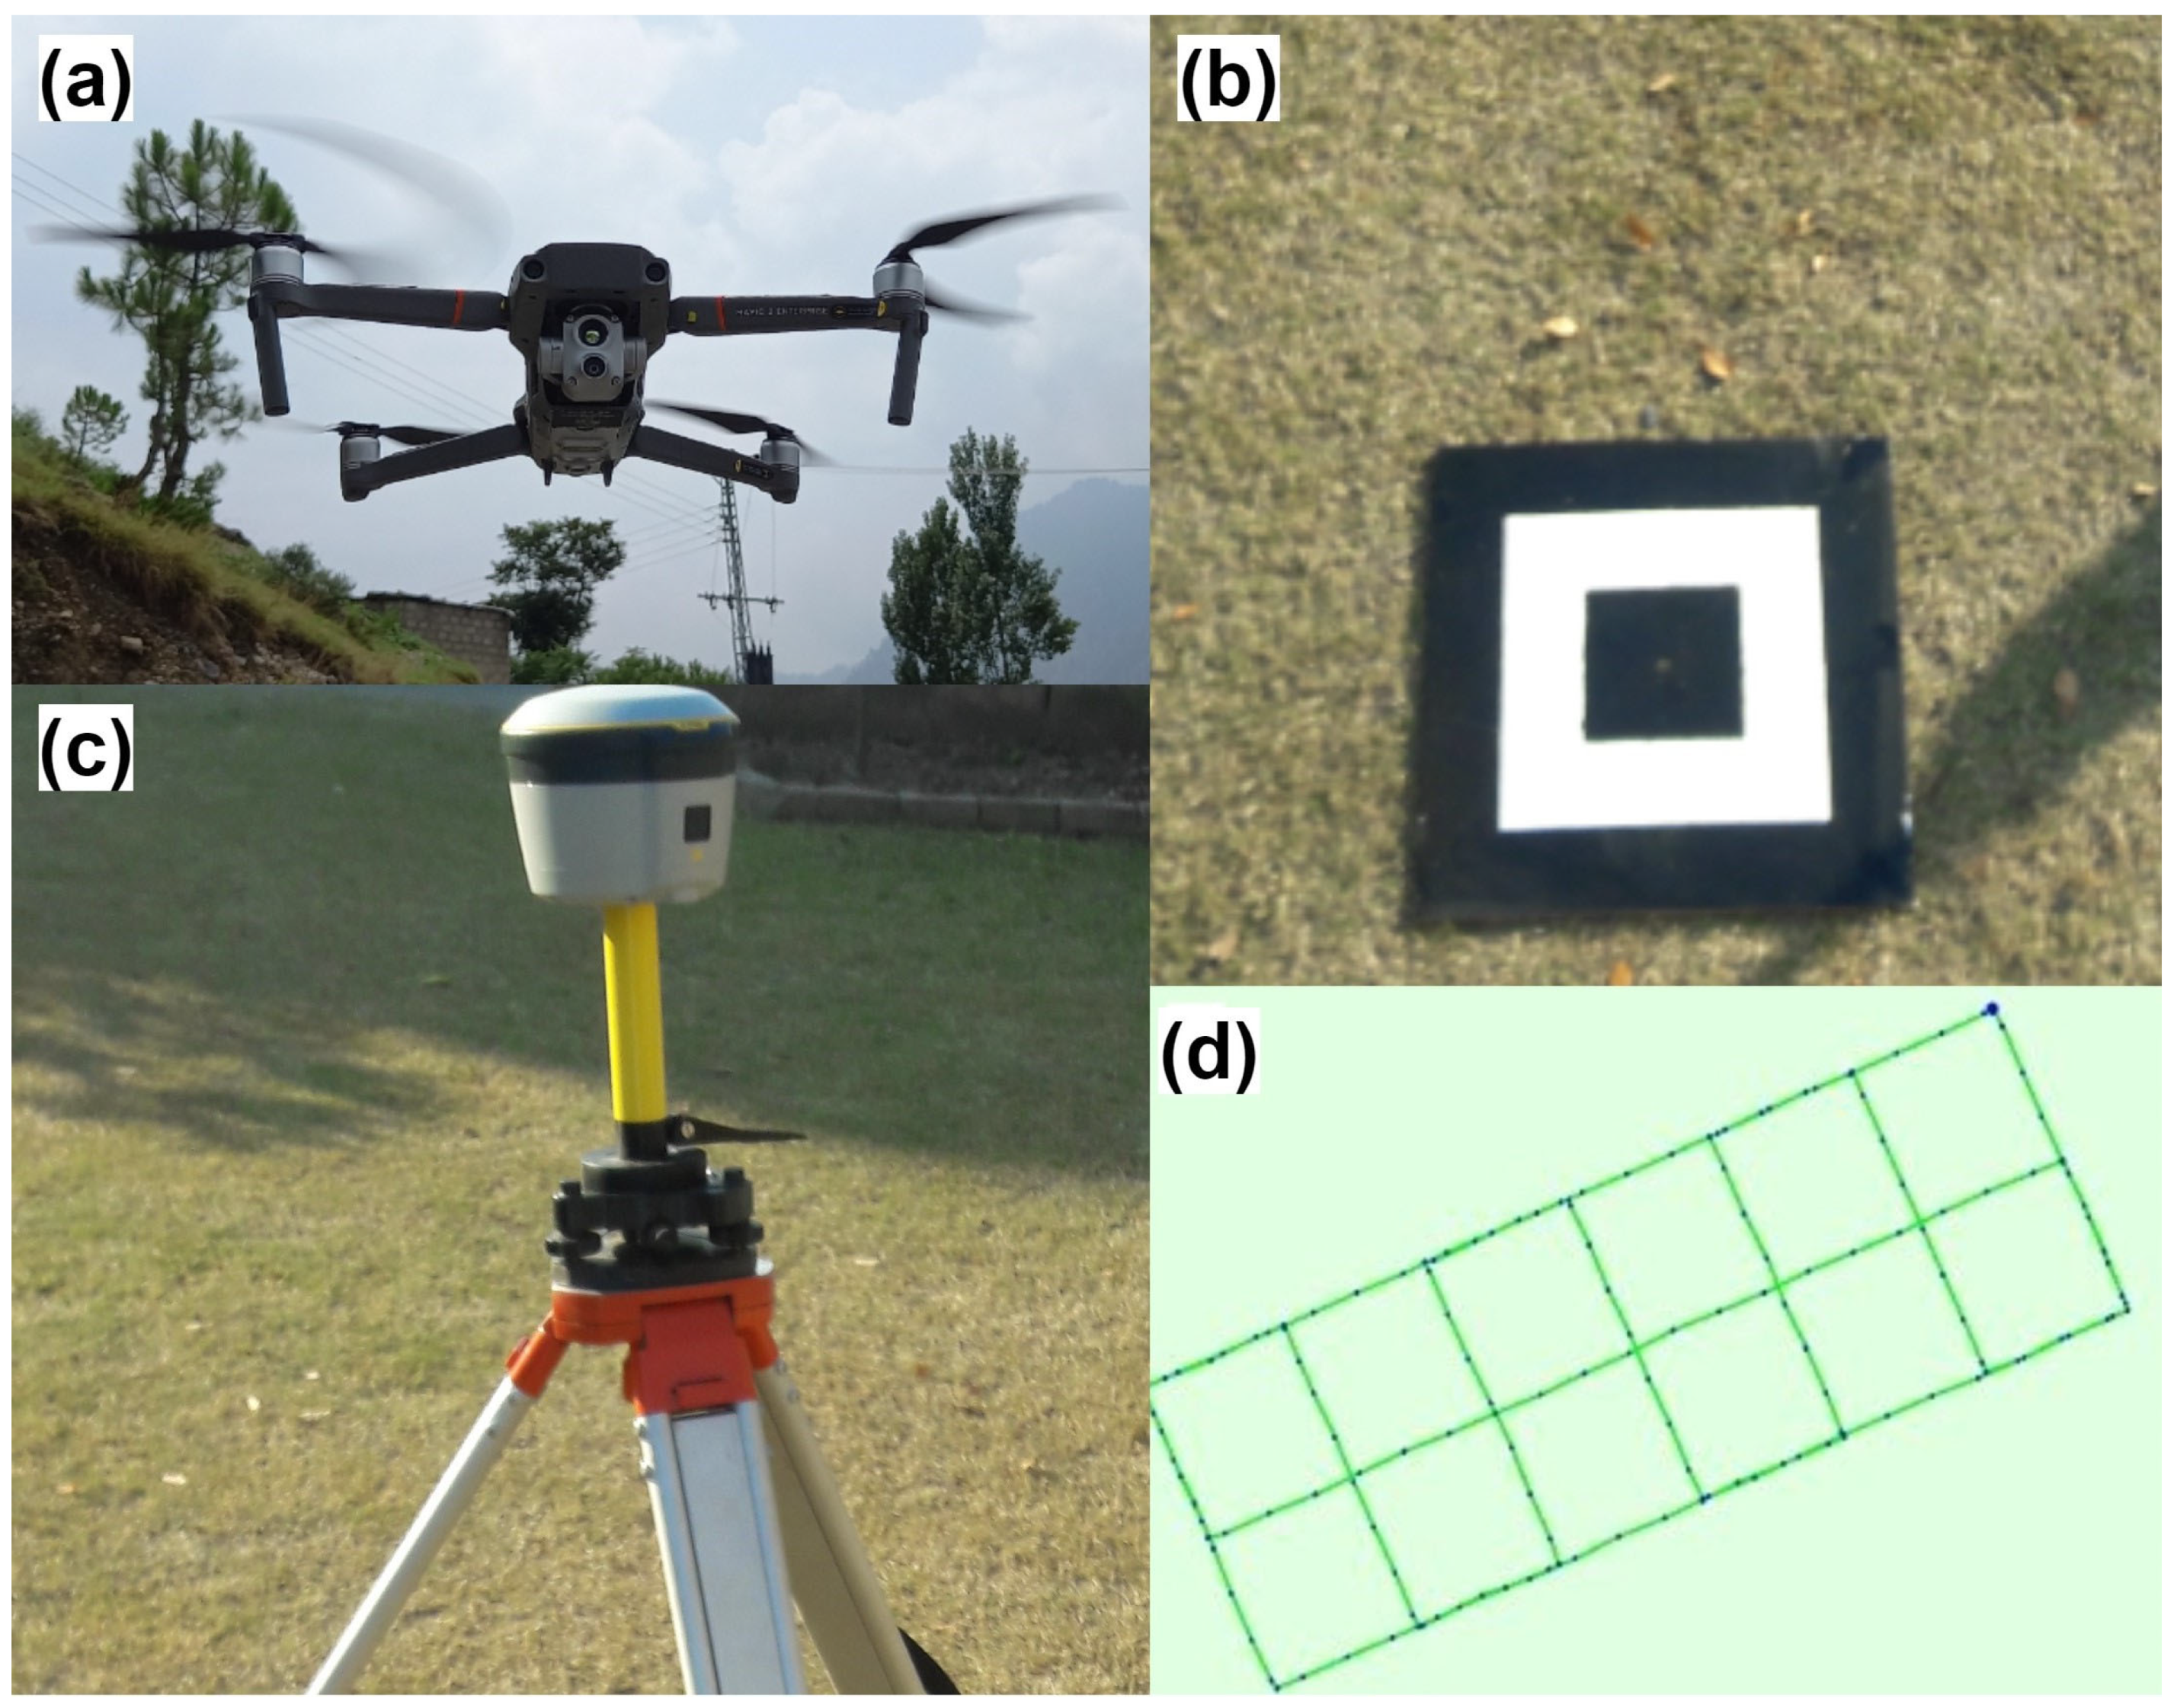
2.1. Data Acquisition
2.2. Method
2.2.1. Data Pre-Processing
2.2.2. Geomorphic Change Detection Model
3. Results
3.1. Accuracy Assessment
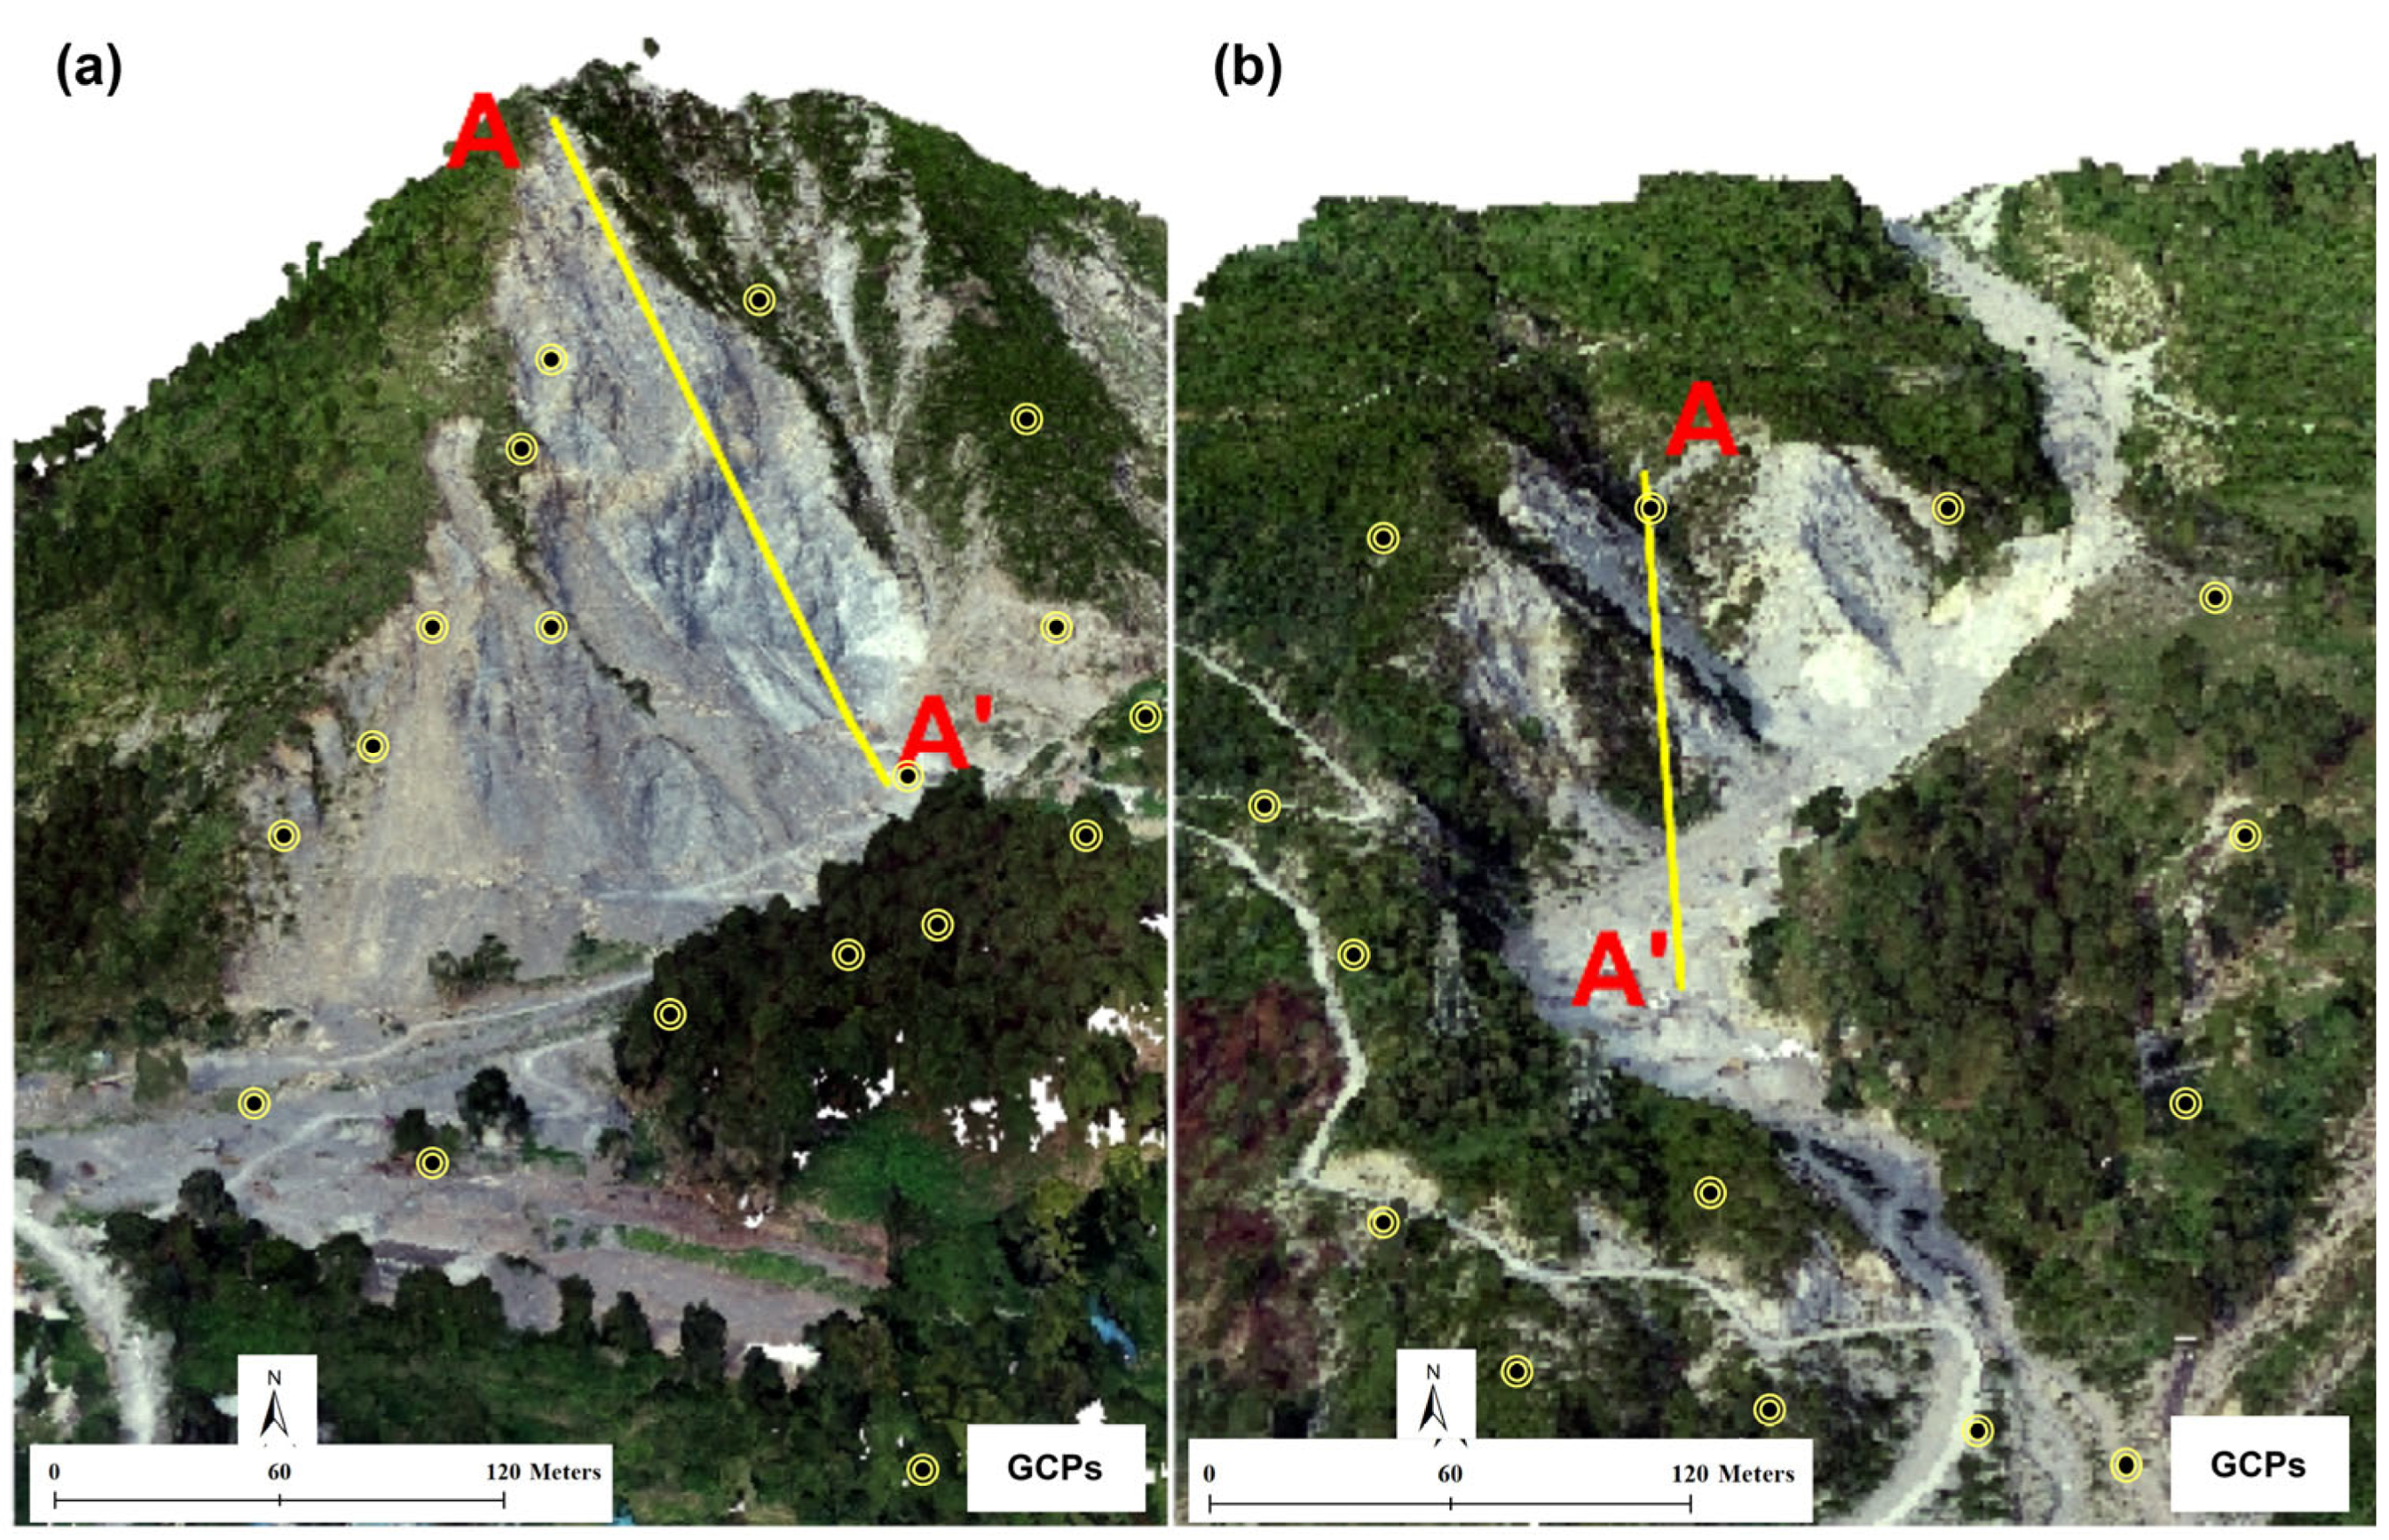
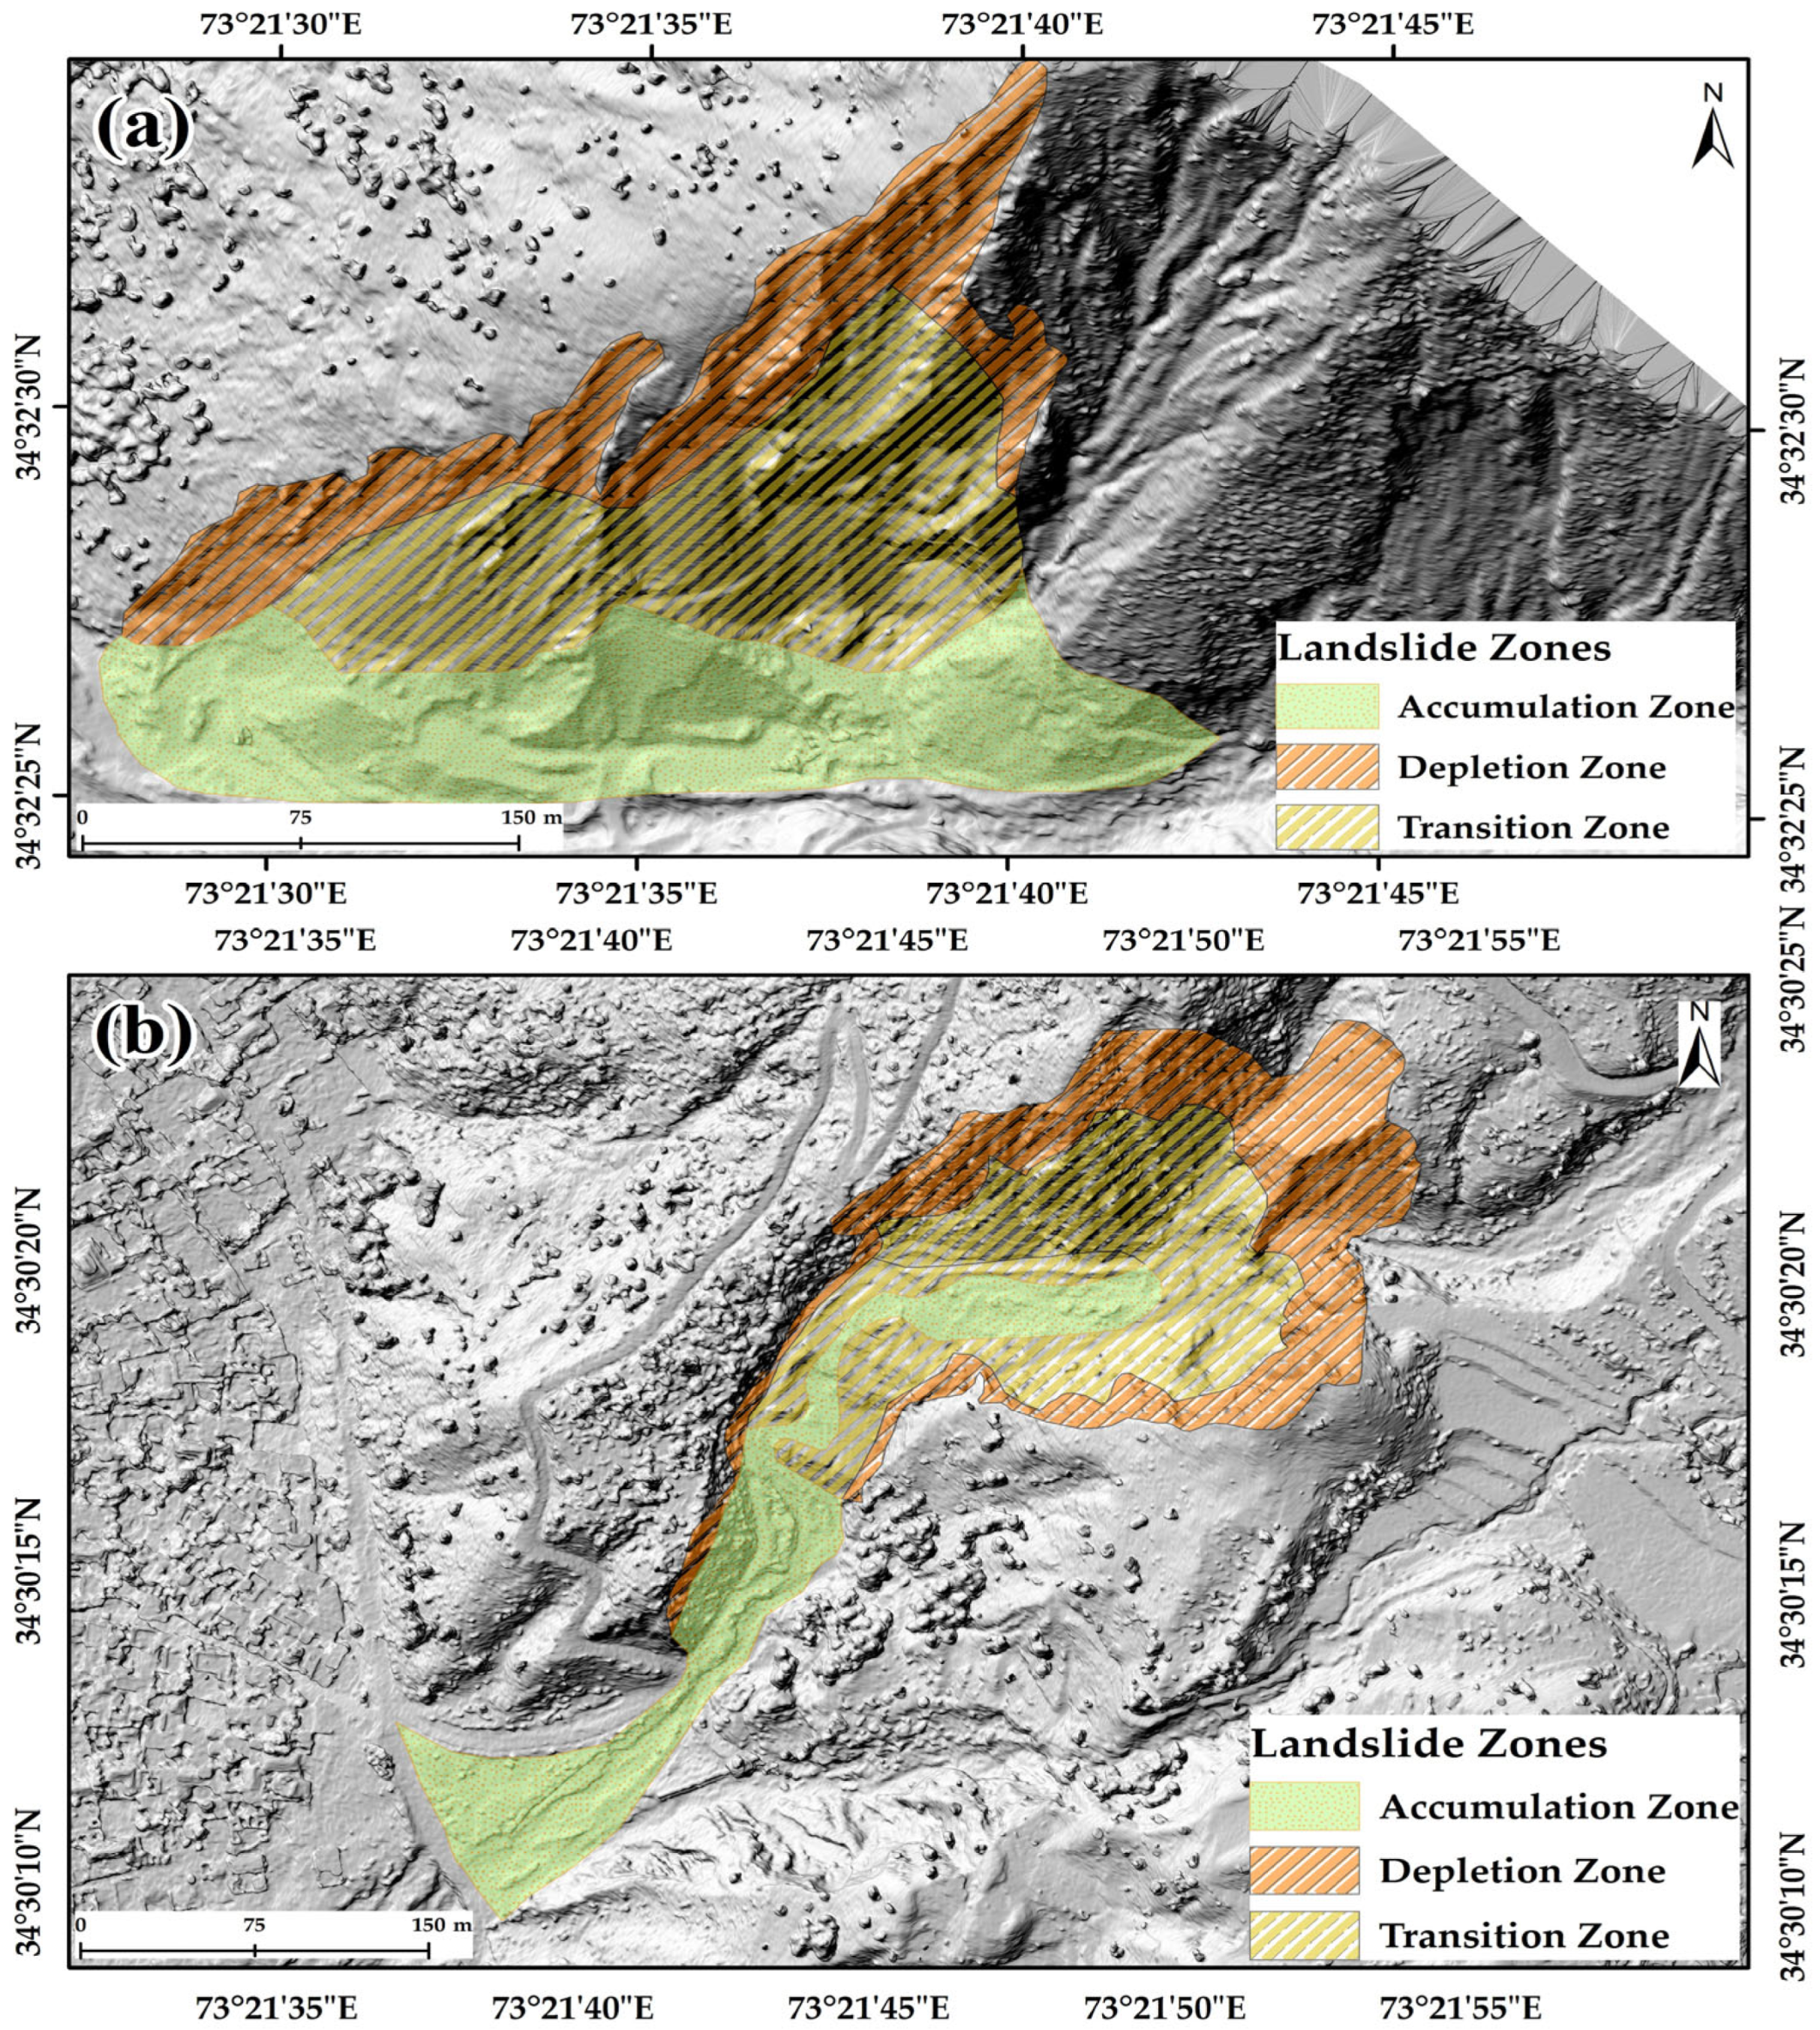
3.2. Morpho Dynamics of Nara and Nokot Landslides
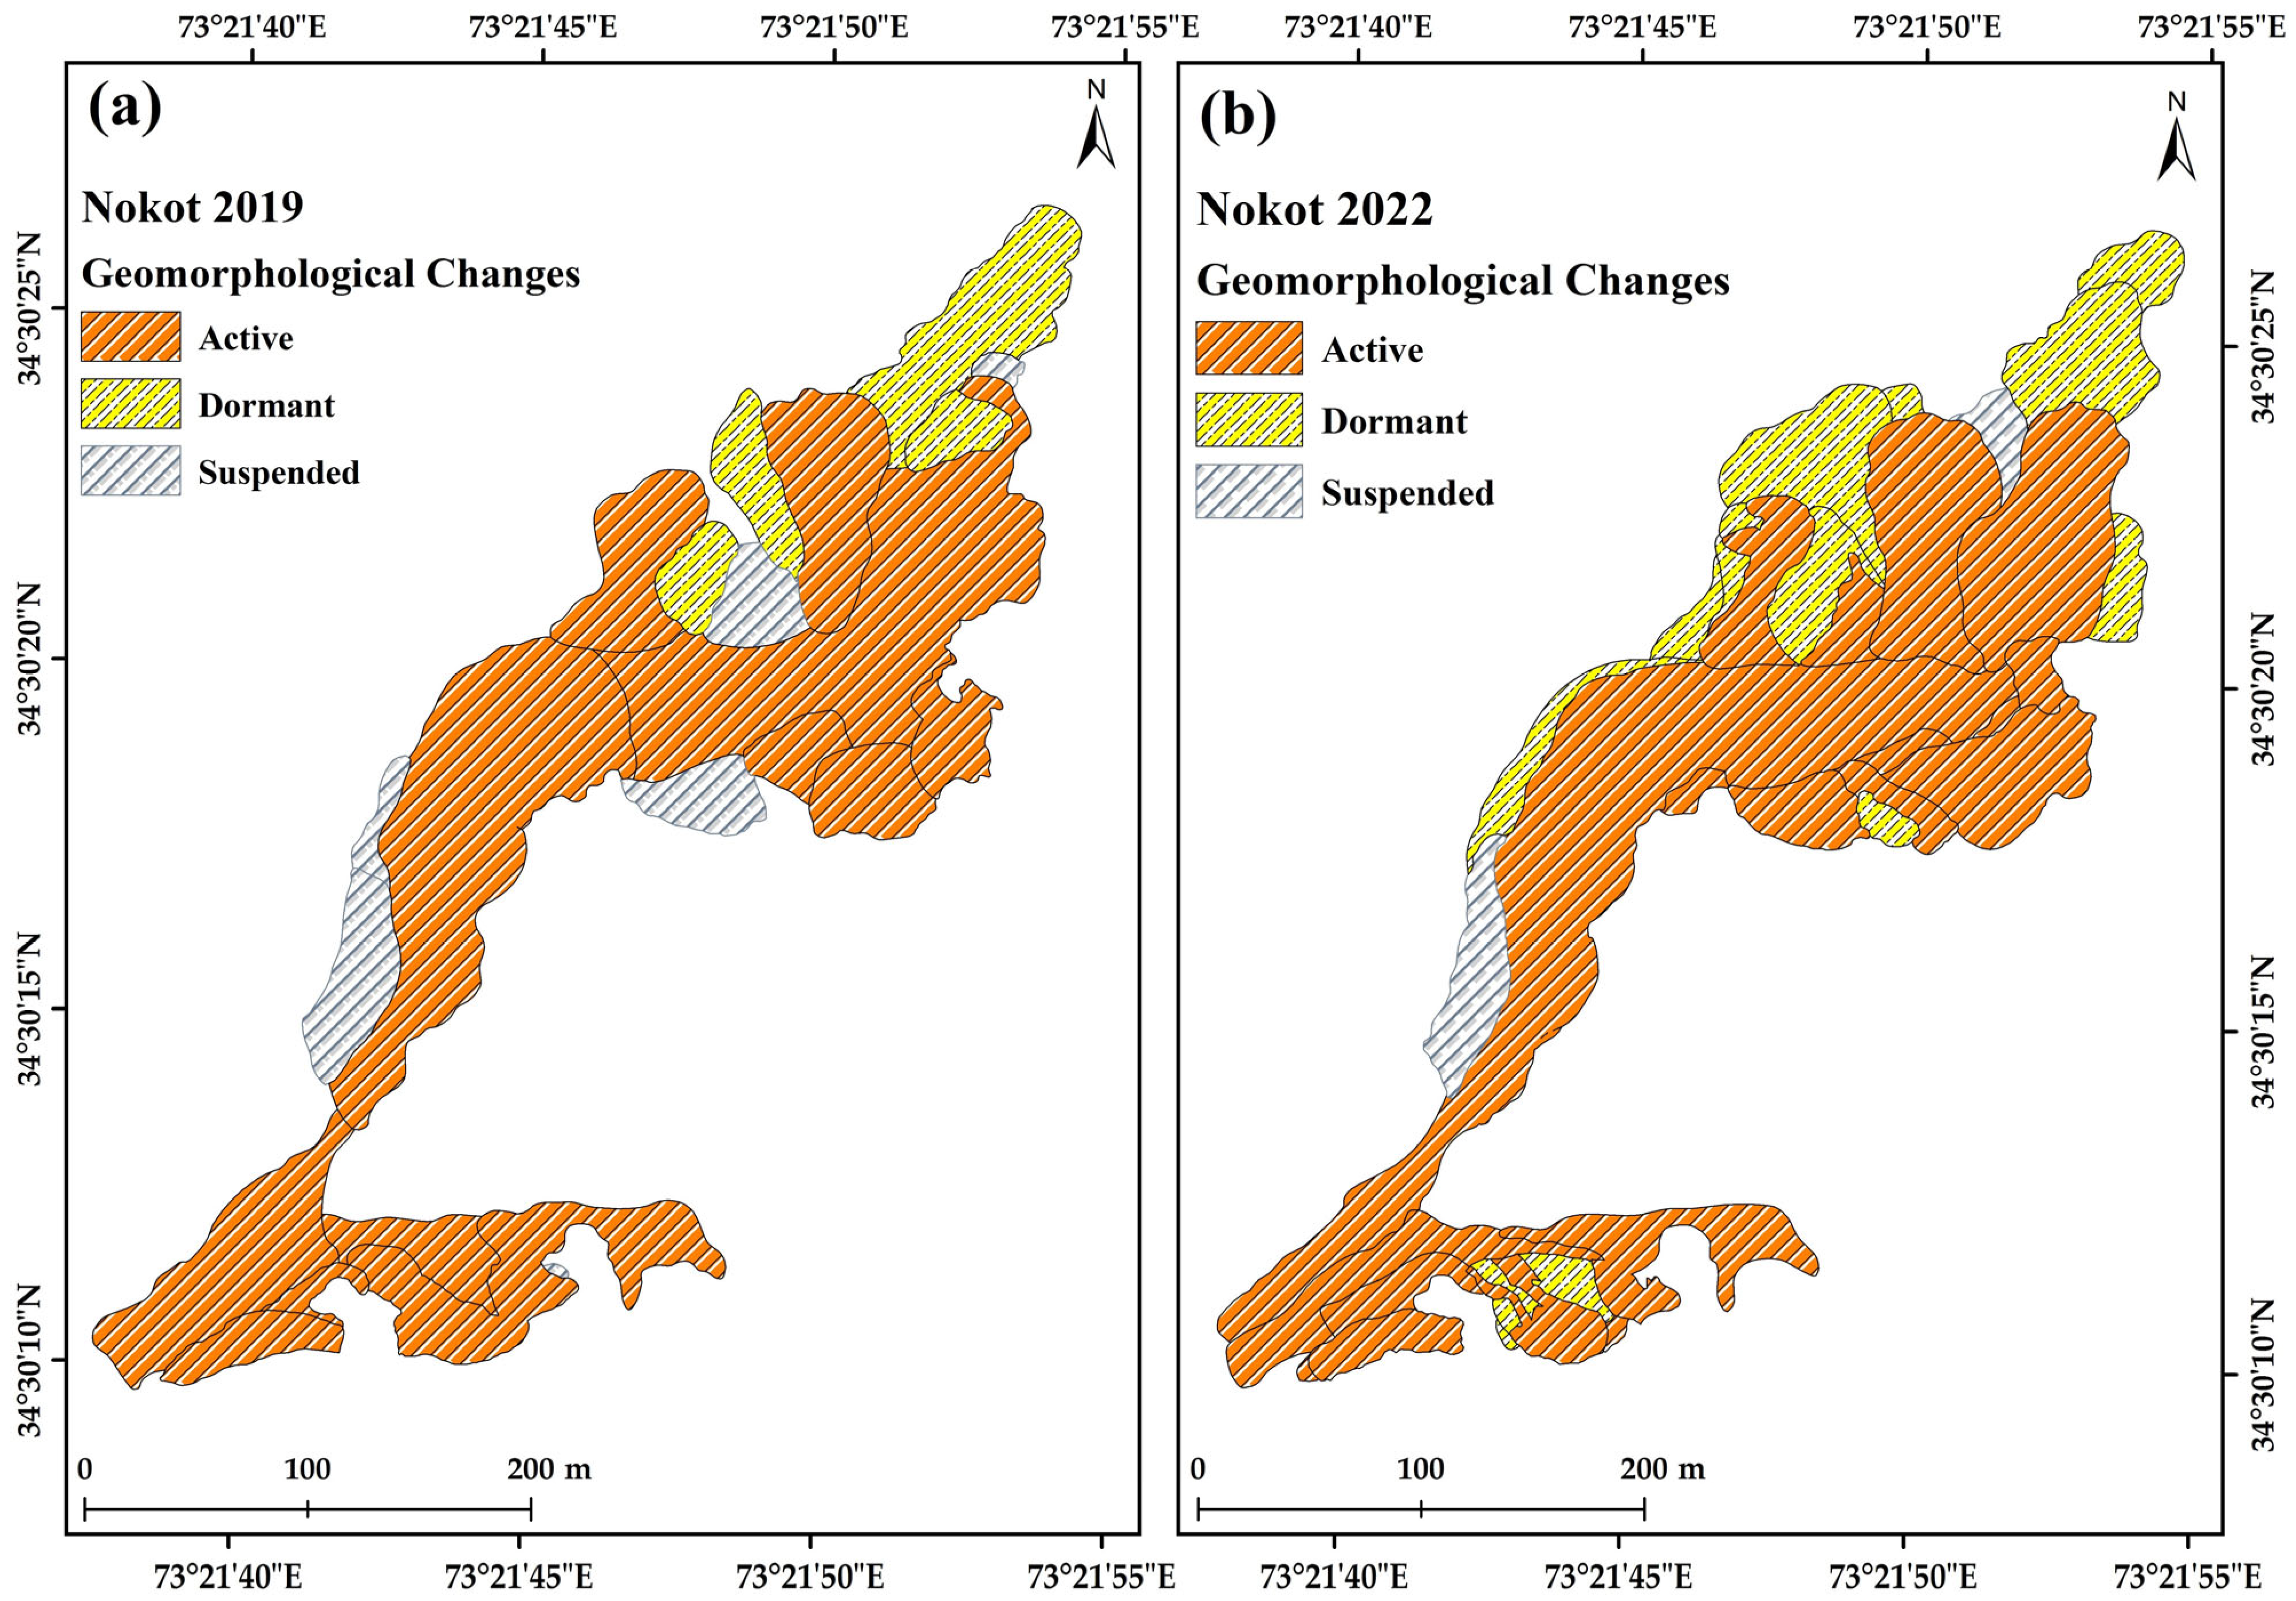
3.3. Nara and Nokot Landslide Geomorphological Changes
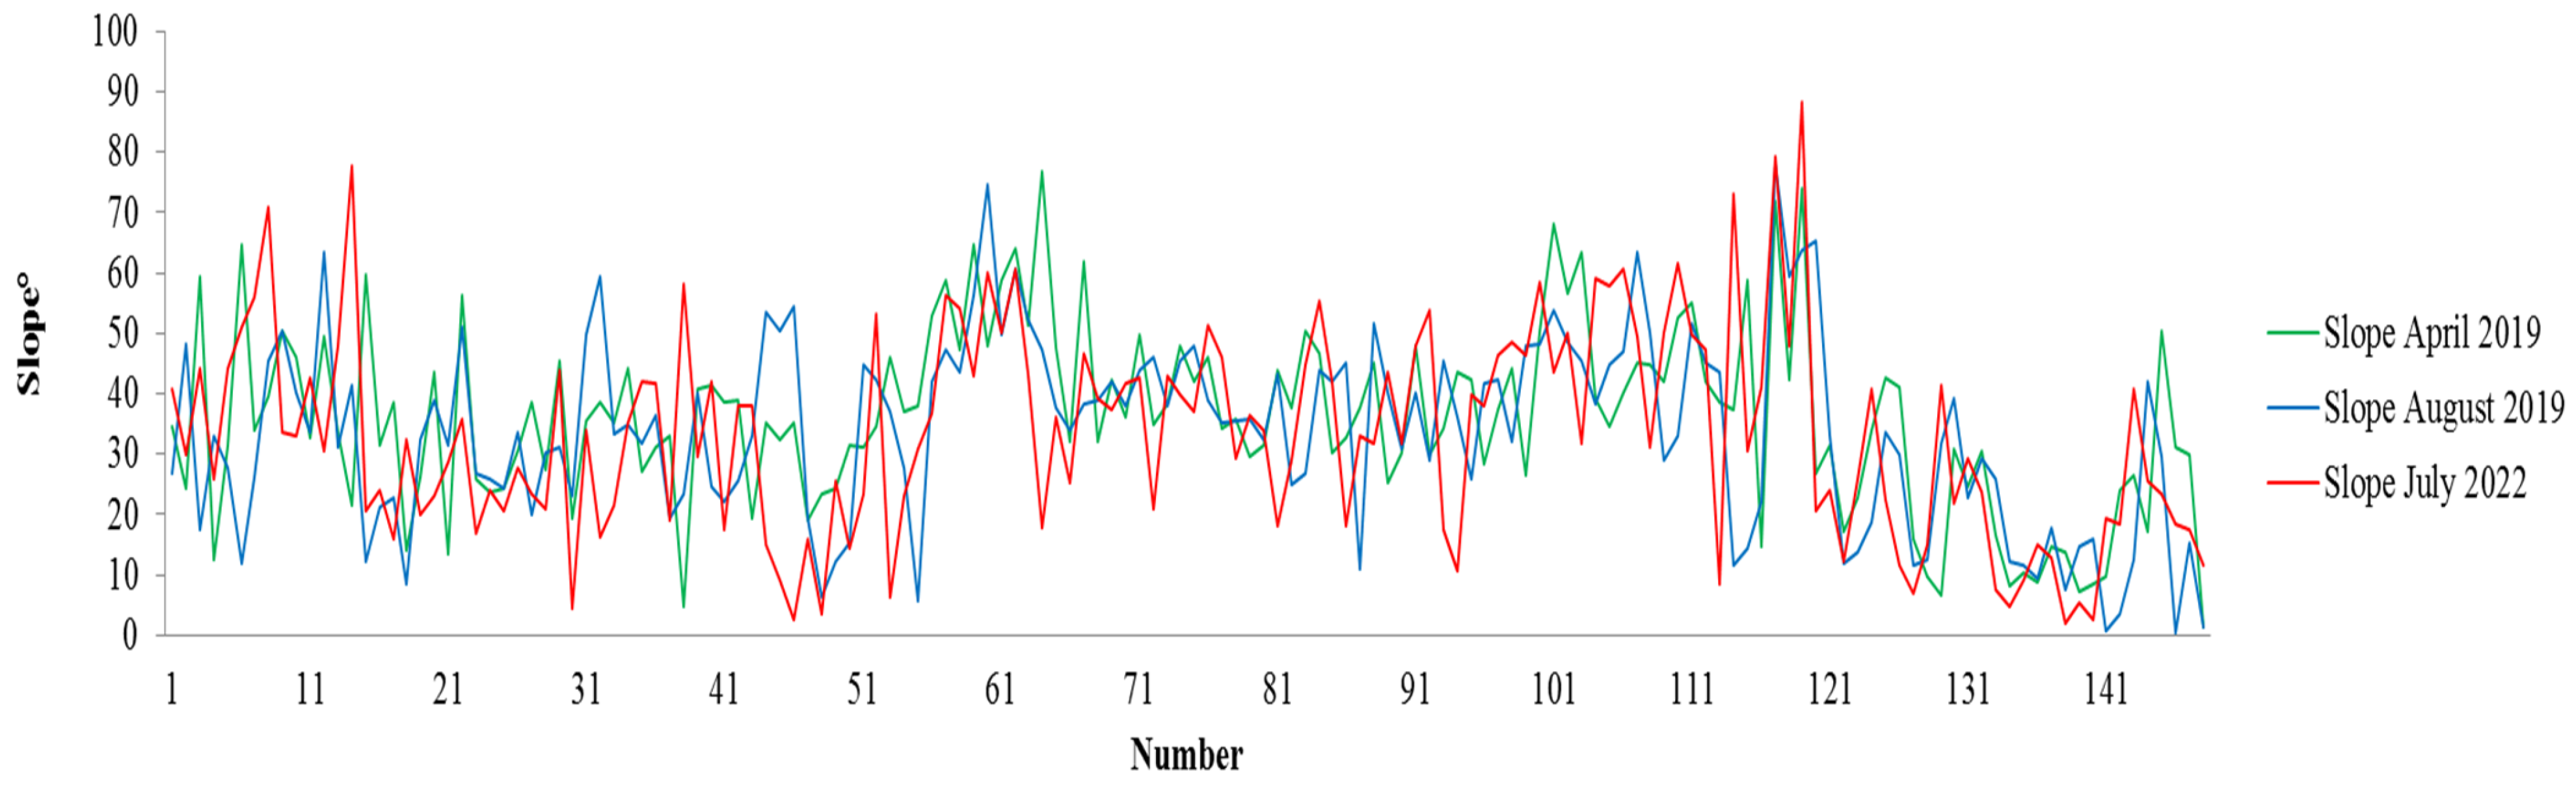
3.4. Slope Analysis of the Nara and Nokot Landslides
3.5. Cross-Sectional Investigation of DSM-Based Landslide Slope Changes
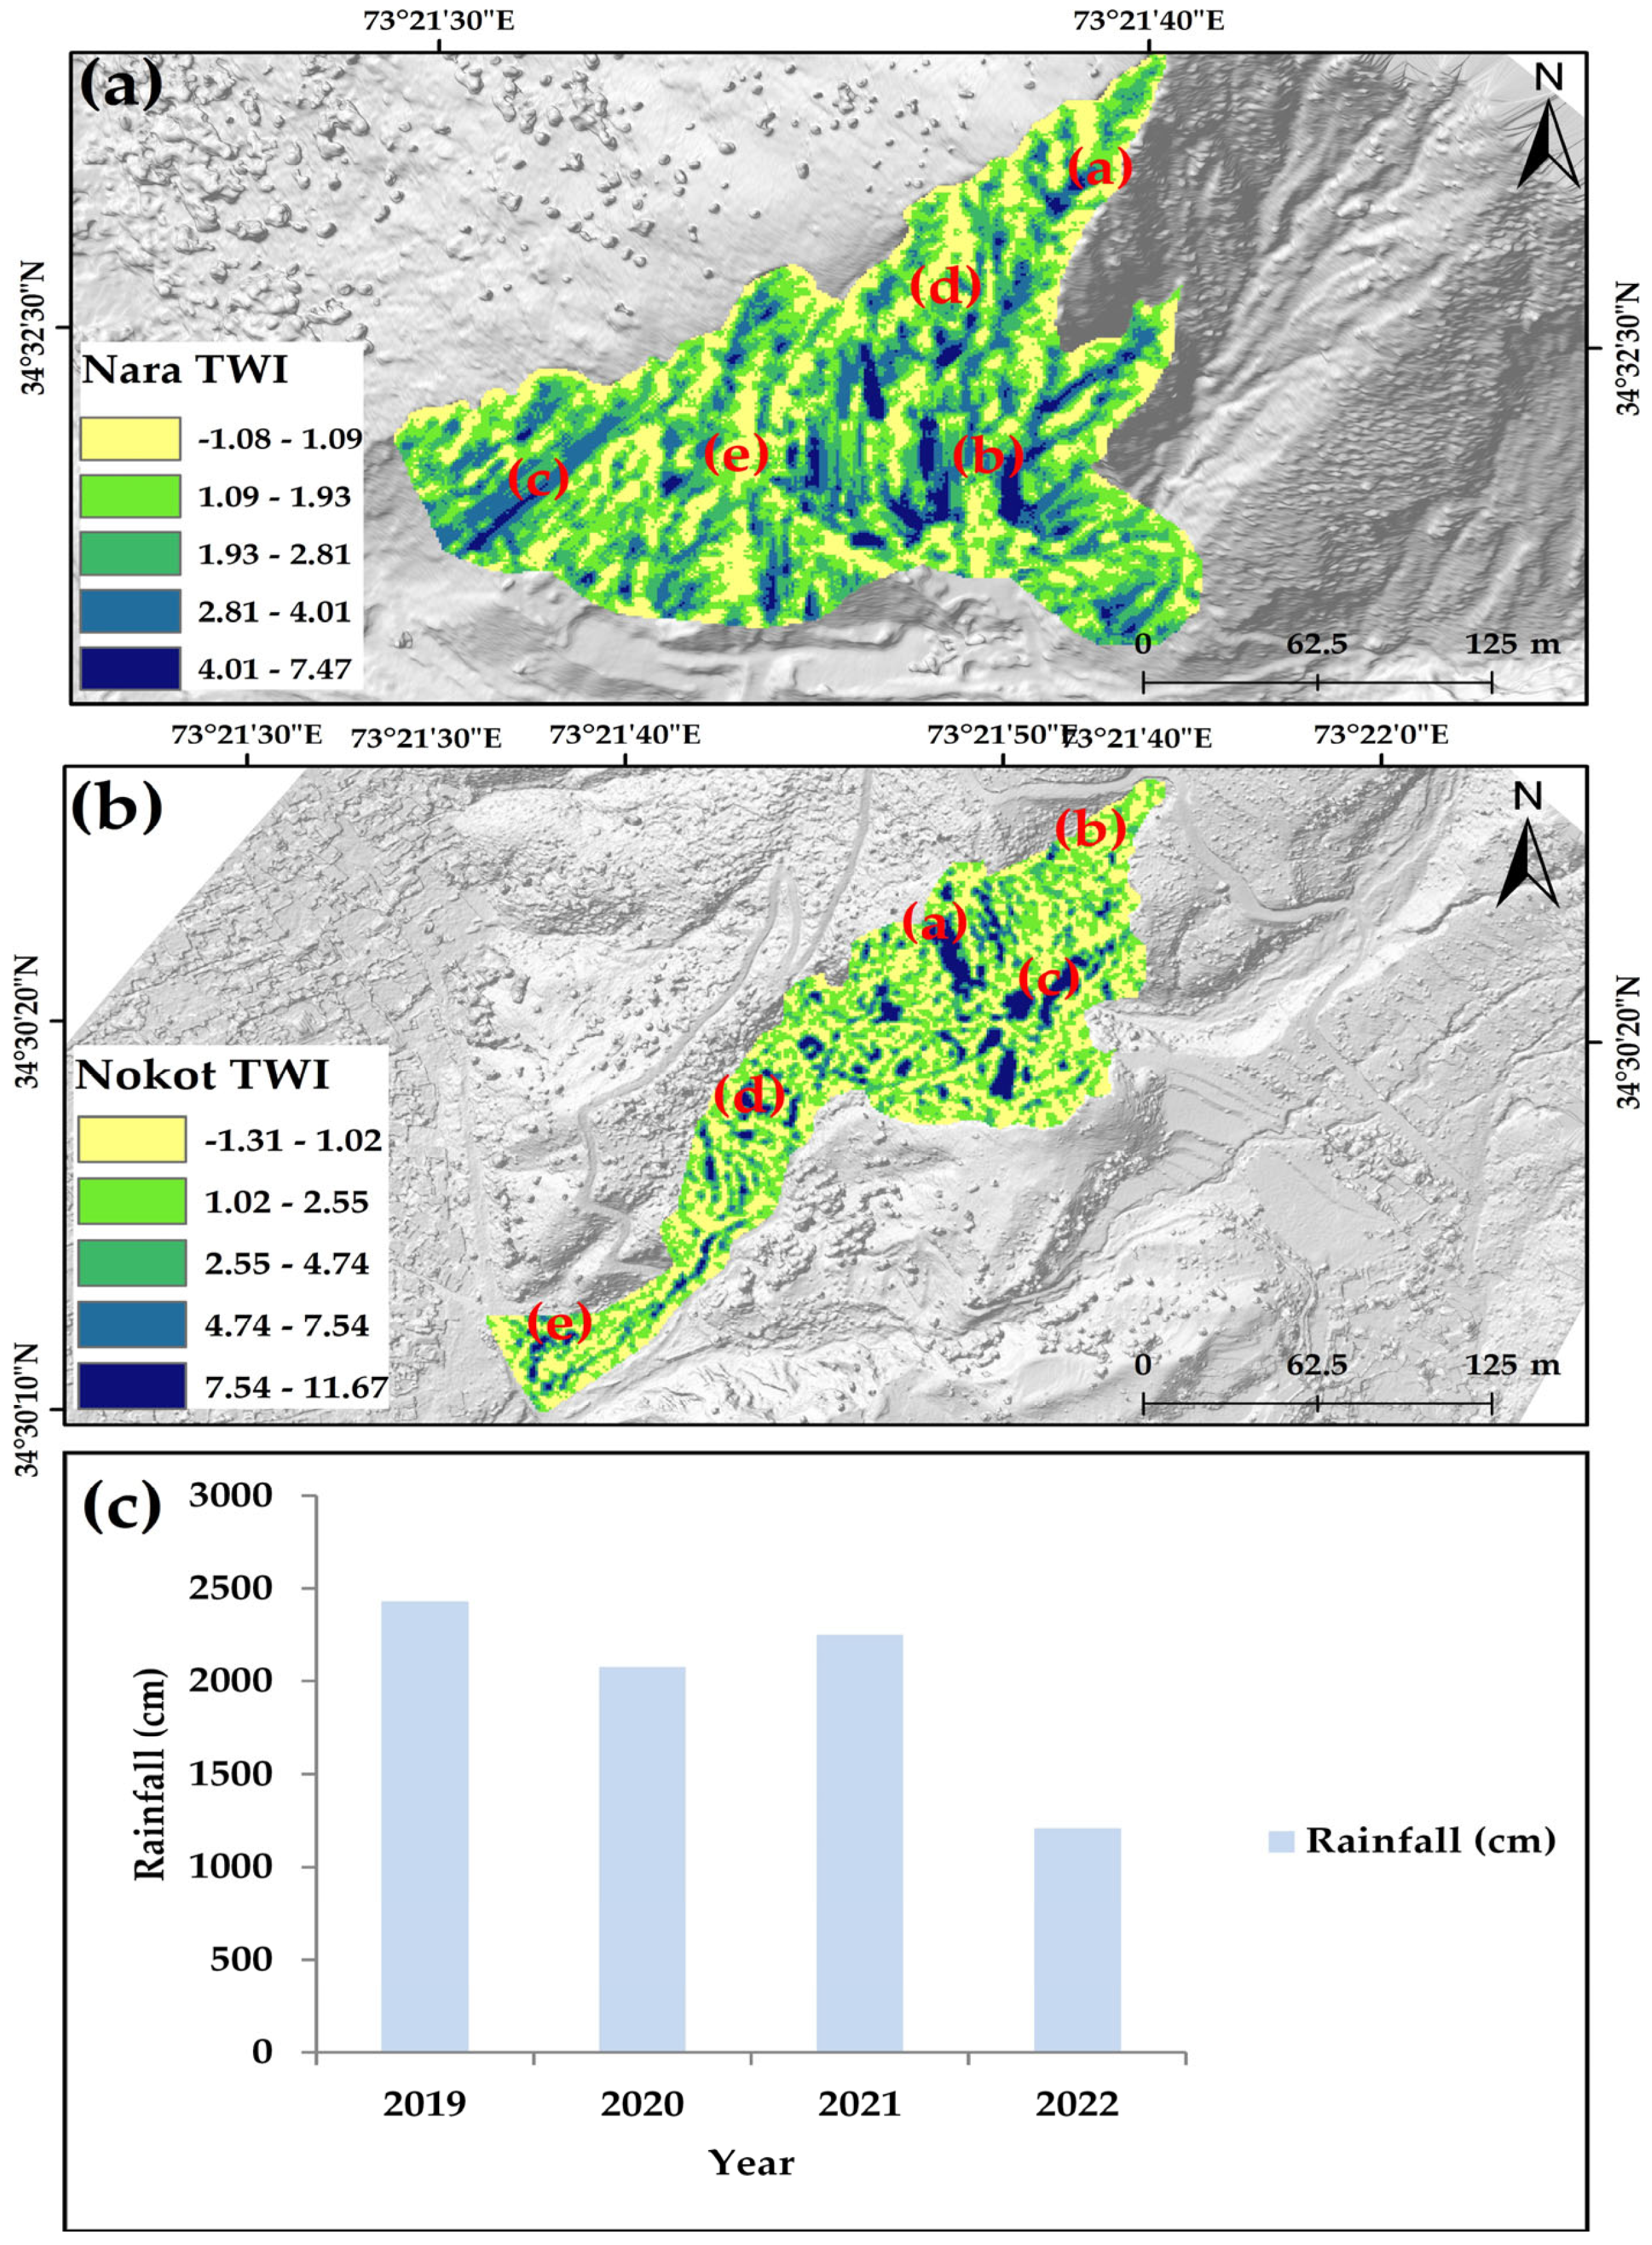
3.6. Topographic Wetness Index Map
3.7. The Areal and Volume Changes in the Nara and Nokot Landslides
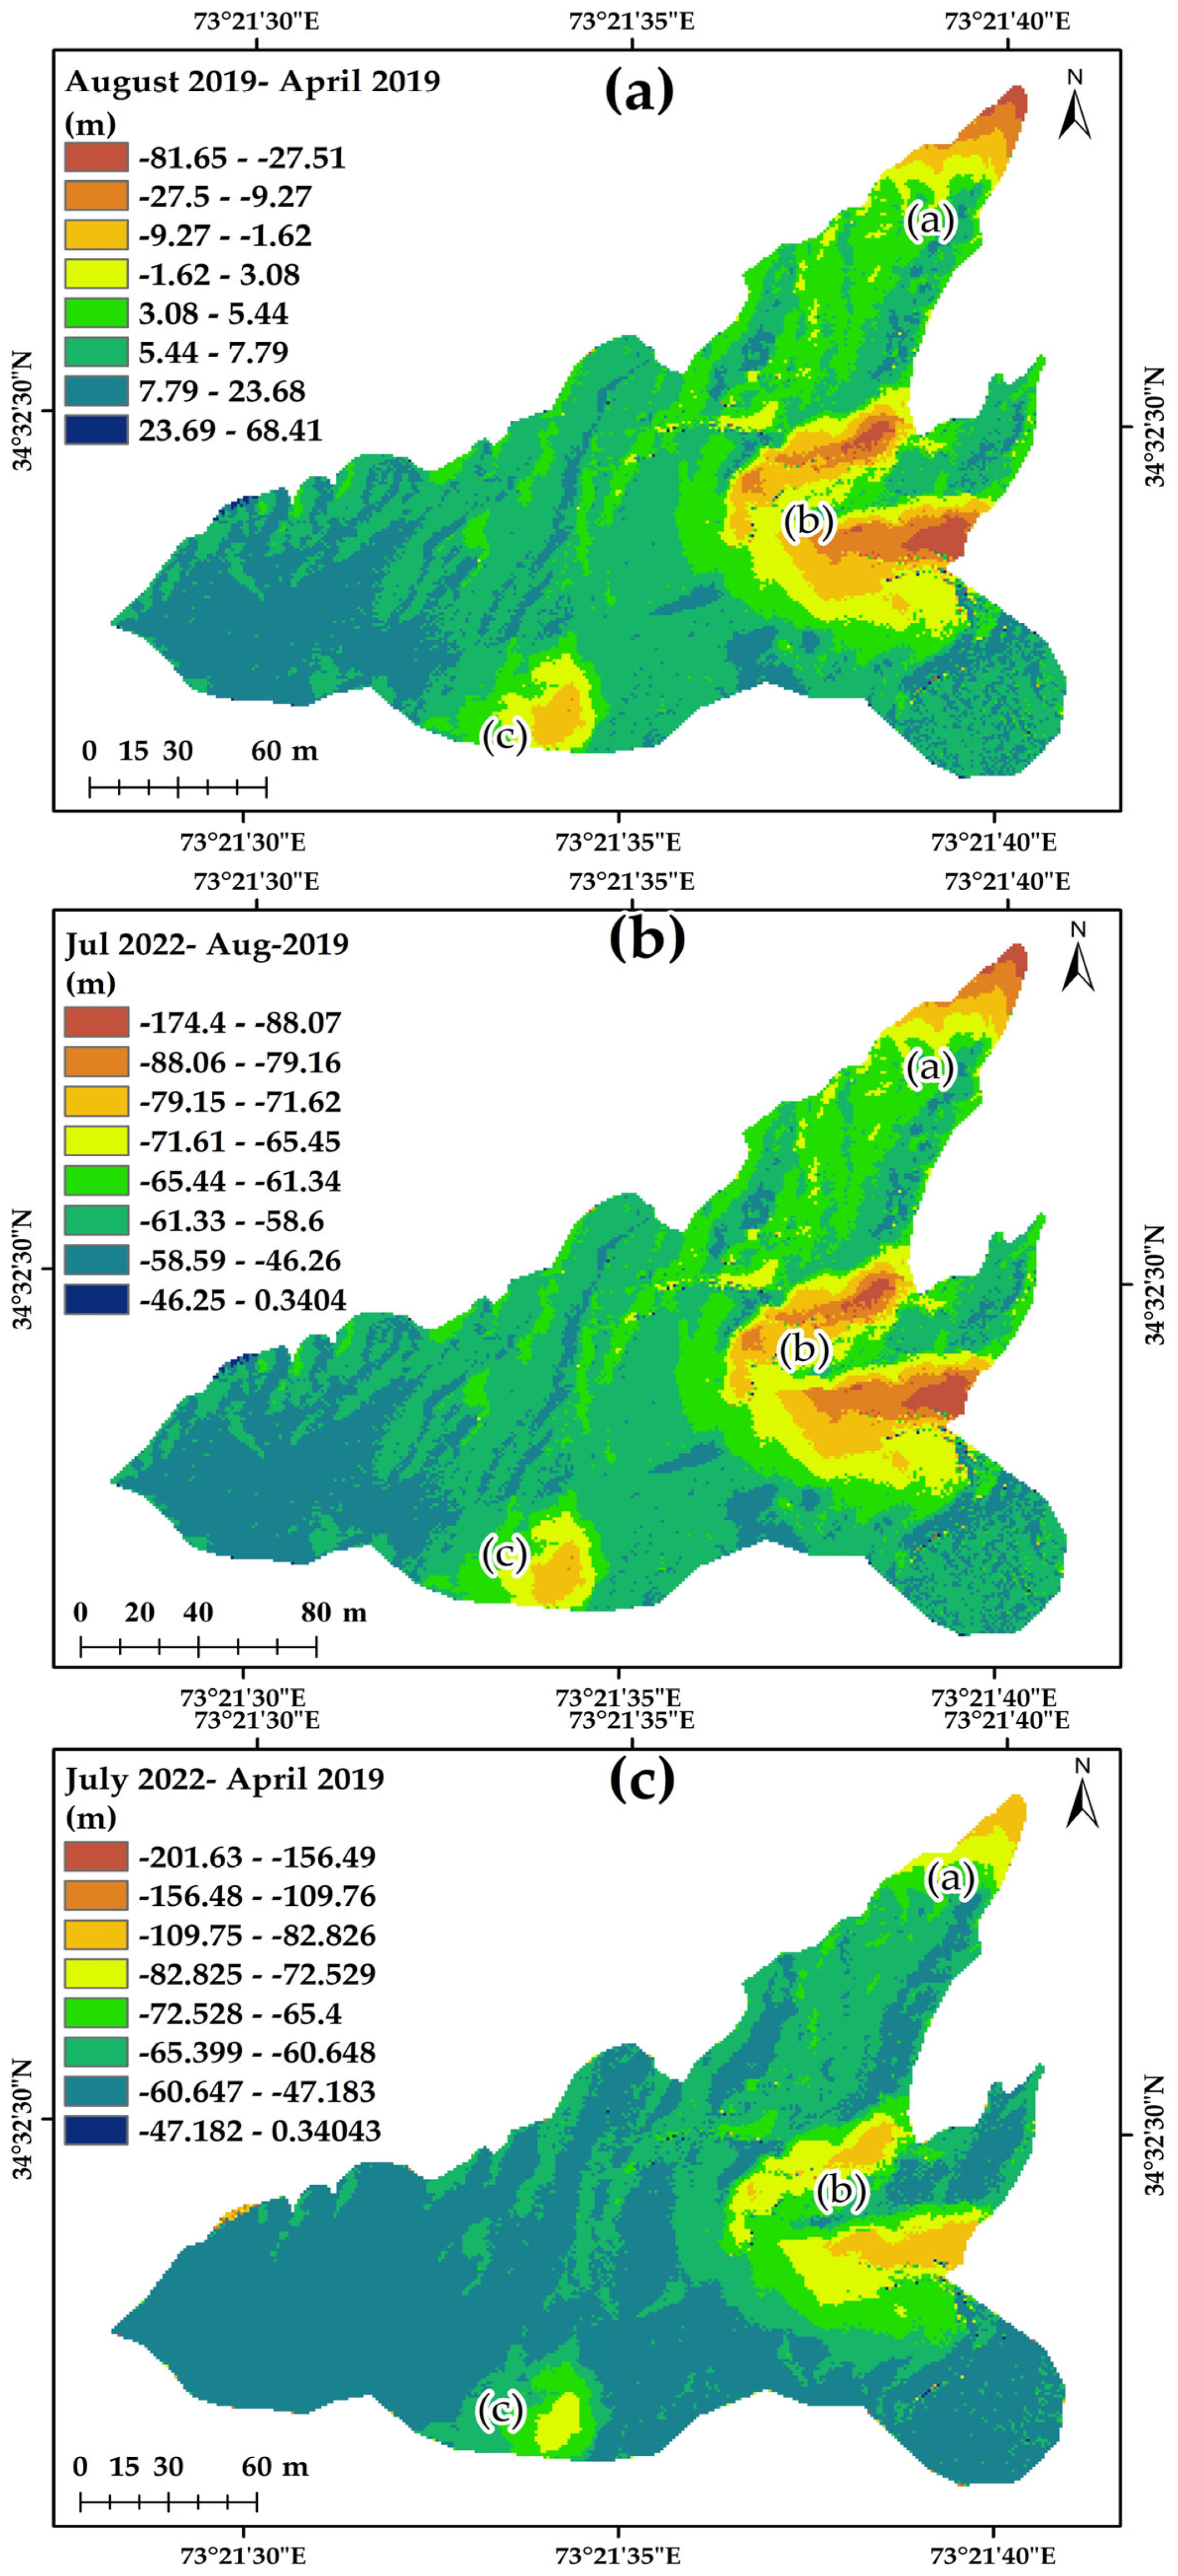
3.8. Plano-Altimetric Changes of the Nara and Nokot Landslides
3.9. Inter-Comparison of the Temporal DSMs Generated
4. Discussion
5. Conclusions
Author Contributions
Funding
Data Availability Statement
Acknowledgments
Conflicts of Interest
References
- Yin, Y.; Guo, Y.; Su, Q.; Wang, Z. Task Allocation of Multiple Unmanned Aerial Vehicles Based on Deep Transfer Reinforcement Learning. Drones 2022, 6, 215. [Google Scholar] [CrossRef]
- Solaimani, K.; Mousavi, S.Z.; Kavian, A. Landslide susceptibility mapping based on frequency ratio and logistic regression models. Arab. J. Geosci. 2013, 6, 2557–2569. [Google Scholar] [CrossRef]
- Li, J.; Han, L.; Zhang, C.; Li, Q.; Liu, Z. Spherical Convolution Empowered Viewport Prediction in 360 Video Multicast with Limited FoV Feedback. ACM Trans. Multimed. Comput. Commun. Appl. 2023, 19, 1–23. [Google Scholar] [CrossRef]
- Eker, R.; Aydın, A.; Hübl, J. Unmanned aerial vehicle (UAV)-based monitoring of a landslide: Gallenzerkogel landslide (Ybbs-Lower Austria) case study. Environ. Monit. Assess. 2017, 190, 28. [Google Scholar] [CrossRef]
- Li, J.; Zhang, C.; Liu, Z.; Hong, R.; Hu, H. Optimal Volumetric Video Streaming With Hybrid Saliency Based Tiling. IEEE Trans. Multimed. 2023, 25, 2939–2953. [Google Scholar] [CrossRef]
- Ali, M.Z.; Ullah, S.; Ali, A. Impact assessment of spatial resolution on landslide inventories: A case study of Muzaffarabad city. J. Himal. Earth Sci. 2017, 50, 114–124. [Google Scholar]
- Asghar, U. Landslide Mapping from Analysis of UAV-SfM Point Clouds in the College of Graduate Studies; The University of British Columbia: Vancouver, BC, Canada, 2017. [Google Scholar]
- Mercuri, M.; Conforti, M.; Ciurleo, M.; Borrelli, L. UAV Application for Short-Time Evolution Detection of the Vomice Landslide (South Italy). Geosciences 2023, 13, 29. [Google Scholar] [CrossRef]
- Zhou, S.; Zhou, S.; Tan, X. Nationwide susceptibility mapping of landslides in Kenya using the fuzzy analytic hierarchy process model. Land 2020, 9, 535. [Google Scholar] [CrossRef]
- Gorum, T.; Fan, X.; van Westen, C.J.; Huang, R.Q.; Xu, Q.; Tang, C.; Wang, G. Distribution pattern of earthquake-induced landslides triggered by the 12 May 2008 Wenchuan earthquake. Geomorphology 2011, 133, 152–167. [Google Scholar] [CrossRef]
- Parkash, S. Earthquake Related Landslides in the Indian Himalaya: Experiences from the Past and Implications for the Future. In Landslide Science and Practice: Volume 5: Complex Environment; Margottini, C., Canuti, P., Sassa, K., Eds.; Springer: Berlin/Heidelberg, Germany, 2013; pp. 327–334. [Google Scholar]
- Perera, E.N.C.; Jayawardana, D.T.; Ranagalage, M.; Dissanayake, D.M.S.L.B.; Wijenayaka, H.M.D.S. Introduce a framework for landslide risk assessment using geospatial analysis: A case study from Kegalle District, Sri Lanka. Model. Earth Syst. Environ. 2020, 6, 2415–2431. [Google Scholar] [CrossRef]
- Zhu, W.; Chen, J.; Sun, Q.; Li, Z.; Tan, W.; Wei, Y. Reconstructing of High-Spatial-Resolution Three-Dimensional Electron Density by Ingesting SAR-Derived VTEC Into IRI Model. IEEE Geosci. Remote Sens. Lett. 2022, 19, 4508305. [Google Scholar] [CrossRef]
- Hong, H.; Shahabi, H.; Shirzadi, A.; Chen, W.; Chapi, K.; Bin Ahmad, B.; Roodposhti, M.S.; Hesar, A.Y.; Tian, Y.; Bui, D.T. Landslide susceptibility assessment at the Wuning area, China: A comparison between multi-criteria decision making, bivariate statistical and machine learning methods. Nat. Hazards 2019, 96, 173–212. [Google Scholar] [CrossRef]
- Wang, X.; Huang, J.; Feng, Q.; Yin, D. Winter Wheat Yield Prediction at County Level and Uncertainty Analysis in Main Wheat-Producing Regions of China with Deep Learning Approaches. Remote Sens. 2020, 12, 1744. [Google Scholar] [CrossRef]
- Khaliq, A.H.; Basharat, M.; Riaz, M.T.; Riaz, M.T.; Wani, S.; Al-Ansari, N.; Le, L.B.; Linh, N.T.T. Spatiotemporal landslide susceptibility mapping using machine learning models: A case study from district Hattian Bala, NW Himalaya, Pakistan. Ain Shams Eng. J. 2023, 14, 101907. [Google Scholar] [CrossRef]
- Huang, J.; Gómez-Dans, J.L.; Huang, H.; Ma, H.; Wu, Q.; Lewis, P.E.; Liang, S.; Chen, Z.; Xue, J.-H.; Wu, Y.; et al. Assimilation of Remote Sensing into Crop Growth Models: Current Status and Perspectives. Agric. For. Meteorol. 2019, 276–277, 107609. [Google Scholar] [CrossRef]
- Ramirez, R.; Lee, S.-R.; Kwon, T.-H. Long-Term Remote Monitoring of Ground Deformation Using Sentinel-1 Interferometric Synthetic Aperture Radar (InSAR): Applications and Insights into Geotechnical Engineering Practices. Appl. Sci. 2020, 10, 7447. [Google Scholar] [CrossRef]
- Casagli, N.; Frodella, W.; Morelli, S.; Tofani, V.; Ciampalini, A.; Intrieri, E.; Raspini, F.; Rossi, G.; Tanteri, L.; Lu, P. Spaceborne, UAV and ground-based remote sensing techniques for landslide mapping, monitoring and early warning. Geoenviron. Disasters 2017, 4, 250–282. [Google Scholar] [CrossRef]
- Chen, G.; Zhang, K.; Wang, S.; Xia, Y.; Chao, L. IHydroSlide3D v1.0: An Advanced Hydrological-Geotechnical Model for Hydrological Simulation and Three-Dimensional Landslide Prediction. Geosci. Model Dev. 2023, 16, 2915–2937. [Google Scholar] [CrossRef]
- Hu, J.P.; Wu, W.B.; Tan, Q.L. Application of Unmanned Aerial Vehicle Remote Sensing for Geological Disaster Reconnaissance along Transportation Lines: A Case Study. Appl. Mech. Mater. 2012, 226–228, 2376–2379. [Google Scholar] [CrossRef]
- Zheng, X.; Sarwar, A.; Islam, F.; Majid, A.; Tariq, A.; Ali, M.; Gulzar, S.; Khan, M.I.; Sardar Ali, M.A.; Israr, M.; et al. Rainwater Harvesting for Agriculture Development Using Multi-Influence Factor and Fuzzy Overlay Techniques. Environ. Res. 2023, 238, 117189. [Google Scholar] [CrossRef]
- Ahmad, N.; Shafique, M.; Hussain, M.L. Landslide assessment by using multi-temporal UAV datasets: A case study in northern Pakistan. Arab. J. Geosci. 2021, 14, 1855. [Google Scholar] [CrossRef]
- Cao, B.; Li, M.; Liu, X.; Zhao, J.; Cao, W.; Lv, Z. Many-Objective Deployment Optimization for a Drone-Assisted Camera Network. IEEE Trans. Netw. Sci. Eng. 2021, 8, 2756–2764. [Google Scholar] [CrossRef]
- Liu, W.; Zhou, H.; Zhang, S.; Zhao, C. Variable Parameter Creep Model Based on the Separation of Viscoelastic and Viscoplastic Deformations. Rock Mech. Rock Eng. 2023, 56, 4629–4645. [Google Scholar] [CrossRef]
- Turner, D.; Lucieer, A.; Watson, C. An Automated Technique for Generating Georectified Mosaics from Ultra-High Resolution Unmanned Aerial Vehicle (UAV) Imagery, Based on Structure from Motion (SfM) Point Clouds. Remote Sens. 2012, 4, 1392–1410. [Google Scholar] [CrossRef]
- Zhou, G.; Wang, Z.; Li, Q. Spatial Negative Co-Location Pattern Directional Mining Algorithm with Join-Based Prevalence. Remote Sens. 2022, 2103. [Google Scholar] [CrossRef]
- Shi, B.; Liu, C. UAV for landslide mapping and deformation analysis. In Proceedings of the International Conference on Intelligent Earth Observing and Applications 2015, Guilin, China, 23–24 October 2015; SPIE: Bellingham, WA, USA, 2015. [Google Scholar]
- Xu, J.; Zhou, G.; Su, S.; Cao, Q.; Tian, Z. The Development of A Rigorous Model for Bathymetric Mapping from Multispectral Satellite-Images. Remote Sens. 2022, 14, 2103. [Google Scholar] [CrossRef]
- Zhang, Y.; Li, S.; Wang, S.; Wang, X.; Duan, H. Distributed Bearing-Based Formation Maneuver Control of Fixed-Wing UAVs by Finite-Time Orientation Estimation. Aerosp. Sci. Technol. 2023, 136, 108241. [Google Scholar] [CrossRef]
- Fernández, T.; Pérez, J.L.; Cardenal, J.; Gómez, J.M.; Colomo, C.; Delgado, J. Analysis of Landslide evolution affecting olive groves using UAV and photogrammetric techniques. Remote Sens. 2016, 8, 837. [Google Scholar] [CrossRef]
- Wheaton, J.M.; Pérez, J.L.; Cardenal, J.; Gómez, J.M.; Colomo, C.; Delgado, J. Linking geomorphic changes to salmonid habitat at a scale relevant to fish. River Res. Appl. 2010, 26, 469–486. [Google Scholar] [CrossRef]
- Ye, B.; Qiu, H.; Tang, B.; Liu, Y.; Liu, Z.; Jiang, X.; Yang, D.; Ullah, M.; Zhu, Y.; Kamp, U. Creep Deformation Monitoring of Landslides in a Reservoir Area. J. Hydrol. 2024, 632, 130905. [Google Scholar] [CrossRef]
- Mohamad, N.; Ahmad, A.; Din, A.H.M. Estimation of surface elevation changes at bare earth riverbank using differential DEM technique of UAV imagery data. Malays. J. Soc. Space 2021, 17, 339–352. [Google Scholar] [CrossRef]
- Ma, S.; Qiu, H.; Hu, S.; Yang, D.; Liu, Z. Characteristics and geomorphology change detection analysis of the Jiangdingya landslide on July 12, 2018, China. Landslides 2021, 18, 383–396. [Google Scholar] [CrossRef]
- Hu, S.; Qiu, H.; Pei, Y.; Cui, Y.; Xie, W.; Wang, X.; Yang, D.; Tu, X.; Zou, Q.; Cao, P.; et al. Digital terrain analysis of a landslide on the loess tableland using high-resolution topography data. Landslides 2019, 16, 617–632. [Google Scholar] [CrossRef]
- Wei, W.; Gong, J.; Deng, J.; Xu, W. Effects of Air Vent Size and Location Design on Air Supply Efficiency in Flood Discharge Tunnel Operations. J. Hydraul. Eng. 2023, 149, 4023050. [Google Scholar] [CrossRef]
- Wheaton, J.M.; Brasington, J.; Darby, S.E.; Sear, D.A. Accounting for uncertainty in DEMs from repeat topographic surveys: Improved sediment budgets. Earth Surf. Process. Landf. J. Br. Geomorphol. Res. Group 2010, 35, 136–156. [Google Scholar] [CrossRef]
- Fu, X.; Ren, M. Sustainable and Low-AoI Cooperative Data Acquisition in UAV-Aided Sensor Networks. IEEE Sens. J. 2024, 24, 9016–9031. [Google Scholar] [CrossRef]
- Kulsoom, I.; Hua, W.; Hussain, S.; Chen, Q.; Khan, G.; Shihao, D. SBAS-InSAR based validated landslide susceptibility mapping along the Karakoram Highway: A case study of Gilgit-Baltistan, Pakistan. Sci. Rep. 2023, 13, 3344. [Google Scholar] [CrossRef]
- Basharat, M.U.; Khan, J.A.; Khalil, U.; Tariq, A.; Aslam, B.; Li, Q. Ensuring Earthquake-Proof Development in a Swiftly Developing Region through Neural Network Modeling of Earthquakes Using Nonlinear Spatial Variables. Buildings 2022, 12, 1713. [Google Scholar] [CrossRef]
- Tian, J.; Wang, B.; Guo, R.; Wang, Z.; Cao, K.; Wang, X. Adversarial Attacks and Defenses for Deep-Learning-Based Unmanned Aerial Vehicles. IEEE Internet Things J. 2022, 9, 22399–22409. [Google Scholar] [CrossRef]
- Hussain, A.; Khan, M.R.; Malik, N.A.; Amin, M.; Shah, M.H.; Tahir, M.N. GIS based mapping and analysis of landslide hazard’s impact on tourism: A case study of Balakot valley, Pakistan. Int. J. Adv. Geosci. 2017, 5, 116–120. [Google Scholar] [CrossRef]
- Soomro, A.S.; Rajput, A.Q.K.; Solangi, S.H. GIS-based fast moving landslide risk analysis model using qualitative approach: A case study of Balakot, Pakistan. J. Eng. Technol. 2011, 30, 307–317. [Google Scholar]
- Liu, L.; Zhang, S.; Zhang, L.; Pan, G.; Yu, J. Multi-UUV Maneuvering Counter-Game for Dynamic Target Scenario Based on Fractional-Order Recurrent Neural Network. IEEE Trans. Cybern. 2023, 53, 4015–4028. [Google Scholar] [CrossRef]
- Riaz, M.T.; Basharat, M.; Brunetti, M.T.; Riaz, M.T. Semi-quantitative landslide risk assessment of district Muzaffarabad, northwestern Himalayas, Pakistan. Stoch. Environ. Res. Risk Assess. 2023, 37, 3551–3570. [Google Scholar] [CrossRef]
- Basharat, M.U.; Khan, J.A.; Abdo, H.G.; Almohamad, H. An integrated approach based landslide susceptibility mapping: Case of Muzaffarabad region, Pakistan. Geomat. Nat. Hazards Risk 2023, 14, 2210255. [Google Scholar] [CrossRef]
- Dai, Z.; Li, X.; Lan, B. Three-Dimensional Modeling of Tsunami Waves Triggered by Submarine Landslides Based on the Smoothed Particle Hydrodynamics Method. J. Mar. Sci. Eng. 2023, 11, 2015. [Google Scholar] [CrossRef]
- Ahmad, M.N.; Shao, Z.; Aslam, R.W.; Ahmad, I.; Liao, M.; Li, X.; Song, Y. Landslide hazard, susceptibility and risk assessment (HSRA) based on remote sensing and GIS data models: A case study of Muzaffarabad Pakistan. Stoch. Environ. Res. Risk Assess. 2022, 36, 4041–4056. [Google Scholar] [CrossRef]
- Yin, L.; Wang, L.; Li, J.; Lu, S.; Tian, J.; Yin, Z.; Liu, S.; Zheng, W. YOLOV4_CSPBi: Enhanced Land Target Detection Model. Land 2023, 12, 1813. [Google Scholar] [CrossRef]
- Hussain, A.; Yeats, R.S.; Lisa, M. Geological setting of the 8 October 2005 Kashmir earthquake. J. Seismol. 2009, 13, 315–325. [Google Scholar] [CrossRef]
- Thomas, O.; Stallings, C.; Wilkinson, B. Unmanned aerial vehicles can accurately, reliably, and economically compete with terrestrial mapping methods. J. Unmanned Veh. Syst. 2019, 8, 57–74. [Google Scholar] [CrossRef]
- Yin, L.; Wang, L.; Keim, B.D.; Konsoer, K.; Yin, Z.; Liu, M.; Zheng, W. Spatial and Wavelet Analysis of Precipitation and River Discharge during Operation of the Three Gorges Dam, China. Ecol. Indic. 2023, 154, 110837. [Google Scholar] [CrossRef]
- Lucieer, A.; Jong, S.M.D.; Turner, D. Mapping landslide displacements using Structure from Motion (SfM) and image correlation of multi-temporal UAV photography. Prog. Phys. Geogr. 2013, 38, 97–116. [Google Scholar] [CrossRef]
- Sheng, H.; Wang, S.; Yang, D.; Cong, R.; Cui, Z.; Chen, R. Cross-View Recurrence-Based Self-Supervised Super-Resolution of Light Field. IEEE Trans. Circuits Syst. Video Technol. 2023, 33, 7252–7266. [Google Scholar] [CrossRef]
- Turner, D.; Lucieer, A.; Jong, S.M.D. Time Series Analysis of Landslide Dynamics Using an Unmanned Aerial Vehicle (UAV). Remote Sens. 2014, 7, 1736–1757. [Google Scholar] [CrossRef]
- Mateos, R.M.; Azañón, J.M.; Roldán, F.J.; Notti, D.; Pérez-Peña, V.; Galve, J.P.; Pérez-García, J.L.; Colomo, C.M.; Gómez-López, J.M.; Montserrat, O.; et al. The combined use of PSInSAR and UAV photogrammetry techniques for the analysis of the kinematics of a coastal landslide affecting an urban area (SE Spain). Landslides 2017, 14, 743–754. [Google Scholar] [CrossRef]
- Hirano, A.; Welch, R.; Lang, H. Mapping from ASTER stereo image data: DEM validation and accuracy assessment. ISPRS J. Photogramm. Remote Sens. 2003, 57, 356–370. [Google Scholar] [CrossRef]
- Yang, D.; Cui, Z.; Sheng, H.; Chen, R.; Cong, R.; Wang, S.; Xiong, Z. An Occlusion and Noise-Aware Stereo Framework Based on Light Field Imaging for Robust Disparity Estimation. IEEE Trans. Comput. 2024, 73, 764–777. [Google Scholar] [CrossRef]
- Zhang, K.; Gann, D.; Ross, M.; Robertson, Q.; Sarmiento, J.; Santana, S.; Rhome, J.; Fritz, C. Accuracy assessment of ASTER, SRTM, ALOS, and TDX DEMs for Hispaniola and implications for mapping vulnerability to coastal flooding. Remote Sens. Environ. 2019, 225, 290–306. [Google Scholar] [CrossRef]
- Yordanov, V.; Truong, Q.X.; Brovelli, M.A. Estimating Landslide Surface Displacement by Combining Low-Cost UAV Setup, Topographic Visualization and Computer Vision Techniques. Drones 2023, 7, 85. [Google Scholar] [CrossRef]
- Teo, T.-A.; Fu, Y.-J.; Li, K.-W.; Weng, M.-C.; Yang, C.-M. Comparison between image-and surface-derived displacement fields for landslide monitoring using an unmanned aerial vehicle. Int. J. Appl. Earth Obs. Geoinf. 2023, 116, 103164. [Google Scholar] [CrossRef]
- Huntley, D.; Rotheram-Clarke, D.; MacLeod, R.; Cocking, R.; LeSueur, P.; Lakeland, B.; Wilson, A. Scalable Platform for UAV Flight Operations, Data Capture, Cloud Processing and Image Rendering of Landslide Hazards and Surface Change Detection for Disaster-Risk Reduction. In Progress in Landslide Research and Technology; Springer: Berlin/Heidelberg, Germany, 2023; Volume 1, pp. 49–61. [Google Scholar]
- Melis, M.T.; Da Pelo, S.; Erbì, I.; Loche, M.; Deiana, G.; Demurtas, V.; Meloni, M.A.; Dessì, F.; Funedda, A.; Scaioni, M.; et al. Thermal Remote Sensing from UAVs: A Review on Methods in Coastal Cliffs Prone to Landslides. Remote Sens. 2020, 12, 1971. [Google Scholar] [CrossRef]
- Bentley, M.J.; Foster, J.M.; Potvin, J.J.; Bevan, G.; Sharp, J.; Woeller, D.J.; Take, W.A. Surface displacement expression of progressive failure in a sensitive clay landslide observed with long-term UAV monitoring. Landslides 2023, 20, 531–546. [Google Scholar] [CrossRef]
- Aslam, R.W.; Shu, H.; Tariq, A.; Naz, I.; Ahmad, M.N.; Quddoos, A.; Javid, K.; Mustafa, F.; Aeman, H. Monitoring Landuse Change in Uchhali and Khabeki Wetland Lakes, Pakistan Using Remote Sensing Data. Gondwana Res. 2024, 129, 252–267. [Google Scholar] [CrossRef]
- Ma, S.; Qiu, H.; Zhu, Y.; Yang, D.; Tang, B.; Wang, D.; Wang, L.; Cao, M. Topographic Changes, Surface Deformation and Movement Process before, during and after a Rotational Landslide. Remote Sens. 2023, 15, 662. [Google Scholar] [CrossRef]
- Liu, Z.; Qiu, H.; Zhu, Y.; Liu, Y.; Yang, D.; Ma, S.; Zhang, J.; Wang, Y.; Wang, L.; Tang, B. Efficient identification and monitoring of landslides by time-series InSAR combining single-and multi-look phases. Remote Sens. 2022, 14, 1026. [Google Scholar] [CrossRef]
- Mao, Z.; Hu, S.; Wang, N.; Long, Y. Precision evaluation and fusion of topographic data based on UAVs and TLS surveys of a loess landslide. Front. Earth Sci. 2021, 9, 801293. [Google Scholar] [CrossRef]
- Giordan, D.; Adams, M.S.; Aicardi, I.; Alicandro, M.; Allasia, P.; Baldo, M.; De Berardinis, P.; Dominici, D.; Godone, D.; Hobbs, P.; et al. The use of unmanned aerial vehicles (UAVs) for engineering geology applications. Bull. Eng. Geol. Environ. 2020, 79, 3437–3481. [Google Scholar] [CrossRef]
- Karantanellis, E.; Marinos, V.; Vassilakis, E.; Christaras, B. Object-Based Analysis Using Unmanned Aerial Vehicles (UAVs) for Site-Specific Landslide Assessment. Remote Sens. 2020, 12, 1711. [Google Scholar] [CrossRef]


| S. No | Landslide | Date of Acquisition | Spatial Resolution (cm) |
|---|---|---|---|
| 1 | Nara | 04-04-19 | 8 |
| 2 | Nara | 15-08-19 | 7 |
| 3 | Nara | 28-07-22 | 8 |
| 4 | Nokot | 04-04-19 | 7 |
| 5 | Nokot | 15-08-19 | 8 |
| 6 | Nokot | 27-07-22 | 8 |
| Nara Landslide Geomorphological Change Analysis | ||
|---|---|---|
| Conversion | Area (m2) | Changes in the Landslide Zones |
| Active to Dormant | 2222.11 | Vegetated area along the transition zone |
| Dormant to Suspended | 7570.20 | The area along the main scarp and its surrounding |
| Dormant to Active | 585.55 | Secondary scarp and transition area |
| Suspended to Active | 2367.43 | Secondary scarp and transition area |
| Suspended to Dormant | 727.06 | The area along the secondary scarp |
| Intact Active | 10,132.88 | The main and secondary scarp region |
| Intact Dormant | 51,210.01 | Stabilizing region over the main scarp and transition zone |
| Intact Suspended | 451.47 | The vegetated portion of the landslide |
| Nokot Landslide Geomorphological Change Analysis | ||
| Active to Dormant | 3371.20 | Around the transition zone |
| Dormant to Suspended | 710.65 | Near the accumulation and toe |
| Active to Suspended | 649.99 | Near the accumulation and WE scarp region |
| Dormant to Active | 1482.07 | In the NW and SW scarp region |
| Suspended to Active | 2372.65 | NS scarp |
| Suspended to Dormant | 861.30 | Accumulation and transition zone |
| Intact Active | 41,265.65 | Along the scarp |
| Intact Dormant | 861.30 | Along the transition zone |
| Intact Suspended | 1566.95 | Along the accumulation zone, specifically the NE part |
| DEM of Difference | Total Area of Surface Lowering (m2) | Total Area of Surface Raising (m2) | Total Area of Detectable Change (m2) | Total Area of Interest (m2) |
|---|---|---|---|---|
| Nara Landslide | ||||
| August–April 2019 | 2613.71 | 35,124.83 | NA | 37,738.55 |
| July 22–August 2019 | 37,726.63 | 9.59 | NA | 37,736.22 |
| July 22–April 2019 | 37,739.64 | 4.53 | NA | 37,744.1 |
| Nokot Landslide | ||||
| August–April 2019 | 56,904 | 61 | NA | 56,965 |
| July 22–August 2019 | 56,978 | 0 | NA | 56,978 |
| July 22–April 2019 | 57,005 | 0 | NA | 57,005 |
| DEM of Difference | Total Volume of Surface Lowering (m3) | Total Volume of Surface Raising (m3) |
|---|---|---|
| Nara Landslide | ||
| August–April 2019 | 17,392.44 | 184,432.99 |
| July 22–August 2019 | 2,357,482.13 | 812.71 |
| July 22–April 2019 | 2,190,400.37 | 298.82 |
| Nokot Landslide | ||
| August–April 2019 | 651,471.13 | 117.98 |
| July 22–August 2019 | 2,590,821.21 | 0 |
| July 22–April 2019 | 3,243,829 | 0 |
| DEM of Difference | Total Area of Surface Lowering (m2) | Total Area of Surface Raising (m2) |
|---|---|---|
| Nara Landslide | ||
| August–April 2019 | 37,739.64 | 4.53 |
| July 22–August 2019 | 37,726.63 | 9.59 |
| July 22–April 2019 | 2613.71 | 35,124.83 |
| Total of All Compared | 78,079.99 | 35,138.96 |
| Nokot Landslide | ||
| August–April 2019 | 56,904.00 | 61.00 |
| July 22–August 2019 | 57,005.00 | 0.00 |
| July 22–April 2019 | 56,978.00 | 0.00 |
| Total of All Compared | 170,887.00 | 61.00 |
| DEM of Difference | Total Volume of Surface Lowering (m3) | Total Volume of Surface Raising (m3) |
|---|---|---|
| Nara Landslide | ||
| August–April 2019 | 2,190,400.37 | 298.82 |
| July 22–August 2019 | 2,357,482.13 | 812.71 |
| July 22–April 2019 | 17,392.44 | 184,432.99 |
| Total of All Compared | 4,565,274.96 | 185,544.53 |
| Nokot Landslide | ||
| August–April 2019 | 651,471.13 | 117.98 |
| July 22–August 2019 | 3,243,828.95 | 0.00 |
| July 22–April 2019 | 2,590,821.21 | 0.00 |
| Total of All Compared | 6,486,121.30 | 117.98 |
Disclaimer/Publisher’s Note: The statements, opinions and data contained in all publications are solely those of the individual author(s) and contributor(s) and not of MDPI and/or the editor(s). MDPI and/or the editor(s) disclaim responsibility for any injury to people or property resulting from any ideas, methods, instructions or products referred to in the content. |
© 2024 by the authors. Licensee MDPI, Basel, Switzerland. This article is an open access article distributed under the terms and conditions of the Creative Commons Attribution (CC BY) license (https://creativecommons.org/licenses/by/4.0/).
Share and Cite
Ahmad, N.; Shafique, M.; Hussain, M.L.; Islam, F.; Tariq, A.; Soufan, W. Characterization and Geomorphic Change Detection of Landslides Using UAV Multi-Temporal Imagery in the Himalayas, Pakistan. Land 2024, 13, 904. https://doi.org/10.3390/land13070904
Ahmad N, Shafique M, Hussain ML, Islam F, Tariq A, Soufan W. Characterization and Geomorphic Change Detection of Landslides Using UAV Multi-Temporal Imagery in the Himalayas, Pakistan. Land. 2024; 13(7):904. https://doi.org/10.3390/land13070904
Chicago/Turabian StyleAhmad, Naseem, Muhammad Shafique, Mian Luqman Hussain, Fakhrul Islam, Aqil Tariq, and Walid Soufan. 2024. "Characterization and Geomorphic Change Detection of Landslides Using UAV Multi-Temporal Imagery in the Himalayas, Pakistan" Land 13, no. 7: 904. https://doi.org/10.3390/land13070904
APA StyleAhmad, N., Shafique, M., Hussain, M. L., Islam, F., Tariq, A., & Soufan, W. (2024). Characterization and Geomorphic Change Detection of Landslides Using UAV Multi-Temporal Imagery in the Himalayas, Pakistan. Land, 13(7), 904. https://doi.org/10.3390/land13070904