Abstract
Exploring the evolution of the production patterns of major crops and their driving factors can provide new ideas to ensure the security of supply of important agricultural products. This study selected four major crop types in Jilin Province—grain, oil crop, vegetable, and fruit—as research subjects. Using the center of gravity migration model, spatial autocorrelation analysis, and comparative advantage index, the spatial and temporal evolution of these crops’ production patterns from 2000 to 2020 was examined. A geographically weighted regression model was employed to analyze driving factors. The results showed that the planting area of grain was the most extensive; the percentage of production of grain, oil crop, and fruit increased to different degrees; the unit area yield of the four crops increased. The centers of gravity of all four crops’ productions were located in the central-northwestern region of Jilin Province. The global Moran’s I was positive for all four crops’ productions. The comparative advantage characteristics of the four crops were closely related to the natural geographical environment. Grain, vegetable, and fruit production were significantly and positively correlated with fertilizer application, and the most significant factor affecting oil crop production was land input intensity.
1. Introduction
In the report to the Twentieth National Congress of the Communist Party of China (CPC), General Secretary Xi Jinping emphasizes the imperative need to fully, accurately, and comprehensively implement the new development concept to expedite the construction of the new development pattern, characterized by a dominant domestic macrocycle and reinforced by both domestic and international dual cycles, with a view to elevating China’s economic development and creating new advantages in international economic cooperation and competition. The new development stage and the implementation of the new development concept inevitably require the construction of the new development pattern, which underscores the importance of focusing on securing the supply of food and other essential agricultural products, promoting structural reform on the agricultural supply side, optimizing agricultural production structures, and improving the regional distribution of agricultural production. The 2023 no. 1 document of the Communist Party of China Central Committee underscores the importance of ensuring stable production and supply of food and key agricultural products, strengthening agricultural infrastructure, enhancing support through agricultural science and technology, and fostering high-quality development of rural industries. This emphasis reflects China’s commitment to optimizing the structure and regional layout of agricultural production, securing the supply of essential agricultural products, and improving the quality, efficiency, and competitiveness of agriculture. Within the new development pattern, the study of crop production is fundamental for the rational allocation of production resources, ensuring the security of essential agricultural supplies, scientifically planning agricultural production layouts, optimizing industrial structures, and advancing structural reforms on the agricultural supply side.
Crop production stands as a pivotal research domain within agricultural geography and geographic information science [1,2]. The global spotlight now shines on optimizing crop production, enhancing agricultural efficiency, and ensuring crop safety [3,4,5,6,7]. Recent years have witnessed diversified scholarly discussions on crop production, spanning various research lenses [8,9,10,11,12]. Some researchers delve into the evolution of production patterns for singular crops like grain, soybean, and vegetable, while others explore patterns for multiple crops [2,13,14,15,16]. To bolster crop productivity, scholars leverage technology to combat soil salinity, enhance germplasm, and develop nanofertilizers, alongside conducting security assessments and production forecasts [17,18,19,20,21,22,23,24]. Certain studies unveil cover crops’ ecological impact on ecosystem services, advocate for farmland relocation to mitigate environmental repercussions, predict potential soil degradation, and suggest integrating hardy alternative crops into production systems [25,26,27]. Addressing escalating crop demands and ensuing land use pressures, researchers experiment with seaweed aquaculture as a viable substitute for terrestrial crops in food or biofuel production [28]. In addition, some scholars have explored the factors affecting agricultural production from the perspectives of climate change, farmer behavior, demographic shifts, technological advancements, and micronutrient considerations [29,30,31,32,33,34,35,36,37,38,39,40,41].
Jilin Province, situated in the hinterland of the Northeast Plain, is one of the three major black soil belts in the world and serves as a significant agricultural province and a crucial commercial food production base in China. Exploring the evolution of the production patterns of major crops and their driving factors in Jilin Province is not only an important academic endeavor but also a pressing practical necessity. However, current studies on the evolution of crop production patterns and their driving factors in Jilin Province are limited, with issues such as a singular research focus, overly large spatial scales, and a lack of quantitative analysis of driving factors [42,43,44]. These limitations hinder a comprehensive understanding of the regional crop production layout and impede efforts to adjust and optimize agricultural production structures. This study focuses on Jilin Province, using counties as the basic research units, and examines four major crop categories: grain, oil crop, vegetable, and fruit. By employing the center of gravity migration model, spatial autocorrelation analysis, and comparative advantage index, this paper reveals the spatial and temporal evolution characteristics of the major crop production patterns in Jilin Province from 2000 to 2020. Additionally, it analyzes the driving factors using the geographically weighted regression model. The aim is to provide recommendations and references for optimizing the spatial layout of crop production, improving crop production efficiency, and ensuring the safety of crop production.
2. Materials and Methods
2.1. Study Area
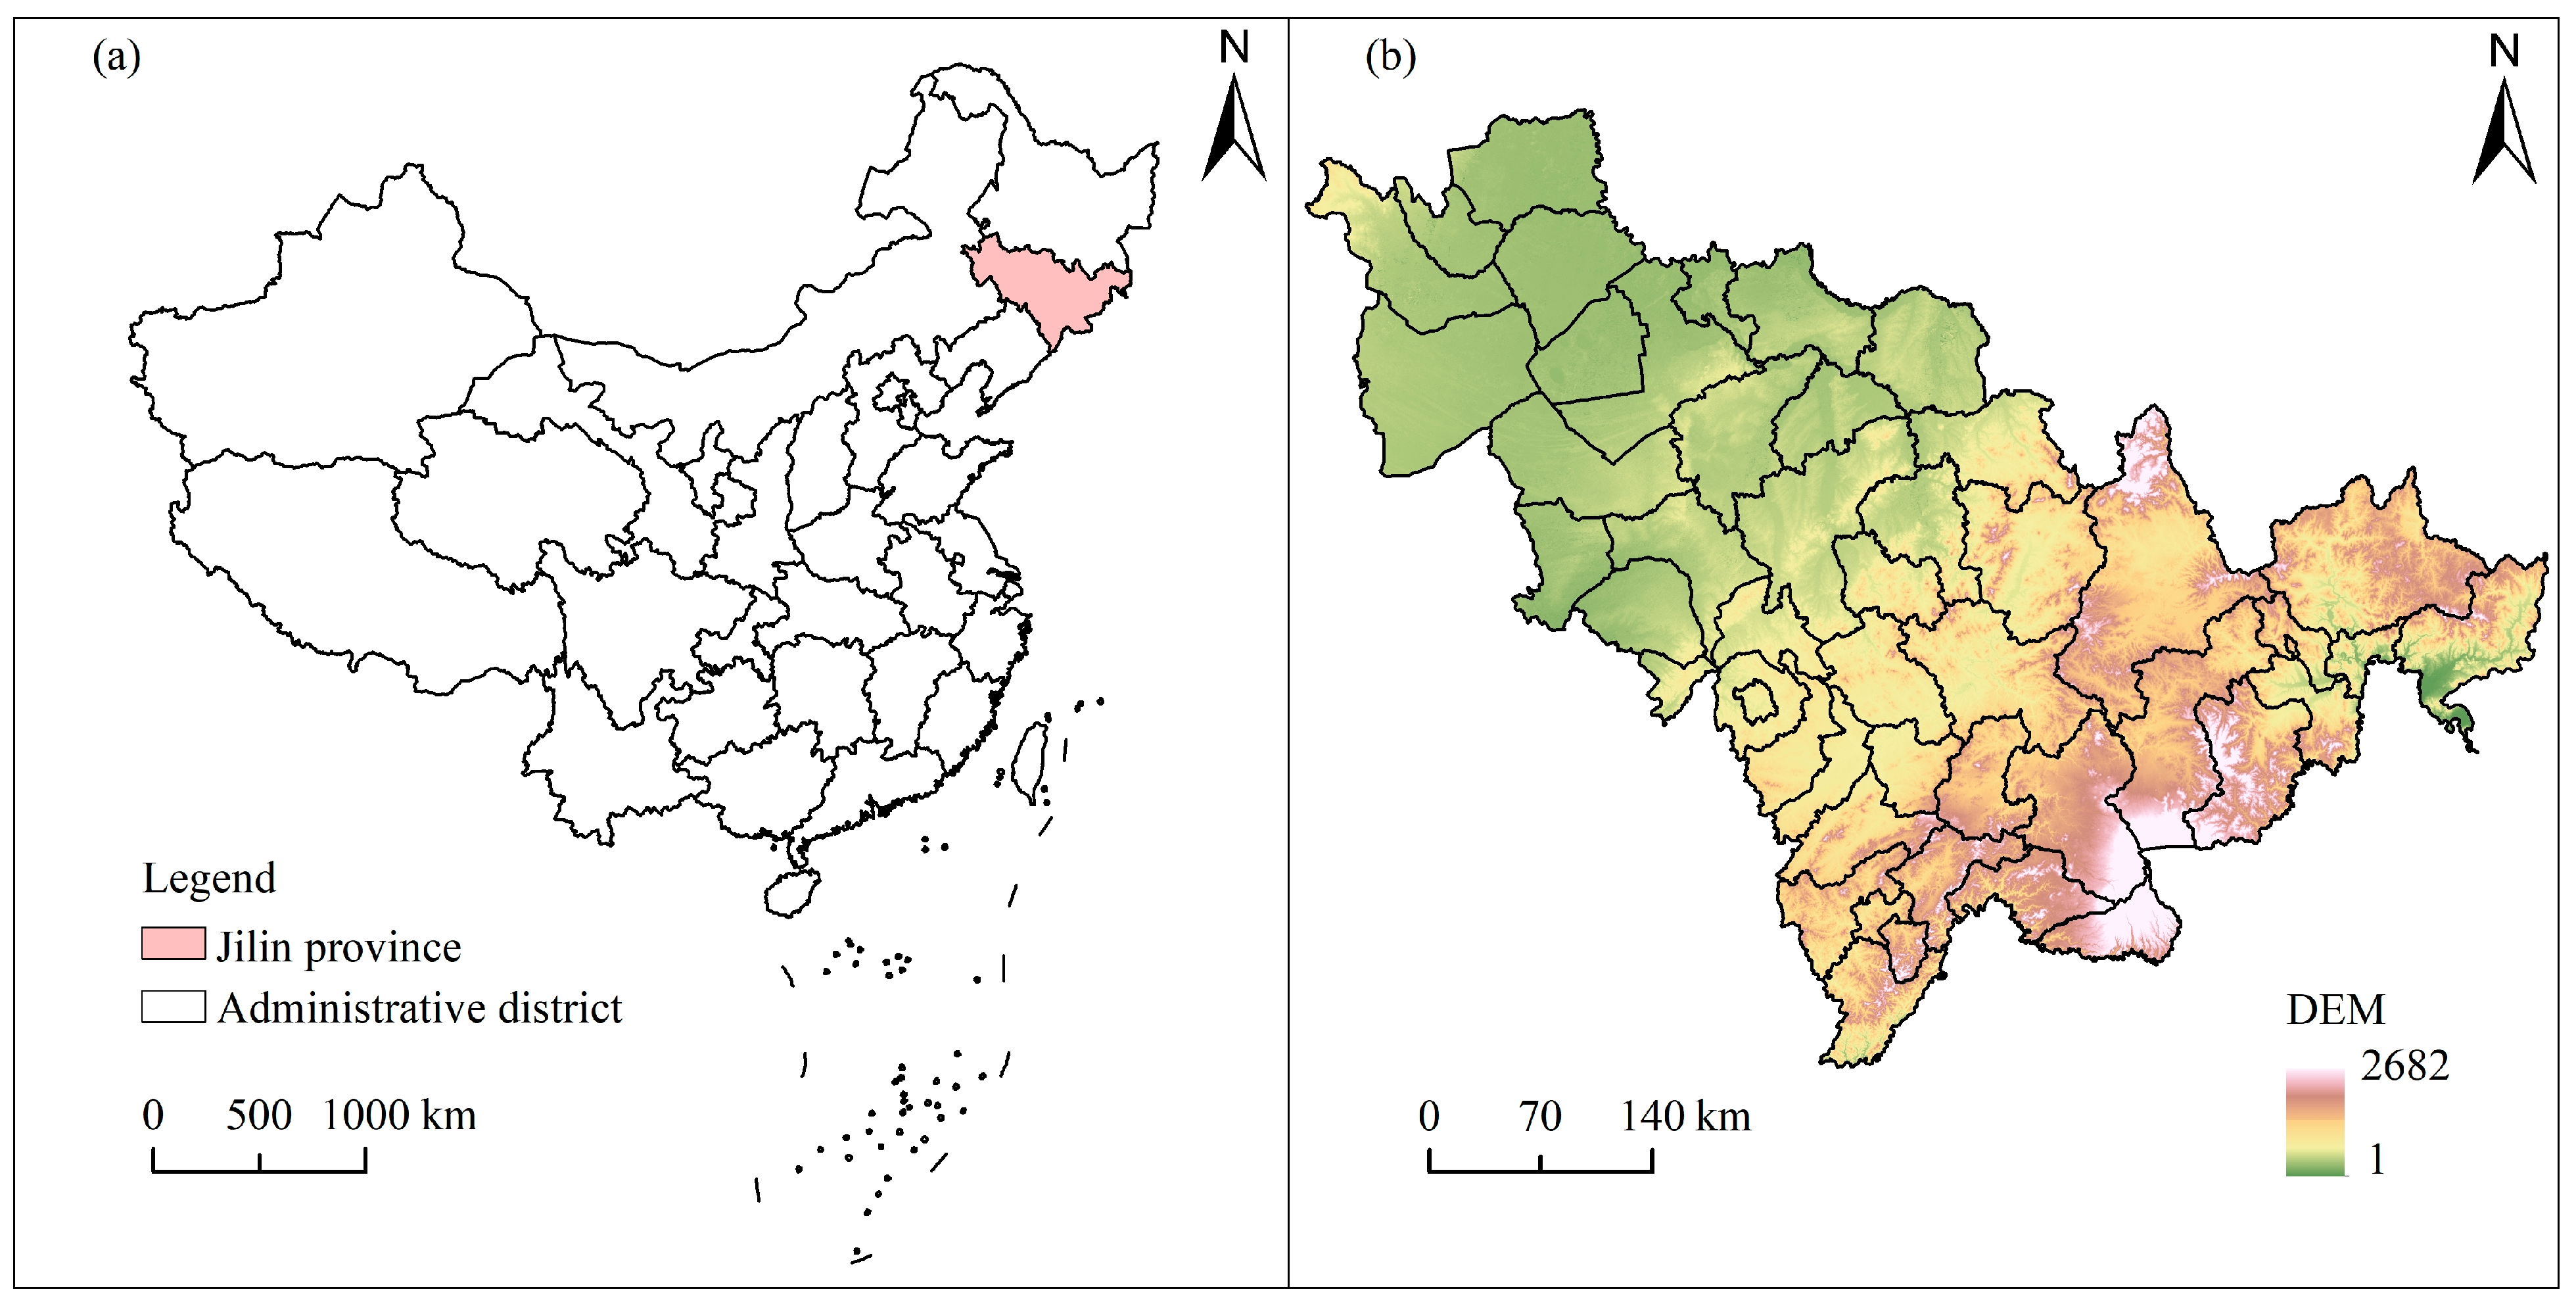
Jilin Province, located in northeastern China (Figure 1), spans from 121°38′ E to 131°19′ E and from 40°50′ N to 46°19′ N. The highest elevation is 2691 m, the lowest elevation is 5 m, and the average elevation is 353 m. The terrain varies, being higher in the southeast and lower in the northwest. The region is divided into plains and mountains, with the western foot of Dahei Mountain as the boundary. Covering a total area of 187,400 km², 37% of the land is cultivated. Jilin Province is located on the eastern side of the mid-latitude Eurasian continent and experiences a temperate continental monsoon climate, characterized by distinct seasons and concurrent heat and precipitation. In 2023, the highest temperatures, reaching up to 35 °C, occurred from July to September, while the lowest temperatures, dropping to −30 °C, were recorded from December to February. The growing season for crops such as grains and oilseeds spans from May to September, with an average temperature of 18.8 °C. The average annual precipitation ranges from approximately 300 to 900 mm. The soil types vary across the province: black calcium soil and meadow soil dominate in the western region; dark brown soil, black soil, and meadow soil are prevalent in the central region; and dark brown soil and bleached soil are typical in the eastern region. As one of the largest black soil areas in China, Jilin boasts fertile land and is a key agricultural production area, predominantly producing grain, rapeseeds, potatoes, and fruits. Jilin Province serves as a significant agricultural province and a crucial commercial food production base in China. It ranks third in the country for the unit area yield of grain, fourth for the unit area yield of oil crop, fifteenth for the unit area yield of vegetable, and seventh for the unit area yield of fruit.
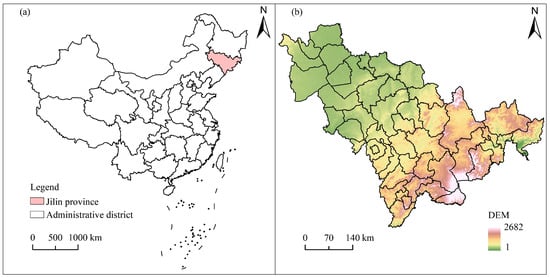
Figure 1.
Location of the study area. (a) China; (b) Jilin Province.
2.2. Data Sources
Between 2000 and 2020, Jilin Province underwent several administrative changes, including the re-demarcation of municipal districts, adjustments of subordinate counties, and modifications of jurisdictional areas. To ensure consistency, the 2020 administrative division was used as a benchmark, resulting in 47 county units (including counties, county-level cities, and municipal districts) being identified as the basic research units. Data on production, planting area, and drivers for four types of crops—grain, oil crop, vegetable, and fruit—were primarily sourced from the China Rural Statistical Yearbook (2001–2021), China Statistical Yearbook (2001–2021), China County Statistical Yearbook (2001–2021), Jilin Statistical Yearbook (2000–2021), and the statistical yearbooks and bulletins of various cities and counties. Digital elevation model (DEM) and slope data were obtained from the geospatial data cloud of the Chinese Academy of Sciences (http://www.gscloud.cn/, accessed on 16 April 2024) with a spatial resolution of 30 m. Temperature and precipitation data were sourced from the ERA5-Land dataset, published by the European Union and the European Centre for Medium-Range Weather Forecasts, among other organizations (https://cds.climate.copernicus.eu, accessed on 16 April 2024).
2.3. Methods
This study selected four major crop types in Jilin Province—grain, oil crop, vegetable, and fruit—as research subjects. Using the center of gravity migration model, spatial autocorrelation analysis, and comparative advantage index, the spatial and temporal evolution of these crops’ production patterns from 2000 to 2020 was examined. A geographically weighted regression model was employed to analyze driving factors. The general framework of the study is shown in Figure 2.
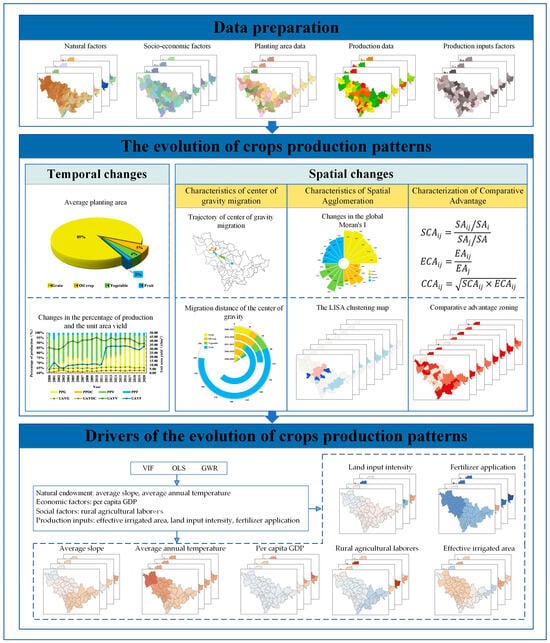
Figure 2.
Study framework.
2.3.1. Center of Gravity Migration Model
The center of gravity migration model determines the direction and distance in which the center of gravity point of a regional crop moves between years [45,46,47], assuming that a region consists of n sub-regions i with the following equation:
where (x, y) are the coordinates of the center of gravity of the study area, (Xi, Yi) are the coordinates of the center of area i, Mi is the “weight” of area i in the sense of a certain attribute, Db−a is the spatial movement of the center of gravity of the study area in two periods, R is the coefficient of converting the geographic coordinate unit to the distance in the plane (km), usually taking the value of 111.111 km, (xa, ya) and (xb, yb) refer to the coordinates of the center of gravity of the study area in years a and b, respectively.
2.3.2. Spatial Autocorrelation Analysis
Spatial autocorrelation analysis can test the spatial clustering relationship [48,49,50]. The global spatial autocorrelation indicator Moran’s I mainly explores the strength of spatial convergence characteristics of attribute data values over the entire regional distribution, reflecting the degree of similarity of attribute values of spatially adjacent or spatially neighboring regional units. The formula is as follows:
where n is the total number of spatial units in the study area; Wij is the spatial weight matrix; xi is the observed value of area i. Moran’s I coefficients take the value of [−1, 1], with I < 0 indicating a negative correlation, I = 0 indicating an uncorrelation, and I > 0 indicating a positive correlation.
The global Moran’s I may ignore the potential instability problem of the spatial process, so a local spatial autocorrelation analysis is performed to determine the local spatial clustering of the observations. The formula is as follows:
where is the variance, where j ≠ i. Ii > 0 denotes a high value surrounded by a high value (H-H), or a low value surrounded by a low value (L-L); Ii < 0 denotes a low value surrounded by a high value (L-H), or a high value surrounded by a low value (H-L).
2.3.3. Comparative Advantage Index
The scale comparative advantage (SCA) index reflects the production scale and specialization degree of crops. By analyzing the ratio of the planting area of a specific crop in a particular county to the total planting area of all crops in that county and comparing it with the average ratio in Jilin Province, the index assesses the relative importance and scale advantage of that crop in the county’s agricultural production [51,52]. The formula is as follows:
where SCAij represents the scale comparative advantage index of category j crops in region i; SAij represents the planting area of category j crops in region i; SAi represents the total planting area of crops in region i; SAj represents the planting area of category j crops in the higher level region; and SA represents the total planting area of crops in the higher level region. If SCAij > 1, it means that, compared with the average level of the higher level area, category j crops in area i have a comparative advantage in the scale of production, and the larger the value of SCAij, the greater the advantage; if SCAij < 1, it is the opposite.
The efficiency comparative advantage (ECA) index primarily analyzes the relationship between the unit area yield of specific crops in a particular county and the unit area yield of the same crops across Jilin Province. This comparison examines the relative production efficiency of the region for the specified crops [51,52]. The formula is as follows:
where ECAij represents the comparative efficiency advantage index of category j crops in region i, EAij represents the unit area yield of category j crops in region i, and EAj represents the unit area yield of category j crops in the higher level region. If ECAij > 1, it indicates that, compared with the average level of the higher level area, the production efficiency of category j crops in area i has an advantage, and the larger the value of ECAij, the greater its advantage; if ECAij < 1, it is the opposite.
The comprehensive comparative advantage (CCA) index assesses the relative comparative advantage of specific crops in particular counties by considering both the scale comparative advantage and the efficiency comparative advantage [51,52]. The formula is as follows:
where CCAij represents the comprehensive comparative advantage index of crop production of category j in region i. When CCAij > 1, it indicates that, compared with the higher level of the region, the production of category j crops in region i has a comprehensive comparative advantage, and the larger the value of CCAij, the greater its advantage; when CCAij < 1, it is the opposite.
Firstly, based on the CCA values, regions are classified into advantage zone and disadvantage zone. If CCA > 1, it indicates an advantage zone; if CCA < 1, it indicates a disadvantage zone. Within the advantage zone, if both SCA > 1 and ECA > 1, it signifies that the region possesses both scale and efficiency comparative advantages, thereby categorizing it as a balanced zone of advantage. If SCA > 1 and ECA < 1, the region has a scale comparative advantage but lacks an efficiency comparative advantage, with the scale advantage being more significant, thereby categorizing it as a scale dominant advantage zone. Conversely, if SCA < 1 and ECA > 1, the region has an efficiency comparative advantage but lacks a scale comparative advantage, with the efficiency advantage being more significant, thereby categorizing it as an efficiency dominant advantage zone. In the disadvantage zone, if SCA > 1 and ECA < 1, the region has a scale comparative advantage but lacks an efficiency comparative advantage, with the efficiency disadvantage being more pronounced, thereby categorizing it as an inefficient disadvantage zone. If SCA < 1 and ECA > 1, the region has an efficiency comparative advantage but lacks a scale comparative advantage, with the scale disadvantage being more pronounced, thereby categorizing it as a low scale disadvantage zone. If both SCA < 1 and ECA < 1, the region lacks both scale and efficiency comparative advantages, thereby categorizing it as a categorical disadvantage zone.
2.3.4. Geographically Weighted Regression Models
The geographically weighted regression (GWR) model is derived from the ordinary linear regression least squares (OLS) method, which has the advantages of applying spatial weight matrices to linear regression models, reflecting the existence of spatial dependence and spatial differentiation patterns of the study variables, etc., as compared with traditional regression analysis [53,54,55]. The formula is as follows:
where yi is the value of the dependent variable for area i; (ui, vi) is the geographic coordinates of area i; β0(ui,vi) denotes the intercept of the regression equation; βm(ui,vi) is the regression coefficient of the mth independent variable for area i; xim is the mth independent variable for area i; and εi is the error term.
3. Result
3.1. Characteristics of Temporal Changes in Crop Production Capacity
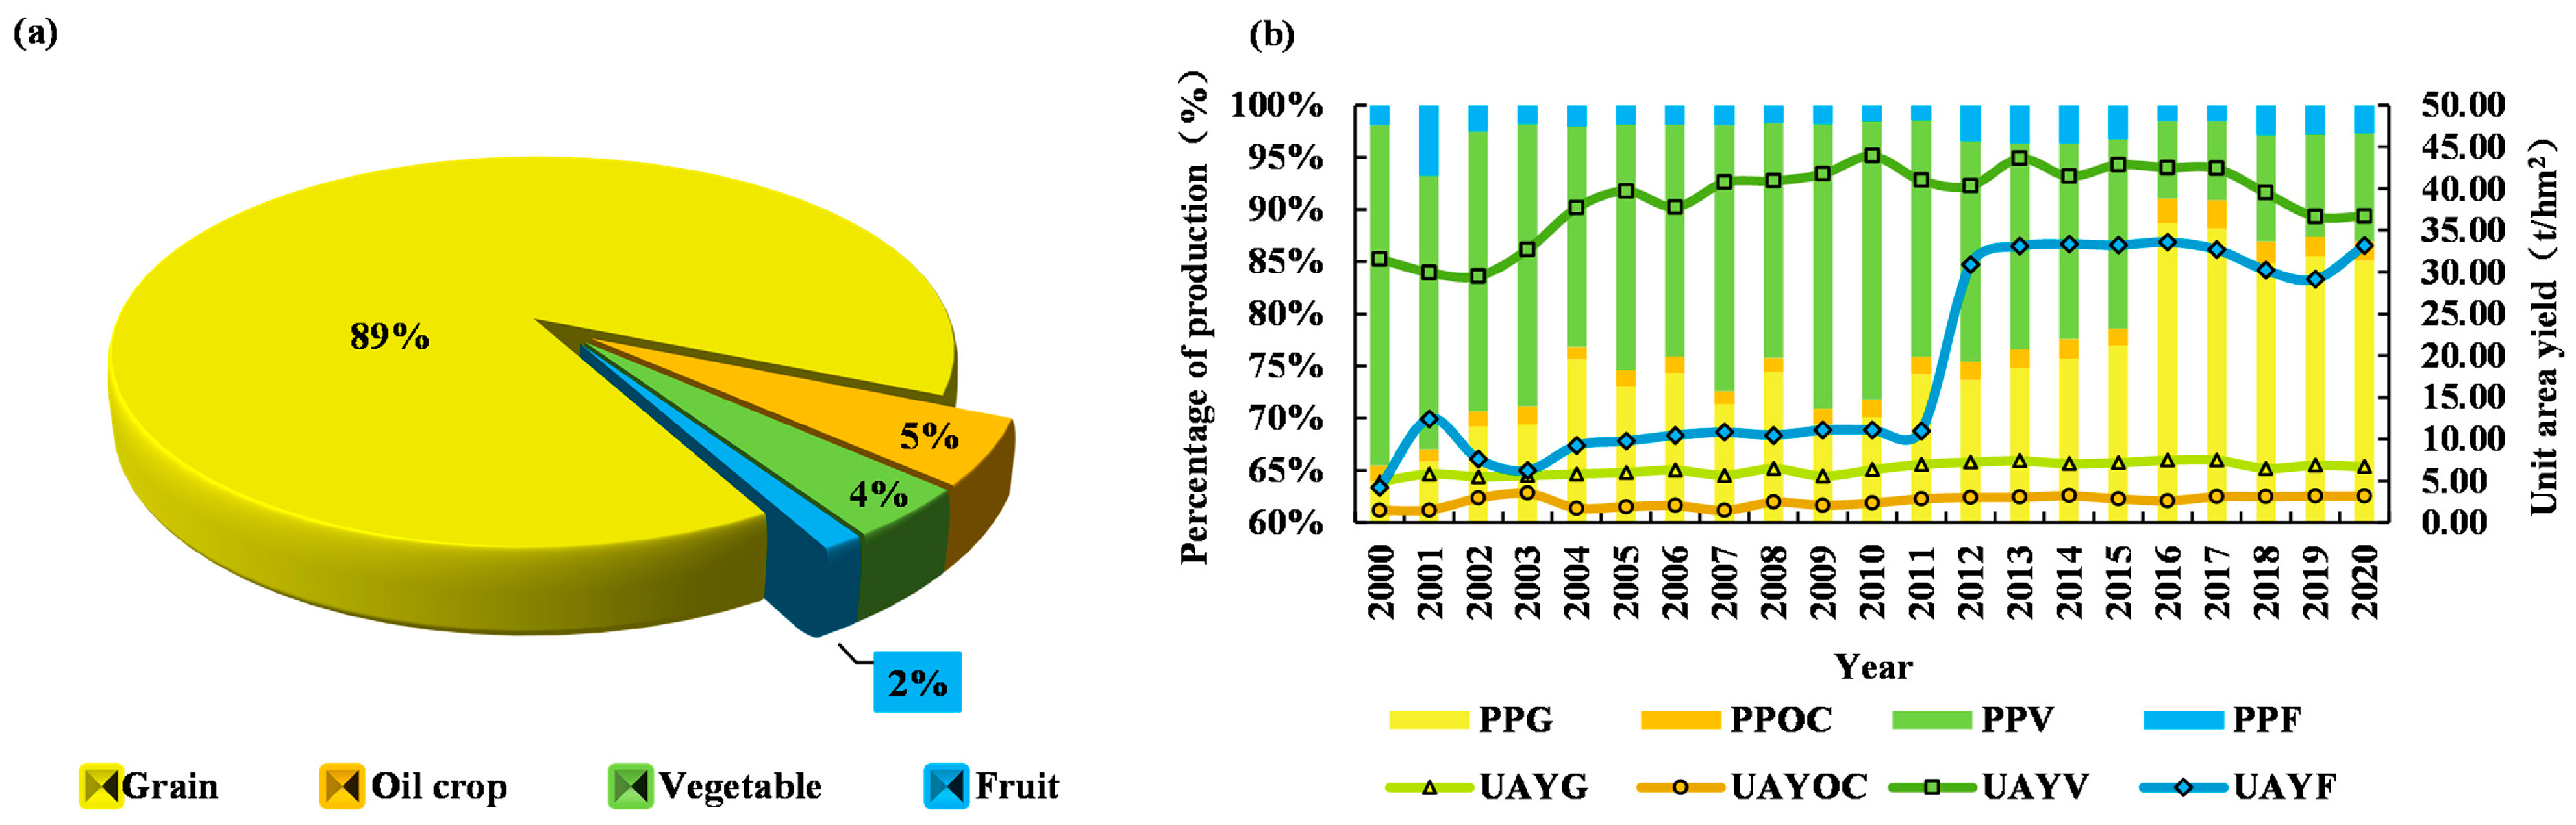
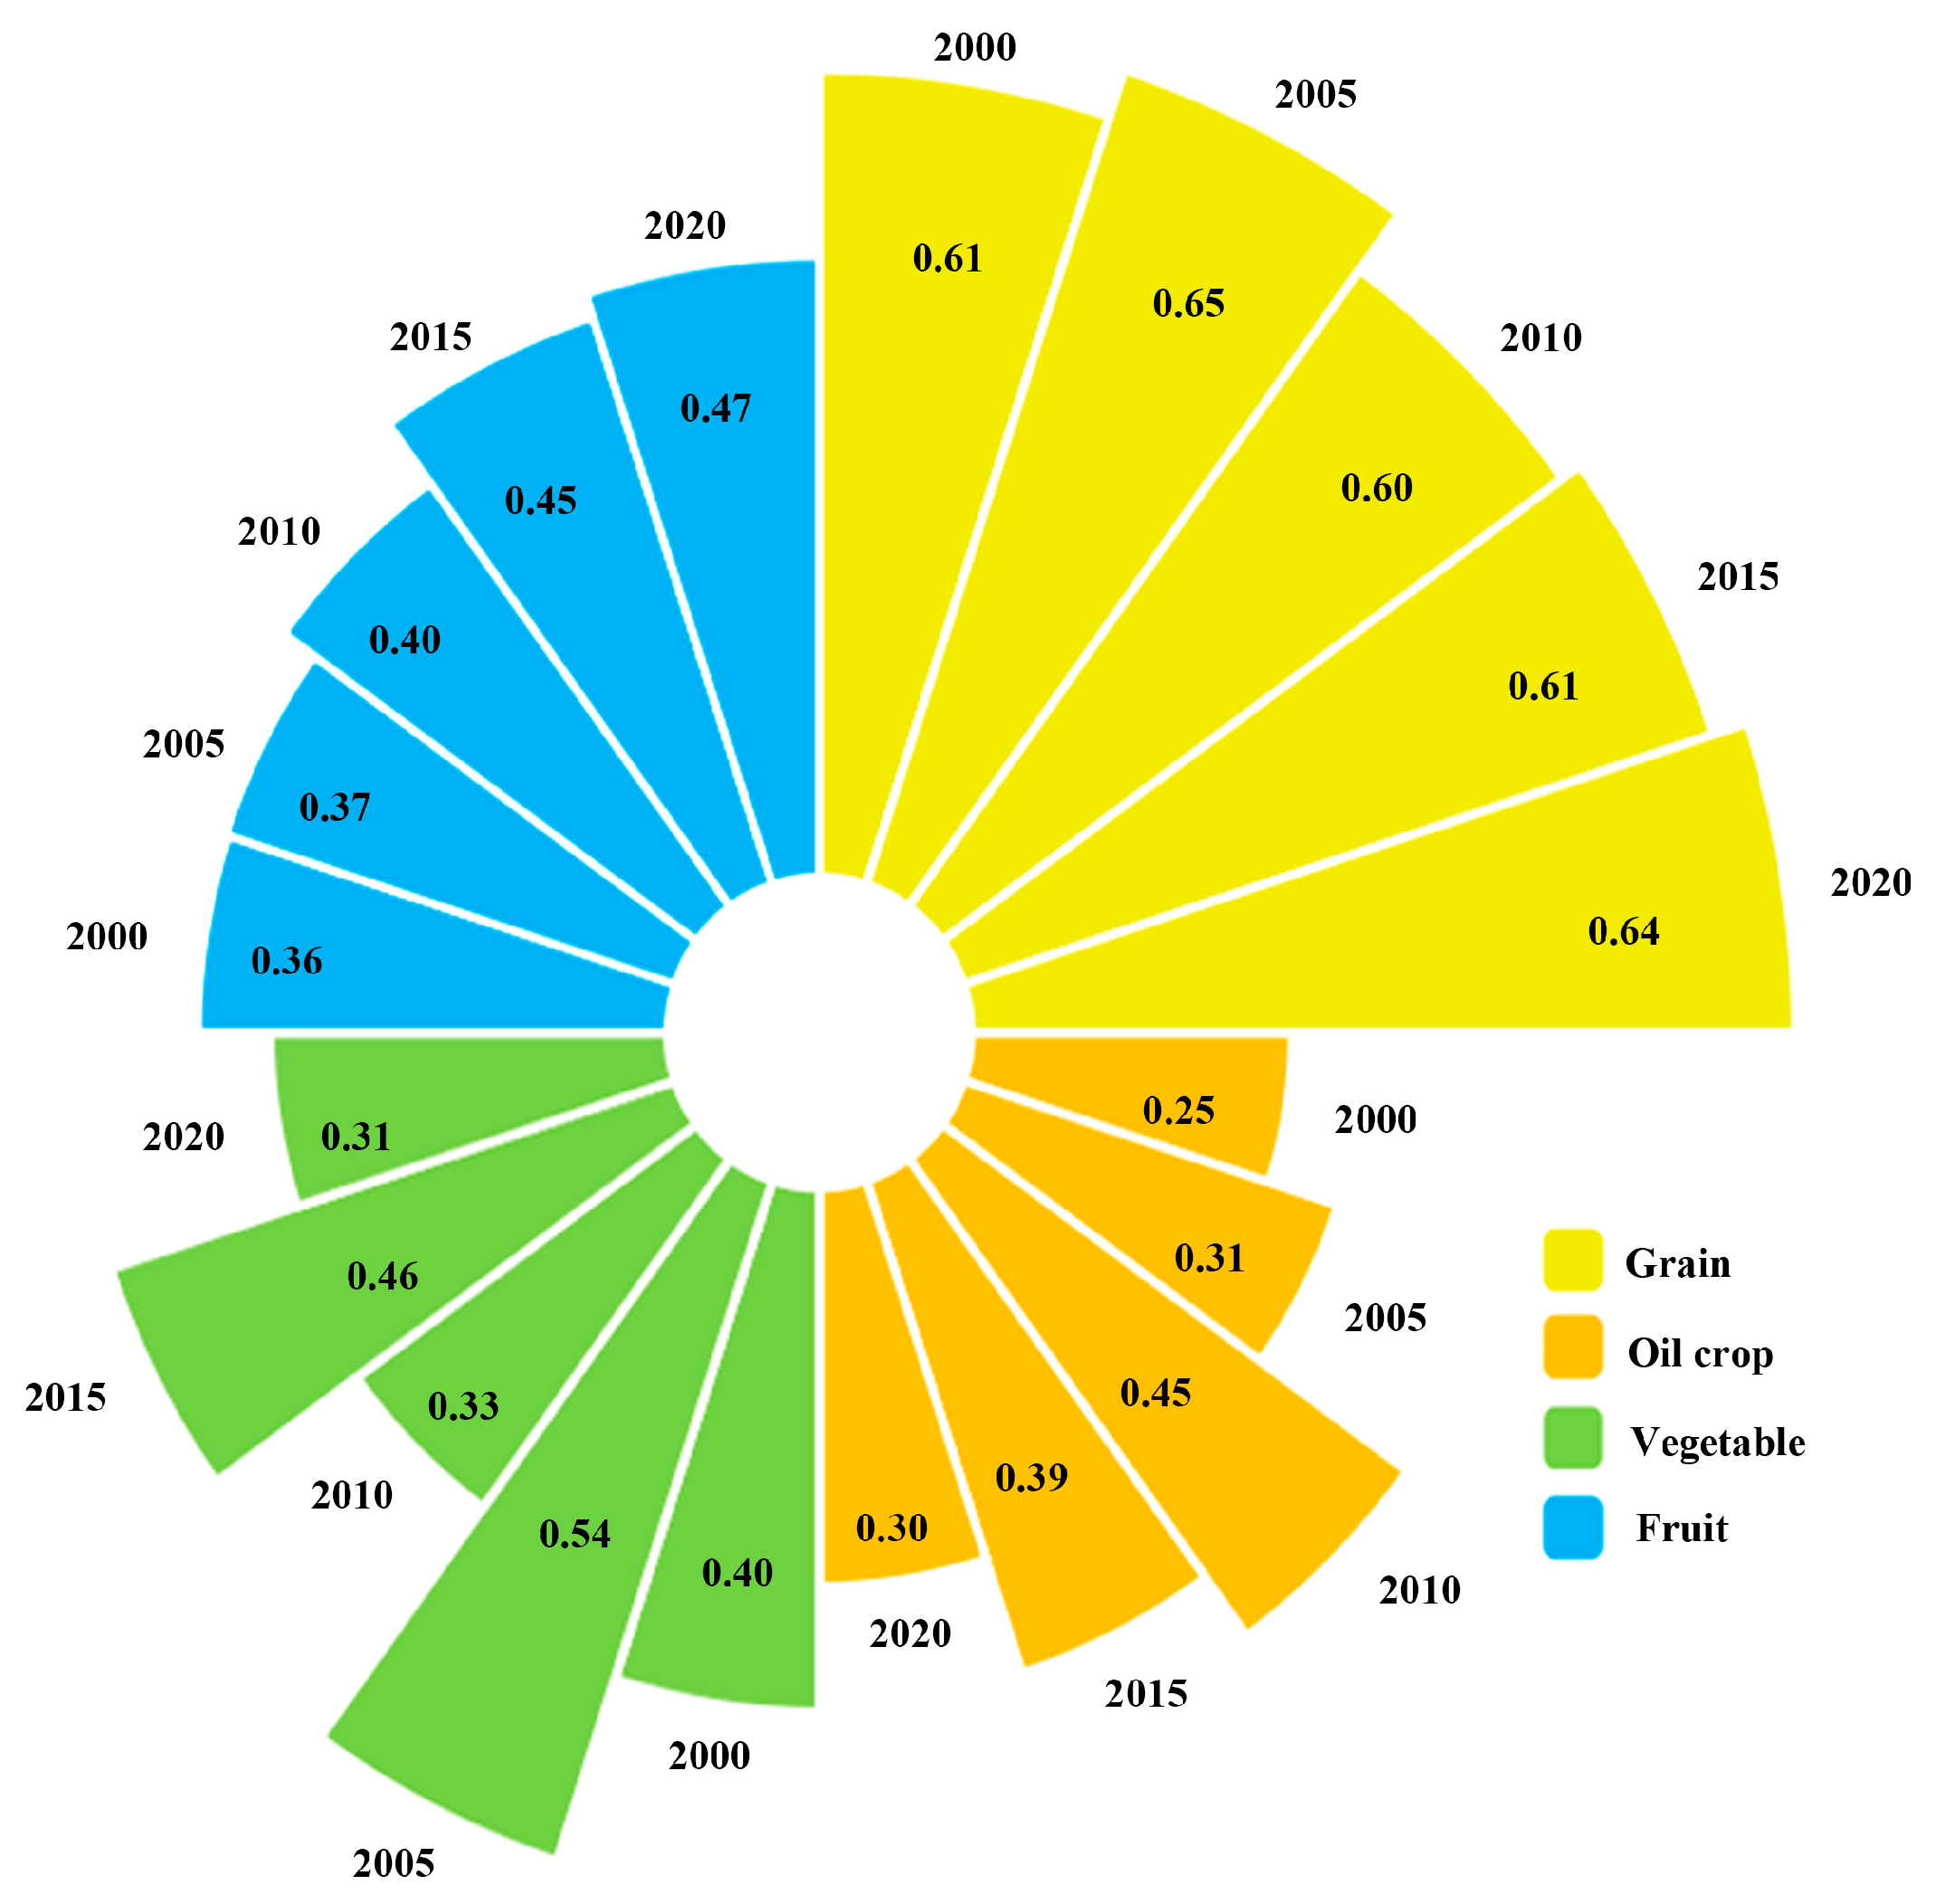
Figure 3 illustrates the changes in the average planting area of the four crops, the percentage of production of each crop (as a share of the total production of the four crops), and the unit area yield from 2000 to 2020. The planting area for grain was the most extensive, while fruit had the smallest planting area. The percentage of production of grain, oil crop, and fruit all increased to varying degrees, with grain showing a particularly significant rise; conversely, the percentage of production of vegetable decreased notably. The unit area yield of all four crops increased, with fruit showing a substantial improvement in unit area yield, and vegetable consistently maintaining the highest unit area yield among the crops.
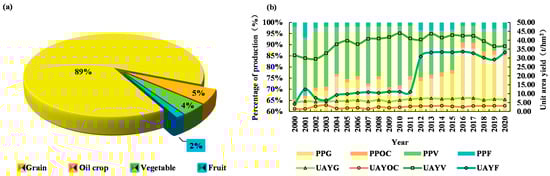
Figure 3.
Average planting area with four crops, and changes in the percentage of production and the unit area yield of each crop in Jilin Province from 2000 to 2020. (a) Average planting area with four crops; (b) changes in the percentage of production and the unit area yield of each crop. PPG stands for the percentage of production of grain; PPOC stands for the percentage of production of oil crop; PPV stands for the percentage of production of vegetable; PPF stands for the percentage of production of fruit. UAYG stands for the unit area yield of grain; UAYOC stands for the unit area yield of oil crop; UAYV stands for the unit area yield of vegetable; UAYF stands for the unit area yield of fruit.
3.2. Characterization of Spatial Changes in Crop Production Patterns
3.2.1. Characteristics of Center of Gravity Migration of Crop Production
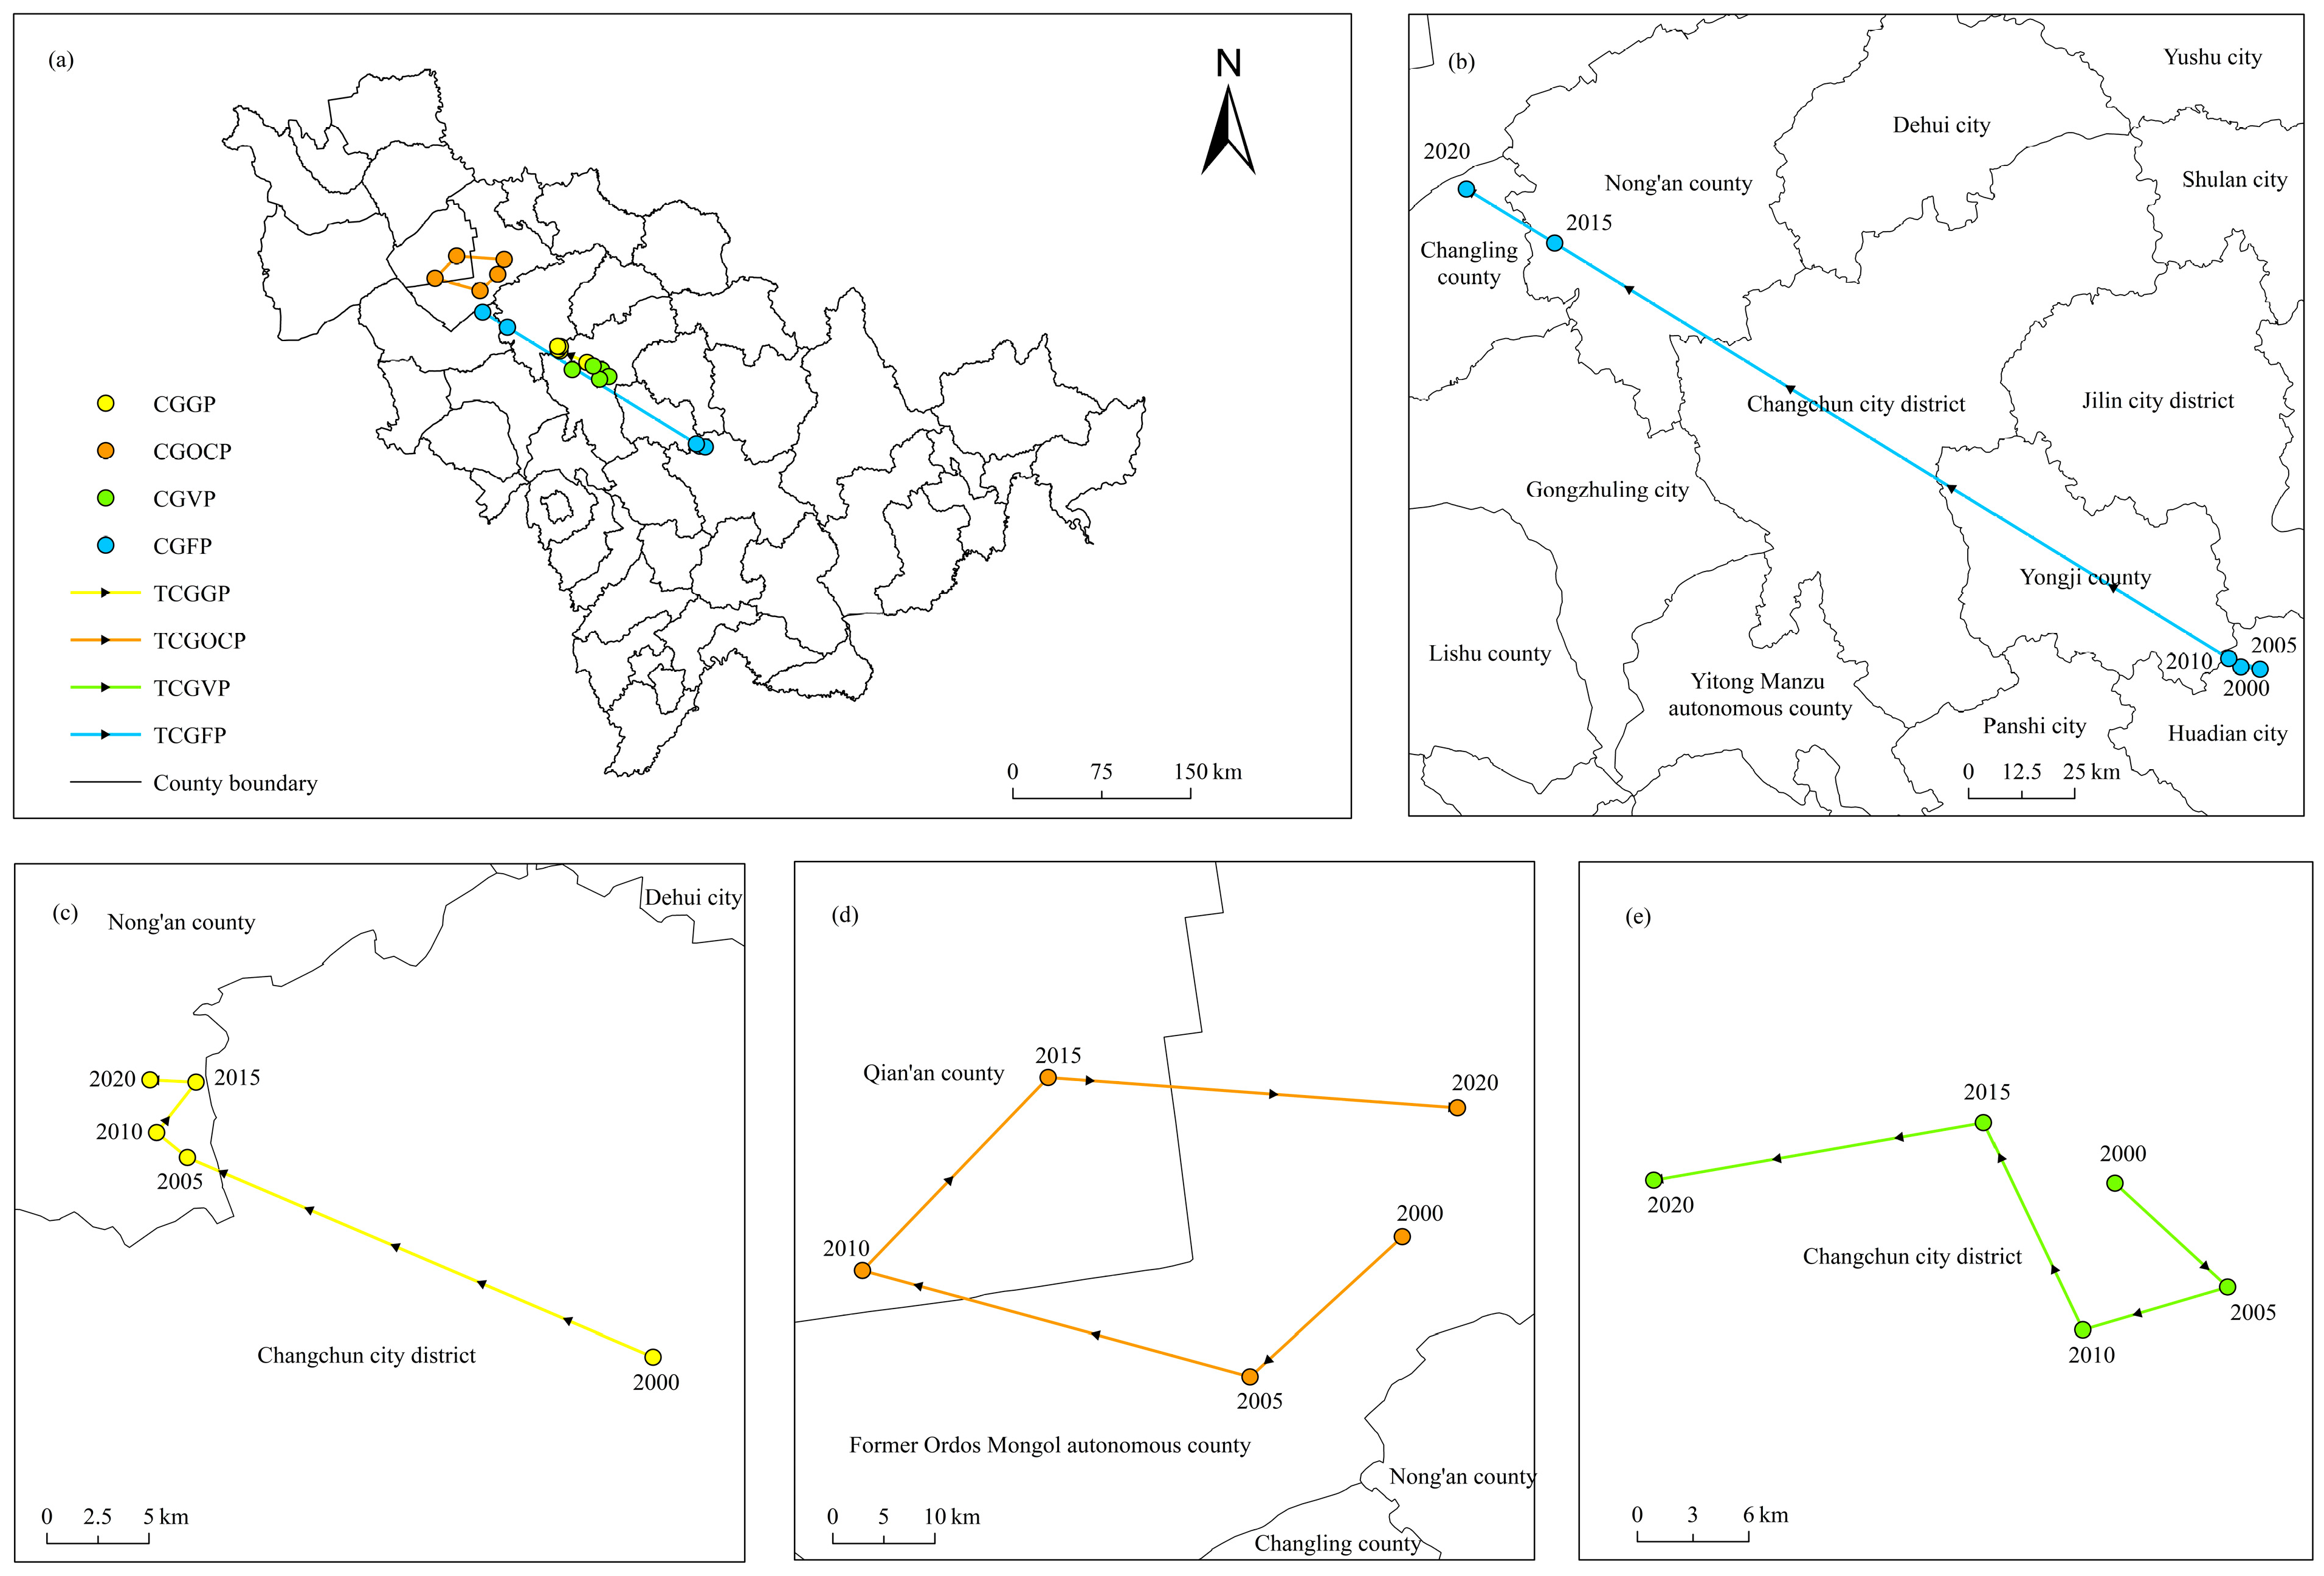
The centers of gravity of the production of the four crops were calculated for five specific years: 2000, 2005, 2010, 2015, and 2020. Additionally, the distances of movement of these centers of gravity were measured for each corresponding time period (Figure 4 and Figure 5).
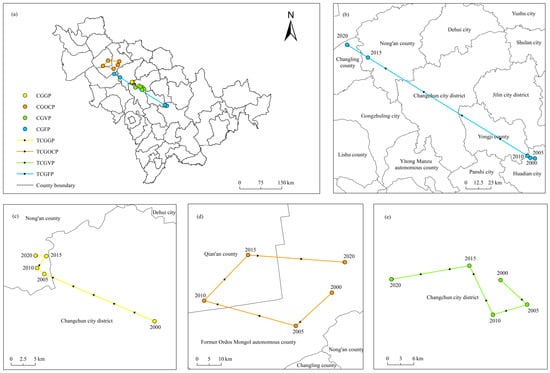
Figure 4.
Trajectory of center of gravity migration of major crop production in Jilin Province during the study period. (a) Synthesis of the trajectories of the migration of the center of gravity of the production of the four crops; (b–e) plots of the trajectories of the migration of the center of gravity of fruit, grain, oil crop, and vegetable production, respectively. CGGP stands for the center of gravity of grain production; CGOCP stands for the center of gravity of oil crop production; CGVP stands for the center of gravity of vegetable production; CGFP stands for the center of gravity of fruit production. TCGGP stands for the trajectory of center of gravity of grain production; TCGOCP stands for the trajectory of center of gravity of oil crop production; TCGVP stands for the trajectory of center of gravity of vegetable production; TCGFP stands for the trajectory of center of gravity of fruit production.
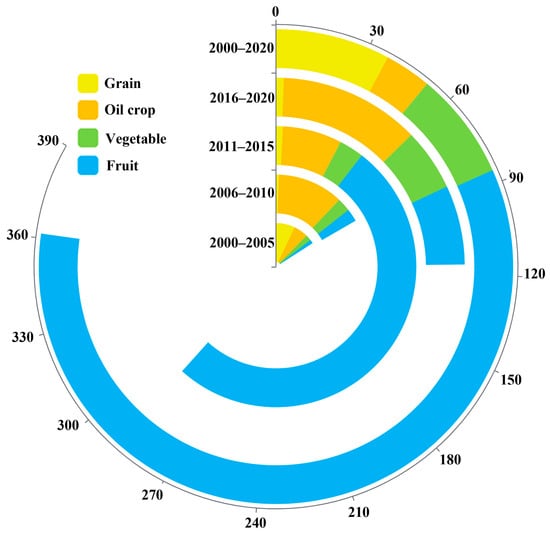
Figure 5.
Migration distance of the center of gravity of the production of the major crops in Jilin Province during the study period (unit: km).
The results show that the centers of gravity of the production of all four crops are located in the central-northwestern region of Jilin Province, showing an overall trend of “going westward and upward to the north”. Among them, the center of gravity of grain production migrated from Changchun city district to the northwest to Nong’an county within the county, and the migration process can be divided into two stages. From 2000 to 2005, it moved rapidly from the southeast to the northwest, indicating that the growth rate of grain production in the northwest of Jilin Province exceeded that of the southeast of Jilin Province, contributing more to the province’s grain production, and from 2006 to 2020, the migration trajectory showed a Z-shaped pattern, with a slower speed of movement and a smaller amplitude; the trajectory of the center of gravity of oil crop production had a sub-square shape, with an overall migration to the northeast, basically located within the former Golgoros Mongol Autonomous County; the center of gravity of vegetable production was consistently located within the Changchun city district and shifted westward overall, indicating an increase in the contribution of vegetable production in the western part of Jilin Province; the center of gravity of fruit production showed a migration trend from the central to the northwest, from Huadian city to Changling county, with the longest and faster migration trajectory during the study period, slowing down the migration of the center of gravity from 2000 to 2010, and moving rapidly to the northwest from 2011 to 2020, indicating that fruit production in the northwest has grown rapidly since 2011 and has made a greater contribution to the province’s fruit production.
3.2.2. Characteristics of Crop Production Spatial Agglomeration
Calculating the global Moran’s I for the four crops across the five selected years (Figure 6), the results reveal that the global Moran’s I was positive for all four crops, indicating the existence of spatial clustering of the production of the four crops, i.e., counties with higher or lower crop production tend to be geographically proximate. The global Moran’s I for grain showed an overall increase, suggesting a strengthening degree of spatial agglomeration. For oil crop, the global Moran’s I initially increased and then decreased, with the spatial agglomeration in 2020 being higher than in 2000. The global Moran’s I for vegetable fluctuated and ultimately decreased, indicating a weakening degree of spatial agglomeration. Conversely, the global Moran’s I for fruit continued to rise, signifying an ongoing intensification of spatial agglomeration.
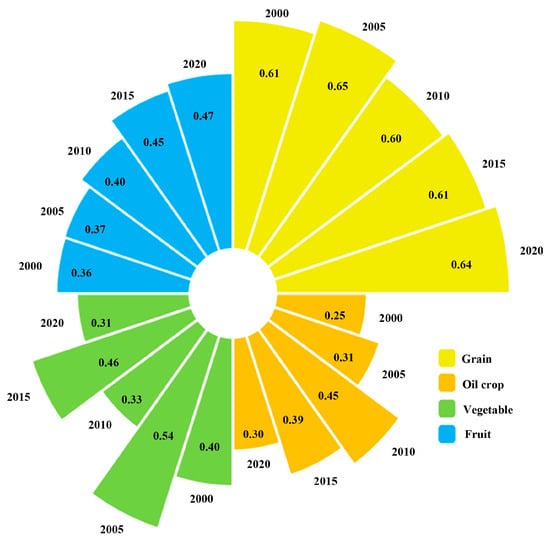
Figure 6.
Changes in the global Moran’s I of major crop production in Jilin Province during the study period.
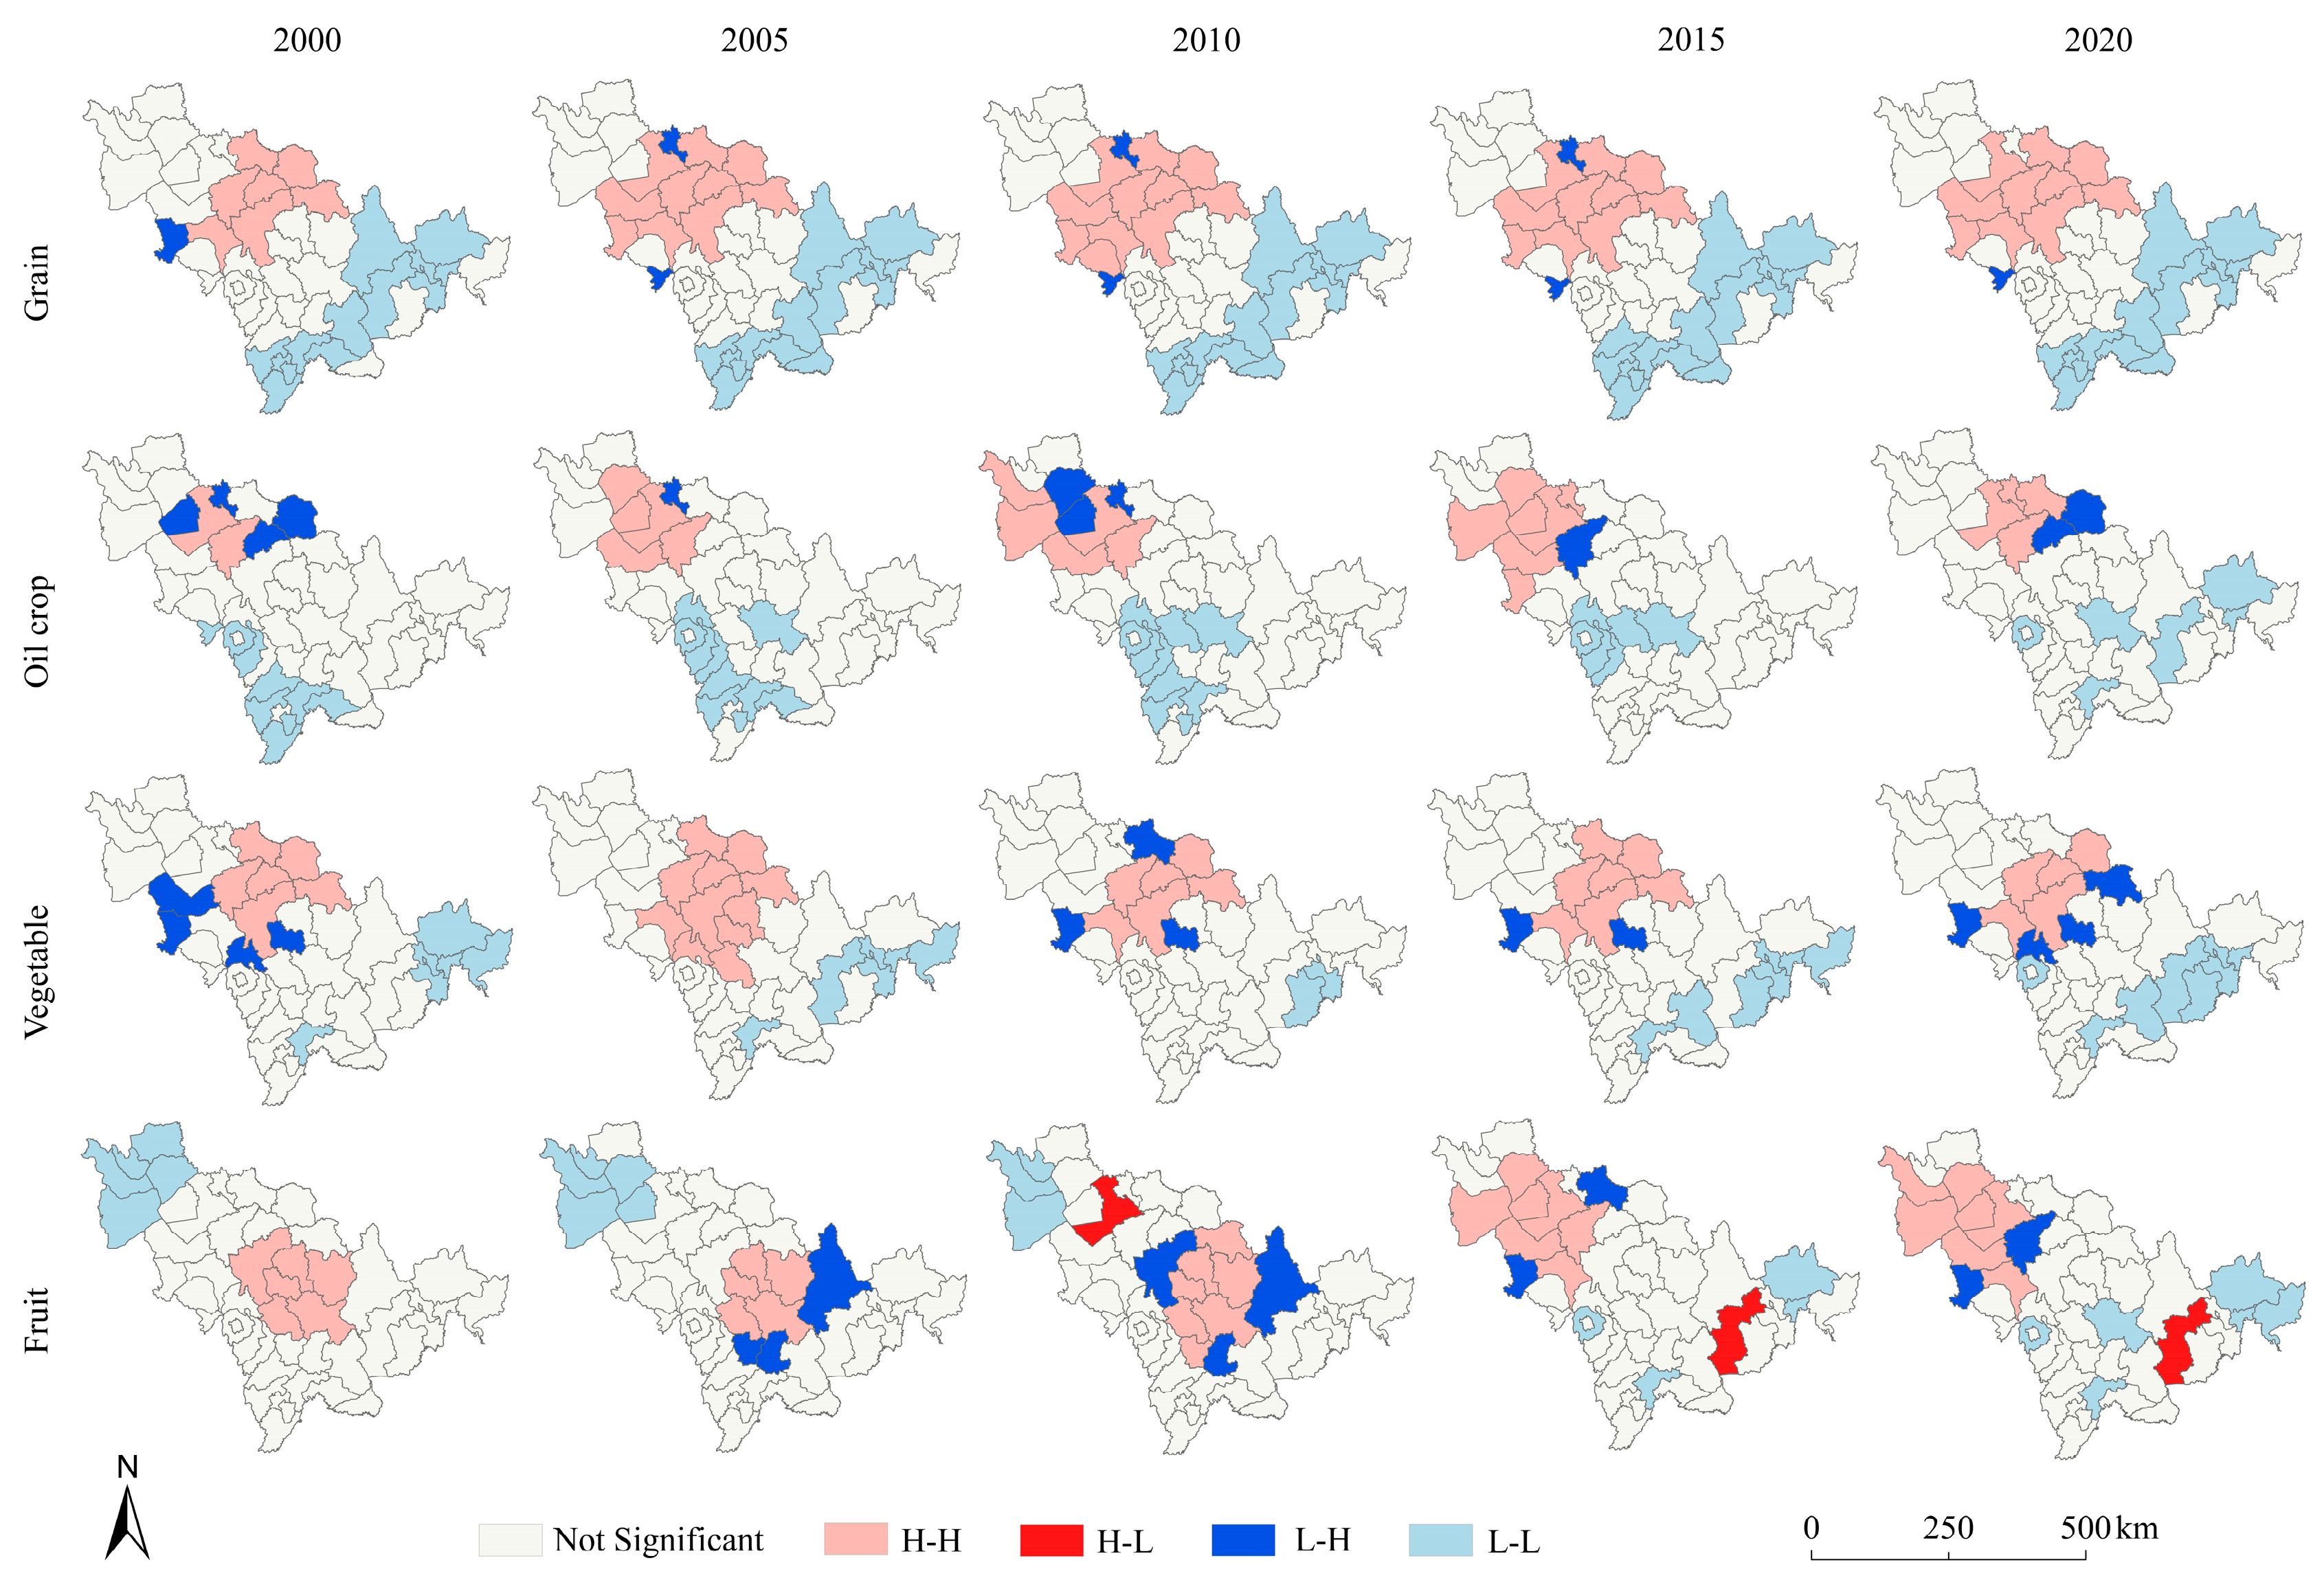
The local spatial clustering characteristics of crop production in the counties of Jilin Province were further analyzed based on the LISA clustering map (Figure 7). The “H-H” agglomerations indicate the agglomeration area of counties with high crop production. The “L-L” agglomerations indicate the agglomeration area of counties with lower crop production. The “L-H” agglomerations indicate that counties with high crop production were clustered around areas with low crop production. The “H-L” agglomerations indicate that counties with low crop production were clustered around areas with high crop production.
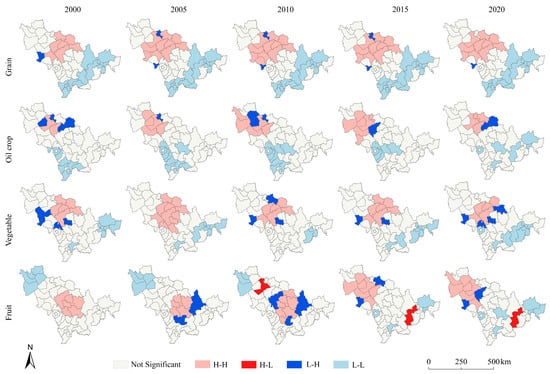
Figure 7.
The LISA clustering map of major crop production in Jilin Province during the study period.
The results show that the distribution of “H-H” agglomerations for grain, oil crop, and vegetable has changed little and is primarily located in the central and western plains of Jilin Province, where the terrain is flat and suitable for crop cultivation. The “H-H” agglomerations of grain formed a “block-like” pattern in west-central Jilin Province. The “H-H” agglomerations of oil crop were generally situated in western Jilin Province, shifting westward from 2000 to 2015 and eastward from 2016 to 2020. The “H-H” agglomerations of vegetable were mainly found in central and western Jilin Province, evolving from a lump-like to a strip-like pattern. In contrast, the “H-H” agglomerations of fruit changed significantly, migrating from central Jilin Province in 2000 to northwestern Jilin Province in 2020. The northwestern part of Jilin Province, with sufficient light and sandy soil, was more suitable for cultivating watermelons, melons, and other fruit. The “L-L” agglomerations of grain, oil crop, and vegetable were concentrated in southern and southeastern Jilin Province, a predominantly mountainous region with steep terrain unfavorable for crop cultivation. The distribution of “L-L” agglomerations for grain was concentrated, while for oil and vegetable, it was more dispersed. The distribution of “L-L” agglomerations for fruit was opposite to that of “H-H” agglomerations. The “L-H” agglomerations of the four crops were generally distributed in a “point-like” manner around the “H-H” agglomerations, with only a very small number of counties having “H-L” agglomerations for fruit. In summary, the spatial correlation between high-value and low-value areas of crop production in Jilin Province was relatively small.
3.2.3. Characterization of Comparative Advantage in Crop Production
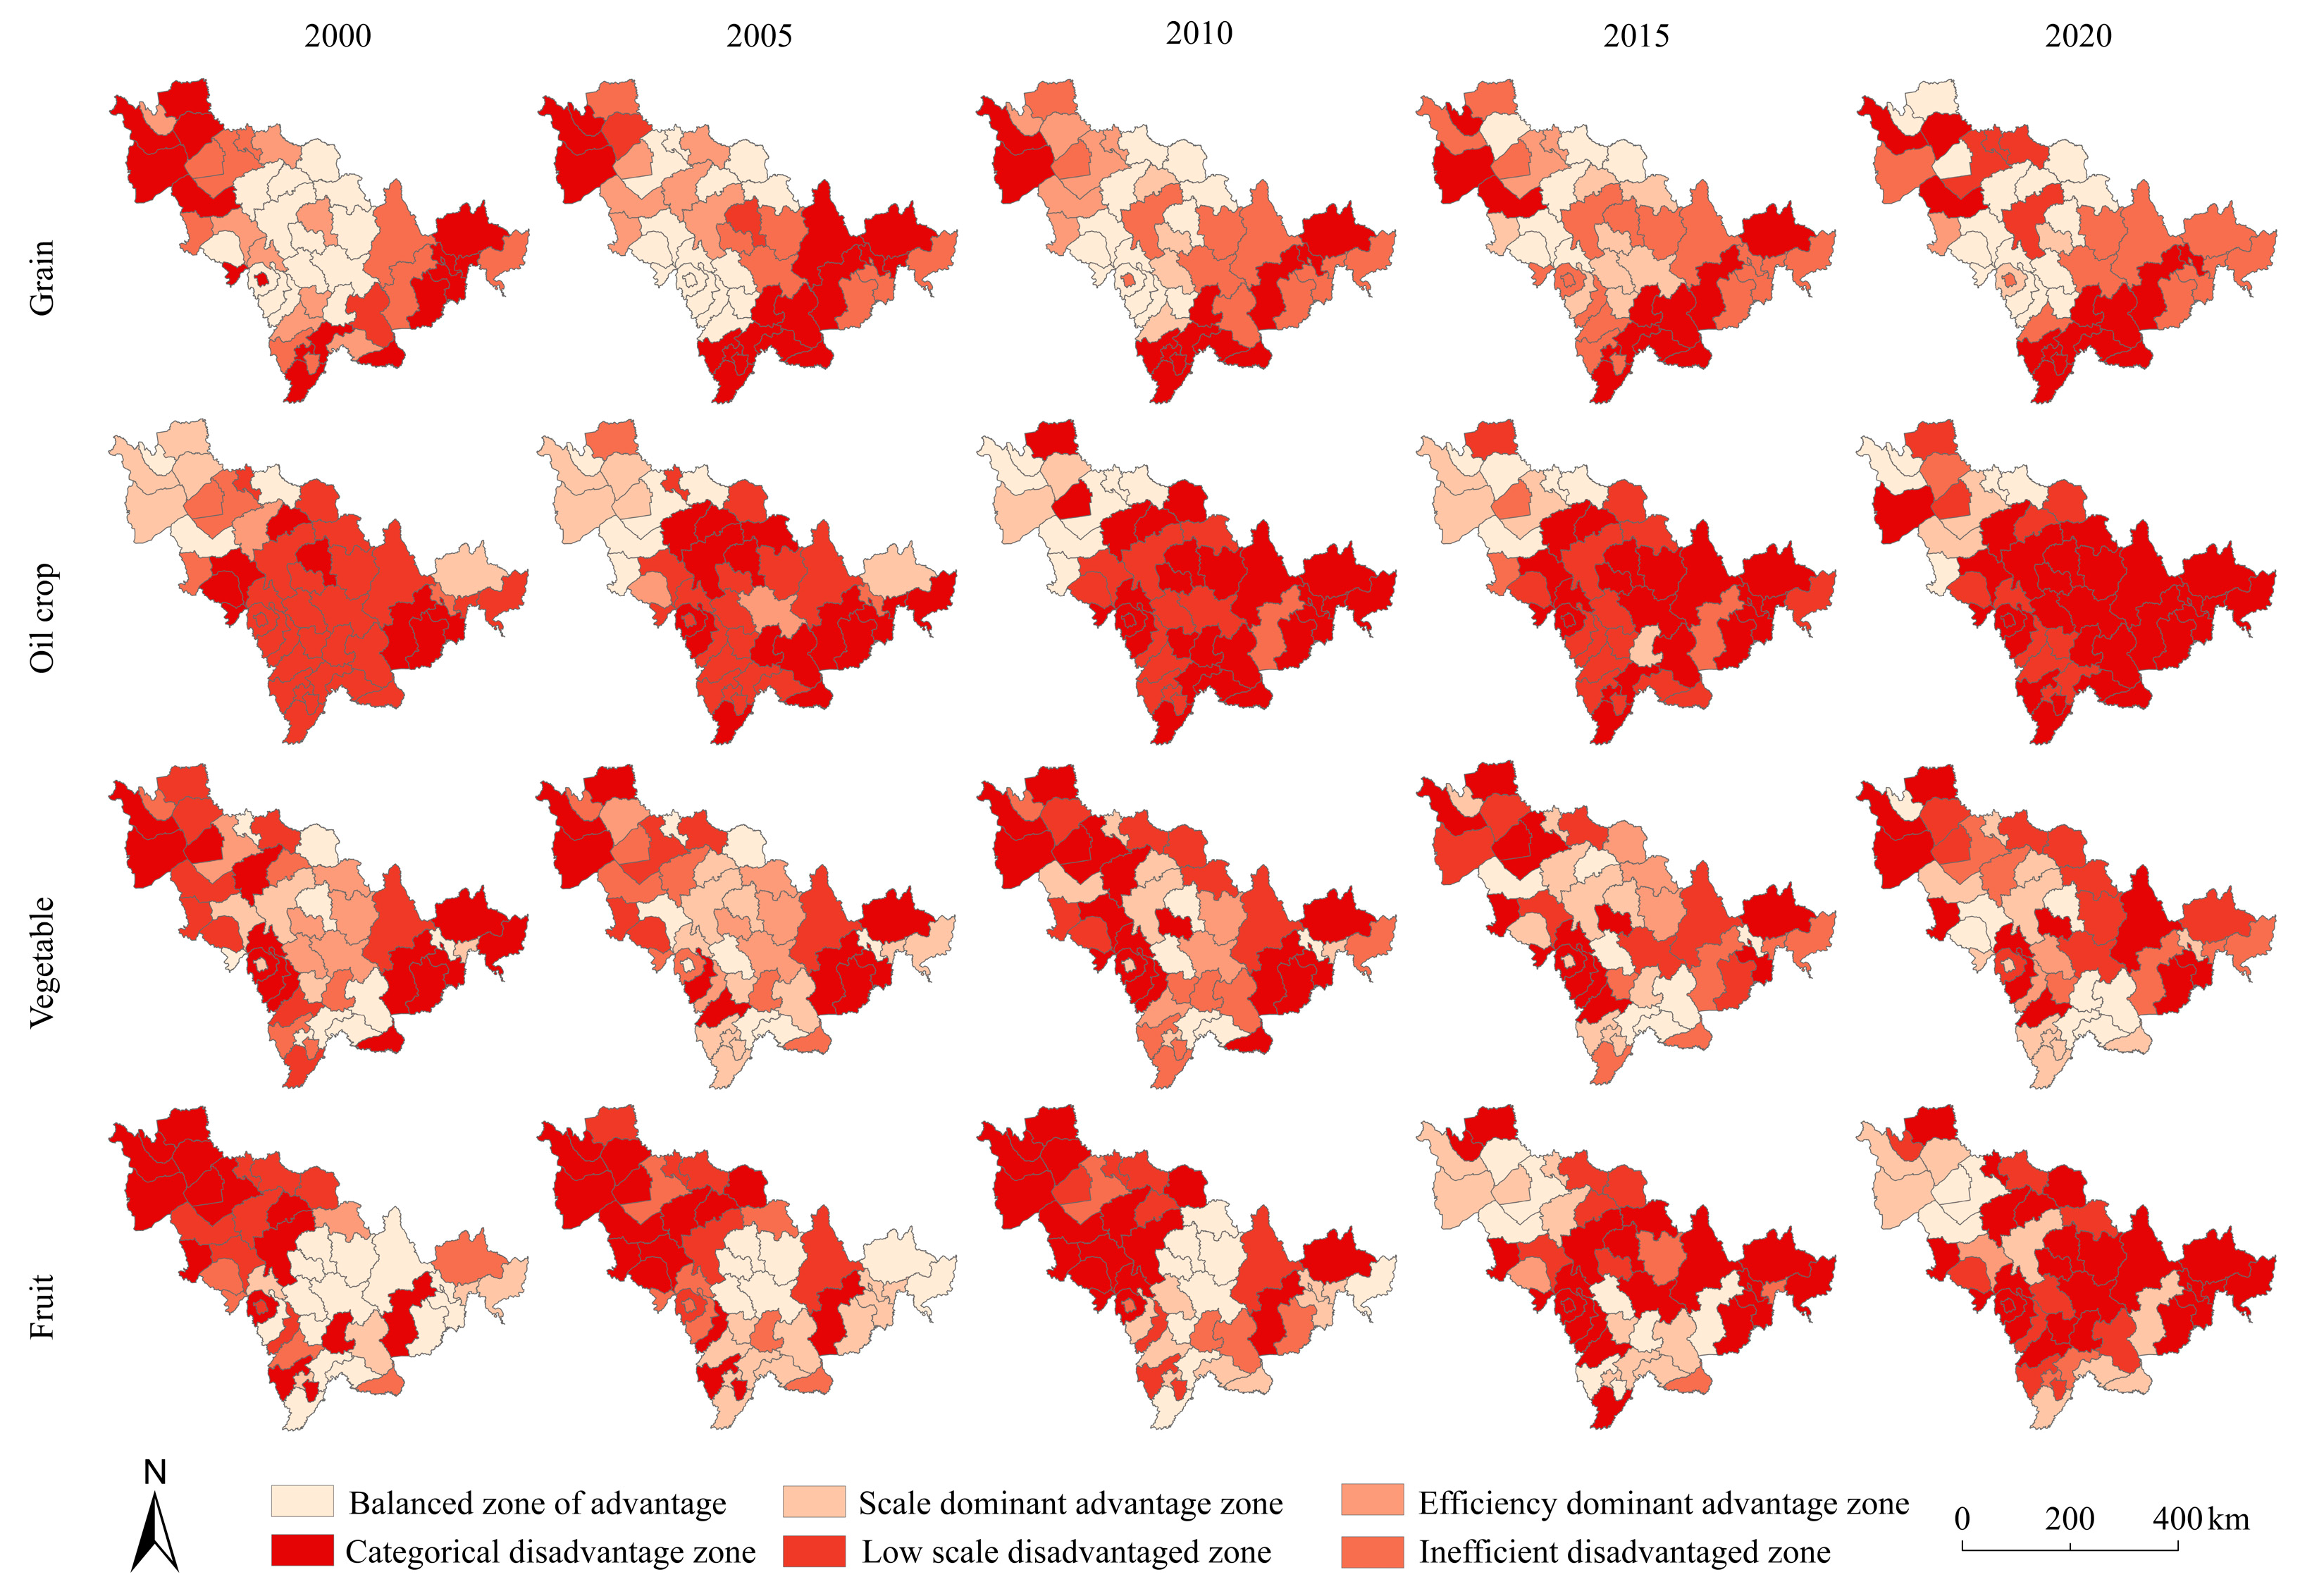
The SCA, ECA, and CCA of the production of the four crops in Jilin county in five selected years were calculated to delineate the major crop production zones based on the zoning standards (Table 1, Figure 8). The results are shown below.

Table 1.
Zoning standards for major crop production.
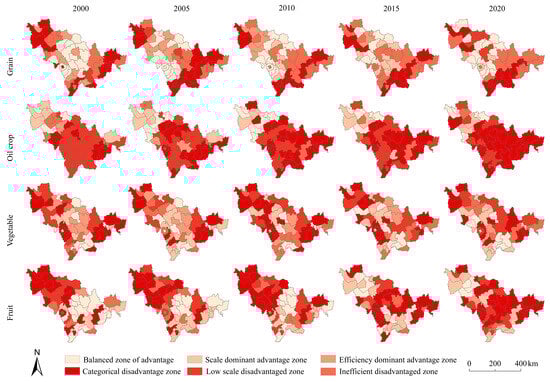
Figure 8.
Zone types of major crop production in Jilin Province during the study period.
- Grain advantage zones are mainly distributed in the central and western parts of Jilin Province, characterized by a predominance of balanced zones of advantage and a minimal presence of scale dominant advantage zones. Conversely, disadvantage zones are mainly concentrated in the eastern part of Jilin Province, with inefficient disadvantage zones and categorical disadvantage zones dominating.
- The type of oil crop production zone is dominated by disadvantage zones. Advantage zones are concentrated in western Jilin Province, encompassing a small number of counties. In contrast, disadvantage zones are mainly distributed in central and eastern Jilin Province, dominated by low-scale disadvantage zones and categorical disadvantage zones, with the number of low-scale disadvantage zones declining and the number of categorical disadvantage zones rising.
- The type of vegetable production zone is dominated by disadvantage zones. The various zone types are scattered, with the largest number of categorical disadvantage zones, the smallest number of efficiency dominant advantage zones, and a similar number of other zone types.
- The type of fruit production zone is dominated by disadvantage zones. Advantage zones shift from the east of Jilin Province to the west of Jilin Province, with a small number of counties; disadvantage zones move in the opposite direction to the advantage zones and are dominated by categorical disadvantage zones, and the number of categorical disadvantage zones rises year by year.
- On the whole, the comparative advantage characteristics of the four crops are closely related to the natural geographical environment. For example, the advantage zones of grain are mainly concentrated in the central and western part of Jilin Province, which have a flat topography and are the main producing area of maize and rice, whereas the eastern part of Jilin Province is dominated by mountains with high and steep terrain, which are the disadvantage zones of grain; the advantage zones of oil crop are mainly concentrated in the western part of Jilin Province, which has a flat topography, sufficient light, and a wide distribution of sandy soil that is suitable for peanut planting and is the main planting area of peanut; the advantage zones of fruit move gradually from southeastern Jilin Province to western Jilin Province, and the sandy soil in western Jilin Province is widely distributed, which is suitable for melon, watermelon and other melons to be planted; the advantage zones of vegetable are scattered (mainly due to the popularization of agricultural production factors such as mulch film and chemical fertilizers), which makes vegetable cultivation subject to fewer geographic constraints, and at the same time there are many types of vegetables, which are better adapted to a variety of geographic environments.
3.3. Analysis of the Drivers of the Evolution of Crop Production Patterns
3.3.1. Model Validation
Based on the comprehensiveness of data, this paper selected twelve indicators from the four aspects of natural endowment, economic factors, social factors, and production inputs (average DEM, average slope, average annual temperature, average annual precipitation, total agricultural output value, per capita GDP, number of rural population, rural agricultural laborers, effective irrigated area, land input intensity (the percentage of the planting area of each crop to the total planting area), fertilizer application, and total power of agricultural machinery), and measured the mean values of twelve indicators affecting the production of four crops in five selected years. In order to eliminate the covariance among factors, the variance inflation factor (VIF) test was conducted by using SPSS 27 software, and seven influencing factors such as average slope, average annual temperature, per capita GDP, rural agricultural laborers, effective irrigated area, land input intensity, and fertilizer application were finally screened with VIF values less than 7.5. The OLS model and GWR model were established with the mean value of annual production of each crop in five selected years as the dependent variable and the above seven influencing factors as the explanatory variables (Table 2), respectively.
Table 2.
Comparison of OLS model and GWR model results.
As shown in Table 2, the GWR model provided a better overall explanation for the production of the four crops compared with the OLS model. The GWR model incorporated the dimension of geographic location, allowing it to capture spatial heterogeneity more accurately. Therefore, this study employed the GWR model to explore the driving factors of crop production (Figure 9). The adjusted R2 values for grain, oil crop, and vegetable were all above 75%, indicating that the model effectively explains the impact of each variable on crop production. However, the R2 adjusted value for fruit was lower than that for the other crops, suggesting a possible nonlinear relationship between the explanatory variables and the dependent variable.
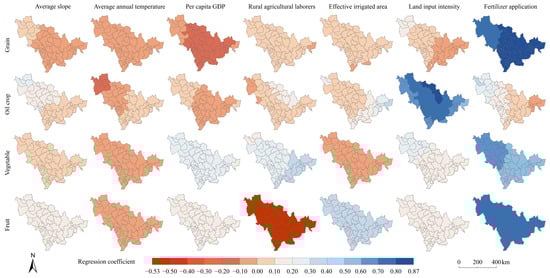
Figure 9.
Spatial distribution of regression coefficients of GWR model for major crop production in Jilin Province.
3.3.2. Driver Analysis
Average slope. Except for the central and eastern parts of Jilin Province, where grain production was negatively related to the average slope, grain production in western Jilin Province and the province’s oil crop, vegetable, and fruit production were all positively related to the average slope. The value of the regression coefficient between grain production and average slope was small, indicating that grain production in central and western Jilin Province was limited by the influence of average slope. The regression coefficient of oil crop showed a decreasing trend from northwest to southeast, indicating that the degree of influence of average slope on oil crop production was decreasing. Vegetable and fruit were more homogeneously affected by average slope at the provincial level, and the effect on fruit was higher than that on vegetable.
Average annual temperature. Except for oil crop production in the eastern part of Jilin Province, which showed a positive relationship with average annual temperature, oil crop production in the central and western parts of Jilin Province and the province’s grain, vegetable, and fruit production showed a negative relationship with average annual temperature. The average annual temperature showed the same inhibitory effect on grains, vegetables, and fruits in the province, with a low degree of influence. The regression coefficients of oil crop production and annual average temperature showed positive values in the east of Jilin Province and negative values in the central and western parts of Jilin Province, whereby the oil crop production in the northwest of Jilin Province was more strongly inhibited by the annual average temperature and affected by the spatial distribution of precipitation (Jilin Province transitions from the southeast to the northwest from the humid zone to the semi-humid zone and then to the semi-arid zone, and the northwest of Jilin Province belongs to the semi-arid zone, and with the increase in the annual average temperature, the evapotranspiration increases, which is unfavorable to the growth of oil crops). Additionally, higher average annual temperature may shorten the growing season of oil crops, causing them to enter the reproductive growth stage before accumulating sufficient biomass, ultimately affecting both the quantity and quality of the seeds and leading to reduced production.
Per capita GDP. Per capita GDP exhibited a positive relationship with oil crop production in western Jilin Province, and with vegetable and fruit production across the province. Conversely, it showed a negative relationship with grain production in the province and with oil crop production in most of central and eastern Jilin Province. A strong negative correlation was observed between per capita GDP and grain production in the majority of central and eastern Jilin areas. The high terrain in eastern Jilin Province was unsuitable for large-scale grain cultivation, leading to the cultivation of blueberries, grapes, small-scale high-quality green rice, and other high-yield cash crops, thereby elevating per capita GDP. The central counties of Jilin Province, significantly influenced by the provincial capital Changchun city, exhibited a higher per capita GDP, where more land has been allocated for urban development, resulting in a reduction of agricultural land. Furthermore, economic growth has led to environmental pollution and resource pressures. For instance, the discharge of industrial wastewater and exhaust gases may contaminate farmland, thereby affecting crop growth and reducing grain production. The regression coefficient between oil crop production and per capita GDP was small, indicating a low impact of per capita GDP on oil crop production. Vegetable and fruit production were more uniformly affected by per capita GDP across the province, with a greater impact on vegetable than on fruit.
Rural agricultural laborers. Rural agricultural laborers had a largely positive relationship with grain, oil crop, and vegetable production but a negative relationship with fruit production. Their impact on grain production was small, though they exhibited a positive effect on oil crop production in most counties, which intensified from south to north. The regression coefficient for vegetable production increased from northwest to southeast, indicating that rural agricultural laborers had an increasing promotional effect on vegetable crop production. A significant negative correlation was observed between rural agricultural laborers and fruit production across the province. This negative correlation was attributed to rising urbanization, which attracted some rural agricultural laborers to urban areas, reducing their numbers in rural areas. Consequently, those remaining were more inclined to cultivate fruit with higher economic benefits. Additionally, advancements in agricultural science and technology, along with increased input of agricultural machinery, further boosted fruit crop production.
Effective irrigated area. The effective irrigated area exhibited a generally positive relationship with grain, oil crop, and fruit production, while showing a negative relationship with vegetable production. Food and vegetable production were constrained by the extent of the effective irrigated area. The regression coefficient for oil crop increased gradually from west to east, indicating a rising promotional effect of effective irrigated areas on oil crop production. Additionally, the effective irrigated area demonstrated a strong promotional impact on fruit production, suggesting that increasing the effective irrigated area can significantly boost fruit production.
Land input intensity. Except for the grain production in eastern Jilin Province, which showed a negative relationship with land input intensity, food crop production in central and western Jilin Province, along with the province’s oil crop, vegetable, and fruit production, all exhibited a positive relationship with land input intensity. Land input intensity had a weak inhibitory effect on grain production in eastern Jilin Province but promoted food crop production in the central and western parts of the province, with a stronger effect observed in western Jilin Province than in central Jilin Province. It significantly promoted oil crop production, with the degree of influence forming a concentric pattern, gradually intensifying from the periphery to the center. This suggests that increasing the planting area of oil crop in Fuyu city, Yushu city, Shulan city, and Jiaohe city could significantly boost oil crop production. Among the seven explanatory variables, land input intensity had the most significant effect on oil crop production, indicating that an increase in planting area was the most crucial factor for the rise in oil crop production. The regression coefficients for vegetable in western Jilin Province were higher than those in central and eastern Jilin Province, indicating that vegetable production in western Jilin Province was more dependent on increased planting area. The effect of land input intensity on fruit production was consistent across the province.
Fertilizer application. Fertilizer application exhibited a generally positive relationship with the production of the four crops. For grain, vegetable, and fruit across the province, there was a significant positive correlation with fertilizer application, highlighting its importance as a production input. The proper use of fertilizer can enhance crop production, and among the seven explanatory variables, fertilizer application had the most significant impact on the production of these three crops. This suggests that increased fertilizer application was the primary factor driving the rise in their production. Additionally, fertilizer application promoted oil crop production in most counties, with its effect diminishing from northwest to southeast.
4. Discussion
4.1. Research Significance
From a macro-food perspective, it is crucial to ensure an effective supply of various types of food, such as meat, vegetables, fruits, and aquatic products, alongside a staple food supply [56]. This approach reflects China’s significant emphasis on crop production. In recent years, the frequency of extreme weather events, climate change, and crop diseases and pests in China has increased, which has adversely affected crop production. Additionally, the issues of arable land being used for “non-food” or “non-agricultural” purposes have become prominent, threatening the safety of crop production. Therefore, it is of great significance to grasp the evolution of crop production patterns and driving factors to improve crop production efficiency and ensure crop production safety and social stability. Jilin Province is a major agricultural province and an important commercial food production base in China. This paper takes the county as the basic research unit to carry out a study on the evolution of the production patterns of the major crops and their driving factors in Jilin Province to reveal the spatial heterogeneity and imbalance of the major crop production in Jilin Province, and to provide scientific references for the formulation of scientific and reasonable agricultural development strategies and policies in Jilin Province. The possible innovations of this paper are that it enriches the relevant research content with Jilin Province as the research area, improves the inadequacy of the larger spatial scale (province and city as the research unit) in being unable to portray the spatial heterogeneity of crop production and the development of crop production in accordance with local conditions, makes up for the shortcomings of the existing studies that are not conducive to the adjustment and optimization of the structure of agricultural production from a single research object, and solves the problem of the lack of quantitative research on the drivers in the previous studies.
4.2. Policy Recommendations
In order to improve the structure of crop production, planting should be carried out according to local conditions based on crop advantage zoning. For grain, whose advantage zones are mostly concentrated in the central and western parts of Jilin Province, through the implementation of high-standard farmland constructing, improving the low- and medium-production fields with the use of ditching and drainage, guest soil, rational fertilization, and other technical means to improve land fertility and permeability, and to promote crops growth; at the same time, strengthening the supporting construction of farmland water conservancy, the promotion of agricultural mechanization, and improving the efficiency of agricultural production. For oil crops, whose advantage zones are mostly concentrated in the western parts of Jilin Province, it is possible to choose areas suitable for growing rapeseed, such as Songyuan city and Baicheng city, to establish reasonable distribution channels and increase the export volume of products. In addition, the development of the oil crop industry should be promoted by means of moderately adjusting the crop structure and improving germplasm. For vegetables, whose advantage zones are more dispersed, and fruits, whose advantage zones are mostly concentrated in the northwest parts of Jilin Province, suitable vegetable and fruit varieties should be selected for planting according to the climatic conditions and soil characteristics of different counties, making full use of the natural advantages of the northwestern region that are suitable for growing fruits, and improving the agglomeration of the fruit plantation industry. At the same time, the quality of vegetable and fruit should be improved as much as possible to create a brand effect, such as apples from Panshi city and blueberries from Changbai Mountain, in order to achieve better prices in the market.
Fertilizer application is strongly associated with increased grain, vegetable, and fruit production, but the process of applying chemical fertilizers may lead to soil pollution and land degradation, etc. The structure of fertilizer application should be improved, and the proportion of organic fertilizers used should be increased to improve the efficiency of agricultural production and protect the ecological environment. In order to improve oil crop production, the planting area can be increased appropriately in Fuyu city, Yushu city, Shulan city, and Jiaohe city in the northern parts of Jilin Province to guide farmers to plant oil crops. The average annual temperature presents a strong inhibitory effect on oil crop production in northwestern Jilin Province, and the deficiencies in resource endowment can be improved by improving soil quality, popularizing new agricultural technologies, and adopting reasonable sowing methods.
4.3. Limitations and Future Prospects
Against the backdrop of the “the new development pattern”, many initiatives to build the new development pattern, such as industrial structure adjustment and upgrading, scientific and technological innovation, institutional optimization, and deepening opening up to the outside world, are likely to have an impact on the pattern of production of the major crops in Jilin Province to a certain extent. Policies and systems of agricultural production play a guiding role in the direction of changes in the pattern of crop production. In recent years, in order to promote the modernization of agriculture in Jilin Province, the government has increased its support for agricultural scientific and technological innovation, encouraged farmers to carry out efficient agricultural production, and fostered and developed green agriculture, etc. The adjustments and implementations of the policies have promoted the reform and development of agriculture, which has led to the changes in the pattern of major crop production in Jilin Province. However, because policy factors are difficult to quantify, this paper does not include policy factors in the system when selecting driving factors.
With the continuous improvement of people’s living standards, the dietary structure of China’s residents has changed, and people’s demand for crops has also changed, which in turn affects the patterns of crop production, and more attention should be paid to the impact of changes in dietary structure on the patterns of crop production in future research. In addition, utilizing diversified data sources such as remote sensing images, aerial photos, and optical images [57,58,59] combined with field surveys to grasp crop production data at the micro-scale of townships and plots, and to forecast the future evolution of crop production is also an important part of future research on crop production patterns.
5. Conclusions
This paper selected four crop types—grain, oil crop, vegetable, and fruit—to examine the spatial and temporal evolution of the production patterns of the major crops in Jilin Province from 2000 to 2020. By employing methods such as the center of gravity migration model, spatial autocorrelation analysis, and the comparative advantage index, this study reveals these patterns’ characteristics. Furthermore, the geographically weighted regression model is used to analyze the driving factors behind these changes. The results show that the planting area of grain is the most extensive, while fruit has the smallest planting area; the percentage of production of grain, oil crop, and fruit has increased to different degrees, and the percentage of production of vegetable has decreased significantly; the unit area yield of the four crops has increased. The centers of gravity of the production of all four crops are located in the central-northwestern region of Jilin Province, showing an overall trend of “going westward and upward to the north”, indicating that the growth rate of crop production in the northwestern region of Jilin Province exceeds that of the southeastern region, making a greater contribution to the overall crop production of the province. The global Moran’s I is positive for the production all four crops, indicating the existence of spatial clustering of the production of the four crops, i.e., counties with higher or lower crop production tend to be geographically proximate. The comparative advantage characteristics of the four crops are closely related to the natural geographical environment. Grain, vegetable, and fruit production are significantly and positively correlated with fertilizer application, and the most significant factor affecting oil crop production is land input intensity. In order to improve the structure of crop production, the layout of production should be adapted to local conditions on the basis of the advantageous zoning of crops. Fertilizers should be rationally applied, and the planting area of oil crops should be appropriately increased. In addition, agricultural scientific and technological innovation and popularization should be further strengthened to improve the deficiencies in resource endowment and other aspects. This study provides a reference for enhancing the efficiency of crop production in Jilin Province, rationalizing agricultural resource allocation, improving agricultural-related policies, and accelerating the construction of the new development pattern.
Author Contributions
Conceptualization, L.W. and C.M.; methodology, L.W. and C.M.; software, C.M. and J.W.; validation, L.W., C.M., C.J., Y.C., J.W., A.L. and X.L.; formal analysis, C.M., H.O. and Y.C.; investigation, C.M. and Y.C.; resources, C.M., L.W., A.L. and X.L.; data curation, C.M., Y.C., A.L. and X.L.; writing—original draft preparation, L.W., C.M. and Y.C.; writing—review and editing, L.W. and C.M.; visualization, L.W., C.J. and C.M.; supervision, L.W.; project administration, L.W.; funding acquisition, L.W. All authors have read and agreed to the published version of the manuscript.
Funding
This research was funded by the National Natural Science Foundation of China, grant number 42101252.
Data Availability Statement
Data available in a publicly accessible repository that does not issue DOIs. Publicly available datasets were analyzed in this study. This data can be found here: http://www.stats.gov.cn (accessed on 13 March 2024).
Conflicts of Interest
The authors declare no conflicts of interest.
References
- Araújo, M.L.S.D.; Sano, E.E.; Bolfe, É.L.; Santos, J.R.N.; Dos Santos, J.S.; Silva, F.B. Spatiotemporal Dynamics of Soybean Crop in the Matopiba Region, Brazil (1990–2015). Land Use Policy 2019, 80, 57–67. [Google Scholar] [CrossRef]
- Wang, T.; Ma, Y.; Luo, S. Spatiotemporal Evolution and Influencing Factors of Soybean Production in Heilongjiang Province, China. Land 2023, 12, 2090. [Google Scholar] [CrossRef]
- Lobell, D.B.; Burke, M.B.; Tebaldi, C.; Mastrandrea, M.D.; Falcon, W.P.; Naylor, R.L. Prioritizing Climate Change Adaptation Needs for Food Security in 2030. Science 2008, 319, 607–610. [Google Scholar] [CrossRef] [PubMed]
- Yawson, D.; Mulholland, B.; Ball, T.; Adu, M.; Mohan, S.; White, P. Effect of Climate and Agricultural Land Use Changes on UK Feed Barley Production and Food Security to the 2050s. Land 2017, 6, 74. [Google Scholar] [CrossRef]
- Ip, E.H.; Saldana, S.; Arcury, T.A.; Grzywacz, J.G.; Trejo, G.; Quandt, S.A. Profiles of Food Security for US Farmworker Households and Factors Related to Dynamic of Change. Am. J. Public Health 2015, 105, e42–e47. [Google Scholar] [CrossRef] [PubMed]
- Gorton, D.; Bullen, C.R.; Mhurchu, C.N. Environmental Influences on Food Security in High-Income Countries. Nutr. Rev. 2010, 68, 1–29. [Google Scholar] [CrossRef] [PubMed]
- You, L.; Spoor, M.; Ulimwengu, J.; Zhang, S. Land Use Change and Environmental Stress of Wheat, Rice and Corn Production in China. China Econ. Rev. 2011, 22, 461–473. [Google Scholar] [CrossRef]
- Cesco, S.; Sambo, P.; Borin, M.; Basso, B.; Orzes, G.; Mazzetto, F. Smart Agriculture and Digital Twins: Applications and Challenges in a Vision of Sustainability. Eur. J. Agron. 2023, 146, 126809. [Google Scholar] [CrossRef]
- Zhao, J.; Chen, J.; Beillouin, D.; Lambers, H.; Yang, Y.; Smith, P.; Zeng, Z.; Olesen, J.E.; Zang, H. Global Systematic Review with Meta-Analysis Reveals Yield Advantage of Legume-Based Rotations and Its Drivers. Nat. Commun. 2022, 13, 4926. [Google Scholar] [CrossRef] [PubMed]
- Barragán-Fonseca, K.Y.; Nurfikari, A.; Van De Zande, E.M.; Wantulla, M.; Van Loon, J.J.A.; De Boer, W.; Dicke, M. Insect Frass and Exuviae to Promote Plant Growth and Health. Trends Plant Sci. 2022, 27, 646–654. [Google Scholar] [CrossRef] [PubMed]
- Dang, F.; Chen, D.; Lu, Y.; Li, Z. YOLOWeeds: A Novel Benchmark of YOLO Object Detectors for Multi-Class Weed Detection in Cotton Production Systems. Comput. Electron. Agric. 2023, 205, 107655. [Google Scholar] [CrossRef]
- Alrajhi, A.A.; Alsahli, A.S.; Alhelal, I.M.; Rihan, H.Z.; Fuller, M.P.; Alsadon, A.A.; Ibrahim, A.A. The Effect of LED Light Spectra on the Growth, Yield and Nutritional Value of Red and Green Lettuce (Lactuca sativa). Plants 2023, 12, 463. [Google Scholar] [CrossRef] [PubMed]
- Hou, M.; Deng, Y.; Yao, S. Spatial Agglomeration Pattern and Driving Factors of Grain Production in China since the Reform and Opening Up. Land 2020, 10, 10. [Google Scholar] [CrossRef]
- Wang, H.; He, J.; Aziz, N.; Wang, Y. Spatial Distribution and Driving Forces of the Vegetable Industry in China. Land 2022, 11, 981. [Google Scholar] [CrossRef]
- Wang, Z.; Zhang, E.; Chen, G. Spatiotemporal Variation and Influencing Factors of Grain Yield in Major Grain-Producing Counties: A Comparative Study of Two Provinces from China. Land 2023, 12, 1810. [Google Scholar] [CrossRef]
- Tu, S.; Jian, D.; Long, H. Characteristics and Mechanisms of the Evolution of Major Crop Production Patterns in Guangxi. J. Geogr. 2022, 77, 2322–2337. [Google Scholar]
- Seleiman, M.F.; Ahmad, A.; Battaglia, M.L.; Bilal, H.M.; Alhammad, B.A.; Khan, N. Zinc Oxide Nanoparticles: A Unique Saline Stress Mitigator with the Potential to Increase Future Crop Production. S. Afr. J. Bot. 2023, 159, 208–218. [Google Scholar] [CrossRef]
- Morales, A.; Villalobos, F.J. Using Machine Learning for Crop Yield Prediction in the Past or the Future. Front. Plant Sci. 2023, 14, 1128388. [Google Scholar] [CrossRef] [PubMed]
- Ahmad, M. Plant Breeding Advancements with “CRISPR-Cas” Genome Editing Technologies Will Assist Future Food Security. Front. Plant Sci. 2023, 14, 1133036. [Google Scholar] [CrossRef]
- Kumawat, K.C.; Sharma, B.; Nagpal, S.; Kumar, A.; Tiwari, S.; Nair, R.M. Plant Growth-Promoting Rhizobacteria: Salt Stress Alleviators to Improve Crop Productivity for Sustainable Agriculture Development. Front. Plant Sci. 2023, 13, 1101862. [Google Scholar] [CrossRef] [PubMed]
- Sharma, B.; Tiwari, S.; Kumawat, K.C.; Cardinale, M. Nano-Biofertilizers as Bio-Emerging Strategies for Sustainable Agriculture Development: Potentiality and Their Limitations. Sci. Total Environ. 2023, 860, 160476. [Google Scholar] [CrossRef] [PubMed]
- Wang, Y.; Shi, W.; Wen, T. Prediction of Winter Wheat Yield and Dry Matter in North China Plain Using Machine Learning Algorithms for Optimal Water and Nitrogen Application. Agric. Water Manag. 2023, 277, 108140. [Google Scholar] [CrossRef]
- Cao, Y.; Li, W.; Yuan, L. Changing Characteristics of Spatio-Temporal Pattern of Major Crop Production and Safety Evaluation in Hebei Province. Geoscience 2018, 38, 13191327. [Google Scholar]
- Yu, Y.; Wu, J.; Li, Z. Evolution of Spatio-Temporal Pattern of Grain Production and Security Evaluation in Shandong Province. J. China Agric. Univ. 2020, 25, 176–186. [Google Scholar]
- Yousefi, M.; Dray, A.; Ghazoul, J. Assessing the Effectiveness of Cover Crops on Ecosystem Services: A Review of the Benefits, Challenges, and Trade-Offs. Int. J. Agric. Sustain. 2024, 22, 2335106. [Google Scholar] [CrossRef]
- Carrascosa, A.; Pascual, J.A.; Ros, M.; Petropoulos, S.A.; Alguacil, M.D.M. Agronomical Practices and Management for Commercial Cultivation of Portulaca Oleracea as a Crop: A Review. Plants 2023, 12, 1246. [Google Scholar] [CrossRef] [PubMed]
- Beyer, R.M.; Hua, F.; Martin, P.A.; Manica, A.; Rademacher, T. Relocating Croplands Could Drastically Reduce the Environmental Impacts of Global Food Production. Commun. Earth Environ. 2022, 3, 49. [Google Scholar] [CrossRef]
- Spillias, S.; Valin, H.; Batka, M.; Sperling, F.; Havlík, P.; Leclère, D.; Cottrell, R.S.; O’Brien, K.R.; McDonald-Madden, E. Reducing Global Land-Use Pressures with Seaweed Farming. Nat. Sustain. 2023, 6, 380–390. [Google Scholar] [CrossRef]
- Hailu, H.G.; Kidu Mezgebo, G. Contract Farming and Sesame Productivity of Smallholder Farmers in Western Tigray, Ethiopia. Cogent Food Agric. 2024, 10, 2325093. [Google Scholar] [CrossRef]
- Arhin, I.; Yeboah, E.; Liu, X.; Liu, A.; Chen, X.; Li, X. Integrating Farmers’ Perception of Sustainable Agricultural Technologies towards the Development of Sustainable Tea Production in China. Int. J. Agric. Sustain. 2024, 22, 2303886. [Google Scholar] [CrossRef]
- Geda, M.B.; Mohammed, J.H.; Ibrahim, K.J.; Abshiro, F.Z. Determinants of Household-Level Food and Nutrition Security in Wheat Farmers of Arsi Zone, Ethiopia. Cogent Food Agric. 2024, 10, 2301635. [Google Scholar] [CrossRef]
- Zhang, F.; Cui, N.; Guo, S.; Yue, Q.; Jiang, S.; Zhu, B.; Yu, X. Irrigation Strategy Optimization in Irrigation Districts with Seasonal Agricultural Drought in Southwest China: A Copula-Based Stochastic Multiobjective Approach. Agric. Water Manag. 2023, 282, 108293. [Google Scholar] [CrossRef]
- Ren, C.; Zhou, X.; Wang, C.; Guo, Y.; Diao, Y.; Shen, S.; Reis, S.; Li, W.; Xu, J.; Gu, B. Ageing Threatens Sustainability of Smallholder Farming in China. Nature 2023, 616, 96–103. [Google Scholar] [CrossRef] [PubMed]
- Cai, S.; Zhao, X.; Pittelkow, C.M.; Fan, M.; Zhang, X.; Yan, X. Optimal Nitrogen Rate Strategy for Sustainable Rice Production in China. Nature 2023, 615, 73–79. [Google Scholar] [CrossRef] [PubMed]
- Raza, M.A.S.; Zulfiqar, B.; Iqbal, R.; Muzamil, M.N.; Aslam, M.U.; Muhammad, F.; Amin, J.; Aslam, H.M.U.; Ibrahim, M.A.; Uzair, M.; et al. Morpho-Physiological and Biochemical Response of Wheat to Various Treatments of Silicon Nano-Particles under Drought Stress Conditions. Sci. Rep. 2023, 13, 2700. [Google Scholar] [CrossRef] [PubMed]
- Liu, K.; Harrison, M.T.; Yan, H.; Liu, D.L.; Meinke, H.; Hoogenboom, G.; Wang, B.; Peng, B.; Guan, K.; Jaegermeyr, J.; et al. Silver Lining to a Climate Crisis in Multiple Prospects for Alleviating Crop Waterlogging under Future Climates. Nat. Commun. 2023, 14, 765. [Google Scholar] [CrossRef] [PubMed]
- Li, J.; Lin, Q. Threshold Effects of Green Technology Application on Sustainable Grain Production: Evidence from China. Front. Plant Sci. 2023, 14, 1107970. [Google Scholar] [CrossRef] [PubMed]
- Jamal, A.; Saeed, M.F.; Mihoub, A.; Hopkins, B.G.; Ahmad, I.; Naeem, A. Integrated Use of Phosphorus Fertilizer and Farmyard Manure Improves Wheat Productivity by Improving Soil Quality and P Availability in Calcareous Soil under Subhumid Conditions. Front. Plant Sci. 2023, 14, 1034421. [Google Scholar] [CrossRef]
- Khanna, A.; Kaur, S. An Empirical Analysis on Adoption of Precision Agricultural Techniques among Farmers of Punjab for Efficient Land Administration. Land Use Policy 2023, 126, 106533. [Google Scholar] [CrossRef]
- Omia, E.; Bae, H.; Park, E.; Kim, M.S.; Baek, I.; Kabenge, I.; Cho, B.-K. Remote Sensing in Field Crop Monitoring: A Comprehensive Review of Sensor Systems, Data Analyses and Recent Advances. Remote Sens. 2023, 15, 354. [Google Scholar] [CrossRef]
- Elahi, E.; Khalid, Z.; Tauni, M.Z.; Zhang, H.; Lirong, X. Extreme Weather Events Risk to Crop-Production and the Adaptation of Innovative Management Strategies to Mitigate the Risk: A Retrospective Survey of Rural Punjab, Pakistan. Technovation 2022, 117, 102255. [Google Scholar] [CrossRef]
- Du, L.; Wang, X. County-Based Analysis of Food Production and Crop Structure Changes in Jilin Province. China Agric. Resour. Zoning 2016, 37, 31–37. [Google Scholar]
- Zhang, D.; Shao, X.; Ling, F. Analysis of Comparative Advantages of Rice Production in Jilin Province at the Provincial Scale and Suggestions. China Agron. Bull. 2011, 27, 289–293. [Google Scholar]
- Meng, Y. Evolution of Grain Production Structure and Problems in Jilin Province. Agric. Technol. Econ. 1998, 43–46. Available online: https://kns.cnki.net/kcms2/article/abstract?v=jkwd3qsBIEL93tOgHCa3lNPkVuPINdYMgabLu4YWAS1aSyUTlGwtMvVAKz71IkIcoJu8hRNHbXrp8FrnUTg-FiGJpqtAb_7p-xLGMsOAgvrFXpnTtZMdDmKxokguxmiV&uniplatform=NZKPT&language=CHS (accessed on 2 July 2024).
- Guo, B.; Yang, F.; Fan, Y.; Zang, W. The Dominant Driving Factors of Rocky Desertification and Their Variations in Typical Mountainous Karst Areas of Southwest China in the Context of Global Change. Catena 2023, 220, 106674. [Google Scholar] [CrossRef]
- Sun, G.; Guo, B.; Zang, W.; Huang, X.; Han, B.; Yang, X.; Chen, S.; Wei, C.; Wu, H. Spatial–Temporal Change Patterns of Vegetation Coverage in China and Its Driving Mechanisms over the Past 20 Years Based on the Concept of Geographic Division. Geomat. Nat. Hazards Risk 2020, 11, 2263–2281. [Google Scholar] [CrossRef]
- Li, X.; Zulkar, H.; Wang, D.; Zhao, T.; Xu, W. Changes in Vegetation Coverage and Migration Characteristics of Center of Gravity in the Arid Desert Region of Northwest China in 30 Recent Years. Land 2022, 11, 1688. [Google Scholar] [CrossRef]
- Gedamu, W.T.; Plank-Wiedenbeck, U.; Wodajo, B.T. A Spatial Autocorrelation Analysis of Road Traffic Crash by Severity Using Moran’s I Spatial Statistics: A Comparative Study of Addis Ababa and Berlin Cities. Accid. Anal. Prev. 2024, 200, 107535. [Google Scholar] [CrossRef] [PubMed]
- Zhang, L.; Weng, D.; Xu, Y.; Hong, B.; Wang, S.; Hu, X.; Zhang, Y.; Wang, Z. Spatio-Temporal Evolution Characteristics of Carbon Emissions from Road Transportation in the Mainland of China from 2006 to 2021. Sci. Total Environ. 2024, 917, 170430. [Google Scholar] [CrossRef] [PubMed]
- Jiang, C.; Wang, L.; Guo, W.; Chen, H.; Liang, A.; Sun, M.; Li, X.; Omrani, H. Spatio-Temporal Evolution and Multi-Scenario Simulation of Non-Grain Production on Cultivated Land in Jiangsu Province, China. Land 2024, 13, 670. [Google Scholar] [CrossRef]
- Zhao, Y.; Lu, H. Measurement of Comparative Advantage of Grain Production and Analysis of Main Influencing Factors in Sichuan Province. Agric. Econ. Manag. 2019, 64–73. Available online: https://kns.cnki.net/kcms2/article/abstract?v=jkwd3qsBIEJl-dXXALVIJ7Q5bn7y5L91ysZPl2pMDS0u922WzI6j2Y0FxFptxqLgKtmYVQ4r7N7z5aUhhlrl8xG2x8xByvXUk02xn9ouCQN6V85stjs0nAlgKYf5HUr_ywkxXwXdsFI=&uniplatform=NZKPT&language=CHS (accessed on 2 July 2024).
- Luo, S.; He, Y.; Luo, Q. Analysis of Regional Comparative Advantages of Potato Production and Its Influencing Factors in China. China Agric. Resour. Zoning 2018, 39, 137–144. [Google Scholar]
- Bhatti, U.A.; Tang, H.; Khan, A.; Yasin Ghadi, Y.; Bhatti, M.A.; Khan, K.A. Investigating the Nexus between Energy, Socio-Economic Factors and Environmental Pollution: A Geo-Spatial Multi Regression Approach. Gondwana Res. 2024, 130, 308–325. [Google Scholar] [CrossRef]
- Zeng, Y.; Liu, S.; Huang, S.; Patil, S.D.; Gao, W.; Li, H. Exploring Spatiotemporal Characteristics and Driving Forces of Straw Burning in Hunan Province, China, from 2010 to 2020. Remote Sens. 2024, 16, 1438. [Google Scholar] [CrossRef]
- Deng, X.; Mao, L.; Peng, M.; Cai, Y.; Wang, T.; Luo, Z.; Kumar, A. Polycyclic Aromatic Hydrocarbons in Coastal Rivers in Jiangsu Province, China: Spatial Distribution, Source Apportionment and Human Impacts. J. Hazard. Mater. 2024, 466, 133576. [Google Scholar] [CrossRef] [PubMed]
- Khan, A.A.; Mei, B.; Khan, S.U.; Ali, M.A.S.; Luo, J. Agri-Food Evolution and Carbon Emissions in Chinese Residential Consumption: A Life Cycle Analysis of Urban-Rural Disparities and Socioeconomic Influences. Environ. Impact Assess. Rev. 2024, 105, 107387. [Google Scholar] [CrossRef]
- Yang, S.; Su, H. Evaluation of Urban Ecological Environment Quality Based on Google Earth Engine:A Case Study in Xi’an, China. Pol. J. Environ. Stud. 2023, 32, 927–942. [Google Scholar] [CrossRef]
- Wei, H.; Gao, Y.; Han, Q.; Li, L.; Dong, X.; Liu, M.; Meng, Q. Quality Evaluation and Obstacle Identification of Human Settlements in the Qinghai–Tibet Plateau Based on Multi-Source Data. Land 2022, 11, 1479. [Google Scholar] [CrossRef]
- Liu, H.; Li, X.; Guan, Y.; Li, S.; Sun, H. Comprehensive Evaluation and Analysis of Human Settlements’ Suitability in the Yangtze River Delta Based on Multi-Source Data. Int. J. Environ. Res. Public Health 2023, 20, 1354. [Google Scholar] [CrossRef] [PubMed]


Disclaimer/Publisher’s Note: The statements, opinions and data contained in all publications are solely those of the individual author(s) and contributor(s) and not of MDPI and/or the editor(s). MDPI and/or the editor(s) disclaim responsibility for any injury to people or property resulting from any ideas, methods, instructions or products referred to in the content. |
© 2024 by the authors. Licensee MDPI, Basel, Switzerland. This article is an open access article distributed under the terms and conditions of the Creative Commons Attribution (CC BY) license (https://creativecommons.org/licenses/by/4.0/).