Article

Exploring the Spatiotemporal Evolution Patterns and Determinants of Construction Land in Mianning County on the Eastern Edge of the Qinghai–Tibet Plateau

1
College of Geography and Planning, Chengdu University of Technology, Chengdu 610059, China
2
State Key Laboratory of Urban and Regional Ecology, Research Center for Eco-Environmental Sciences, Chinese Academy of Sciences, Beijing 100085, China
3
Human Geography Research Center of Qinghai-Tibet Plateau and Its Eastern Edge, Chengdu University of Technology, Chengdu 610059, China
4
Sichuan Research Institute of Ecological Restoration of Land Space and Geohazard Prevention and Control, Chengdu 610063, China
*
Author to whom correspondence should be addressed.
Land 2024, 13(7), 993; https://doi.org/10.3390/land13070993
Submission received: 13 May 2024 / Revised: 26 June 2024 / Accepted: 1 July 2024 / Published: 5 July 2024

Abstract

:
Studying the spatiotemporal evolution and driving forces behind construction land amidst the intricate ecological and geological setting on the eastern edge of the Qinghai–Tibet Plateau offers invaluable insights for local sustainable development in a landscape transition zone and ecologically fragile area. Using construction land data from four phases, spanning 1990 to 2020, in Mianning County, this study employs methodologies like the Landscape Expansion Index (LEI) and land use transfer matrix to delineate the spatiotemporal evolution characteristics of construction land. A comprehensive set of 12 influencing factors across five categories—geomorphology, geological activity, climate, river and vegetation environment, and social economy—were examined. The Geographically Weighted Regression (GWR) model was then employed to decipher the spatial distribution pattern of construction land in 1990 and 2020, shedding light on the driving mechanisms behind its changes over the three decades. The research reveals distinct patterns of construction land distribution and evolution in Mianning County, shaped by the ecological and geological landscape. Notably, the Anning River wide valley exhibits a concentrated and contiguous development mode, while the Yalong River deep valley showcases a decentralized development pattern, and the Dadu River basin manifests an aggregation development mode centered around high mountain lakes. Over the study period, all three river basins witnessed varying degrees of construction land expansion, transitioning from quantitative expansion to qualitative enhancement. Edge expansion predominantly characterizes the expansion mode, complemented by leapfrog and infilling modes, accompanied by conversions from cropland and forest land to construction land. An analysis of the spatial pattern and drivers of construction land change highlights human-induced factors dominating the Anning River Basin, contrasting with natural factors prevailing in the Yalong River Basin and the Dadu River Basin. Future efforts should prioritize climate change considerations and environmental capacity, aiming for an ecologically resilient spatial pattern of construction land.

1. Introduction

Construction land serves as a multifaceted indicator, offering insights into the spatial layout, expansion trends, land use efficiency, decision-making processes, and interactions with the natural environment within human activity domains. Through the vigilant monitoring and systematic study of construction land patterns and dynamics, we gain a deeper comprehension of human activities’ impact on land resources and the environment, thus facilitating the formulation of scientifically informed land use planning and policies [1,2]. Remote sensing technology [3,4,5] and land use surveys [6,7] provide essential tools for delineating the distribution patterns and dynamic changes of construction land. Several key indicators are instrumental in characterizing land use changes, including the speed of construction land expansion [8,9], alterations in construction land structure [10,11], land use intensity [12,13], land conversion rates [14], the nexus between construction land and population [15,16], and the economic construction land elasticity coefficient [17,18], among others.
The spatial distribution and dynamic changes of construction land are the culmination of both internal and external factors, which can be categorized into natural and human influences [19,20]. Over extended periods, natural driving forces predominantly shape the spatial patterns of construction land, characterized by gradual and stable transformations [21]. Conversely, regions endowed with favorable geographical conditions often experience human factors as the primary drivers of construction land change [22,23]. Particularly in mountainous regions with intricate terrain, the impact of natural factors is profound [24,25]. Natural factors encompass geological, topographical, climatic, and hydrological elements [26]. Geological factors include geological structure, lithological stratigraphy, seismic activity, and geological hazards [27,28]. Terrain features comprise altitude, slope, and aspect, among others [29,30]. Climate considerations encompass precipitation, temperature, and related variables [31,32]. Hydrological factors entail water resource distribution, accessibility, and submerged water levels [33,34]. Human factors encompass economic, social, technological, and policy dimensions. Economic factors span the level and stage of economic development, industrial structure, gross domestic product (GDP), investment, income levels, etc. [35,36,37,38]. Social elements involve population size and density, urbanization levels, and developmental stages [39,40,41]. Technical aspects encompass transportation, technology, construction practices, environmental protection measures, etc. [42,43,44]. Policy dimensions include land use planning, taxation and management policies, immigration, and relocation strategies [45,46,47,48].
Prior research has employed a diverse array of statistical and spatial analysis models to scrutinize the spatial patterns, dynamic shifts, and driving forces underlying construction land dynamics. These methodologies include linear regression analysis [49,50], multiple regression models [51,52,53], principal component analysis [54,55], logistic regression analysis [56,57,58], multi-index coupling models [59], system dynamics models [60,61,62], network/spatial lag models [63], random forest models [64], geographically weighted regression models [65,66], and Geodetector models [67,68]. Among these methodologies, those rooted in geographic spatial foundations hold particular promise, offering comprehensive insights into the multifaceted impacts of various factors across different spatial contexts. Consequently, the application of models such as Geodetector models and geographically weighted regression models is witnessing a notable surge in popularity.
In China, research on the drivers of land use change, including alterations in construction land, took root in the 1990s. Existing scholarship predominantly delves into the spatial characteristics and mechanisms governing construction land expansion, the driving forces propelling such expansion, and the ecological environment’s response to this growth [54]. Research endeavors span diverse spatial scales, encompassing national [17,69], provincial [17,69], urban agglomerations [70], urban cores [71,72], peri-urban areas [73], and municipal and county levels [74,75]. However, scholarly attention dedicated to construction land and its transformations in China’s western regions [76], particularly on the eastern periphery of the Qinghai–Tibet Plateau, remains relatively scant. Positioned within a transition zone of diverse topographical and climatic attributes, the geological and topographical complexity of the plateau’s eastern edge, coupled with its variable climate, imparts unique regional characteristics to the spatial distribution and evolution of construction land. Although some studies have undertaken the geomorphological zoning [77] and city/autonomous prefecture-level analyses [24] of construction land distribution characteristics in this area, there remains a dearth of a thorough analysis elucidating the formation of its spatial patterns and dynamic changes. The inadequate spatial quantification and consideration of geological, climatic, and accessibility factors pose notable limitations. Addressing this gap, urgent attention is warranted to investigate the patterns, dynamics, and causal mechanisms underpinning construction land at the scale of typical cities, prefectures, and counties on the eastern fringes of the Qinghai–Tibet Plateau. Such endeavors are essential for a nuanced understanding of the driving forces stemming from natural and human factors, thereby furnishing a robust decision-making framework for optimal regional land resource allocation.
In addressing the limitations of prior research concerning regional coverage and indicator selection, this study undertakes a comprehensive examination of the intricate ecological and geological milieu within the transitional zone along the eastern fringe of the Qinghai–Tibet Plateau. Mianning County, traversing the geomorphic boundary of the plateau and encompassing the Yalong River Basin, Anning River Basin, and Dadu River Basin, serves as the focal area for this investigation. Leveraging Landsat satellite remote sensing imagery with a spatial resolution of 30 m, coupled with land survey data and field verification data, we obtained land use data spanning four distinct periods, 1990, 2000, 2010, and 2020, with a particular emphasis on construction land dynamics. Sequentially, the study achieves the following research objectives: (I) the identification of spatial characteristics pertaining to construction land; (II) the exploration of temporal and spatial variations in construction land; (III) the analysis of the factors contributing to the spatial pattern formation of construction land during the 1990 and 2020 phases; and (IV) the elucidation of the causes and mechanisms driving changes in construction land from 1990 to 2020.

2. Study Area and Data Processing
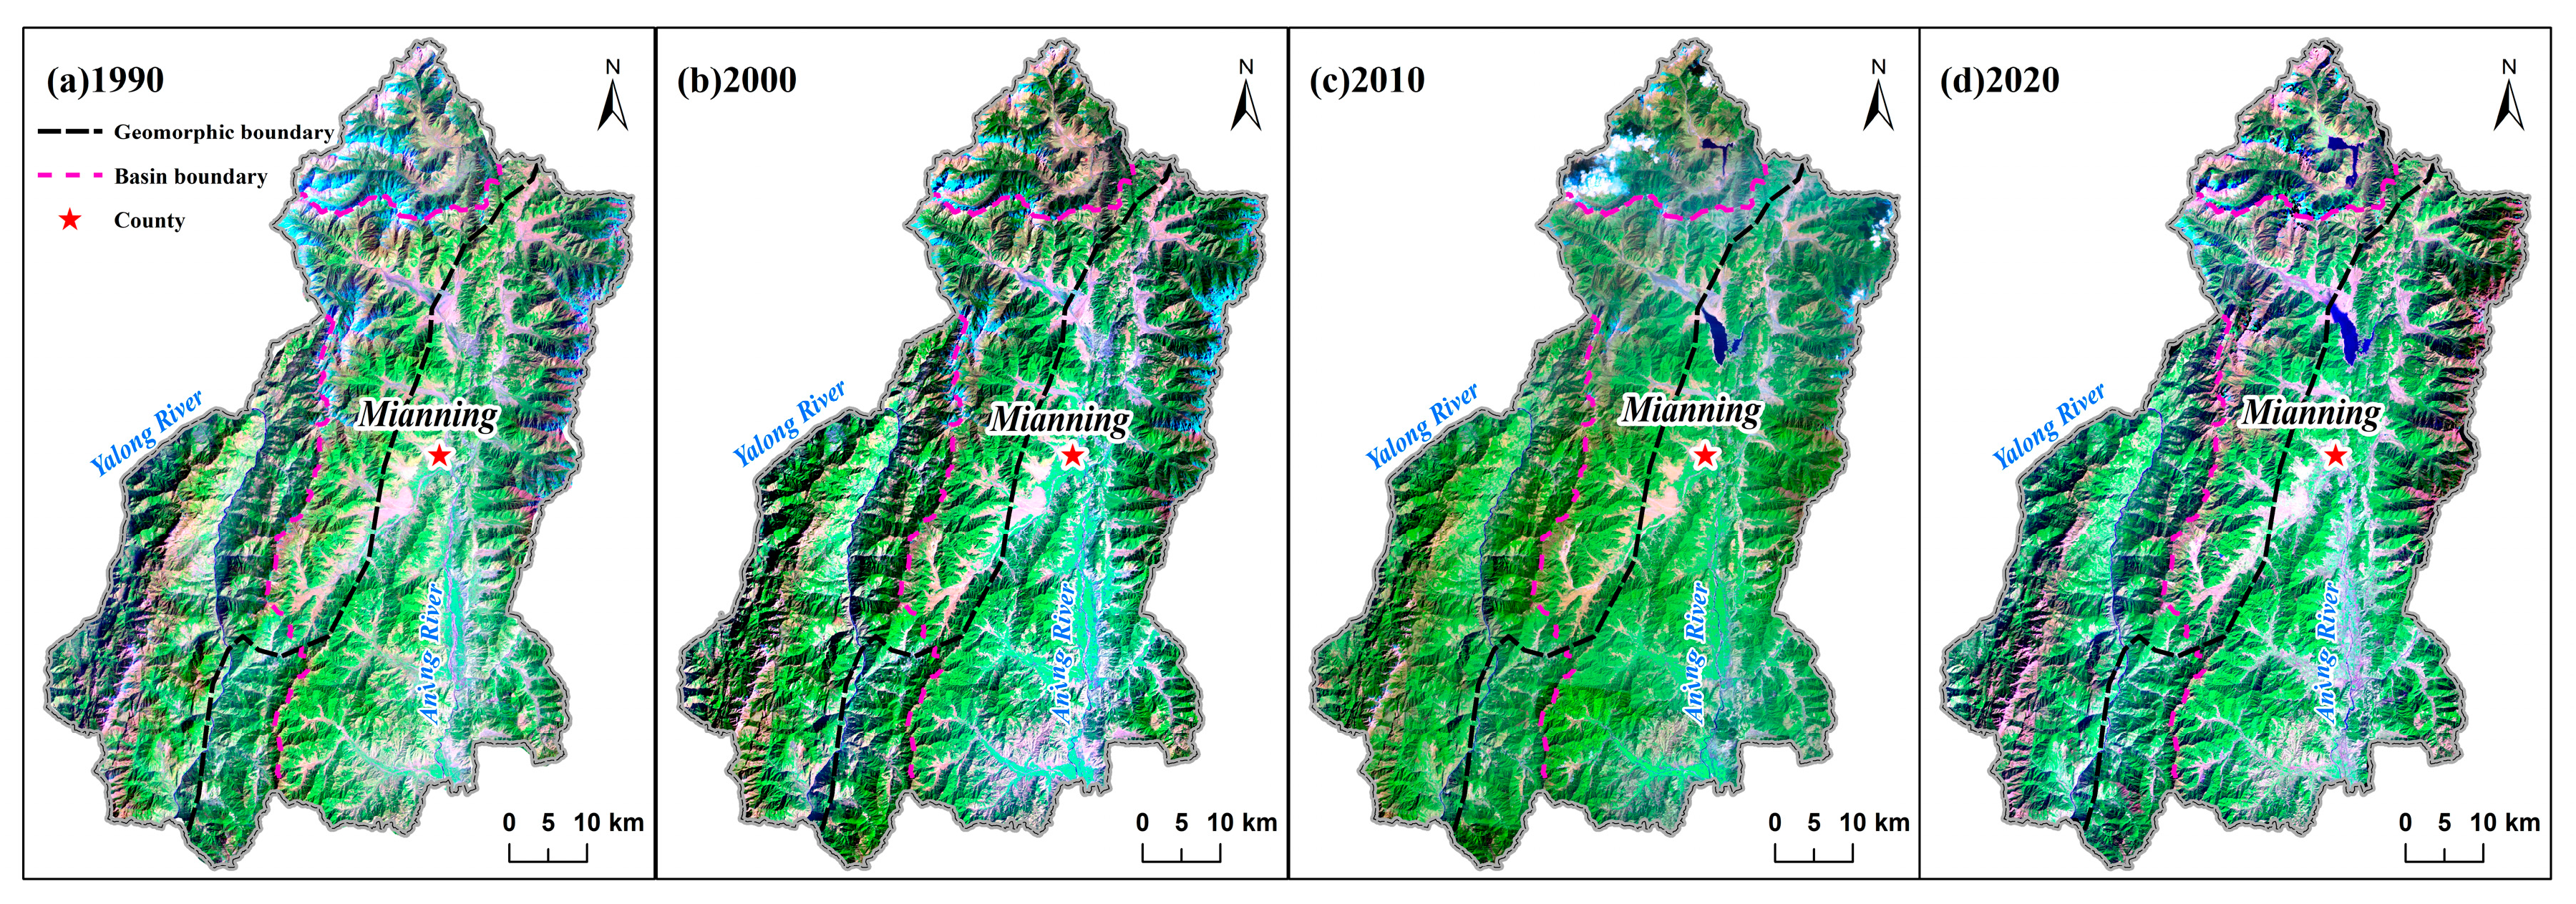
2.1. Study Area

Situated within the transition zone stretching from the eastern Qinghai–Tibet Plateau to the Sichuan Basin (Figure 1), Mianning County lies within the Liangshan Yi Autonomous Prefecture, Sichuan Province, China. The geographic coordinates of the research area span from 101°38′ E to 102°25′ E longitude and 28°05′ N to 29°02′ N latitude, encompassing a total land area of approximately 4420 km2. The terrain within the research area exhibits an elevation gradient, characterized by higher elevations in the north and lower elevations in the south, with peaks reaching up to 5306 m and valleys descending to as low as 1255 m. The average elevation across the area is 2737 m, with an average topographic relief of 251 m.
From a tectonic perspective, the study area resides within the northern segment of the Sichuan–Yunnan structural belt, marked by significant geological structures such as the Xiaojin River Fault, the Jinhe–Chenghai Fault, and the Anning River Fault. The study area is divided into three basins: the Anning River Basin in the central and eastern parts, which includes Gaoyang Street, Yihai, Hui’an, Ruoshui, Fuxing, Hongmo, Shilong, Hebian, Lugu, Zeyuan, and Manshuiwan; the Yalong River Basin in the west, encompassing He’ai, Jinping, Mianshawan, Jianmei, Mofanggou, and Lizhuang; and the Dadu River Basin in the north, which includes Yele. The economic landscape of the county exhibits a notable geographical gradient, driven by a combination of natural and socio-economic factors. Notably, construction land is predominantly concentrated within the Anning River and Yalong River basins, mirroring the intricate interplay between geological features and human activities.

2.2. Data Sources

2.2.1. Construction Land Data

The study utilized Landsat-5 TM and Landsat-8 OLI images, comprising a total of four phases and eight scenes, obtained from the US Geological Survey website (http://glovis.usgs.gov, accessed on 26 March 2024). The temporal span averaged 10 years with a spatial resolution of 30 m (Figure 2), and there were no significant fluctuations in construction land at each selected time node. If the cloud cover exceeds 5% for a given year, data from neighboring years will be utilized for synthesis or replacement. By integrating data from the first, second, and third land use surveys of Mianning County, we derived land use data for the years 1990, 2000, 2010, and 2020 through interpretation, investigation, and correction processes (Figure 3). Routes and sampling verification across the three basins indicate that the accuracy of construction land identification exceeds 95%. Construction land encompasses six secondary categories: urban construction land, independent industrial and mining land, transportation land, rural residential land, water conservancy facility land, and special land [78]. The study area primarily emphasizes the first four secondary land categories. However, owing to the resolution constraints of Landsat satellite data, this study does not differentiate between these secondary categories within construction land; instead, it consolidates them into a unified category of construction land.

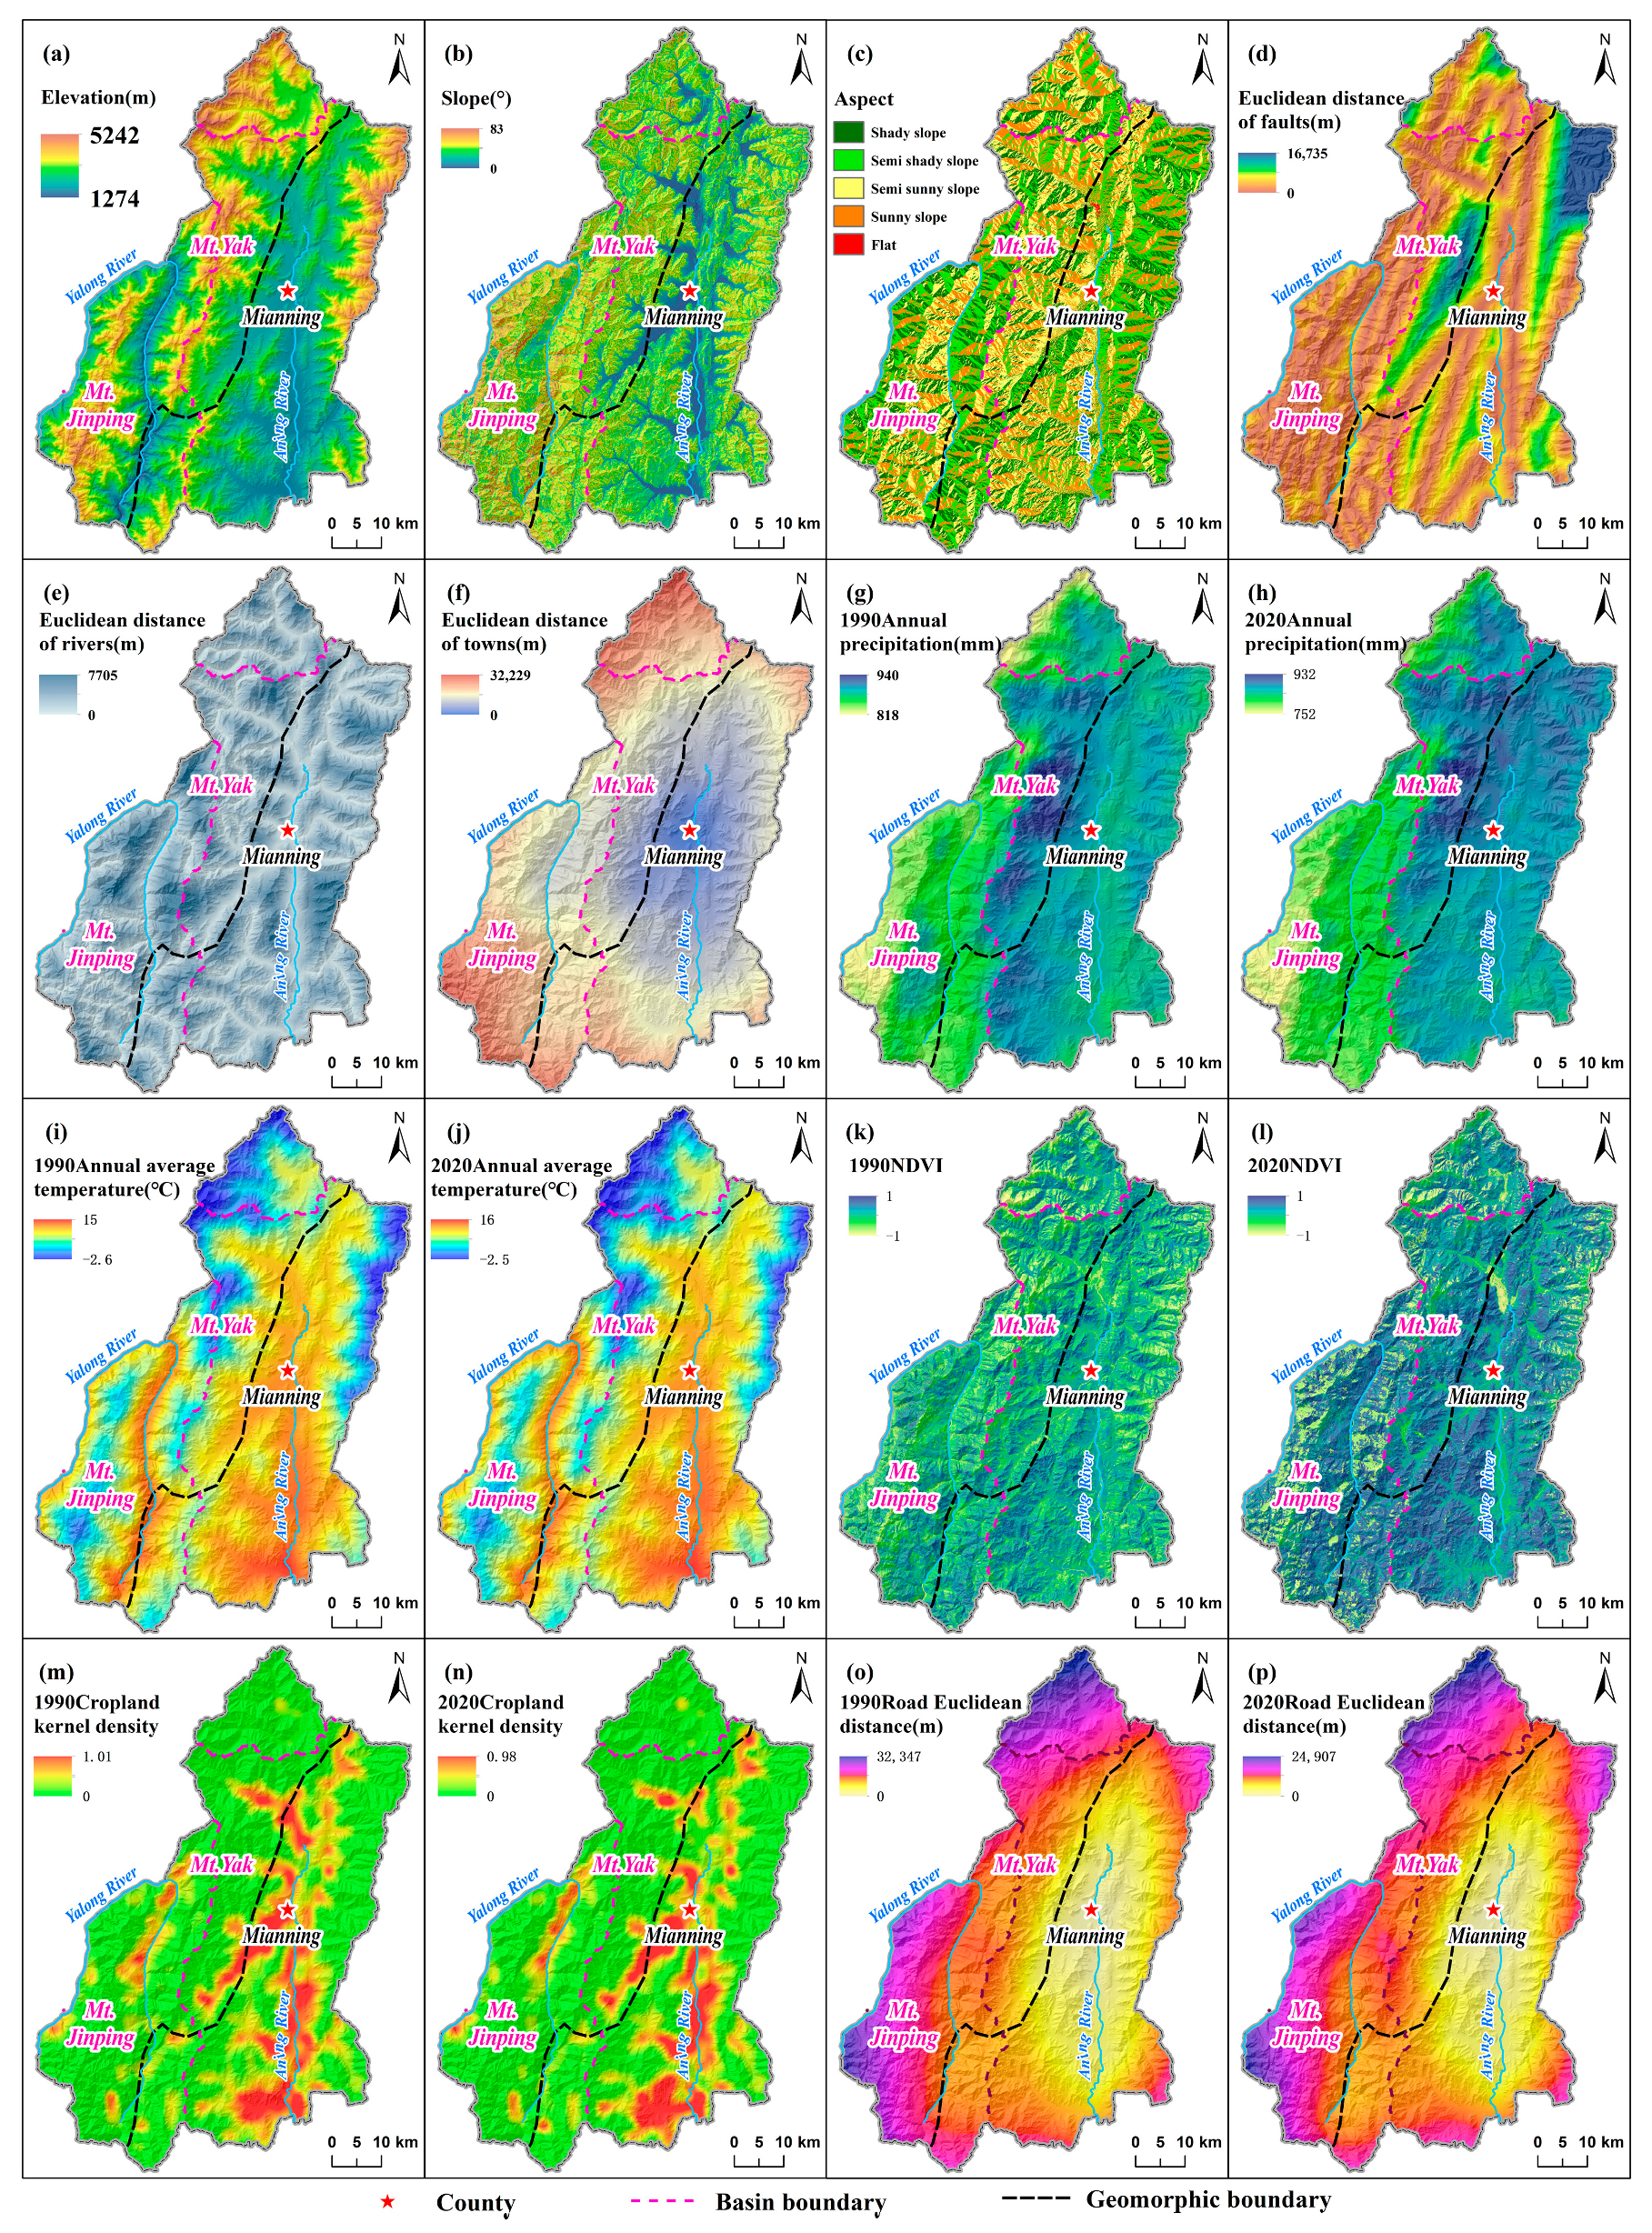
2.2.2. Impact Factors

Drawing upon prior studies [79,80] and taking into account the geological and geographical conditions of Mianning County, we primarily consider factors closely related to the evolution of construction land based on their representativeness, comprehensiveness, and accessibility (Table 1). Natural factors that constrain or drive the evolution of construction land include geomorphology, geology, climate, rivers, and vegetation [81,82,83]. Conversely, human factors such as cropland, town accessibility, and road accessibility play a relatively active role in driving the spatiotemporal evolution of construction land [84,85,86].
During the study period from 1990 to 2020, the geomorphology exhibited relatively stable characteristics; hence, geomorphological data from a single period were selected. Digital elevation data (ASTER GDEM) with a spatial resolution of 30 m were acquired from the Geospatial Data Cloud website (http://www.gscloud.cn, accessed on 26 March 2024). ASTER GDEM (Figure 4a) was utilized to derive slope (Figure 4b) and aspect (Figure 4c) data. These three factors, elevation, slope, and aspect, were employed to characterize the influence of geomorphology on the spatial pattern and temporal changes of construction land.
Geological considerations primarily involve faults and geological hazard factors. Throughout the study period, there was no significant activity observed along fault lines; therefore, a single period of geological data was utilized to extract fault information. Vector data regarding faults were obtained from the China Geological Survey (https://www.ngac.org.cn, accessed on 26 March 2024), and fault Euclidean distance data (Figure 4d) were generated to depict the influence of geological structures on construction land. Geological disaster occurrences exhibit notable spatiotemporal variations. We compiled geological disaster point data from 1990 to 2020, sourced from the Sichuan Provincial Institute of Land Space Ecological Restoration and Geological Disaster Prevention and Control. Using the kernel density analysis method, raster data for two time points, 1990 (Figure 5a) and 2020 (Figure 5b), were generated, and changes in geological disaster kernel density between these years were calculated (Figure 5c). The kernel density analysis is a spatial analysis method that can effectively display the concentration and spatial distribution trends of point data, particularly capturing the spatial distribution patterns of data without prior assumptions. These analyses were conducted to delineate the impact of geological disasters on the spatial distribution and dynamic changes of construction land.
The influence of climate on construction land primarily revolves around two factors: annual precipitation and annual average temperature, sourced from the National Qinghai–Tibet Plateau Scientific Data Center (https://data.tpdc.ac.cn, accessed on 26 March 2024). The data span the period from 1990 to 2020. For the analysis of construction land patterns and evolution, data from 1990 (Figure 4g,i) and 2020 (Figure 4h,j) are predominantly utilized, along with change data spanning from 1990 to 2020.
Rivers and vegetation primarily influence the surrounding environment of construction land. Rivers typically undergo localized changes in width, and, for this study, single-period data sourced from the National Geomatics Center of China (http://www.ngcc.cn, accessed on 26 March 2024) were utilized. The Euclidean distance calculation method was applied to the river vector data to generate raster data (Figure 4e). Vegetation data were derived from Landsat remote sensing imagery for the years 1990 (Figure 4k) and 2020 (Figure 4l). The Normalized Difference Vegetation Index (NDVI) was computed to characterize the impact of vegetation.
Social and economic factors primarily encompass the influence of cropland density, town accessibility, and road accessibility. Cropland kernel density is utilized to depict the impact of cropland, with data sourced from remote sensing interpretation of Landsat imagery. Changes in cropland kernel density from 1990 (Figure 4m) to 2020 (Figure 4n) were calculated. Town points within Mianning County and surrounding areas were extracted from the National Geomatics Center of China to assess town accessibility. Euclidean distance was employed to describe the spatial impact of each town point. As town locations remained constant, single-period data were used to illustrate their spatial impact (Figure 4f). Road data from 1990 and 2020 were collected and revised to analyze road accessibility. The Euclidean distance of roads in 1990 (Figure 4o) and 2020 (Figure 4p) was calculated, and changes in the road Euclidean distance from 1990 to 2020 were analyzed to understand the role of roads in the spatial pattern and changes in construction land.

2.3. Methods

2.3.1. Landscape Expansion Index

The Landscape Expansion Index (LEI) is employed to quantitatively characterize the spatial expansion patterns of construction land, delineated into three modes (Figure 6): leapfrog (LEI = 0), edge expansion (0 < LEI ≤ 50), and infilling (50 < LEI ≤ 100). The edge expansion mode entails the augmentation of construction land based on existing areas, with the surrounding topography, economic conditions, and other factors meeting the requirements for construction land development [87]. The leapfrog mode involves selecting suitable areas for construction due to the saturation of existing construction land or constraints imposed by terrain, economic factors, and other considerations. The infilling mode primarily involves intensifying the use of existing construction land by adding or renovating within its boundaries. The calculation formula is as follows [88]:
L E I = 100 × A 0 A 0 + A V
where A 0 is the intersection point between the newly expanded construction land patch buffer zone and the original construction land, and A V is the intersection of the buffer zone and non-construction land.

2.3.2. Geographically Weighted Regression

The Geographically Weighted Regression (GWR) model serves as a spatial extension of conventional regression models, offering the capability to estimate local parameters [89]. In this model, parameters for each spatial point within the entire framework are independently quantified, typically utilized to assess the presence of spatial non-stationarity in the relationship between the dependent and independent variables [90]. The GWR model proves useful in discerning the influence of various natural and human factors on the spatial distribution pattern and evolution of construction land. Extending traditional global regression, the GWR model incorporates geographic location parameters. The calculation of Formula (2) is as follows:
y i = β o   μ i , v i + k = 1 p β k ( μ i , v i ) x i k + ε i ,   i = 1,2 , n
where y i is the dependent variable, x is the independent variable of the explanatory factor, β 0 μ i , v i represents the intercept at position i, β k μ i , v i represents the local parameter estimation of the explanatory variable x i k at position i, and ε i is the random error term at point i.
The estimation coefficients of GWR are weighted based on the observed values and the spatial proximity of a specific point i, and the rectangular equation can be used to estimate the parameters:
β ^ μ , v = ( X T W ( μ i , v i ) X ) 1 X T W ( μ i , v i ) Y
where β ^ μ , v represents the unbiased estimate of the regression coefficient β , W ( μ i , v i ) is the weighting matrix, and X and Y are the matrices of independent and dependent variables. W ( μ i , v i ) ensures that observations close to a specific location have greater weight, expressed using a Gaussian weighted kernel function:
w i j = e x p ( d i j b 2 )
where w i j represents the weight of observation j at position i, d i j represents the Euclidean distance between regression point i and adjacent observation j, and b represents the basic width of the kernel function.
Stationarity exists when the variable x i k does not vary with position i, and the GWR-based stationarity index is used to estimate spatial stationarity [89]:
S I = β G W R _ i q r 2 × G L M _ s e
where SI is the stationarity index, β G W R _ i q r is the standard error interquartile range of the GWR coefficient, and G L M _ s e is the standard error of the global regression analysis. When SI < 1, the explanatory variable y and the dependent variable x achieve spatial stationarity.
AIC can be used to determine the significance of the coefficients to compare relative measures of model performance [91]; the smaller the AIC is, the more reliable the model is, and AICc represents the limited sample size correction result of the AIC:
A I C c = 2 n I n σ ^ + n l n 2 π + n ( n + t r ( S ) n 2 t r ( S ) )
where n is the number of samples, σ ^ is the estimated value of the residual standard deviation, and tr(S) represents the trajectory of the hat matrix, and, when the AICc value is lower than three, the model performs better.
The GWR model is employed to elucidate the factors contributing to the spatial distribution of construction land in 1990 and 2020, as well as the drivers of its evolution from 1990 to 2020. For analyzing the spatial pattern of construction land in these years, the independent variables include ELEVATION, SLOPE, ASPECT, ED_FAULT, TEM, PRE, ED_RIVER, NDVI, KD_CROPLAND, ED_TOWN, and ED_ROAD corresponding to the respective years. The dependent variables are the kernel density of construction land in 1990 and 2020, respectively. To investigate the causes of the evolution of construction land from 1990 to 2020, six static factors (ELEVATION, SLOPE, ASPECT, ED_RIVER, ED_FAULT, and ED_TOWN) and six dynamic factors (KD_GEOHAZARD, TEM, PRE, NDVI, KD_CROPLAND, and ED_ROAD) from 1990 to 2020 are considered as independent variables. The dependent variable is the change in construction land kernel density from 1990 to 2020. To ensure the stability and explanatory power of the GWR model, we conducted a spatial autocorrelation analysis and checked for multicollinearity in the data. The results indicate that there is spatial correlation in the data, while there is no multicollinearity among the explanatory variables. During the calculation process, the raster data are transformed into point data to form a dataset, which is subsequently analyzed using GWR 4.0 software [92] developed at NCG (National Center for Geocomputation, National University of Ireland Maynooth) and the Department of Geography, Ritsumeikan University, Japan (https://gwr.maynoothuniversity.ie, accessed on 26 March 2024) to derive relevant results such as GWR estimation coefficients. Outliers are then removed from the GWR estimation coefficients. Finally, Kriging interpolation is applied to create a grid map of GWR estimation coefficients at the county scale.

3. Results

3.1. Spatiotemporal Characteristics of Construction Land

3.1.1. Temporal Changes in Construction Land

Within the study period, construction land exhibited sustained growth and displayed significant phased patterns (Table 2 and Figure 7). Figure 7 shows that high-density areas of construction land are primarily distributed along river valleys and relatively gentle slopes. Additionally, regions with significant changes in kernel density are also located in these areas. The area of construction land was 41.55 km2 in 1990, 58.66 km2 in 2000, 82.75 km2 in 2010, and 95.26 km2 in 2020, representing a 2.29-fold increase compared to 1990. Over the period from 1990 to 2020, construction land sustained a rapid and continuous growth trend, with a total increase of 53.71 km2, corresponding to an average annual growth rate of approximately 2.80%, equivalent to 1.79 km2 per year. During the growth phases of construction land, the period from 1990 to 2000 marked the initial stage of growth, while 2000 to 2010 witnessed the fastest growth phase. Subsequently, from 2010 to 2020, the growth rate stabilized, reflecting a stage of conservation and intensive growth. The number of construction land patches observed in each phase were 700 in 1990, 820 in 2000, 914 in 2010, and 1059 in 2020. From 1990 to 2010, the average patch area of construction land exhibited a generally increasing trend, indicating expansion into areas with favorable conditions. Conversely, from 2010 to 2020, the average patch area of construction land declined, suggesting that the scale of the newly expanded construction land was more constrained by land use conditions, resulting in a reduction in larger-scale expansion.
The reciprocal conversion between construction land and other land use types remains relatively stable. Analyzing land use conversion from 1990 to 2020 reveals that the area converted to construction land far exceeds the area converted from construction land. Cropland, forestland, grassland, wetland, and other land types have all undergone varying degrees of conversion to construction land, with cropland and forestland accounting for 77.27% and 14.89% of the total converted area, respectively. Conversely, construction land has also been converted to other land types during different periods, primarily to cropland and forestland. Between 2000 and 2010, approximately 1.95 km2 of construction land was transferred out, primarily occurring in localized relocation areas such as those designated for targeted poverty alleviation, ecological migration, and construction projects.

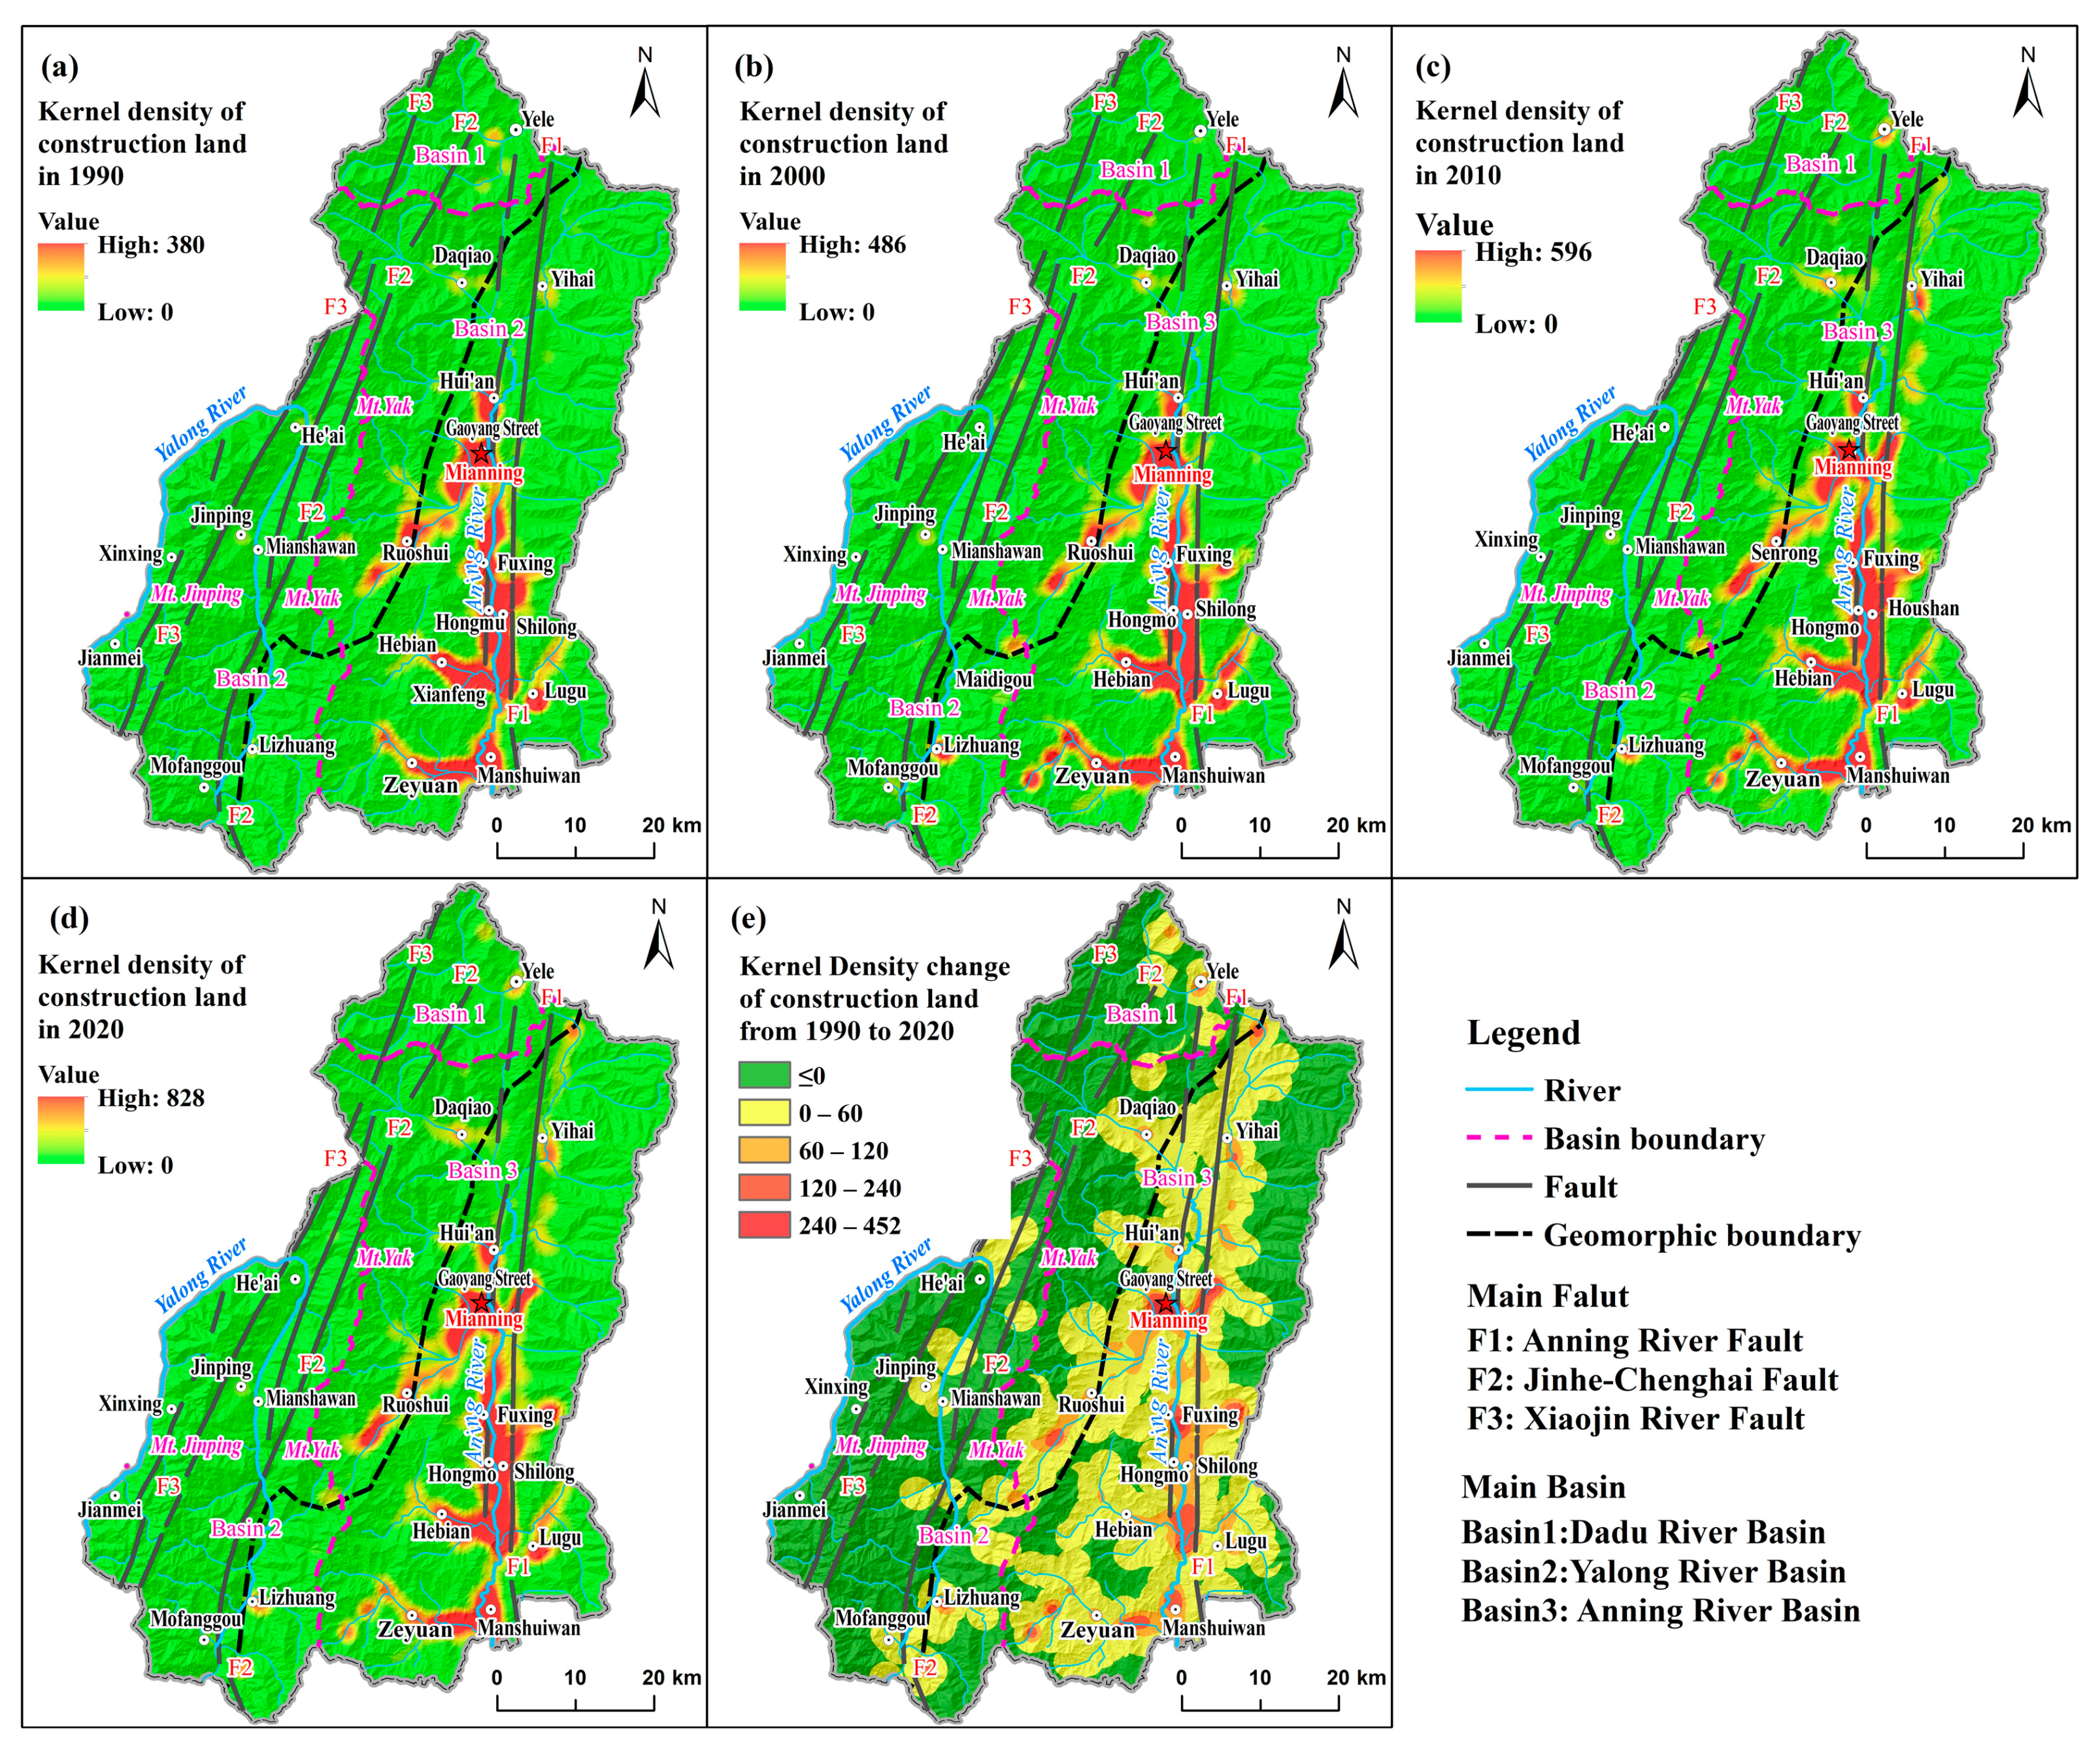
3.1.2. Spatial Changes in Construction Land

According to the Landscape Expansion Index definition, three expansion modes emerge at different stages, with construction land in the study area predominantly characterized by the edge expansion mode, complemented by the leapfrog mode and infilling mode. In terms of the patch area proportion, the edge expansion mode represents the highest share of new construction land area, comprising approximately 64.83%, while the leapfrog mode accounts for 35.06%, and the infilling mode constitutes only 0.11%. Regarding the patch number proportion, patches exhibiting the edge expansion mode represent 71.30% of the total number of new construction lands, followed by the leapfrog mode at 28.69%, and the infilling mode at a mere 0.01%.
At the watershed scale, the distribution of the three expansion modes varies across different study periods. In the Anning River Basin, the expansion model of new construction land from 1990 to 2020 is primarily characterized by the edge expansion mode, with its proportion showing a trend of an initial decrease followed by an increase. The leapfrog mode exhibits an initial increase followed by a decrease, reaching 23.83% from 2000 to 2010. In the Yalong River Basin, the leapfrog mode and edge expansion mode proportions in the expansion modes of new construction land are roughly equivalent, with the leapfrog mode emerging as the primary expansion mode. Between 2000 and 2010, the number and area of new construction land in the Yalong River Basin were limited and mainly occurred in the leapfrog mode. In the Dadu River Basin, approximately 80% of the new construction land adopts the edge expansion mode, while approximately 19% adopts the leapfrog mode, with the infilling mode accounting for a negligible proportion.

3.1.3. Typical Spatial Patterns of Construction Land

Influenced by resource availability and environmental factors, the distribution and expansion of construction land in Mianning County have given rise to three distinctive spatial patterns: the Wide Valley Spatial Pattern, the Deep Valley Spatial Pattern, and the High Mountain Lake Basin Spatial Pattern.
The characteristics of the Wide Valley Spatial Pattern (Figure 8) are as follows: Construction land primarily spans the expansive valley of the Anning River, displaying a gradual decline in density as the distance from the river increases. The basin terrain is characterized by flat, broad areas with fertile soil, conducive agricultural conditions, well-established industrial infrastructure, a thriving economy, and a significant concentration of construction land. Rapid and edge expansion serve as the primary growth pattern for construction land within this mode.
The Deep Valley Spatial Pattern (Figure 9) is characterized by the following features: Influenced by the rugged terrain, construction land is dispersed across numerous areas and exhibits localized concentrations. This mode can be further subdivided into three distinct cases. In the first scenario (B1), construction land is predominantly situated on flat slopes or valley bottoms near rivers, with landform types primarily comprising river terraces and alluvial fans. In the second scenario (B2), scattered and smaller-scale construction land is dispersed across small platforms within the middle of slopes. In the third scenario (B3), construction land is primarily located on upper slopes or even terraces near the summit of the slope. Changes in construction land predominantly occur in the form of the leapfrog mode and the edge expansion mode. These areas (B3) represent pivotal zones for construction land expansion within the Yalong River Basin.
The High Mountain Lake Basin Spatial Pattern (Figure 10) in the Dadu River Basin is distinguished by the following features: Construction land is concentrated around the Yele Basin, alternatively referred to as the Yele Reservoir. It primarily occupies the alluvial fan adjacent to the reservoir, forming a small cluster distribution centered around animal husbandry, agriculture, and tourism.

3.2. Characteristics of Multi-Factor Influences on Construction Land

3.2.1. Impact of Multiple Factors on Construction Land in 1990

In 1990, the spatial distribution pattern of construction land in the Yalong River Basin and Dadu River Basin was primarily influenced by natural factors, whereas both human and natural factors exerted similar control effects in the Anning River Basin (Figure 11). To effectively characterize the influence of other factors on construction land, the characteristics of GWR estimation coefficients were statistically analyzed using the 2020 construction land and its 1 km buffer zone (Table 3). The 1 km buffer zone was established based on the spatial expansion of construction land from 1990 to 2020, extending outward by two to three times the initial distance. This method was also applied to compute the statistics of the 2020 GWR estimation coefficient and the 1990–2020 GWR estimation coefficient. The Anning River Basin, boasting a larger scale of construction land, exhibited larger GWR estimation coefficients compared to the Yalong River Basin and Dadu River Basin. In the Anning River Basin, factors such as ED_TOWN, PRE, ED_ROAD, SLOPE, TEM, and KD_CROPLAND demonstrated significant impacts. Similarly, in the Yalong River Basin, significant impacts were observed for SLOPE, ELEVATION, ED_TOWN, PRE, and KD_CROPLAND. In contrast, in the Dadu River Basin, relatively significant impacts were attributed to KD_CROPLAND, SLOPE, ED_TOWN, and ELEVATION.
In terms of geomorphic factors, SLOPE exerts a greater influence compared to ELEVATION and ASPECT. ELEVATION demonstrates a negative correlation with the kernel density of construction land in both the Anning River Basin and the Yalong River Basin. In regions characterized by lower elevations, the conditions are more favorable for the establishment of construction land. However, in the Dadu River Basin, this is manifested by a broader distribution of construction land around higher-altitude waterlogging basins. SLOPE exhibits a negative correlation with the distribution of construction land across all three watersheds, indicating that steeper slopes tend to limit the placement of construction land. Conversely, ASPECT demonstrates a positive correlation with construction land, with sunlit and semi-sunlit slopes being more attractive for construction land development.
The geological activity factor solely assesses the influence of ED_FAULT. The GWR analysis results indicate its relatively minor correlation with the arrangement of construction land. In the Yalong River Basin and Dadu River Basin, construction land tends to be situated in regions farther from faults. Conversely, in the Anning River Basin, the presence of a wide valley landform attributed to the Anning River fault reduces its sensitivity to the impact of the construction land layout.
Within the realm of climatic factors, precipitation and temperature exert divergent effects across the three river basins. In the Anning River Basin, precipitation exhibits a primarily positive correlation with the kernel density of construction land, while temperature demonstrates a predominantly negative correlation, emerging as the two pivotal natural factors with significant influence. Conversely, in the Yalong River Basin, both precipitation and temperature showcase positive correlations with the kernel density of construction land, with precipitation wielding a greater impact. Meanwhile, in the Dadu River Basin, precipitation showcases a negative correlation with the kernel density of construction land, whereas temperature displays a positive correlation, indicative of the inclination towards warmer conditions within high-altitude basins, sought after for human settlement environments. This nuanced interplay of climatic factors underscores the intricate relationship between environmental dynamics and the spatial distribution of construction land across diverse geographical terrains.
In terms of environmental factors related to rivers and vegetation, both ED_RIVER and NDVI exhibit predominantly negative correlations with the kernel density of construction land across the three river basins, with the exception of ED_RIVER in the Anning River Basin, which displays a positive correlation with the construction land kernel density. Regions with construction land tend to feature lower NDVI values and the proximity to rivers. However, in the Anning River Basin, the influence of major rivers on water sources for construction land is relatively mitigated due to the support of the water network system, thus weakening their control effect.
Concerning socio-economic factors, regions characterized by concentrated cropland, proximity to urban areas, and accessibility to roads exert a more pronounced influence on the distribution of construction land. The Anning River Basin and Dadu River Basin, where cropland is more densely concentrated, exhibit a greater impact on the distribution of construction land compared to the Yalong River Basin, where cropland is more dispersed. Moreover, the Anning River Basin and Dadu River Basin, situated adjacent to more surrounding towns, demonstrate a higher kernel density of construction land distribution in areas closer to these towns, in contrast to the Yalong River Basin. Construction land in areas proximate to the road network within the Anning River Basin and Yalong River Basin exhibits a wider distribution. However, in 1990, the Dadu River Basin experienced relatively poor accessibility of construction land to main roads.

3.2.2. Impact of Multiple Factors on Construction Land in 2020

By 2020, the GWR analysis results of the spatial pattern of construction land remained generally consistent with those of 1990, albeit with changes in the intensity and spatial impact range of certain factors (Figure 12). To effectively analyze the impact of various factors on the formation of the spatial pattern of construction land, the 2020 construction land and its 1 km buffer zone were utilized as statistical areas to discern differences in the roles of various factors across the three watersheds (Table 4 and Figure 12). In the Anning River Basin, alongside the heightened influence of natural factors such as precipitation, the spatial pattern of construction land continues to be strongly influenced by human factors. Conversely, in the Yalong River Basin and the Dadu River Basin, the impact of human factors has further intensified, with urban and road accessibility exerting particularly pronounced effects in the Dadu River Basin.
The impact of geomorphic factors on the distribution of construction land remains consistent with the overall trends observed in 1990. Elevation continues to exhibit a negative correlation with the kernel density of construction land across all three watersheds, although the strength of this effect has diminished compared to 1990. While the slope demonstrates a negative correlation with the kernel density of construction land in the Anning River Basin and Yalong River Basin, it displays a positive correlation in the Dadu River Basin. This suggests the expansion of construction land towards areas characterized by steeper slopes. The aspect exhibits a positive correlation with the kernel density of construction land in all three watersheds, with the distribution of construction land in the Dadu River Basin showcasing a greater sensitivity to aspect variations.
The influence of geological factors on construction land primarily centers around the Euclidean distance of faults. In the Anning River Basin and the Yalong River Basin, as construction land expands, its spatial correlation with faults and the platforms or negative topography resulting from their effects has intensified. Conversely, in the Dadu River Basin, characterized by fewer faults, construction land tends to steer clear of fault-related effects.
The influence of precipitation and temperature, among climate factors, has intensified in the Anning River Basin and Dadu River Basin, but has relatively weakened in the Yalong River Basin. In the Anning River Basin, the positive correlation between construction land distribution and precipitation has notably increased, while the negative correlation with temperature has decreased. Conversely, in the Yalong River Basin, the positive correlation between temperature and the distribution of construction land outweighs the positive correlation between precipitation and construction land. In the Dadu River Basin, both the negative correlation between precipitation and the distribution of construction land and the positive correlation between temperature and the distribution of construction land have experienced significant increases.
Among the river and vegetation factors, the water system of the Anning River Basin exhibits a strong correlation with construction land, followed by the Dadu River Basin. Conversely, the Yalong River Basin, characterized by deep-cut terrain and a reliance on spring water sources, displays a relatively weak correlation with rivers. Across all three river basins, there exists a negative correlation between the distribution of construction land and NDVI, indicating a comparatively low vegetation coverage in construction land and its surrounding areas. The strength of this relationship follows the order of the Anning River Basin, the Yalong River Basin, and the Dadu River Basin.
Among socio-economic factors, the influence of cropland in the Anning River Basin has relatively diminished, whereas its impact has intensified in the Yalong River Basin and Dadu River Basin. The town accessibility’s impact remains largely consistent in the Anning River Basin but has increased in the Yalong River Basin and Dadu River Basin, particularly in the latter. The road accessibility’s impact has decreased relatively in the Anning River Basin but has grown in significance in the Yalong River Basin and Dadu River Basin. Notably, in the Dadu River Basin, the distribution of construction land has expanded into areas not directly linked to main roads.

3.2.3. Impact of Multiple Factors on Construction Land from 1990 and 2020

From 1990 to 2020, all three river basins underwent varying degrees of land use change. While the Anning River Basin was primarily influenced by human factors, the Yalong River Basin and Dadu River Basin were predominantly shaped by natural factors (Table 5 and Figure 13). In the Anning River Basin, factors such as ED_ROAD, ED_TOWN, and KD_CROPLAND, and geomorphological factors exerted a significant impact on the changes in construction land. In the Yalong River Basin, significant influences stemmed from KD_GEOHAZARD, PRE, KD_CROPLAND, and ED_ROAD, among others. Meanwhile, in the Dadu River Basin, significant factors included PRE, ED_TOWN, SLOPE, TEM, ED_ROAD, and ED_RIVER.
Among the geomorphic factors, SLOPE has a more pronounced impact on the changes in construction land compared to ELEVATION and ASPECT, particularly evident in the Anning River Basin. Steeper slopes present a greater resistance to the expansion of construction land. In the Yalong River Basin, the slope exhibits a weak negative correlation with the expansion of construction land, whereas, in the Dadu River Basin, it shows a positive correlation, indicating land expansion in areas with slightly steeper slopes around the reservoir.
Among the geological activity factors, ED_FAULT shows no significant impact. However, changes in KD_GEOHAZARD are positively correlated with the expansion of construction land, indicating the influence of human construction activities on the geological environment, with the Yalong River Basin and Anning River Basin showing more pronounced effects.
In terms of climate factors, the changes in PRE and TEM from 1990 to 2020 exhibit a weak negative correlation with the expansion of construction land in the Anning River Basin, a positive correlation in the Yalong River Basin, and a negative correlation in the Dadu River Basin. This indirectly reflects the relative significance of climate change on construction land in high-altitude areas.
For the rivers and vegetation environmental factors, NDVI exhibits a negative correlation in all three watersheds, indicating a decrease in local vegetation coverage due to the expansion of construction land or the occurrence of construction land in areas with a reduced NDVI. ED_RIVER indicates that areas close to rivers provide more opportunities for construction land expansion, especially in the Anning River Basin. However, the overall impact of ED_RIVER is relatively weak.
Social economic factors exert a strong driving force on the expansion of construction land. The GWR analysis results of KD_CROPLAND indicate that, in the Anning River Basin and Dadu River Basin, construction land expands into areas where KD_CROPLAND has decreased, indicating a mutual conversion relationship between the two. Conversely, in the Yalong River Basin, there is a positive correlation between the density of construction land and changes in KD_CROPLAND. The GWR analysis results of ED_TOWN show that there is more expansion of construction land near towns in the Anning River Basin and Dadu River Basin, while the opposite is observed in the Yalong River Basin. Additionally, the GWR analysis results of ED_ROAD reveal that construction land expansion has occurred in areas relatively distant from roads in the Anning River Basin, whereas, in the Yalong River Basin and Dadu River Basin, the intensity of construction land expansion is higher in areas close to roads, particularly in the Dadu River Basin.

4. Discussion

4.1. Analysis of Spatiotemporal Change in Construction Land

4.1.1. Analysis of Temporal Changes in Construction Land

The development of construction land in Mianning County unfolds across three distinct stages, closely aligned with the county’s broader economic and social trajectory. From 1990 to 2000, construction land witnessed a rapid expansion, spurred by vibrant pillar industries such as livestock, poultry, mulberry, pepper, fruit cultivation, and building materials. During this period, the county’s population surged from 276,830 to 308,100, with a robust average annual GDP growth rate exceeding 20%. The subsequent period, spanning from 2000 to 2010, marked a sustained and accelerated growth in construction land. Mianning County diversified its economic base, fostering six key industries including rare earth mining, hydropower, building materials, tourism, livestock, poultry, and economic forestry. With an average annual population growth of 5500, the total population surged to 371,000, while the average annual growth rate of GDP value stood at 14%. Transitioning into the period from 2010 to 2020, the county’s development landscape evolved, integrating new drivers such as new urbanization and infrastructure construction alongside the established six pillar industries. This phase heralded a comprehensive development pattern, underpinned by a multi-industry approach. Despite a slight decrease in population growth to an average of 3700 annually, the total population reached 408,000, with the annual average growth rate of GDP maintained at 5–7%. Over the entire 1990–2020 period, the expansion of construction land primarily relied on the conversion of cropland, forestland, and grassland to construction land, notably emphasizing the conversion of cropland. This trend underscores the intimate relationship between construction land, cropland, and human activities, along with the favorable natural and human environmental conditions associated with these land types.

4.1.2. Analysis of Spatial Changes in Construction Land

When examining the expansion scale of construction land, it becomes evident that larger watersheds tend to exhibit a greater spatial expansion intensity. The Anning River Basin emerges as the primary area for construction land expansion, followed by the Yalong River Basin, and, finally, the Dadu River Basin. In terms of the proportion of the area covered by the three types of construction land expansion models, a clear hierarchy emerges, with the edge expansion mode occupying the largest proportion, followed by the leapfrog mode, and, lastly, the infilling mode. As construction land resources become increasingly scarce, there is a notable shift towards conservation and intensive growth strategies. This trend underscores the evolving approach of the Mianning County government in construction land planning, development, and governance, reflecting a commitment to sustainable land management practices and efficient resource utilization.
The edge expansion mode stands out as the predominant method for construction land expansion across various stages. Its prominence can be attributed to its effectiveness in addressing key issues such as continuity, convenience, economy, and efficiency in expanding construction land [93]. This mode leverages the existing built environment, transportation networks, and infrastructure, maximizing their utilization. Throughout different stages of overall land use planning and national territory spatial planning in Mianning County, the government has underscored the importance of strengthening the marginal expansion of construction land through policy guidance and planning control. Consequently, this expansion model plays a pivotal role in optimizing the spatial structure of land use and enhancing the overall land use efficiency.
The leapfrog mode represents a unique approach heavily influenced by the geological, geographical, and socio-economic factors prevalent in Mianning County. Particularly notable in the deep-cut valleys of the Yalong River and the Yele Mountain Lake basin area, where space suitable for the continuous expansion of construction land is limited, this mode arises as a response to challenges such as mineral development, hydropower generation, and ecological poverty alleviation. Centralized relocation and resettlement efforts are often employed to address these issues, giving rise to a typical leapfrog pattern. Similarly, in the Anning River Basin, driven by infrastructure projects such as highway and high-speed rail construction, water conservancy hub development, urban expansion, and industrial park expansion, the leapfrog expansion of construction land of varying scales has occurred. Notably, the leapfrog expansion scale in the Anning River Basin surpasses that of the Yalong River Basin and the Dadu River Basin. Overall, the leapfrog mode emerges as a distinctive strategy, tailored to the specific conditions and development needs of Mianning County, showcasing its adaptability in navigating complex socio-economic and environmental landscapes [94].
Infill expansion represents a localized construction land expansion model observed in specific areas of Mianning County. This model emerges primarily due to the acute scarcity of construction land resources in certain regions, presenting a unique approach to land consolidation, renewal, and development within existing construction land boundaries [95]. For instance, in older urban areas like Gaoyang Street, Ruoshui Town, and Lugu Town, idle or underutilized land has undergone revitalization and repurposing, thereby enhancing the urban functionality of these locales. Similarly, in areas such as Jinping, Jianmei, and He’ai, the effective development of inefficient urban land has been achieved through the integration and optimization of internal transportation networks and infrastructure. Moreover, in smaller villages experiencing population growth, there have been instances of newly developed internal areas enclosed by existing construction land, facilitating the efficient utilization of available resources. Overall, infill expansion serves as a strategic response to address the pressing need for land optimization and utilization in Mianning County, fostering sustainable urban development and maximizing the efficiency of construction land usage.

4.1.3. Analysis of Spatial Patterns of Construction Land

The emergence of the three distribution patterns of construction land—namely, the Wide Valley Spatial Pattern, Deep Valley Spatial Pattern, and High Mountain Lake Basin Spatial Pattern—is predominantly influenced by natural factors, with human modification and adaptation to the natural environment playing a significant role in shaping these patterns.
The Anning River Wide Valley Spatial Pattern is primarily shaped by a confluence of factors, including topography, natural resources, environmental conditions, socio-economic development, and policy planning and guidance. Influenced by the Anning River and its tributaries, the wide plain area facilitates ample space for construction land. With abundant water resources and fertile soil, this region fosters favorable conditions for agricultural production and residential settlement. Moreover, its pristine ecological environment and scenic landscapes attract a population influx and industrial clustering, contributing to the expansion of construction land. The well-developed transportation network in the plain area facilitates efficient logistics and human mobility, further enhancing its appeal for industrialization and urbanization. The concerted efforts of the governments of Liangshan Prefecture, Xichang City, and Mianning County have led to the formulation of comprehensive land development and utilization plans, along with supportive policies tailored to the Anning River Valley. These initiatives have played a pivotal role in shaping the spatial distribution pattern of construction land in the Anning River wide valley area.
The Deep Valley Spatial Pattern is heavily influenced by geological structures, landforms, cropland availability, and transportation accessibility. In areas adjacent to the riverbed of the deeply incised Yalong River, the terrain of river terraces or alluvial fans tends to be relatively flat, facilitating the construction of land corridors along the riverbanks and promoting material exchange. Additionally, these areas are conducive to agricultural irrigation, domestic water supply, and industrial activities, contributing to the centralized distribution of construction land. Meanwhile, construction land in other areas of the deep valley, such as Jinping, is predominantly located on the upper and middle terraces of the mountains, influenced by local residential customs and traditions. These areas are chosen for their natural advantages, as they are less susceptible to floods and geological hazards, and are close to water sources such as mountain springs and streams, facilitating domestic water usage and agricultural irrigation. Benefiting from favorable sunshine exposure conditions, high humidity, and fertile soil, these regions are suitable for agricultural development, with relatively abundant animal and plant resources available for utilization. Consequently, a typical pattern emerges, characterized by the concentrated settlement at the bottom of the valley and a dispersed layout on the upper and middle slopes.
The High Mountain Lake Basin Spatial Pattern is primarily shaped by a combination of factors, including topography, climate, cropland availability, engineering construction, and transportation accessibility. Geological tectonic movements and river-lake erosion contribute to the formation of a relatively flat terrain around the lake, accompanied by high-quality cropland resources. Furthermore, the elevated location of these areas enhances the sensitivity of temperature and precipitation to the ecological environment, resulting in favorable water–heat combinations and oxygen conditions in the Yele Lake Basin and its surroundings, making it highly conducive to human habitation. The development of the Yele Reservoir, initiated in 2001, and subsequent hydropower projects, coupled with supporting infrastructure and tourism development efforts, have played a significant role in shaping the distribution of construction land in this region. Over time, construction land has gradually concentrated around the edges of the lake basin or in relatively flat mountain valleys, forming a distribution pattern centered around the Yele Reservoir.

4.2. Analysis of the Causes of Changes in Construction Land

4.2.1. Geomorphic Factors

The layout and evolution of construction land in mountainous regions are significantly influenced by geomorphic factors such as elevation, slope, and aspect [77]. Among these factors, the slope exerts the most pronounced impact on the distribution and dynamic evolution of construction land, followed by elevation and aspect. This hierarchy stems from the direct influence of the slope on the stability and load-carrying capacity of construction land foundations. In contrast, the elevation and aspect play crucial roles in determining the types of land use and the efficiency of land utilization.

Slope Factor

The slope directly influences construction conditions [96]. In regions characterized by relatively flat macroscopic landforms, the layout and expansion of construction land predominantly occur in areas with smaller slopes, while areas with steeper slopes tend to have less construction land. For instance, in the Anning River Basin, construction land is primarily concentrated in areas with slopes of less than 25°, with newly expanded construction land between 1990 and 2020 mainly situated in areas with slopes of less than 6°. Similarly, in the Yalong River Basin, construction land is primarily found in areas with slopes of less than 35°, with newly expanded construction land between 1990 and 2020 predominantly located in areas with slopes of less than 22°. In the Dadu River Basin, construction land is distributed within a range of slopes of less than 30°, with newly expanded construction land mostly situated in areas with slopes of less than 20°.

Elevation Factor

The elevation plays a pivotal role in determining the type, scale, and efficiency of construction land [97]. It is negatively correlated with the overall kernel density of construction land. Differences in climate, soil, and location conditions across different elevations contribute to distinct characteristics. The Anning River Basin, situated at lower elevations, boasts a relatively flat terrain, fertile soil, a mild climate, and favorable location, rendering it conducive to the construction land layout. In contrast, the Yalong River and Dadu River basins, characterized by higher elevations, feature a more complex terrain, variable climate, fragile ecology, and less convenient transportation, thereby increasing the cost of construction land. The main distribution range of construction land in the Anning River Basin typically spans between 1600 and 2200 m, while, in the Yalong River Basin, it ranges from 1500 to 2500 m, and, in the Dadu River Basin, it lies between 2600 and 3000 m. Notably, from 1990 to 2020, there was a trend of construction land expansion towards lower altitude areas in all three basins.

Aspect Factor

In mountainous regions, the aspect plays a role in the evolution process of mountain slope micro-topography, indirectly influencing the layout and evolution of construction land [98]. However, compared to the slope and elevation, the influence of the aspect in the research area is relatively minor. This is primarily due to the strong correlation between buildings or structures and slope direction. In mountainous areas, construction land with smaller spatial scales is distributed across all slope directions. More than half of the construction land in the Yalong River Basin and Dadu River Basin is situated on shady slopes, while, in the Anning River Basin, it predominantly occupies sunny slopes and flat lands. This distribution pattern reflects the limited availability of construction land resources and the complexity involved in selecting slope directions. From 1990 to 2020, the newly expanded construction land in the three watersheds predominantly favored sunnier areas. This trend underscores the ongoing competition for construction land resources and the strategic consideration of maximizing sunlight exposure for various purposes.

4.2.2. Geological Activities Factors

The influence of geological activities on the spatial distribution pattern and evolution of construction land is multifaceted, often exerting a comprehensive impact through geological structures, stratigraphic lithology, and geological disasters [99].

Fault Factor

Faults play a significant role in shaping the layout of construction land, affecting the foundation stability, earthquake risk, groundwater movement, building design and construction, and land use safety. Consequently, there is a tendency for construction land to be situated away from faults [100].
However, due to the limited availability of land resources in mountainous areas, construction land often needs to be located in relatively favorable positions near faults. The maximum impact distance of faults on construction land in the Anning River Basin is approximately 8 km, with an average impact distance of about 2 km. In the Yalong River Basin, the maximum impact distance is around 3 km, with an average impact distance of about 1 km. Similarly, in the Dadu River Basin, the maximum impact distance is about 7 km, with an average impact distance of approximately 2.4 km.
Initially, in 1990, the impact of faults on the layout of construction land was relatively small. However, by 2020, as the demand for construction land increased, construction land inevitably encroached closer to fault areas, leading to a gradual increase in the correlation between construction land and the Euclidean distance between faults. This trend is particularly pronounced in the Anning River Basin, where construction land expansion has been significant, followed by the Dadu River Basin, and, finally, the Yalong River Basin, where the expansion of construction land is greatly influenced by landforms.

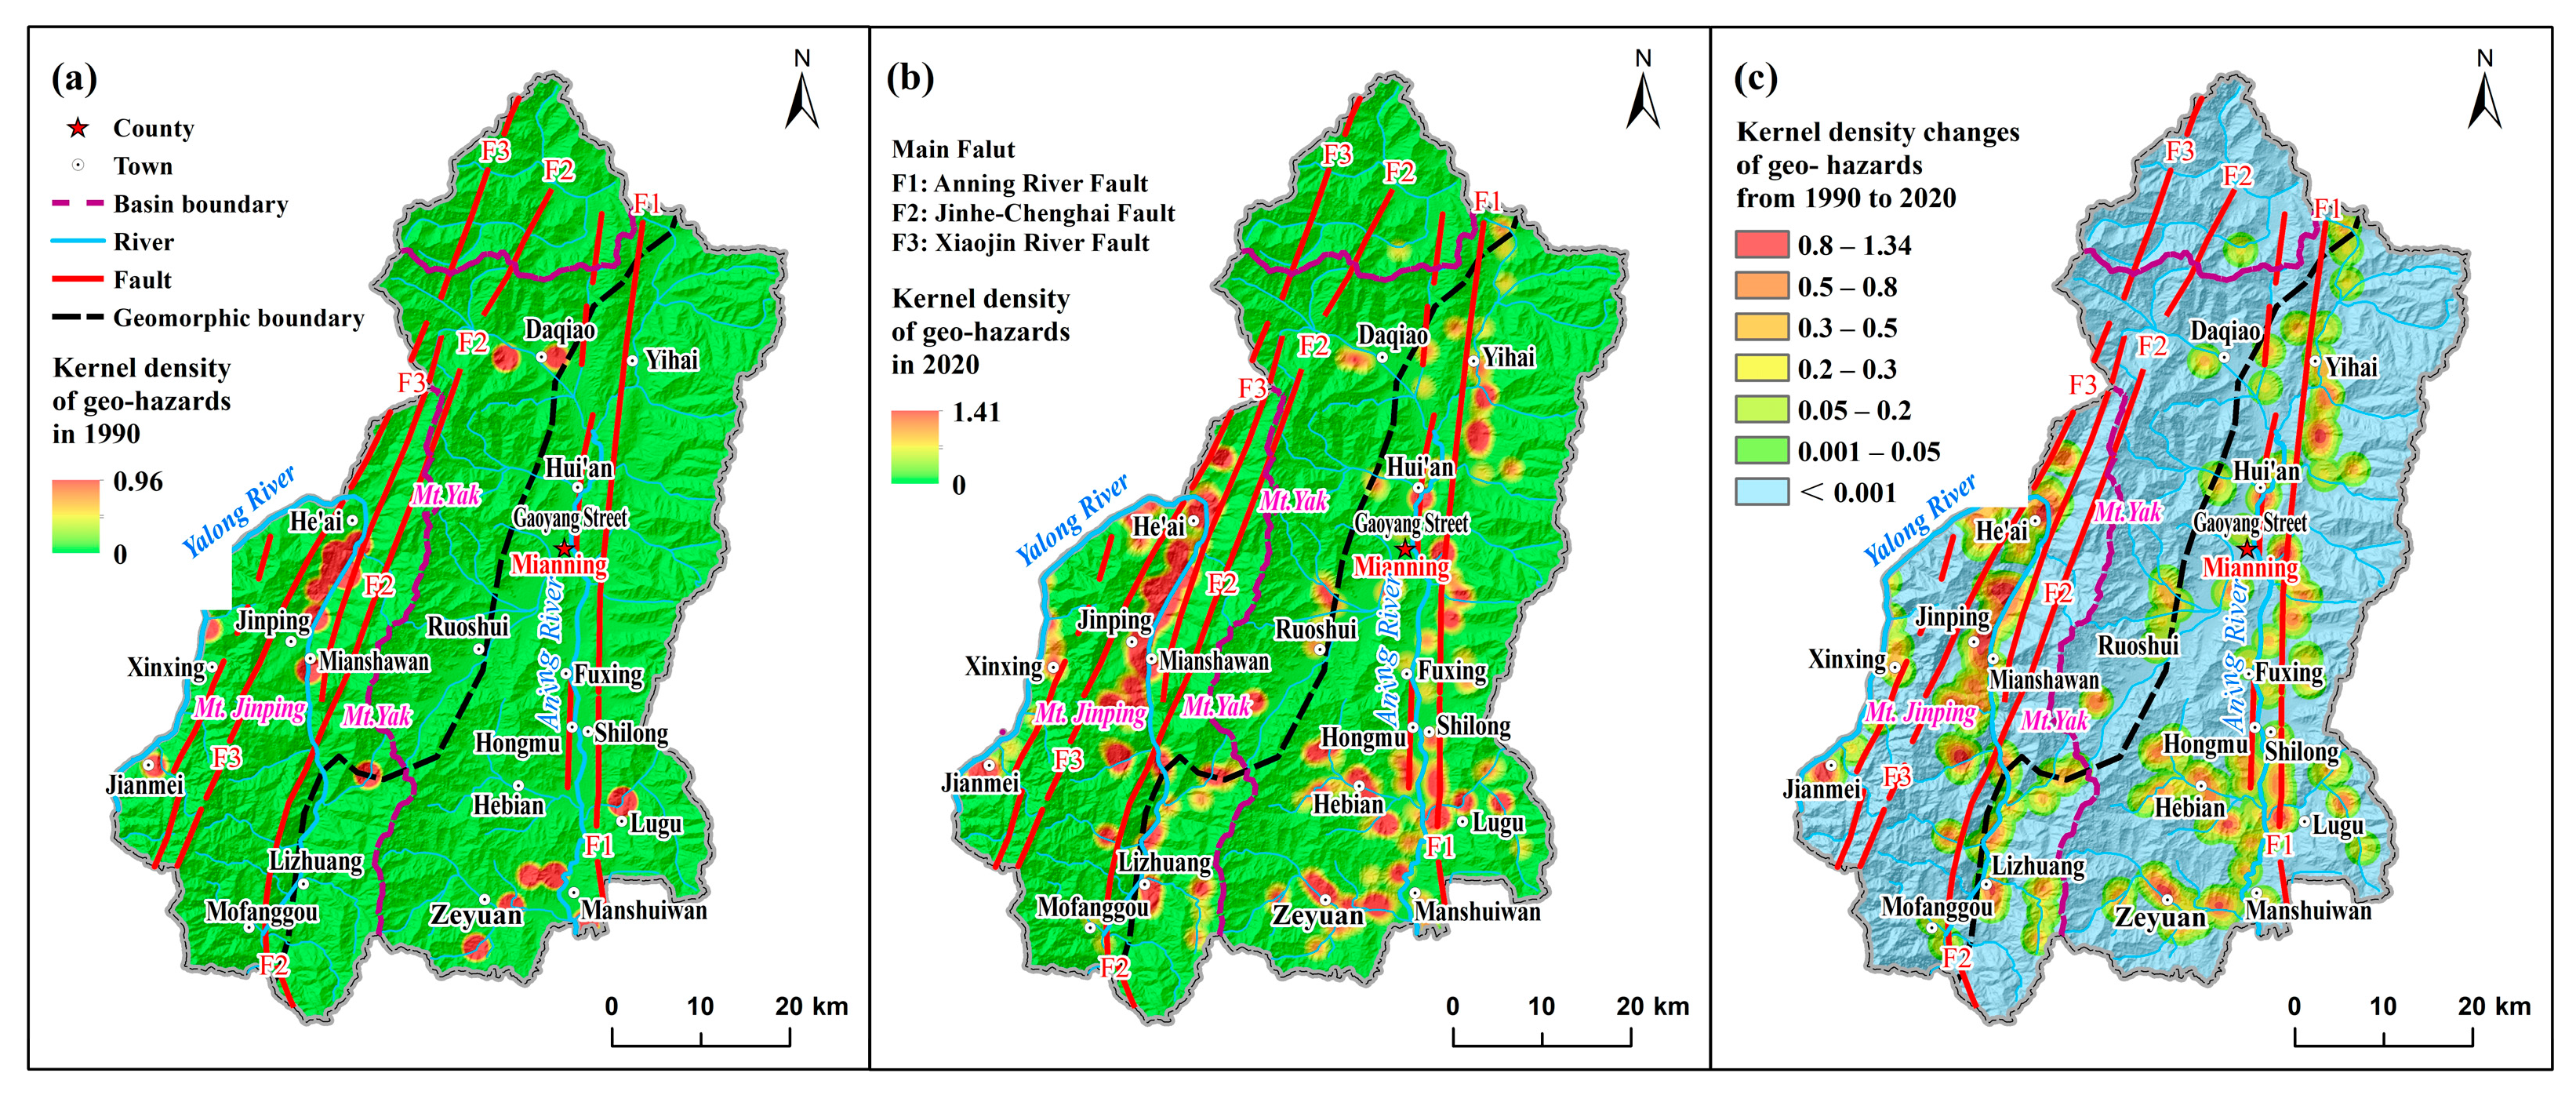
Geological Disaster Factor

Geological disasters are among the most prevalent natural calamities in mountainous regions, often resulting in significant casualties and economic losses [101]. The overall spatial pattern of land use, particularly construction land, is highly susceptible to the adverse effects of geological disasters [102].
As of 2020, Mianning County has experienced over 180 geological disasters, encompassing every town, including debris flows, landslides, and collapses. These disasters are predominantly concentrated along fault lines such as the Xiaojin River Fault, the Jinhe–Chenghai Fault, the Anning River Fault, and the Yalong River, among others.
From 1990 to 2020, the kernel density of geological disasters increased by 0.27 in the Yalong River Basin, by 0.11 in the Anning River Basin, and by 0.01 in the Dadu River Basin. The kernel density of construction land in these basins exhibited a positive correlation with the kernel density of geological hazards, as evidenced by the GWR estimated coefficients: 0.1634 in the Yalong River Basin, 0.1437 in the Anning River Basin, and 0.0666 in the Dadu River Basin.
This strong spatial overlap between construction land and geological disasters underscores the disruption of the geological environment due to human activities, including construction endeavors. Geological disasters not only jeopardize the safety of construction land sites but also impede the road accessibility between construction lands, particularly in areas like Jinping, Mianshawan, and He’ai, where the Yalong River has carved deep valleys.
While efforts to prevent and control geological disasters have made considerable strides, continued monitoring and mitigation measures are imperative, especially in the face of changing climate conditions [103]. Optimizing the layout and intensity of construction land in the future will remain crucial for mitigating geological disaster risks and ensuring sustainable development.

4.2.3. Climatic Factors

Climatic factors primarily influence agricultural production by integrating precipitation and temperature, thereby shaping the layout of construction land. Additionally, climate impacts the human settlement environment, indirectly influencing residents’ selection of construction land sites [104]. Over the period of 1990 to 2020, Mianning County has experienced two overarching trends—a decrease in precipitation and an increase in temperature—aligning with climate changes observed on the eastern edge of the Tibetan Plateau [105]. Notably, changes in precipitation have a more pronounced impact on the expansion of construction land compared to changes in temperature, likely due to precipitation’s influence on agricultural production and the occurrence of geological disasters [106].
In the Anning River Basin, the precipitation was 897 mm with an average annual temperature of 12.06 °C in 1990. By 2020, precipitation decreased to 879 mm, while the average annual temperature rose to 12.77 °C. Over this period, precipitation decreased by 18 mm, while the temperature increased by 0.71 °C. Climatic factors exert a substantial influence on the construction land pattern in this basin, although the impact of climate change on the expansion of construction land is relatively mitigated by human activities.
Conversely, the Yalong River Basin experienced a decrease in precipitation from 865 mm and an average annual temperature of 11.50 °C in 1990 to 822 mm and 12.41 °C, respectively, in 2020. Here, precipitation decreased by 43 mm, and the temperature increased by 0.91 °C. While climatic factors have a lesser impact on the construction land pattern in this basin, the deep incision of the landform diminishes the influence of climate on construction land expansion.
In the Dadu River Basin, the precipitation decreased from 887 mm with an average annual temperature of 7.48 °C in 1990 to 881 mm and 8.49 °C, respectively, in 2020. During this period, precipitation decreased by 6 mm, while the temperature increased by 1.01 °C. Climatic factors wield a substantial influence on the construction land pattern in this basin. Furthermore, climate change significantly impacts the expansion of construction land due to the heightened climate sensitivity resulting from the high altitude, akin to the socio-economic environment’s response to climate change in the high-altitude areas of the Himalayas [107].

4.2.4. River and Vegetation Environmental Factors

River Environmental Factor

As shapers of the landscape environment, rivers serve as vital suppliers of water resources [108] and contribute to the water environment [109]. Rivers play a crucial role in determining the location and development of construction land, with areas in close proximity to rivers offering greater development conveniences [110,111].
The expansion of construction land in Mianning County from 1990 to 2020 demonstrates a trend towards the closer proximity to rivers. In the Anning River Basin, the density of construction land was positively correlated with the Euclidean distance from the river in 1990, reflecting the risks of flooding in areas near the river, conflicts with cropland development, and challenges in infrastructure construction. The average distance between construction land and the river was approximately 1282 m.
However, with the completion of the Daqiao Reservoir in 1999 for power generation and the improved management of the Anning River, alongside enhancements in riverside infrastructure construction, the average distance between the newly expanded construction land and the river decreased to 870 m from 1990 to 2020. Consequently, the density of construction land and the Euclidean distance from the river exhibited a negative relationship.
In the Dadu River Basin, the layout of construction land and its changes were negatively correlated with the Euclidean distance from the river. In 1990, the average Euclidean distance between construction land and the river in this basin was 1221 m. However, since the construction of the Yele Reservoir in 1998, leading to rising water levels in reservoirs and rivers, the average distance between construction land and rivers or reservoirs has decreased by approximately 300–500 m by 2020.
In the Yalong River Basin, the average Euclidean distance between construction land and the river was 1363 m in 1990. The average distance between the expanded construction land and the river from 1990 to 2020 was reduced to 1181 m. The river’s sensitivity to the layout and changes in construction land is relatively low in this area, primarily because construction land is predominantly distributed in limited spaces on both sides of the Yalong River Valley.

Vegetation Environmental Factor

The vegetation environment plays a crucial role in influencing construction land. Robust vegetation offers stable ecological services, providing a favorable ecological background for construction land [112]. Conversely, vegetation degradation can result in issues such as soil erosion, reduced biodiversity, and diminished agricultural productivity, thereby complicating the development and utilization of construction land. Through the implementation of key ecological projects, increased support for ecological initiatives, reinforced soil and water conservation efforts, promotion of comprehensive soil erosion management, and intensified ecological forestry construction, Mianning County has witnessed significant improvements in its vegetation environment [113,114].
Using NDVI as an indicator of the vegetation environment, Mianning County experienced varying degrees of improvement in vegetation cover in areas designated for construction land from 1990 to 2020 [115]. The NDVI increased by 0.12 in the Anning River Basin, 0.18 in the Yalong River Basin, and 0.01 in the Dadu River Basin, providing a relatively favorable ecological backdrop for construction land. However, due to construction activities leading to the conversion of other land types with relatively high NDVI values to construction land, NDVI is negatively correlated with construction land density in all three watersheds, indicating the relatively low vegetation coverage of construction land and its surrounding areas.
Furthermore, the expansion of construction land contributes to a decline in NDVI. This impact is most pronounced in the Anning River Basin, where the construction land density and the intensity of change are highest, while relatively less significant in the Yalong River Basin and Dadu River Basin.

4.2.5. Socio-Economic Factors

Socio-economic factors play a pivotal role in driving the dynamic evolution of land use and are closely intertwined with human factors in the distribution and evolution of construction land [24,116]. In the Anning River Basin, socio-economic factors contributed to 46% of the impact on land use spatial distribution in 1990. However, due to the heightened influence of climate factors, this overall impact decreased to 31% by 2020. Over the period spanning from 1990 to 2020, socio-economic factors accounted for approximately 50% of the overall impact on construction land expansion, a proportion roughly equivalent to that of natural factors.
Similarly, in the Yalong River Basin, socio-economic factors exerted an impact of approximately 32% on the land use spatial distribution in both 1990 and 2020, as well as on construction land expansion during the same period, reflecting a relatively stable pattern of human activity throughout this timeframe. Conversely, in the Dadu River Basin, socio-economic factors influenced the land use spatial distribution to a degree of around 35% in 1990. However, owing to factors such as engineering construction and infrastructure enhancement, this impact increased to 39% by 2020. In the expansion of construction land from 1990 to 2020, socio-economic factors accounted for about 29% of the overall impact, indicating a stronger influence of natural factors in this context.

Cropland Factor

Construction land and cropland share similar location and environmental requirements, characterized by a high spatial adjacency and a reliance on land type conversion [117]. In both 1990 and 2020, there existed a positive correlation between the density of construction land and cropland in Mianning County. However, the strength of this correlation weakened in the Anning River Basin, while increasing in the Yalong River Basin and Dadu River Basin from 1990 to 2020.
Over the same period, the expansion of construction land in the Anning River Basin resulted in a significant reduction in cropland, particularly in areas near rivers, towns, industrial parks, and transportation arteries. Similarly, in the Dadu River Basin, the expansion of construction land led to a slight decrease in cropland from 1990 to 2020, primarily occurring in the vicinity of the Yele Reservoir. Conversely, in the Yalong River Basin, there was a positive correlation between changes in construction land and cropland from 1990 to 2020, reflecting two distinct trends.
Firstly, the enhancement of local cropland in the Yalong River Basin contributed to an increase in cropland, while the expansion of construction land resulted from the conversion of non-cropland areas. Secondly, certain areas in the Yalong River Basin underwent a conversion from farmland to forests, accompanied by the withdrawal of construction land [118].

Town Accessibility Factor

The accessibility between administrative centers such as counties, towns, and townships can be utilized to gauge the clustering characteristics of human activities or population data [119]. The distance from the administrative center, to a certain extent, reflects the extent of the jurisdiction and socio-economic influence, directly influencing the distribution pattern of construction land. Moreover, this distance affects the speed and direction of the construction land expansion.
In Mianning County, the residences of town governments, along with the surrounding construction land, naturally emerge in areas with relatively favorable local transportation conditions. The average Euclidean distance between construction land and towns is approximately 21 km in the Anning River Basin, 25 km in the Yalong River Basin, and 27 km in the Dadu River Basin. The impact of accessibility to towns on the distribution and changes of construction land follows this order: Anning River Basin > Dadu River Basin > Yalong River Basin.

Road Accessibility Factor

Road accessibility significantly influences land use types, patterns, and values, and the economic and social environment derived from land use [120]. The road network plays a crucial role in shaping the distribution pattern and evolution of construction land, with the impact gradually diminishing as the distance from the road increases.
Mianning County has developed a comprehensive transportation system comprising highways, railways, and aviation, positioning itself to integrate into the Chengdu 2-h transportation circle in the future. Main roads in the research area, such as the G5 Beijing Kunming Expressway, National Highway G108, and National Highway G248, typically feature a concentrated construction land distribution. These areas boast convenient transportation, fostering the aggregation of economic activities and population flow. As influenced by land use planning and construction, the road network continues to enhance, infrastructure support strengthens, investment and population gather, construction land expands, and the structure and function of construction land optimize accordingly.
In the Anning River Basin, the impact of roads on the construction land layout decreased from 1990 to 2020, with the increase in road density supporting the construction land expansion. Conversely, in the Yalong River Basin, the impact of roads on the construction land spatial distribution increased during the same period, with new construction land concentrated in areas closer to roads. In the Dadu River Basin, the Euclidean distance of roads correlates positively with construction land density in 1990 and 2020, indicating construction land distributed at a certain distance from the main road, while the expansion from 1990 to 2020 occurred closer to roads.

4.3. Implications and Limitations

4.3.1. Implications

Construction land distribution in Mianning County is intricately influenced by natural and human factors. Geological and climatic conditions along the eastern Qinghai–Tibet Plateau drive variations in land use across the Anning, Yalong, and Dadu River basins. Considering the national territory spatial planning of Mianning County, customized development strategies are essential, taking into consideration the distinctive characteristics of each basin. Efficient land use in the Anning River Basin is paramount, while stricter controls are needed for the environmentally sensitive Yalong and Dadu River Basins. These strategies aim to promote sustainable development while preserving local ecosystems.
The Anning River Basin, pivotal for industry and agriculture, must address climate change and balance urban–rural development. Guided urban and rural planning is crucial for resource allocation and infrastructure development. The strategic expansion of construction land should target key areas like urban centers and industrial parks, ensuring economic growth while protecting the environment.
The Yalong River Basin, rich in hydropower and tourism resources, faces challenges due to its topography. Organic growth in favorable areas like Jinping is advisable, while stricter controls are needed in less favorable regions. Centralized construction zones and relocation initiatives can optimize resource use and mitigate environmental impacts.
The Dadu River Basin, prone to geological disasters, requires proactive measures for climate adaptation and disaster prevention. Sustainable development, focusing on ecotourism and hydropower, is recommended. The development around the Yele Reservoir scenic area aligns with ecotourism principles, enhancing resilience to climate change and promoting harmony with nature.

4.3.2. Limitations

This article employs Landsat data for extracting construction land information. However, due to the spatial resolution limitation of 30 m, finer details, such as roads in deep valleys and scattered residential areas, may not be adequately captured. Consequently, the spatial distribution and changes in construction land may not have reached a refined level. To enhance future research, it is suggested that we integrate high spatial resolution satellite remote sensing and UAV technology.
The spatial pattern and dynamic changes in construction land are influenced by various factors. While this article considers 12 factors, the selection and quantification of human factors could be refined. For instance, factors like construction land location customs and policies are challenging to quantify, and the regional and hierarchical nature of the economic impact may be difficult to accurately characterize. Future research could delve deeper into the influence of the regional geological background on the eastern edge of the Tibetan Plateau, comprehensively consider the response and adaptation of construction land changes driven by multiple factors such as climate change and the regional economy, and explore a synergistic model of the human–land coupling system in the landscape transition zone.

5. Conclusions

This study delves into the spatiotemporal evolution characteristics of construction land in Mianning County, situated on the eastern edge of the Qinghai–Tibet Plateau. Employing methodologies such as the landscape expansion index, geographic information system spatial analysis, and geographically weighted regression analysis, it delves into the causes behind the spatial distribution and changes in construction land. Here are the key findings:
The unique geological and climatic conditions on the eastern edge of the Qinghai–Tibet Plateau create a foundation for environmental gradients. These gradients play a crucial role in determining the distribution and evolution of construction land in the Anning River, Yalong River, and Dadu River basins at a macro level. Influenced by the region’s resources and environment, the distribution and expansion of construction land in Mianning County have manifested into three typical spatial patterns: the Wide Valley Spatial Pattern, Deep Valley Spatial Pattern, and High Mountain Lake Basin Spatial Pattern. The development of construction land in Mianning County can be categorized into three stages: 1990–2000, 2000–2010, and 2010–2020. These stages align with the broader national economic and social development trends of the county, catering to the spatial growth requirements for both production and daily life through the allocation of construction land resources. The predominant expansion mode of construction land in the study area is edge expansion, supplemented by the leapfrog and infilling modes. Over the period of 1990 to 2020, all three river basins witnessed varying degrees of land use change. While human factors primarily drove the changes in the Anning River Basin, natural factors played a more significant role in the Yalong River Basin and Dadu River Basin.
These conclusions shed light on the intricate interplay between geological, climatic, and anthropogenic factors in shaping the spatiotemporal dynamics of construction land in Mianning County, offering valuable insights for sustainable land management practices in similar regions.

Author Contributions

Y.Z. (Yinbing Zhao) wrote the paper with contributions from all co-authors. Z.N. conceived and designed the research. Y.Z. (Yang Zhang) contributed to the methodology. P.W., C.G., W.Y. and Y.L. contributed to the data processing. Z.L. contributed to the geological hazard data. All authors have read and agreed to the published version of the manuscript.

Funding

This research was supported by the Open Foundation of the State Key Laboratory of Urban and Regional Ecology of China (SKLURE2022-2-6), the China Geological Survey Project (DD20190542), and the Key Laboratory of Supported by Open Foundation of the Research Center for Human Geography of Tibetan Plateau and Its Eastern Edge (Chengdu University of Technology) (RWDL2022-ZD002 and RWDL2021-ZD002).

Data Availability Statement

The data presented in this study are available upon request from the author. However, land use data and geological hazard data are excluded due to the lack of authorization from the cooperating party.

Conflicts of Interest

The authors declare no conflicts of interest.

References

  1. Yang, H.; Xu, Y.; Zhou, K.; Wang, L.J.; Xu, L. Evaluation of suitability, adaptability, and reserve potential of construction land on the Qinghai-Tibet Plateau. J. Geogr. Sci. 2024, 34, 41–61. [Google Scholar] [CrossRef]
  2. Cai, E.X.; Liu, Y.L.; Li, J.W.; Chen, W.Q. Spatiotemporal Characteristics of Urban-Rural Construction Land Transition and Rural-Urban Migrants in Rapid-Urbanization Areas of Central China. J. Urban Plan. Dev. 2020, 146, 05019023. [Google Scholar] [CrossRef]
  3. Zhou, Y.; Liu, N.; Yu, R. Analysis of remote sensing monitoring methods for construction land at home and abroad. IOP Conf. Ser. Earth Environ. Sci. 2021, 783, 012127. [Google Scholar] [CrossRef]
  4. Zhang, Z.; Liu, F.; Zhao, X.; Wang, X.; Shi, L.; Xu, J.; Yu, S.; Wen, Q.; Zuo, L.; Yi, L.; et al. Urban Expansion in China Based on Remote Sensing Technology: A Review. Chin. Geogr. Sci. 2018, 28, 727–743. [Google Scholar] [CrossRef]
  5. Bera, D.; Chatterjee, N.D.; Ghosh, S.; Dinda, S.; Bera, S. Recent trends of land surface temperature in relation to the influencing factors using Google Earth Engine platform and time series products in megacities of India. J. Clean. Prod. 2022, 379, 134735. [Google Scholar] [CrossRef]
  6. Wang, J.; Lin, Y.; Glendinning, A.; Xu, Y. Land-use changes and land policies evolution in China’s urbanization processes. Land Use Policy 2018, 75, 375–387. [Google Scholar] [CrossRef]
  7. Pissourios, I.A. Survey methodologies of urban land uses: An oddment of the past, or a gap in contemporary planning theory? Land Use Policy 2019, 83, 403–411. [Google Scholar] [CrossRef]
  8. Liao, K.H.; Huang, W.Y.; Wang, C.J.; Wu, R.; Hu, Y. Spatio-Temporal Evolution Features and Impact Factors of Urban Expansion in Underdeveloped Cities: A Case Study of Nanchang, China. Land 2022, 11, 1799. [Google Scholar] [CrossRef]
  9. Blakime, T.-H.; Adjonou, K.; Komi, K.; Hlovor, A.K.D.; Gbafa, K.S.; Zoungrana, J.-B.B.; Polorigni, B.; Kokou, K. Dynamics of Built-Up Areas and Challenges of Planning and Development of Urban Zone of Greater Lomé in Togo, West Africa. Land 2024, 13, 84. [Google Scholar] [CrossRef]
  10. Huang, D.Q.; Lang, Y.; Liu, T. The Evolving Structure of Rural Construction Land in Urbanizing China: Case Study of Tai’an Prefecture. Land. 2021, 10, 65. [Google Scholar] [CrossRef]
  11. Dong, L.; Li, X. Evolution of Urban Construction Land Structure Based on Information Entropy and Shift-Share Model: An Empirical Study on Beijing-Tianjin-Hebei Urban Agglomeration in China. Sustainability 2022, 14, 1244. [Google Scholar] [CrossRef]
  12. Kuemmerle, T.; Erb, K.; Meyfroidt, P.; Müller, D.; Verburg, P.H.; Estel, S.; Haberl, H.; Hostert, P.; Jepsen, M.R.; Kastner, T.; et al. Challenges and opportunities in mapping land use intensity gIobally. Curr. Opin. Environ. Sustain. 2013, 5, 484–493. [Google Scholar] [CrossRef] [PubMed]
  13. Canelas, J.V.; Pereira, H.M. Impacts of land-use intensity on ecosystems stability. Ecol. Model. 2022, 472, 110093. [Google Scholar] [CrossRef]
  14. Yu, M.; Chen, Z.; Long, Y.; Mansury, Y. Urbanization, land conversion, and arable land in Chinese cities: The ripple effects of high-speed rail. Appl. Geogr. 2022, 146, 102756. [Google Scholar] [CrossRef]
  15. Li, Z.; Luan, W.; Zhang, Z.; Su, M. Relationship between urban construction land expansion and population/economic growth in Liaoning Province, China. Land Use Policy 2020, 99, 105022. [Google Scholar] [CrossRef]
  16. Marantz, N.J.; Lewis, P.G. Jurisdictional Size and Residential Development: Are Large-Scale Local Governments More Receptive to Multifamily Housing? Urban Aff. Rev. 2021, 58, 732–766. [Google Scholar] [CrossRef]
  17. Liu, Y.; Zhang, Z.; Zhou, Y. Efficiency of construction land allocation in China: An econometric analysis of panel data. Land Use Policy 2018, 74, 261–272. [Google Scholar] [CrossRef]
  18. Xu, G.; Yin, X.; Wu, G.; Gao, N. Rethinking the Contribution of Land Element to Urban Economic Growth: Evidence from 30 Provinces in China. Land 2022, 11, 801. [Google Scholar] [CrossRef]
  19. Allan, A.; Soltani, A.; Abdi, M.H.; Zarei, M. Driving Forces behind Land Use and Land Cover Change: A Systematic and Bibliometric Review. Land 2022, 11, 1222. [Google Scholar] [CrossRef]
  20. Harik, G.; Alameddine, I.; Zurayk, R.; El-Fadel, M. Uncertainty in forecasting land cover land use at a watershed scale: Towards enhanced sustainable land management. Ecol. Model. 2023, 486, 110515. [Google Scholar] [CrossRef]
  21. Mitsuda, Y.; Ito, S. A review of spatial-explicit factors determining spatial distribution of land use/land-use change. Landsc. Ecol. Eng. 2011, 7, 117–125. [Google Scholar] [CrossRef]
  22. Yuan, X.; Wang, C.; Li, B.; Wang, W.; Chen, N. Review of the Driving Forces and Impacts of Land Use/Cover Change in the Yangtze River Basin. Geomat. Inf. Sci. Wuhan Univ. 2023, 48, 1241–1255. [Google Scholar]
  23. Irwin, E.G.; Bockstael, N.E. The evolution of urban sprawl: Evidence of spatial heterogeneity and increasing land fragmentation. Proc. Natl. Acad. Sci. USA 2007, 104, 20672–20677. [Google Scholar] [CrossRef]
  24. Wang, Y.M.; Deng, Q.C.; Yang, H.Q.; Liu, H.; Yang, F.; Zhao, Y.K. Spatial-temporal differentiation and influencing factors of rural settlements in mountainous areas: An example of Liangshan Yi Autonomous Prefecture, Southwestern China. J. Mt. Sci. 2024, 21, 218–235. [Google Scholar] [CrossRef]
  25. Zhang, Z.; Gong, J.; Li, J.; Yang, J.; Chen, G.; Ren, Y.; Plaza, A. Comparative study of construction land development suitability assessment: Insights from multiple models and driving forces. Environ. Impact Assess. Rev. 2024, 107, 107574. [Google Scholar] [CrossRef]
  26. Schneider, A.; Friedl, M.A.; Potere, D. A new map of global urban extent from MODIS satellite data. Environ. Res. Lett. 2009, 4, 044003. [Google Scholar] [CrossRef]
  27. Wang, Z.B.; Fang, C.L.; Zhang, X.R. Spatial expansion and potential of construction land use in the Yangtze River Delta. J. Geogr. Sci. 2015, 25, 851–864. [Google Scholar] [CrossRef]
  28. Lee, S.; Ryu, J.-H.; Kim, I.-S. Landslide susceptibility analysis and its verification using likelihood ratio, logistic regression, and artificial neural network models: Case study of Youngin, Korea. Landslides 2007, 4, 327–338. [Google Scholar] [CrossRef]
  29. Zhang, H.X.; Zhao, X.J.; Ren, J.; Hai, W.J.; Guo, J.; Li, C.Y.; Gao, Y.P. Research on the Slope Gradient Effect and Driving Factors of Construction Land in Urban Agglomerations in the Upper Yellow River: A Case Study of the Lanzhou-Xining Urban Agglomerations. Land 2023, 12, 745. [Google Scholar] [CrossRef]
  30. Antrop, M. Landscape change and the urbanization process in Europe. Landsc. Urban Plan. 2004, 67, 9–26. [Google Scholar] [CrossRef]
  31. Xu, Y.; Zhao, S.; Fan, J. Urban planning construction land standard and its revision based on climate and topography in China. J. Geogr. Sci. 2021, 31, 603–620. [Google Scholar] [CrossRef]
  32. Hussain, A.; Cao, J.; Hussain, I.; Begum, S.; Akhtar, M.; Wu, X.; Guan, Y.; Zhou, J. Observed Trends and Variability of Temperature and Precipitation and Their Global Teleconnections in the Upper Indus Basin, Hindukush-Karakoram-Himalaya. Atmosphere 2021, 12, 973. [Google Scholar] [CrossRef]
  33. Feng, C.; Zhang, N.; Habiyakare, T.; Yan, Y.; Zhang, H. Prospects of eco-hydrological model for sponge city construction. Ecosyst. Health Sustain. 2021, 7, 1994885. [Google Scholar] [CrossRef]
  34. Danso, G.K.; Takyi, S.A.; Amponsah, O.; Yeboah, A.S.; Owusu, R.O. Exploring the effects of rapid urbanization on wetlands: Insights from the Greater Accra Metropolitan Area, Ghana. SN Soc. Sci. 2021, 1, 212. [Google Scholar] [CrossRef]
  35. Xia, C.Y.; Li, Y.; Ye, Y.M.; Shi, Z. An Integrated Approach to Explore the Relationship Among Economic, Construction Land Use, and Ecology Subsystems in Zhejiang Province, China. Sustainability 2016, 8, 498. [Google Scholar] [CrossRef]
  36. Kim, Y.; Newman, G.; Güneralp, B. A Review of Driving Factors, Scenarios, and Topics in Urban Land Change Models. Land 2020, 9, 246. [Google Scholar] [CrossRef] [PubMed]
  37. Galvao, R.F.P.; Urushima, A.Y.F.; Hara, S.; De Jong, W. Analysis of Land Transition Features and Mechanisms in Peripheral Areas of Kyoto (1950–1960). Sustainability 2020, 12, 4502. [Google Scholar] [CrossRef]
  38. Mahtta, R.; Fragkias, M.; Güneralp, B.; Mahendra, A.; Reba, M.; Wentz, E.A.; Seto, K.C. Urban land expansion: The role of population and economic growth for 300+ cities. npj Urban Sustain. 2022, 2, 5. [Google Scholar] [CrossRef]
  39. Zhao, S.X.; Yin, M.M. Change of urban and rural construction land and driving factors of arable land occupation. PLoS ONE 2023, 18, e0286248. [Google Scholar] [CrossRef]
  40. Yussif, K.; Dompreh, E.B.; Gasparatos, A. Sustainability of urban expansion in Africa: A systematic literature review using the Drivers–Pressures–State–Impact–Responses (DPSIR) framework. Sustain. Sci. 2023, 18, 1459–1479. [Google Scholar] [CrossRef]
  41. Boillat, S.; Scarpa, F.M.; Robson, J.P.; Gasparri, I.; Aide, T.M.; Aguiar, A.P.D.; Anderson, L.O.; Batistella, M.; Fonseca, M.G.; Futemma, C.; et al. Land system science in Latin America: Challenges and perspectives. Curr. Opin. Environ. Sustain. 2017, 26–27, 37–46. [Google Scholar] [CrossRef]
  42. Dong, O.Y.; Zhu, X.G.; Liu, X.G.; He, R.F.; Wan, Q. Spatial Differentiation and Driving Factor Analysis of Urban Construction Land Change in County-Level City of Guangxi, China. Land 2021, 10, 691. [Google Scholar] [CrossRef]
  43. Zheng, Q.; Wang, K.; Huang, L.Y.; Zheng, Q.M.; Abubakar, G.A. Monitoring the Different Types of Urban Construction Land Expansion (UCLE) in China’s Port City: A Case Study of Ningbo’s Central City. Sustainability 2017, 9, 2374. [Google Scholar] [CrossRef]
  44. Waddell, P. UrbanSim: Modeling Urban Development for Land Use, Transportation, and Environmental Planning. J. Am. Plan. Assoc. 2002, 68, 297–314. [Google Scholar] [CrossRef]
  45. Hong, W.Y.; Wang, W.X.; Guo, R.Z. Policies for optimizing land-use layouts in highly urbanized areas: An analysis framework based on construction land clearance. Habitat. Int. 2022, 130, 102697. [Google Scholar] [CrossRef]
  46. Gao, J.B.; Zhang, X.Y.; Yu, C.; Ma, Z.F.; Sun, J.W.; Guan, Y.J. How to Rebalance the Land-Use Structure after Large Infrastructure Construction? From the Perspective of Government Attention Evolution. Land 2023, 12, 1632. [Google Scholar] [CrossRef]
  47. Henríquez-Dole, L.; Usón, T.J.; Vicuña, S.; Henríquez, C.; Gironás, J.; Meza, F. Integrating strategic land use planning in the construction of future land use scenarios and its performance: The Maipo River Basin, Chile. Land Use Policy 2018, 78, 353–366. [Google Scholar] [CrossRef]
  48. Bimonte, S.; Stabile, A. Local taxation and urban development. Testing for the side-effects of the Italian property tax. Ecol. Econ. 2015, 120, 100–107. [Google Scholar] [CrossRef]
  49. Wang, X.; Xiao, F.; Zhang, Y.; Yin, L.; Lesi, M.; Guo, B.; Zhao, Y.; Li, R. Thirty-year expansion of construction land in Xi’an: Spatial pattern and potential driving factors. Geol. J. 2018, 53, 309–321. [Google Scholar] [CrossRef]
  50. Munroe, D.K.; Müller, D. Issues in spatially explicit statistical land-use/cover change (LUCC) models: Examples from western Honduras and the Central Highlands of Vietnam. Land Use Policy 2007, 24, 521–530. [Google Scholar] [CrossRef]
  51. Zhang, L.F.; Fang, C.L.; Zhao, R.D.; Zhu, C.; Guan, J.Y. Spatial-temporal evolution and driving force analysis of eco-quality in urban agglomerations in China. Sci. Total Environ. 2023, 866, 161465. [Google Scholar] [CrossRef]
  52. Hoyos, L.E.; Cabido, M.R.; Cingolani, A.M. A Multivariate Approach to Study Drivers of Land-Cover Changes through Remote Sensing in the Dry Chaco of Argentina. ISPRS Int. J. Geo-Inf. 2018, 7, 170. [Google Scholar] [CrossRef]
  53. Ustaoglu, E.; Aydinoglu, A.C. Regional Variations of Land-Use Development and Land-Use/Cover Change Dynamics: A Case Study of Turkey. Remote Sens. 2019, 11, 885. [Google Scholar] [CrossRef]
  54. Cai, W.J.; Tu, F.Y. Spatiotemporal characteristics and driving forces of construction land expansion in Yangtze River economic belt, China. PLoS ONE 2020, 15, e0227299. [Google Scholar] [CrossRef]
  55. Meneses, B.M.; Reis, E.; Pereira, S.; Vale, M.J.; Reis, R. Understanding Driving Forces and Implications Associated with the Land Use and Land Cover Changes in Portugal. Sustainability 2017, 9, 351. [Google Scholar] [CrossRef]
  56. Aroengbinang, B.W.; Kaswanto. Driving Force Analysis of Landuse and Cover Changes in Cimandiri and Cibuni Watersheds. Procedia Environ. Sci. 2015, 24, 184–188. [Google Scholar] [CrossRef]
  57. Ren, Y.; Li, Z.H.; Li, J.N.; Ding, Y.; Miao, X.R. Analysis of Land Use/Cover Change and Driving Forces in the Selenga River Basin. Sensors 2022, 22, 1041. [Google Scholar] [CrossRef]
  58. Alqurashi, A.F.; Kumar, L.; Al-Ghamdi, K.A. Spatiotemporal Modeling of Urban Growth Predictions Based on Driving Force Factors in Five Saudi Arabian Cities. ISPRS Int. J. Geo-Inf. 2016, 5, 139. [Google Scholar] [CrossRef]
  59. Cao, M.; Zhao, J.; Zhang, S. Research on the Suitability Evaluation of Construction Land in Southwest Mountainous Areas of China: A Case Study of Baoxing County, Sichuan Province, China. Appl. Ecol. Environ. Res. 2018, 16, 6567–6587. [Google Scholar] [CrossRef]
  60. Zhao, J.S.; Yuan, L.; Zhang, M. A study of the system dynamics coupling model of the driving factors for multi-scale land use change. Environ. Earth Sci. 2016, 75, 529. [Google Scholar] [CrossRef]
  61. Wu, M.; Ren, X.; Che, Y.; Yang, K. A Coupled SD and CLUE-S Model for Exploring the Impact of Land Use Change on Ecosystem Service Value: A Case Study in Baoshan District, Shanghai, China. Environ. Manag. 2015, 56, 402–419. [Google Scholar] [CrossRef]
  62. Rasmussen, L.V.; Rasmussen, K.; Reenberg, A.; Proud, S. A system dynamics approach to land use changes in agro-pastoral systems on the desert margins of Sahel. Agric. Syst. 2012, 107, 56–64. [Google Scholar] [CrossRef]
  63. Wang, Y.; Zuo, C.C.; Zhu, M.K. How Semi-Urbanisation Drives Expansion of Rural Construction Land in China: A Rural-Urban Interaction Perspective. Land 2024, 13, 117. [Google Scholar] [CrossRef]
  64. Wu, H.; Lin, A.; Xing, X.; Song, D.; Li, Y. Identifying core driving factors of urban land use change from global land cover products and POI data using the random forest method. Int. J. Appl. Earth Obs. 2021, 103, 102475. [Google Scholar] [CrossRef]
  65. Meng, B.; Wang, X.X.; Zhang, Z.F.; Huang, P. Spatio-Temporal Pattern and Driving Force Evolution of Cultivated Land Occupied by Urban Expansion in the Chengdu Metropolitan Area. Land 2022, 11, 1458. [Google Scholar] [CrossRef]
  66. Wu, R.; Li, Z.; Wang, S. The varying driving forces of urban land expansion in China: Insights from a spatial-temporal analysis. Sci. Total Environ. 2021, 766, 142591. [Google Scholar] [CrossRef] [PubMed]
  67. Xu, D.; Zhang, K.; Cao, L.; Guan, X.; Zhang, H. Driving forces and prediction of urban land use change based on the geodetector and CA-Markov model: A case study of Zhengzhou, China. Int. J. Digit. Earth 2022, 15, 2246–2267. [Google Scholar] [CrossRef]
  68. Kang, L.; Ma, L.; Liu, Y. Comparing the driving mechanisms of different types of urban construction land expansion: A case study of the Beijing-Tianjin-Hebei region. J. Geogr. Sci. 2024, 34, 722–744. [Google Scholar] [CrossRef]
  69. Liu, T.; Liu, H.; Qi, Y.J. Construction land expansion and cultivated land protection in urbanizing China: Insights from national land surveys, 1996–2006. Habitat Int. 2015, 46, 13–22. [Google Scholar] [CrossRef]
  70. Fang, C. Important progress and future direction of studies on China’s urban agglomerations. J. Geogr. Sci. 2015, 25, 1003–1024. [Google Scholar] [CrossRef]
  71. Cao, Y.G. Forces Driving Changes in Urban Construction Land of Urban Agglomerations in China. J. Urban Plan. Dev. 2015, 141, 05014011. [Google Scholar] [CrossRef]
  72. Cao, Y.; Bai, Z.; Zhou, W.; Ai, G. Gradient Analysis of Urban Construction Land Expansion in the Chongqing Urban Area of China. J. Urban Plan. Dev. 2015, 141, 05014009. [Google Scholar] [CrossRef]
  73. Wang, A.Q.; Chan, E.H.W.; Yeung, S.C.W.; Han, J.B. Urban Fringe Land Use Transitions in Hong Kong: From New Towns to New Development Areas. Procedia Eng. 2017, 198, 707–719. [Google Scholar] [CrossRef]
  74. Wei, Y.; Zhang, Z. Assessing the fragmentation of construction land in urban areas: An index method and case study in Shunde, China. Land Use Policy 2012, 29, 417–428. [Google Scholar] [CrossRef]
  75. Li, X.; Fu, J.; Jiang, D.; Lin, G.; Cao, C. Land use optimization in Ningbo City with a coupled GA and PLUS model. J. Clean. Prod. 2022, 375, 134004. [Google Scholar] [CrossRef]
  76. Huang, X.; Huang, X.J.; Liu, M.M.; Wang, B.; Zhao, Y.H. Spatial-temporal Dynamics and Driving Forces of Land Development Intensity in the Western China from 2000 to 2015. Chin. Geogr Sci 2020, 30, 16–29. [Google Scholar] [CrossRef]
  77. Shi, Z.Q.; Deng, W.; Zhang, S.Y. Spatio-temporal pattern changes of land space in Hengduan Mountains during 1990–2015. J. Geogr. Sci. 2018, 28, 529–542. [Google Scholar] [CrossRef]
  78. Xu, Y.; Tang, Q.; Fan, J.; Bennett, S.J.; Li, Y. Assessing construction land potential and its spatial pattern in China. Landsc. Urban Plan. 2011, 103, 207–216. [Google Scholar] [CrossRef]
  79. Xiang, J.W.; Li, X.M.; Xiao, R.B.; Wang, Y. Effects of land use transition on ecological vulnerability in poverty-stricken mountainous areas of China: A complex network approach. J. Environ. Manag. 2021, 297, 113206. [Google Scholar] [CrossRef]
  80. Liu, C.; Zhang, H.Y.; Gan, F.P.; Lu, Y.E.; Wang, H.; Zhang, J.H.; Ju, X. Identifying the spatio-temporal variability of human activity intensity and associated drivers: A case study on the Tibetan Plateau. Front. Earth Sci. 2022, 16, 744–756. [Google Scholar] [CrossRef]
  81. Yang, Y.; Yang, X.; Li, E.; Huang, W. Transitions in land use and cover and their dynamic mechanisms in the Haihe River Basin, China. Environ. Earth Sci. 2021, 80, 50. [Google Scholar] [CrossRef]
  82. Yang, Z.; Li, C. Spatial and Temporal Characteristics of Rurality in Urban Suburb Town and Its Driving Factors Based on Land Use Transformation. Complexity 2020, 2020, 2806127. [Google Scholar] [CrossRef]
  83. Cao, Y.H.; Liu, M.Y.; Cao, Y.D.; Chen, C.; Zhang, D.P. Change pattern and driving mechanism of construction land in China’s undertaking industrial transfer demonstration area: Taking the Wanjiang City Belt along the Yangtze River as an Example. Earth Sci. Res. J. 2020, 24, 215–223. [Google Scholar] [CrossRef]
  84. Gong, Y.L.; Li, J.T.; Li, Y.X. Spatiotemporal characteristics and driving mechanisms of arable land in the Beijing-Tianjin-Hebei region during 1990–2015. Socio-Econ. Plan. Sci. 2020, 70, 100720. [Google Scholar] [CrossRef]
  85. Gao, Y.P.; Chen, W.J. Evolution and Influencing Factors of Township Spatial Form: A Two-Dimensional Perspective. Complexity 2020, 2020, 5617545. [Google Scholar] [CrossRef]
  86. Yang, R.; Xu, Q.; Xu, X.; Chen, Y. Rural settlement spatial patterns and effects: Road traffic accessibility and geographic factors in Guangdong Province, China. J. Geogr. Sci. 2019, 29, 213–230. [Google Scholar] [CrossRef]
  87. Xu, C.; Liu, M.S.; Zhang, C.; An, S.Q.; Yu, W.; Chen, J.M. The spatiotemporal dynamics of rapid urban growth in the Nanjing metropolitan region of China. Landsc. Ecol. 2007, 22, 925–937. [Google Scholar] [CrossRef]
  88. Liu, J.Y.; Zhang, Z.X.; Xu, X.L.; Kuang, W.H.; Zhou, W.C.; Zhang, S.W.; Li, R.D.; Yan, C.Z.; Yu, D.S.; Wu, S.X.; et al. Spatial patterns and driving forces of land use change in China during the early 21st century. J. Geogr. Sci. 2010, 20, 483–494. [Google Scholar] [CrossRef]
  89. Brunsdon, C.; Fotheringham, A.S.; Charlton, M.E. Geographically weighted regression: A method for exploring spatial nonstationarity. Geogr. Anal. 1996, 28, 281–298. [Google Scholar] [CrossRef]
  90. Zhao, Y.B.; Sun, R.H.; Ni, Z.Y. Identification of Natural and Anthropogenic Drivers of Vegetation Change in the Beijing-Tianjin-Hebei Megacity Region. Remote Sens. 2019, 11, 1224. [Google Scholar] [CrossRef]
  91. Leung, Y.; Mei, C.-L.; Zhang, W.-X. Statistical test for local patterns of spatial association. Environ. Plan. A 2003, 35, 725–744. [Google Scholar] [CrossRef]
  92. Nakaya, T.; Fotheringham, A.S.; Brunsdon, C.; Charlton, M. Geographically weighted Poisson regression for disease association mapping. Stat. Med. 2005, 24, 2695–2717. [Google Scholar] [CrossRef]
  93. Liu, Z.; Zhang, J.; Golubchikov, O. Edge-urbanization: Land policy, development zones, and urban expansion in Tianjin. Sustainability 2019, 11, 2538. [Google Scholar] [CrossRef]
  94. Fulman, N.; Grinblat, Y.; Benenson, I. A project-based view of urban dynamics: Analyzing ‘leapfrogging’ and fringe development in Israel. Cities 2024, 148, 104908. [Google Scholar] [CrossRef]
  95. Farris, J.T. The barriers to using urban infill development to achieve smart growth. Hous. Policy Debate 2001, 12, 1–30. [Google Scholar] [CrossRef]
  96. Li, C.; Zhao, J.; Xu, Y. Examining spatiotemporally varying effects of urban expansion and the underlying driving factors. Sustain. Cities Soc. 2017, 28, 307–320. [Google Scholar] [CrossRef]
  97. Duan, J.H.; Peng, Q.Z.; Huang, P.Y. Slope characteristics of urban construction land and its correlation with ground slope in China. Open Geosci. 2022, 14, 1524–1537. [Google Scholar] [CrossRef]
  98. Li, M.; Shi, X.; Shen, Z.; Yang, E.; Bao, H.; Ni, Y. Effect of hillslope aspect on landform characteristics and erosion rates. Environ. Monit. Assess. 2019, 191, 598. [Google Scholar] [CrossRef] [PubMed]
  99. Arouq, M.K.; Esmaeilpour, M.; Sarvar, H. Vulnerability assessment of cities to earthquake based on the catastrophe theory: A case study of Tabriz city, Iran. Environ. Earth Sci. 2020, 79, 354. [Google Scholar] [CrossRef]
  100. Wang, J.; Wang, Z.; Cheng, H.; Kang, J.; Liu, X. Land Cover Changing Pattern in Pre- and Post-Earthquake Affected Area from Remote Sensing Data: A Case of Lushan County, Sichuan Province. Land 2022, 11, 1205. [Google Scholar] [CrossRef]
  101. Lin, J.; Chen, W.; Qi, X.; Hou, H. Risk assessment and its influencing factors analysis of geological hazards in typical mountain environment. J. Clean. Prod. 2021, 309, 127077. [Google Scholar] [CrossRef]
  102. Liu, Y.; Deng, W.; Peng, L. The coupling mechanism between the suitable space and rural settlements considering the effect of mountain hazards in the upper Minjiang River basin. J. Mt. Sci. 2020, 17, 2774–2783. [Google Scholar] [CrossRef]
  103. Zhao, J.; Zhang, Q.; Wang, D.; Wu, W.; Yuan, R. Machine Learning-Based Evaluation of Susceptibility to Geological Hazards in the Hengduan Mountains Region, China. Int. J. Disaster Risk Sci. 2022, 13, 305–316. [Google Scholar] [CrossRef]
  104. Liang, L.; Deng, X.; Wang, P.; Wang, Z.; Wang, L. Assessment of the impact of climate change on cities livability in China. Sci. Total Environ. 2020, 726, 138339. [Google Scholar] [CrossRef] [PubMed]
  105. Tian, L.; Fu, W.; Tao, Y.; Li, M.; Wang, L. Dynamics of the alpine timberline and its response to climate change in the Hengduan mountains over the period 1985–2015. Ecol. Indic. 2022, 135, 108589. [Google Scholar] [CrossRef]
  106. Liang, X.; Zhang, L.; He, S.; Song, K.; Zheng, Z. Characteristics and Projection of Rainfall Erosivity Distribution in the Hengduan Mountains. Land 2023, 12, 1435. [Google Scholar] [CrossRef]
  107. Gupta, A.K.; Negi, M.; Nandy, S.; Kumar, M.; Singh, V.; Valente, D.; Petrosillo, I.; Pandey, R. Mapping socio-environmental vulnerability to climate change in different altitude zones in the Indian Himalayas. Ecol. Indic. 2020, 109, 105787. [Google Scholar] [CrossRef]
  108. Nilsson, C.; Reidy, C.A.; Dynesius, M.; Revenga, C. Fragmentation and Flow Regulation of the World’s Large River Systems. Science 2005, 308, 405–408. [Google Scholar] [CrossRef]
  109. Sear, D.A.; Newson, M.D. Environmental change in river channels: A neglected element. Towards geomorphological typologies, standards and monitoring. Sci. Total Environ. 2003, 310, 17–23. [Google Scholar] [CrossRef]
  110. Gregory, K.J.; Davis, R.J.; Downs, P.W. Identification of river channel change to due to urbanization. Appl. Geogr. 1992, 12, 299–318. [Google Scholar] [CrossRef]
  111. Wu, L.; Xu, Y.; Yuan, J.; Xu, Y.; Wang, Q.; Xu, X.; Wen, H. Impacts of Land Use Change on River Systems for a River Network Plain. Water 2018, 10, 609. [Google Scholar] [CrossRef]
  112. Stroud, S.; Peacock, J.; Hassall, C. Vegetation-based ecosystem service delivery in urban landscapes: A systematic review. Basic Appl. Ecol. 2022, 61, 82–101. [Google Scholar] [CrossRef]
  113. Wang, Y.H.; Dai, E.F.; Yin, L.; Ma, L. Land use/land cover change and the effects on ecosystem services in the Hengduan Mountain region, China. Ecosyst. Serv. 2018, 34, 55–67. [Google Scholar] [CrossRef]
  114. Yin, L.; Dai, E.; Guan, M.; Zhang, B. A novel approach for the identification of conservation priority areas in mountainous regions based on balancing multiple ecosystem services—A case study in the Hengduan Mountain region. Glob. Ecol. Conserv. 2022, 38, e02195. [Google Scholar] [CrossRef]
  115. Liu, Y.; Tian, J.; Liu, R.; Ding, L. Influences of Climate Change and Human Activities on NDVI Changes in China. Remote Sens. 2021, 13, 4326. [Google Scholar] [CrossRef]
  116. Handavu, F.; Chirwa, P.W.C.; Syampungani, S. Socio-economic factors influencing land-use and land-cover changes in the miombo woodlands of the Copperbelt province in Zambia. For. Policy Econ. 2019, 100, 75–94. [Google Scholar] [CrossRef]
  117. Wang, L.Y.; Zhang, S.Y.; Liu, Y.F.; Liu, Y.L. Interaction between Construction Land Expansion and Cropland Expansion and Its Socioeconomic Determinants: Evidence from Urban Agglomeration in the Middle Reaches of the Yangtze River, China. Front. Environ. Sci. 2022, 10, 882582. [Google Scholar] [CrossRef]
  118. He, W.; Di, B.F.; Zeng, Y.J.; Duan, Y.N.; Li, J.H.; Qiu, L.K.; Balikuddembe, J.K.; Peng, Q.Q.; Zeng, W.; Stamatopoulos, C.A.; et al. Reconsidering the eco-economic benefits of Grain for Green Program in Sichuan Province, China. Ecol. Indic. 2023, 15, 111225. [Google Scholar] [CrossRef]
  119. Thiede, R.N.; Fabris-Rotelli, I.N.; Debba, P.; Cleghorn, C.W. A Markov chain model for geographical accessibility. Spat. Stat. 2023, 55, 100748. [Google Scholar] [CrossRef]
  120. Oruonye, E. An assessment of the impact of road construction on land use pattern in urban centres in Nigeria, A case study of Jalingo LGA, Taraba State Nigeria. Mediterr. J. Soc. Sci. 2014, 5, 82–88. [Google Scholar] [CrossRef]
Figure 1. Location of the study area.
Land 13 00993 g001
Figure 2. The fourth phase of Landsat remote sensing images.
Land 13 00993 g002
Figure 3. Land use types in the fourth phase.
Land 13 00993 g003
Figure 4. Influencing factors of construction land: (a) elevation, (b) slope, (c) aspect, (d) Euclidean distance of fault, (e) Euclidean distance of rivers, (f) Euclidean distance of towns, (g) annual precipitation in 1990, (h) annual precipitation in 2020, (i) average annual temperature in 1990, (j) average annual temperature in 2020, (k) NDVI in 1990, (l) NDVI in 2020, (m) cropland kernel density in 1990, (n) cropland kernel density in 2020, (o) Euclidean distance of roads in 1990, and (p) Euclidean distance of roads in 2020.
Land 13 00993 g004
Figure 5. Geo-hazards factors affecting construction land: (a) kernel density of geo-hazards in 1990, (b) kernel density of geo-hazards in 2000, and (c) kernel density changes of geo-hazards from 1990 to 2020.
Land 13 00993 g005
Figure 6. Three modes of landscape expansion.
Land 13 00993 g006
Figure 7. Kernel density of construction land in different periods: (a) 1990, (b) 2000, (c) 2010, (d) 2020, and (e) from 1990 to 2020.
Land 13 00993 g007
Figure 8. Wide Valley Spatial Pattern in the Anning River Basin (obtained on 25 April 2021, data from Century Space).
Land 13 00993 g008
Figure 9. Deep Valley Spatial Pattern in the Yalong River Basin (obtained on 14 February 2022, data from Century Space).
Land 13 00993 g009
Figure 10. High Mountain Lake Basin Spatial Pattern in the Dadu River Basin (obtained on 30 March 2021, data from Century Space).
Land 13 00993 g010
Figure 11. Estimated coefficient of GWR for the impact factors of construction land in 1990: (a) elevation, (b) slope, (c) aspect, (d) Euclidean distance of fault, (e) annual precipitation in 1990, (f) average annual temperature in 1990, (g) NDVI in 1990, (h) Euclidean distance of rivers, (i) cropland kernel density in 1990, (j) Euclidean distance of roads in 1990, and (k) Euclidean distance of towns.
Land 13 00993 g011
Figure 12. Estimated coefficient of GWR for the impact factors of construction land in 2020: (a) elevation, (b) slope, (c) aspect, (d) Euclidean distance of fault, (e) annual precipitation in 2020, (f) average annual temperature in 2020, (g) NDVI in 2020, (h) Euclidean distance of rivers, (i) cropland kernel density in 2020, (j)Euclidean distance of roads in 2020, and (k) Euclidean distance of towns.
Land 13 00993 g012
Figure 13. Estimated coefficient of GWR for the impact factors of construction land changes from 1990 to 2020: (a) elevation, (b) slope, (c) aspect, (d) Euclidean distance of fault, (e) annual precipitation changes from 1990 to 2020, (f) average annual temperature changes from 1990 to 2020, (g) NDVI changes from 1990 to 2020, (h) Euclidean distance of rivers, (i) cropland kernel density changes from 1990 to 2020, (j) Euclidean distance of changes from 1990 to 2020, (k) Euclidean distance of towns, and (l) changes in kernel density of geological hazards from 1990 to 2020.
Land 13 00993 g013
Table 1. Data of influencing factors on the evolution of construction land.
Variable CategoryVariable NameDefinition and UnitsData SourcesSpatial
Resolution
Geomorphological ELEVATIONElevation represents macroscopic
geomorphology (m)
Geospatial data
cloud a
30 m
SLOPESlope represents ground
cutting condition (°)
ASPECTAspect represents ground orientation
Geological activitiesED_FAULTEuclidean distance of fault (m)China Geological Survey bVector
KD_GEOHAZARD *Kernel density of geological hazard Sichuan Provincial Institute of Land Space Ecological Restoration and Geological Disaster Prevention and ControlVector
ClimaticTEM *Annual precipitation (mm)National Qinghai
Tibet Plateau
Scientific Data
Center c
1 km
PRE *Annual mean temperature (°C)1 km
Rivers and vegetation environmentED_RIVEREuclidean distance of river (m)National Geomatics
Center of China d
Vector
NDVI *Normalized Difference
Vegetation Index
Remote sensing extraction from
Landsat satellite data
30 m
Socio-economicKD_CROPLAND *Kernel density of croplandRemote sensing interpretation from Landsat satellite data30 m
ED_TOWNEuclidean distance of town (m)National Geomatics
Center of China d
Vector
ED_ROAD *Euclidean distance of road (m)National Geomatics
Center of China d
Vector
a http://www.gscloud.cn/ (accessed on 26 March 2024); b https://www.ngac.org.cn/ (accessed on 26 March 2024); c https://data.tpdc.ac.cn/ (accessed on 26 March 2024); d http://www.ngcc.cn(accessed on 26 March 2024). The symbol * indicates that the indicator has two periods of data from 1990 and 2020, and the change of the indicator from 1990 to 2020 needs to be calculated.
Table 2. Statistical characteristics of changes in construction land.
Statistical Indicators1990200020102020
Total area of construction land (km2)41.5558.6682.7595.26
Number of patches on construction land7008209141059
Average patch area of construction land (m2)59,35571,53690,54089,956
Area increase compared to the previous 10 years (km2)17.1124.0912.51
Percentage increase compared to 1990 (%)41.1899.16129.26
Percentage increase compared to the previous 10 years (%)41.1841.0715.11
Table 3. Average estimated coefficient of GWR for the impact factors of construction land in 1990.
Factor CategoriesFactorAnning River BasinYalong River BasinDadu River Basin
GeomorphologicalELEVATION−0.0721−0.03290.0606
SLOPE−0.3728−0.0403−0.0825
ASPECT0.00510.00890.0429
Geological activitiesED_FAULT−0.03840.00010.0487
ClimaticPRE0.54990.0179−0.0180
TEM−0.26750.00210.0261
Rivers and vegetation environmentED_RIVER0.0537−0.0017−0.0130
NDVI−0.1253−0.0023−0.0572
Socio-economicKD_CROPLAND0.18110.01370.1129
ED_TOWN−0.6444−0.0310−0.0697
ED_ROAD−0.4343−0.00450.0055
Table 4. Average estimated coefficient of GWR for the impact factors of construction land in 2020.
Factor CategoriesFactorAnning River BasinYalong River BasinDadu River Basin
GeomorphologicalELEVATION−0.0612−0.0032−0.0274
SLOPE−0.3451−0.03100.0615
ASPECT0.04410.00530.0555
Geological activitiesED_FAULT−0.1219−0.03940.0304
ClimaticPRE0.84120.0087−0.2833
TEM−0.18330.08650.1639
Rivers and vegetation environmentED_RIVER−0.15350.0037−0.0525
NDVI−0.3773−0.0198−0.0066
Socio-economicKD_CROPLAND0.03220.03850.1548
ED_TOWN−0.6054−0.0477−0.1697
ED_ROAD−0.3355−0.00780.1079
Table 5. Average estimated coefficient of GWR for the impact factors of construction land changes from 1990 to 2020.
Factor CategoriesFactorAnning River BasinYalong River BasinDadu River Basin
GeomorphologicalELEVATION0.10130.0027−0.0610
SLOPE−0.3099−0.01000.1436
ASPECT−0.02460.00850.0529
Geological activitiesED_FAULT−0.0303−0.0187−0.0318
KD_GEOHAZARD0.14370.16340.0666
ClimaticPRE−0.02630.0795−0.2337
TEM−0.00090.02250.1342
Rivers and vegetation environmentED_RIVER−0.1388−0.0081−0.0697
NDVI−0.2684−0.0168−0.0418
Socio-economicKD_CROPLAND−0.32610.0634−0.0381
ED_TOWN−0.34040.0370−0.1796
ED_ROAD0.3986−0.0541−0.1158
Disclaimer/Publisher’s Note: The statements, opinions and data contained in all publications are solely those of the individual author(s) and contributor(s) and not of MDPI and/or the editor(s). MDPI and/or the editor(s) disclaim responsibility for any injury to people or property resulting from any ideas, methods, instructions or products referred to in the content.

