Article

Urban Fire Risk Dynamics and Mitigation Strategies in Shanghai: Integrating Spatial Analysis and Game Theory

College of Architecture and Urban Planning, Tongji University, No.1239 Siping Road, Shanghai 200092, China
*
Author to whom correspondence should be addressed.
Land 2024, 13(8), 1125; https://doi.org/10.3390/land13081125
Submission received: 29 June 2024 / Revised: 15 July 2024 / Accepted: 22 July 2024 / Published: 24 July 2024

Abstract

:
In recent decades, the increasing frequency of urban fires, driven by urban functional enhancements and climate change, has posed a growing threat to metropolitan sustainability. This study investigates the temporal and spatial characteristics of fire incidents in Shanghai from 2019 to 2023. Using satellite fire point data and official government records, kernel density analysis and wavelet analysis were employed to analyze the time series and spatial distribution of fire data. Subsequently, eleven primary factors influencing urban fire occurrence were identified, encompassing probability, regional characteristics, and hazard sources. A combined methodology of subjective and objective weights with game theory was used to generate a fire risk assessment at a 1 × 1 km2 grid scale. Furthermore, the spatial distribution characteristics of the assessments were analyzed. The results reveal that the downtown area exhibits the highest intensity of urban fires in terms of spatial domain, with a decreasing intensity towards the suburbs. Temporally, fire frequency demonstrates significant periodicity at an 18a time scale, while clear seasonal fluctuations and periodicity are observed at a 16-22a time scale, with higher occurrences in spring and winter. The study identifies typical aggregation patterns of urban fires, with high-risk centers in downtown Shanghai. Considering the impact of climate change and human activities, high-risk areas may gradually expand to adjacent urban suburbs, presenting a concerning future scenario. By examining the dual attributes of “combustibles and fireproof space” within urban greening systems, this research offers recommendations for the future strategies of disaster prevention and mitigation of green systems in Shanghai.

1. Introduction

Climate change poses a significant challenge to humanity, with global warming intensifying and the associated risks escalating [1]. China’s complex geographical features and fragile ecological environment make it particularly vulnerable, especially in densely populated urban areas [2]. Fires disrupt societal order, impact ecological security, and can exacerbate global warming, air pollution, and biodiversity decline [3]. Shanghai, a high-density city in China, faces increasing fire risks. In the first quarter of 2023 alone, fire incidents, deaths, and direct economic losses rose by 42.82%, 113.33%, and 26.86% year-on-year, respectively. Outdoor fires, particularly those involving greenery, lawns, and outdoor stacking of debris, have increased significantly, accounting for 34.51% and 19.96% of the total number of fires and losses, with year-on-year increases of 182.22% and 63.6%, respectively.
The variability of environmental factors and disaster conditions complicates the spatiotemporal distribution of fire incidents. Scholars have studied the characteristics of urban fires from various perspectives, seeking to identify key factors influencing fire occurrences. In 2007, Corcoran et al. [4] used spatial analysis technology to explore the spatiotemporal dynamics of fire events. Their research revealed trends in the concentration of fires over time and space through dynamic analysis. Zhang. et al. [5], using GIS technology, investigated the spatiotemporal dynamics of urban fires in Nanjing, China, from 2002 to 2013, focusing primarily on residential and facility fires. Wang et al. [6] combined historical fire data, meteorological information, and taxi flow data with satellite images to predict the current state and risk of urban fires in New York City from 2013 to 2018, using an upgraded HISS predictive model. Based on the existing research results, the occurrence of urban fires is primarily influenced by social background factors, urban environmental factors, and meteorological factors. Social background factors include population density, human activities, festivals, etc. [5]. Urban environmental factors encompass land use, building density, infrastructure distribution, traffic conditions, etc. [6]. While meteorological factors do not directly cause urban fires, extreme weather conditions such as drought and high temperatures can increase fire risk [1].
Over the years, analyzing the spatiotemporal patterns of urban fires has been a focal point of related research, yet modeling and analysis at the city scale have been relatively sparse. Therefore, fully integrating multimodal data and deeply exploring the potential relationships between fire incidents and urban environments are crucial for urban fire risk assessment, as well as for enhancing urban resilience and sustainable development. Acquiring detailed data on urban fire incidents is challenging. Existing studies on spatiotemporal fire patterns primarily rely on government statistical yearbooks, which contain annual data on fire incidents, economic losses, and casualties. However, detailed information on fire locations and causes requires collaboration with local fire departments and analysis of dispatch records. This limitation hinders the comprehensive exploration of factors influencing urban fires. While remote sensing data effectively capture fire information in large vegetation areas like forests and wetlands, distinguishing between daily high-temperature activities and actual fires in urban settings remains difficult. Nevertheless, the proliferation of internet applications offers new opportunities for collecting and organizing fire incident data from government platforms, enabling detailed analysis based on location, causes, and burning areas, facilitating the categorization of fires into vegetation- and non-vegetation-related incidents.
Fire risk assessment is crucial in urban planning, focusing on cities, administrative regions, community streets, and specific site environments [7,8]. Assessment methods can be broadly categorized into traditional indicator-based methods and modern machine learning-based methods. Traditional assessment methods typically involve three steps: establishing a fire indicator evaluation system, determining the weights of each indicator, and assessing the fire risk levels of different areas. Weight determination often employs methods such as the Analytic Hierarchy Process (AHP), entropy weight method, and combined weighting methods. Subjective weighting methods like AHP rely on expert experience to compare indicators and assign weights based on their importance. Objective weighting methods, such as the entropy weight method, use mathematical techniques to determine weights from raw data, independent of subjective judgment. Combined weighting methods integrate the strengths of both subjective and objective approaches [9]. For example, combining weights from the entropy weight method with AHP weights through linear weighting can determine comprehensive weights for evaluating fire risk in ancient buildings. Modern machine learning-based assessment methods involve training computers on historical fire data, using expert evaluation results as dependent variables. Machine learning algorithms process and refine these data to develop models that can analyze, assess, and predict urban fire risks on a large scale. Common machine learning models include supervised learning algorithms such as Random Forest, Bayesian classifiers, and Support Vector Machines. Multiple trained models can also be combined for enhanced accuracy [10]. For instance, GIS, remote sensing technology, and machine learning have been used to assess fire risks in potential urbanization areas of Istanbul [11]. In Beijing, the MaxEnt model has been used for comprehensive fire risk assessment, evaluating points of interest (POIs) related to fire and historical fire data while also considering population dynamics at different times of the day [12].
Urban fire prevention measures primarily focus on optimizing fire station locations. However, as an integral component of the urban ecosystem, enhancing the disaster resilience of the urban greening system is also crucial for improving ecological security and resilience of cities from a biological fire prevention perspective [13,14,15]. Research conducted in the Mediterranean region, for instance, has proposed a method for identifying urban fire risks based on vegetation proportion thresholds, supported by remote sensing data. This method helps regulate combustible material in urban landscapes, reducing fire occurrence likelihood and enhancing the comprehensive fire prevention capacity of plant landscapes [16]. Despite its importance, the current attention given to the fire-resistant characteristics of urban greening is limited, with research mainly focused on forests and Wildland–Urban Interface (WUI) areas.
This study aims to achieve the following research objectives in response to the current situation and limitations in the relevant research field: (1) Innovatively acquire fire data by integrating satellite data with fire incident notifications from internet-based government platforms, offering a new technological approach. (2) Analyze the spatiotemporal distribution patterns of vegetation-related and non-vegetation-related fire incidents in Shanghai, exploring causes and influencing factors of fire occurrences from multiple dimensions to provide comprehensive insights for urban fire prevention. (3) Focus on urban greening, incorporating meteorological and combustible material factors to establish a comprehensive fire risk assessment model for Shanghai. This model will serve as a reference for landscape planning and design in urban planning and green management. In summary, implementing effective fire risk management strategies in high-density cities is crucial. This research offers innovative approaches to enhance urban greening systems’ disaster reduction capabilities, contributing to urban safety. By utilizing the internet-based government platform and satellite remote sensing data, this study comprehensively analyzes the spatiotemporal distribution characteristics of vegetation and non-vegetation fires in Shanghai from 2019 to 2023. A comprehensive assessment framework based on game theory is developed to determine urban fire risk levels. Through empirical analysis of Shanghai, targeted strategies are proposed to reduce the risk of urban fire occurrence, optimize urban greening system fire prevention, and enhance urban resilience.

2. Materials and Methods
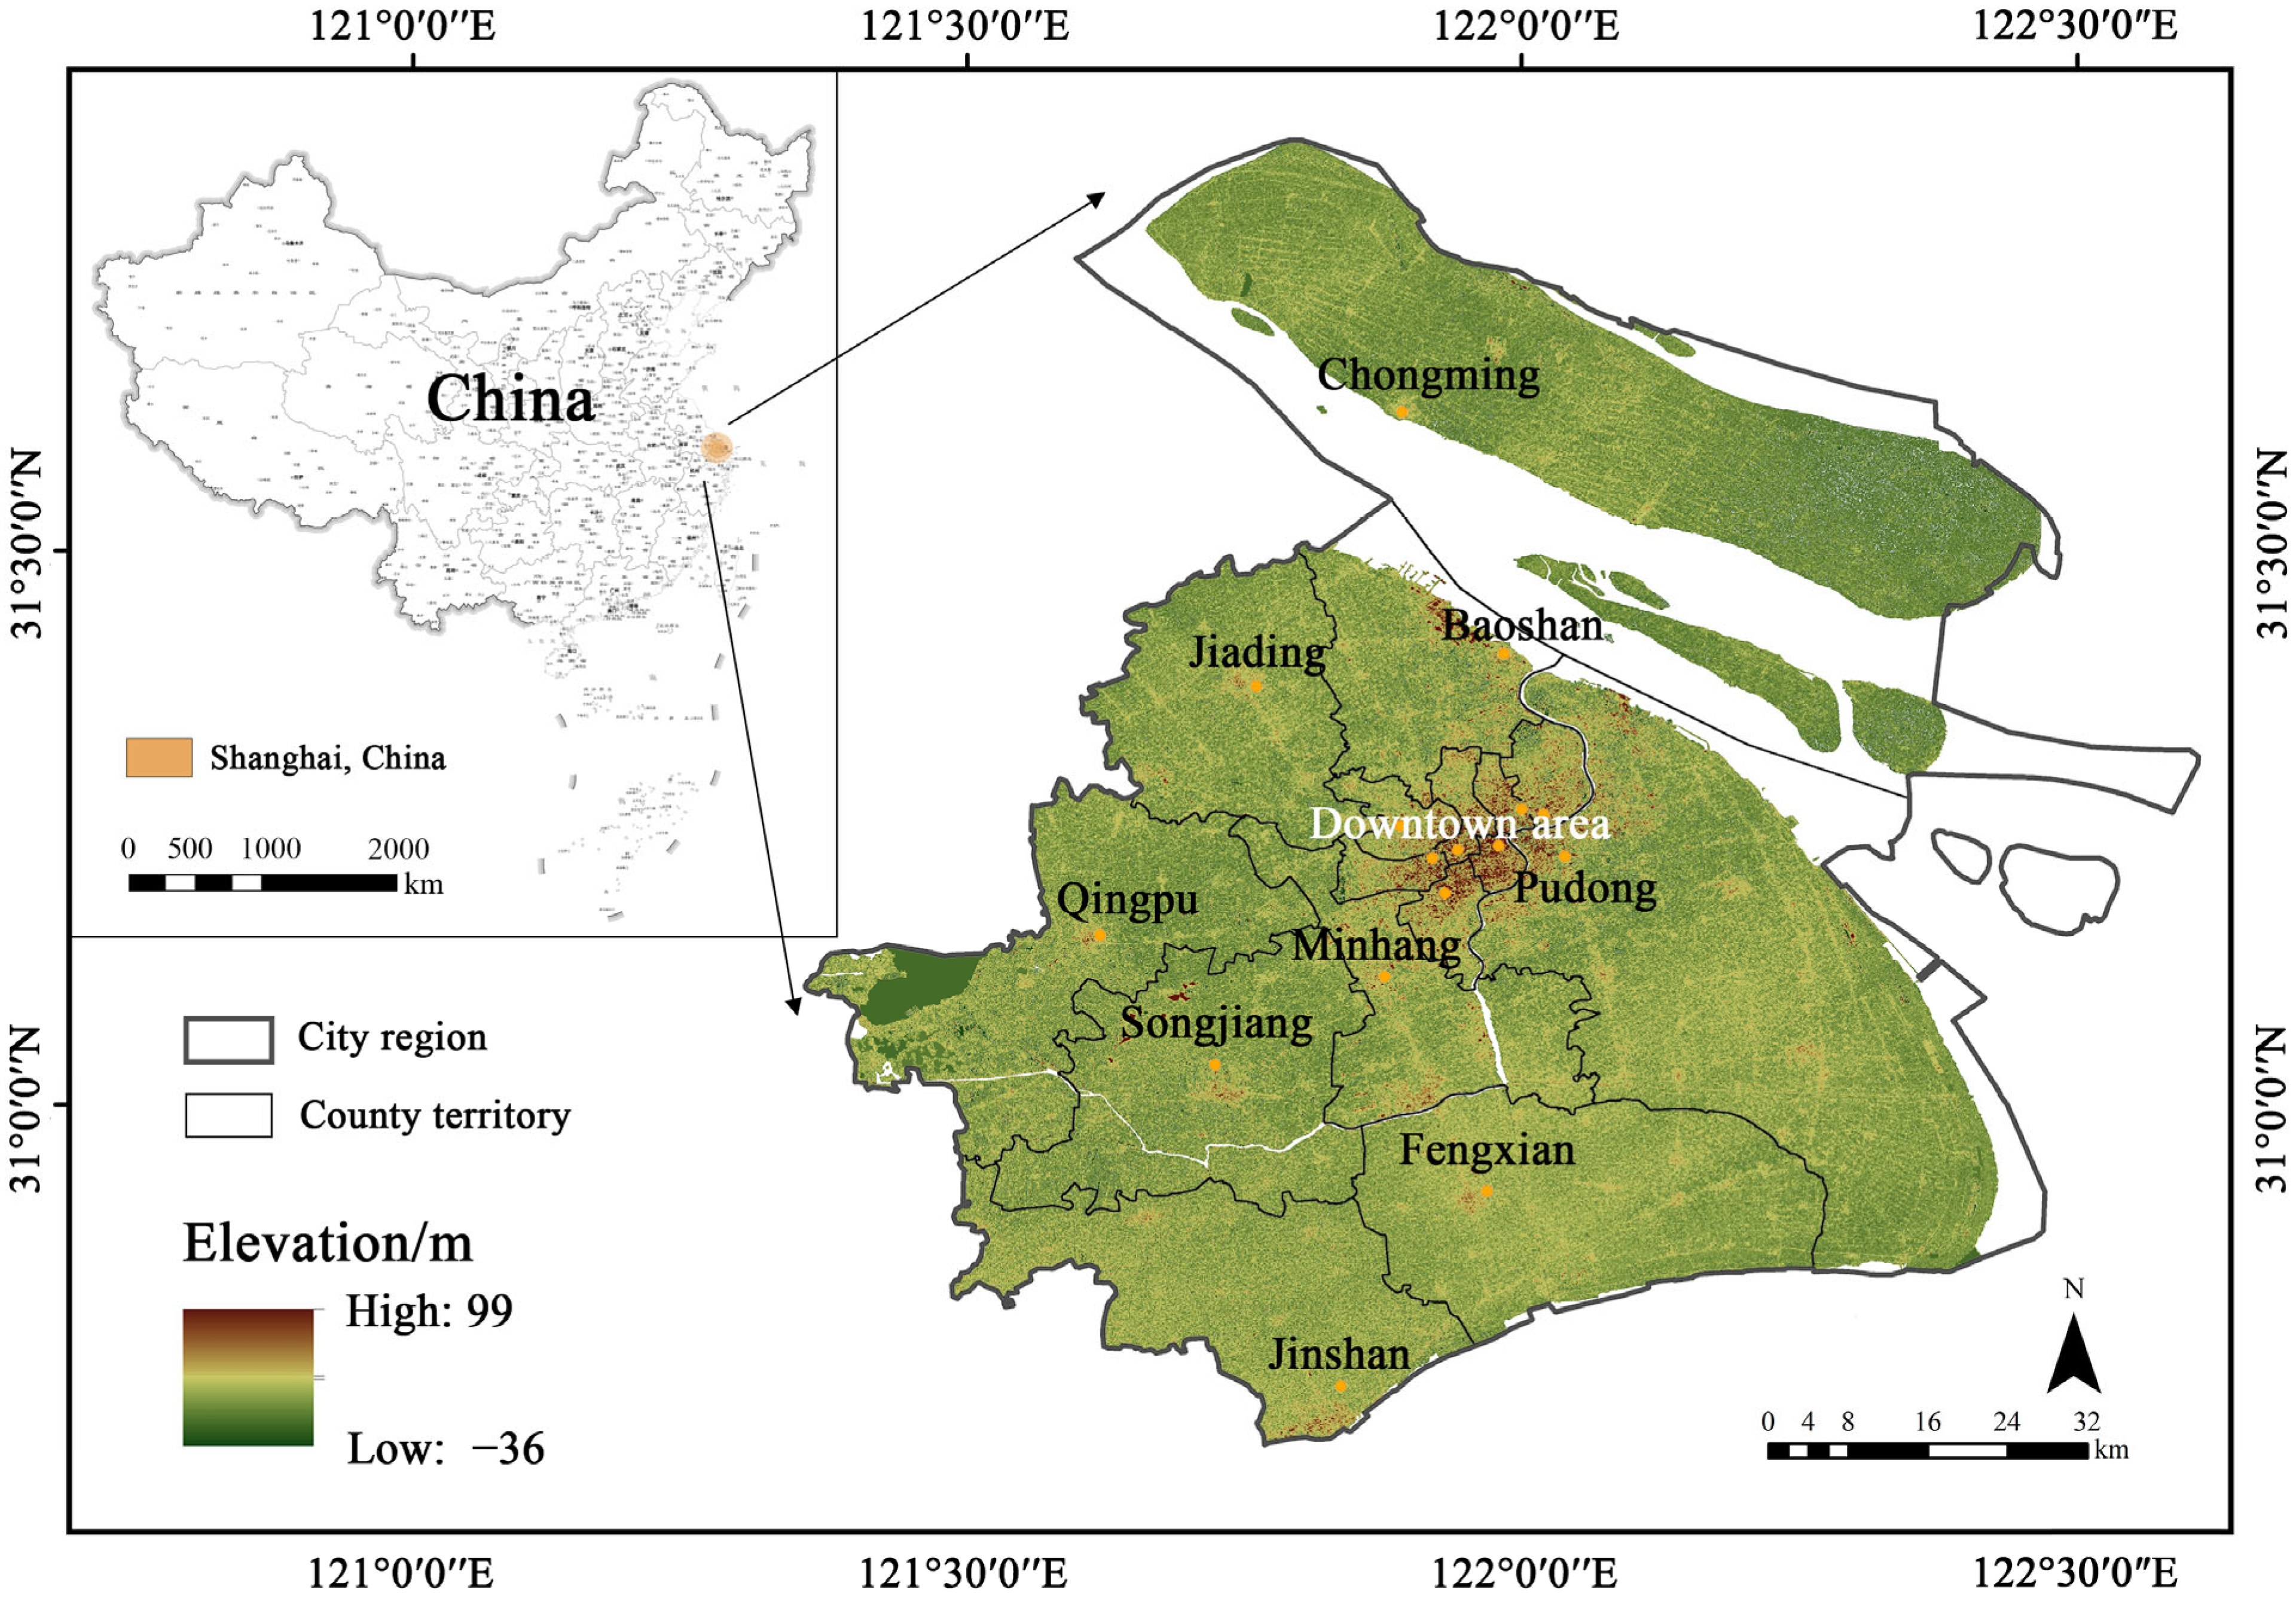
2.1. Study Area

Shanghai is located between N30°40′ and 31°53′ N and longitudes 120°52′ and 122°12′ E in eastern China (Figure 1). It is strategically positioned at the confluence of the Yangtze River and the Qiantang River, marking the midpoint of China’s north and south coasts. The city predominantly occupies the flat and low-lying terrain of the Yangtze River Delta alluvial plain, with an average elevation of approximately 2.19 m. Shanghai experiences a subtropical monsoon climate with distinct seasons and ample sunshine. However, the city’s extensive urban area and high population density contribute to a pronounced urban heat island effect, with peak temperatures reaching as high as 40.2 °C in the central urban zone [17]. Precipitation patterns show a noticeable urban rain island effect, with more rainfall in the southern regions and less in the north [18]. Shanghai is also significantly influenced by typhoons, causing considerable variations in annual precipitation and occasional summer droughts.

2.2. Method

2.2.1. Spatial and Temporal Distribution Characteristics

This study utilizes wavelet analysis in Matlab2019b to explore periodic variations in fire occurrence in Shanghai from 2019 to 2023, aiming to reveal the temporal distribution patterns of fires over the past five years. Furthermore, fire incidents in each administrative district of Shanghai are analyzed using the ArcGIS platform and kernel density analysis to identify varying clustering intensities across different spatial levels, thus revealing the spatial changes in fire distribution within Shanghai.
(1)
Morlet wavelet analysis
Wavelet analysis is chosen for its ability to combine time-domain and frequency-domain analyses, providing accurate identification of temporal localization and frequency characteristics of a time series, enabling the detection of periodic variation [19]. The continuous wavelet transform function is:
W f a , b = a 1 2 + f t φ ¯ t b a d t  
where W f a , b is the wavelet transform coefficient; a is the time scale factor; b is the translation factor of time t ;   f t is an arbitrarily integrable function; and φ ¯ t b a is the complex conjugate function of φ t b a .
Integrate W f a , b to obtain the wavelet square difference:
V a r a = + W f a , b 2 d b  
where V a r a is the wavelet square difference in time scale a .
(2)
Kernel Density Estimation
The kernel density estimation method is a non-parametric estimation method used to estimate an unknown probability density function [20]. The kernel density function is calculated as follows:
f x = n h d 1 i = 1 n k x x i h  
where k is the kernel function; d is dimension; h is the smoothing parameter or bandwidth; n is the number of data sample points; and x i is the i th sample point; so, when d = 2 , the formula for the kernel density function is:
f x = n h 2 1 i = 1 n = 1 k x x i h , y y i h  

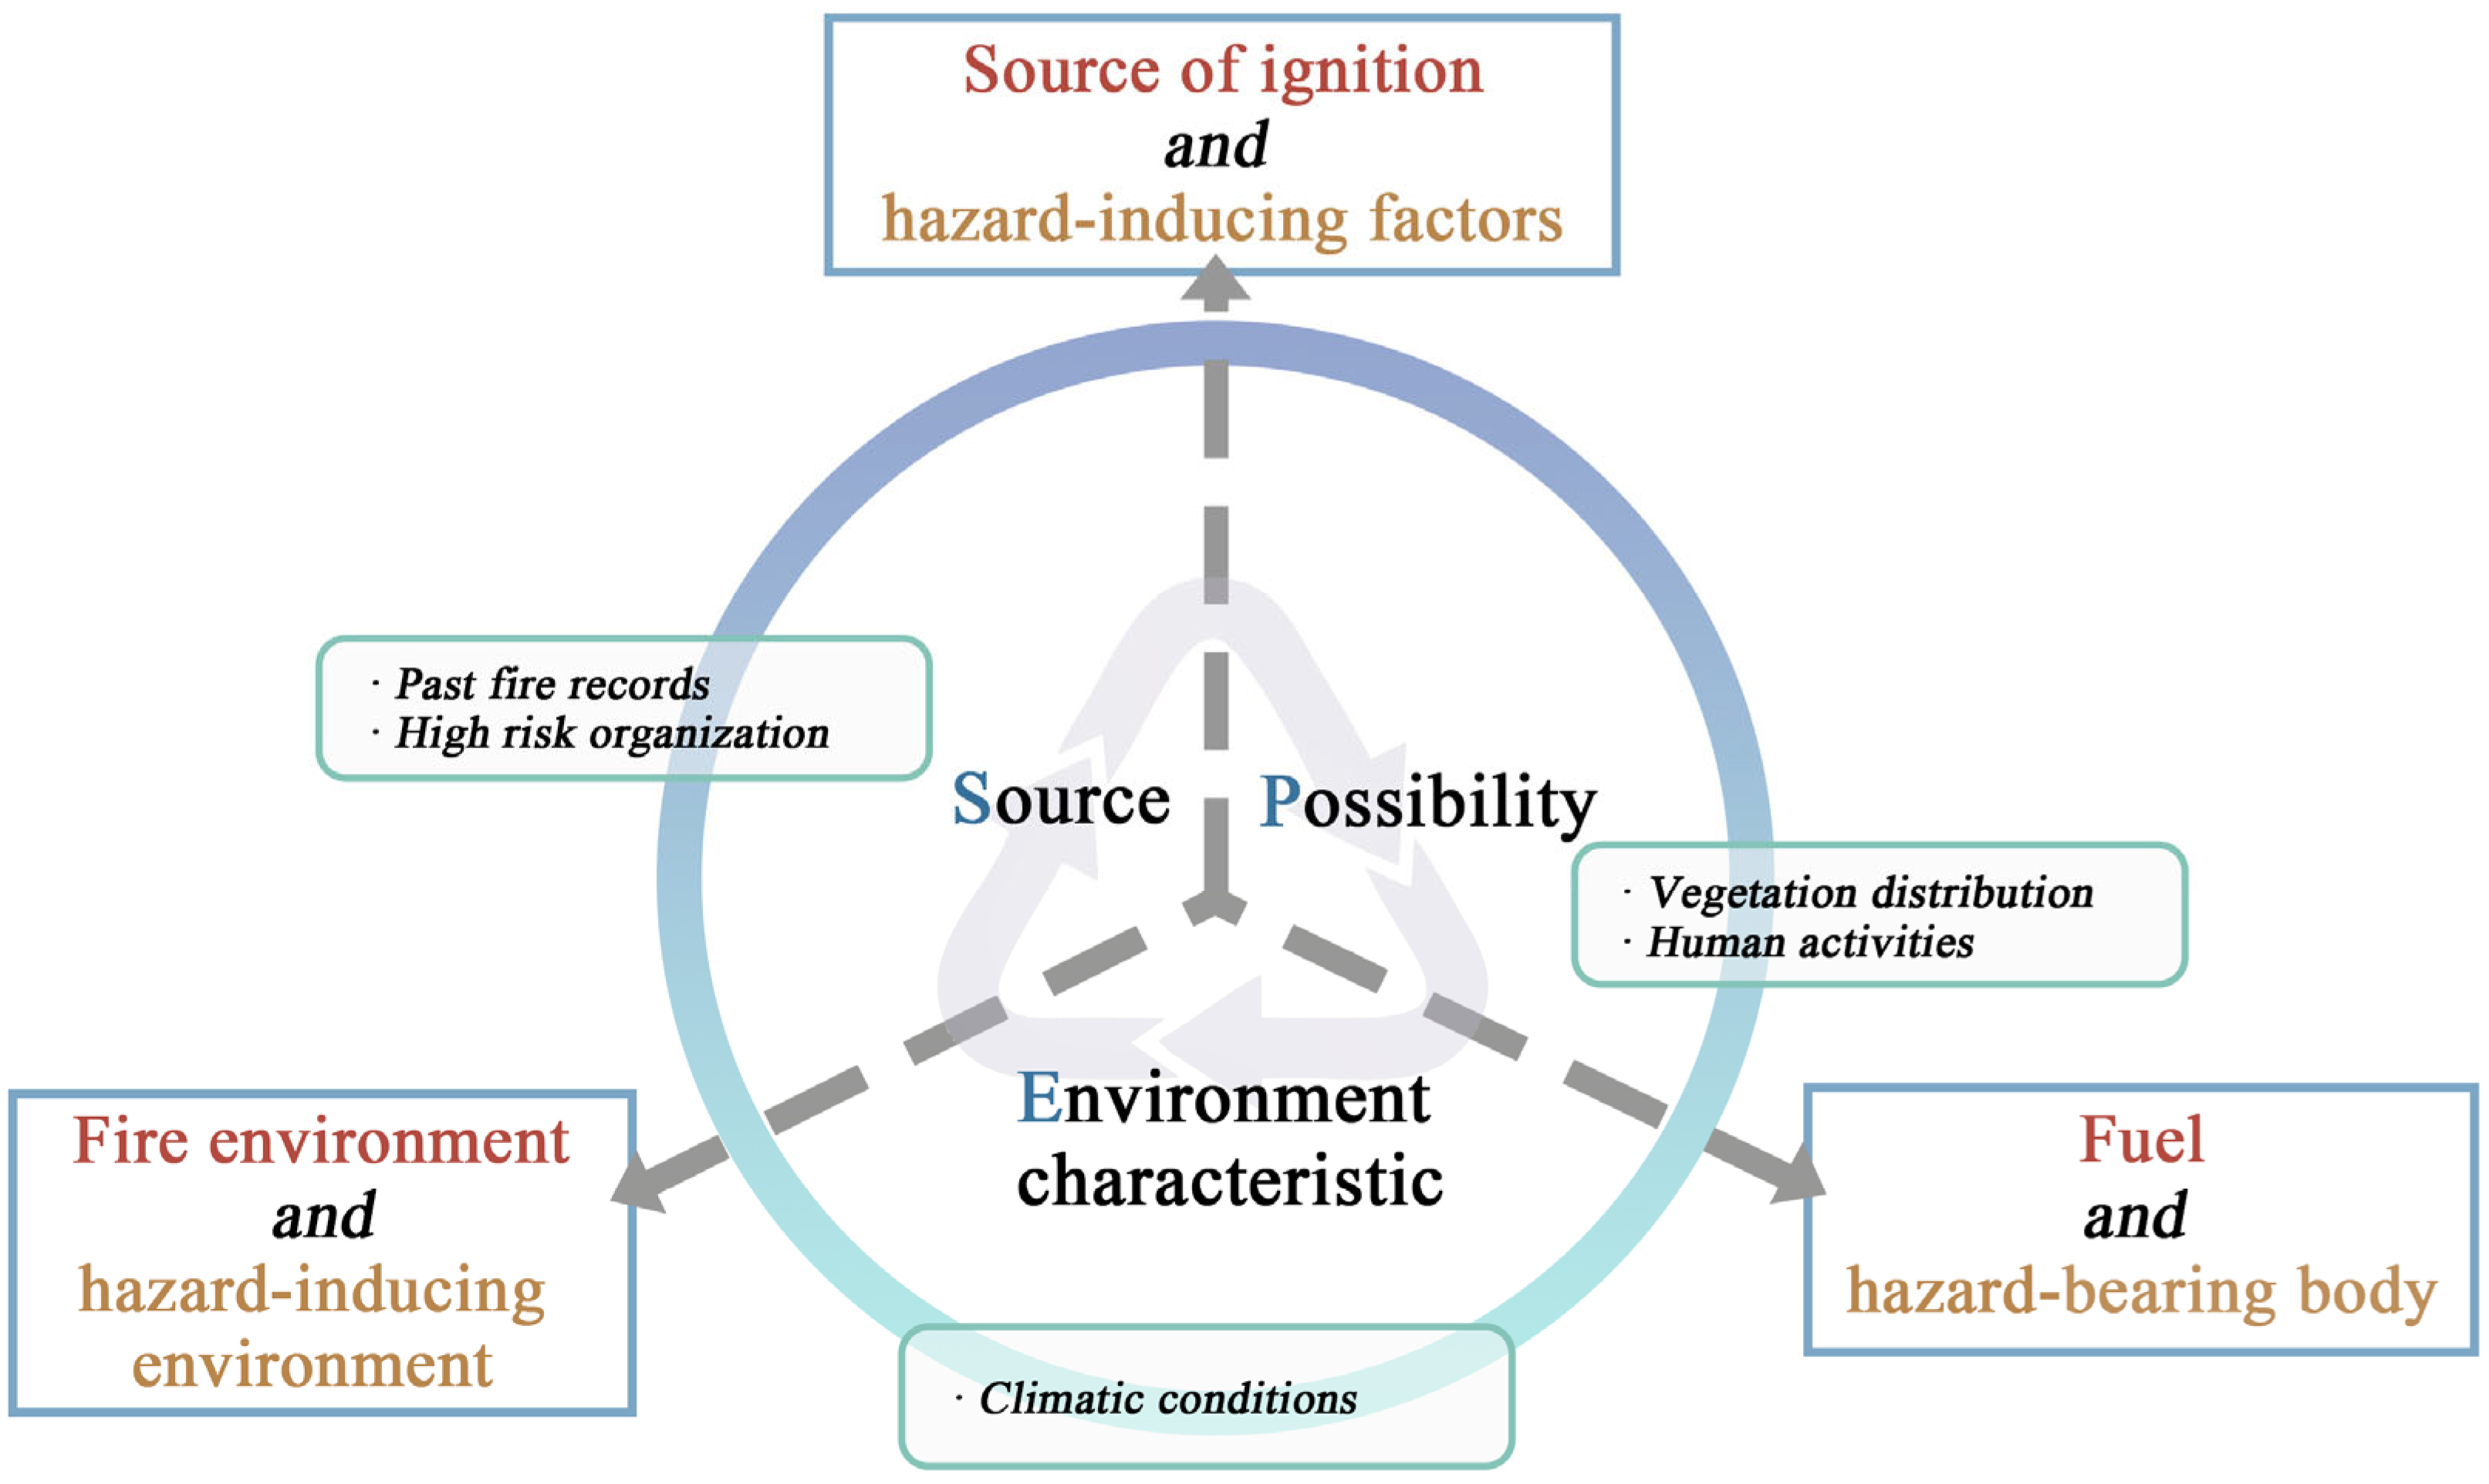
2.2.2. Urban Fire Risk Assessment System

(1)
Indicator selection
This study examines the urban green system and integrates the “fire triangle” principle and Shi’s regional disaster system theory [21]. It combines and refines fire sources, fire environment characteristics, disaster-causing factors, and disaster-prone environments, categorizing them into the likelihood of fire occurrence and fire hazard sources. The presence of combustible materials in the city serves as an indicator of system vulnerability. Ultimately, a comprehensive framework for assessing urban fire risk (Figure 2) is established. Based on this, the impact factors of urban fire are divided into three factors and divided into eleven indicators.
(2)
Weight calibration
Urban fire risk is influenced by various factors. To reduce subjectivity and consider decision-makers’ expertise, we utilize a combination of the Analytic Hierarchy Process (AHP) and Entropy Method (EM) within the framework of game theory to determine indicator weights.
Game theory-based combination weighting is extensively employed in assessing natural disaster risks. It addresses a multi-agent optimization problem, seeking consensus or compromise among different weighting methods. The primary objective is to minimize the deviation between the final weighting results and the weights assigned by the basic methods.
The essence of game theory-based combination weighting entails integrating results from diverse weighting methods. Hence, prior to employing game theory for combination weighting, a consistency test is conducted on the weighting outcomes of the two methods. The degree of consistency among different weighting methods can be expressed using a distance function. The weight W 1 calculated by the AHP and the weight W 2 calculated by the entropy weight method are played to obtain the optimal weight W 2 * :
W = α 1 W 1 W 1 T + α 2 W 2  
M i n W * W 1 2 + W * W 2 2 = M i n α 1 * W 1 + α 2 * W 1 2 + α 1 * W 1 + α 2 * W 2 W 2 2  
α 1 W 1 W 1 T + α 2 W 1 W 2 T = W 1 W 1 T α 1 W 2 W 1 T + α 2 W 2 W 2 T = W 2 W 2 T  
Therefore, the combined weight can be expressed based on game theory as follows [22]:
W * = α 1 * W 1 + α 2 * W 2 = W 1 * , W 1 * , W 1 * , , W m *  
where α 1 and α 2 are linear combination coefficients, α * is the optimal combination coefficient, and α 1 * + α 2 * = 1 , α 1 * , α 2 * 0 .
(3)
Urban fire risk assessment model
The evaluation models were constructed using the aforementioned three evaluation methods. The natural breakpoint method was employed to classify fire risks, thereby validating the effectiveness of the combination weighting method. Subsequently, a spatial distribution map of fire risks in Shanghai was generated.

2.3. Data Sources

Satellite fire location data were obtained from the annual high-resolution Landsat-8 dataset provided by the Institute of Remote Sensing and Digital Earth, Chinese Academy of Sciences. The dataset was accessed through the SatSee-Fire surface high-temperature anomaly point query service system. This study selected fire location data detected by Landsat-8 at medium to high resolution from 2019 to 2023. After examining fire images of hotspots on Google Earth, 87 vegetation fire locations were extracted, excluding non-biomass-burning pseudo hotspots.
Urban historical fire point statistics primarily rely on reported incidents. In this study, official reports from the internet government platform of the Shanghai Fire Department between 2019 and 2023 were automatically crawled, cleaned, and manually filtered using an open-source web scraper project developed in Python. This process provided the number of fire accidents, coordinate locations, and fire incident dates for each administrative district in Shanghai. Reviewing the specific fire incident reports resulted in 466 valid fire locations, including 55 vegetation fires. While these reports may not cover all fire events in Shanghai, they serve as representative urban fire incidents for studying spatiotemporal distribution patterns. The data sources are shown in Table 1.

3. Results

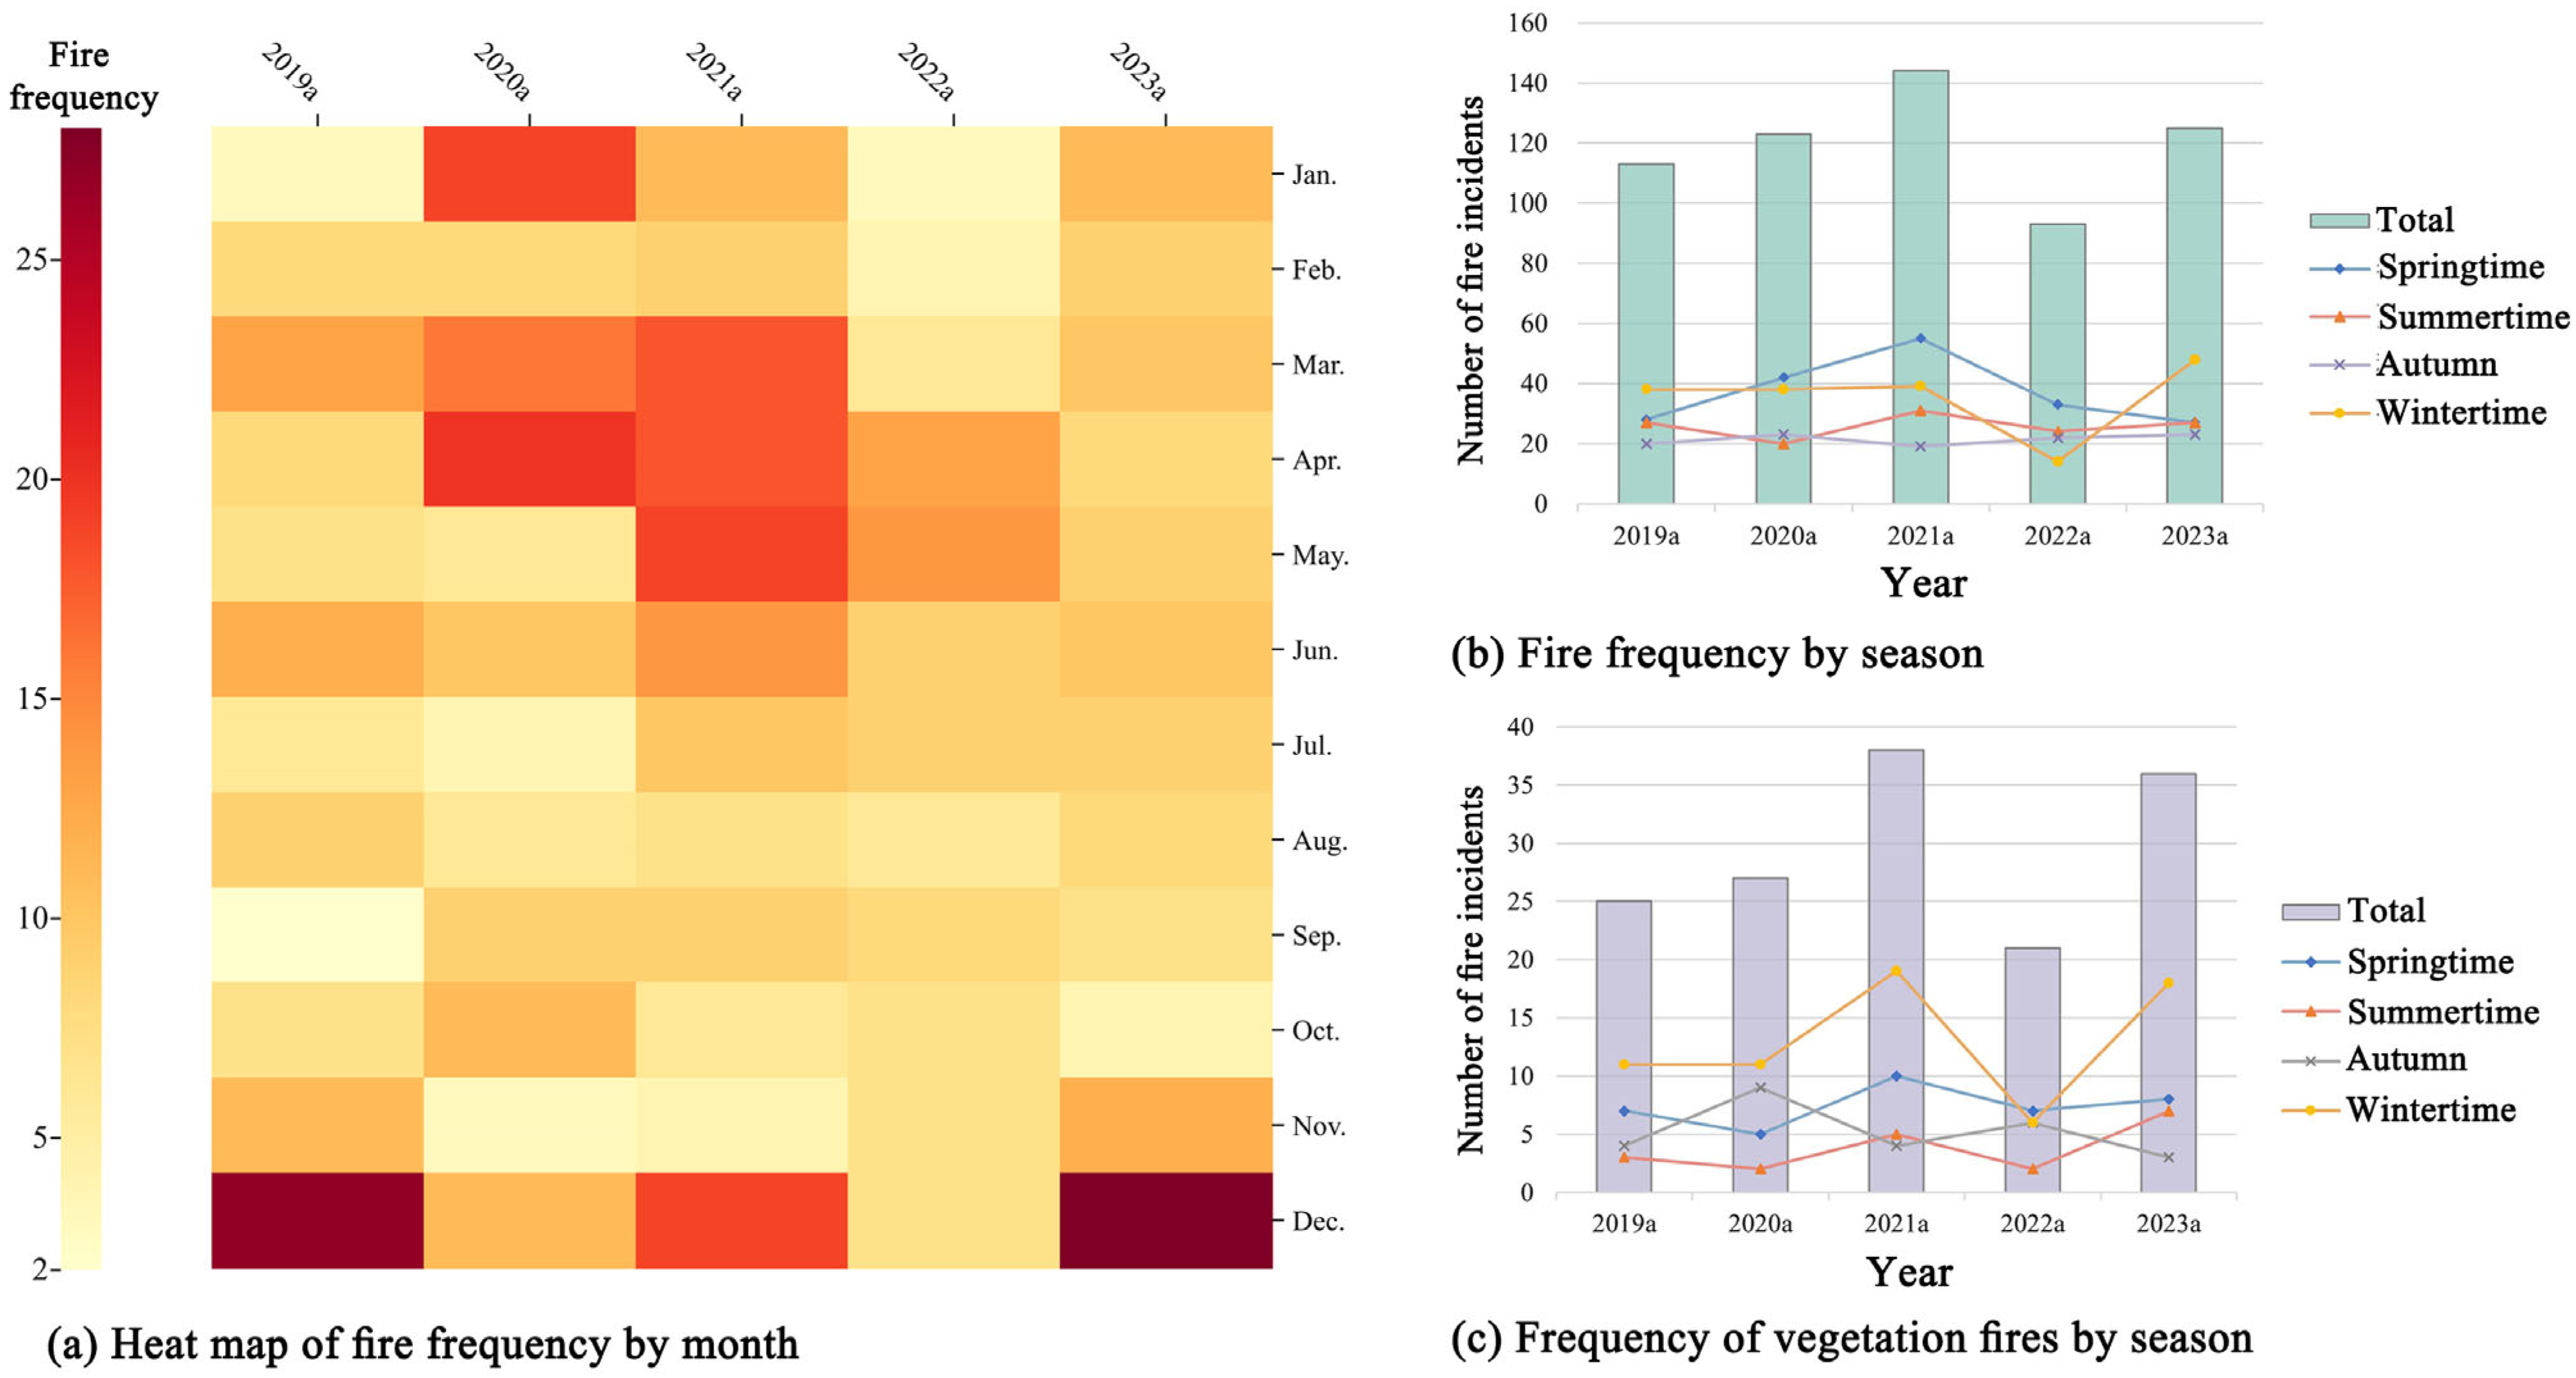
3.1. Temporal Distribution of Urban Fires

Figure 3 displays the contour plot of the real part of Morlet wavelet transform coefficients, representing the frequency of fire occurrences in Shanghai from 2019 to 2023. The analysis identifies three distinct periodic patterns at scales of 13-16a, 16-22a, and 23-25a. Notably, the 16-22a scale emerges as the dominant oscillation period. Over the entire time range, four focal points of heightened frequency are evident, indicating an overall cyclical variation of approximately 12 months.
The wavelet variance plot (Figure 4a) reveals three significant peaks at 10a, 18a, and 23a, corresponding to the two primary periods of fire occurrence frequency variation. The peak at 18a indicates the strongest oscillation in fire frequency, representing the first main period, while the peak at 23a corresponds to the second main period. Analyzing the trends of these periods (Figure 4b), the 18a scale exhibits better continuity, with an average cycle of 11.5 months, while the average cycle at the 23a scale is 14.67 months. Considering the information from the contour plot of the real part of the wavelet coefficients, the variation cycle in Shanghai over the past five years is estimated to be approximately 13 months. Consequently, the highest values of fire frequency tend to occur during the spring and winter seasons.
Analyzing the monthly fire frequency data in Shanghai from 2019 to 2023 reveals a consistent upward trend, with a notable decline in fire incidents in 2022, due to the implementation of preventive measures during the COVID-19 pandemic. Examining the data by season, Figure 5a, b illustrate that spring is the peak period for fire occurrences, with a total of 207 recorded incidents. The order of fire frequency, from highest to lowest, is winter, summer, and autumn. Specifically focusing on vegetation fires, winter shows the highest occurrence rate, with 64 incidents recorded over the past five years, followed by spring with 37 vegetation fire incidents. Therefore, it can be inferred that winter and spring seasons experience the highest frequency of fire incidents in Shanghai.

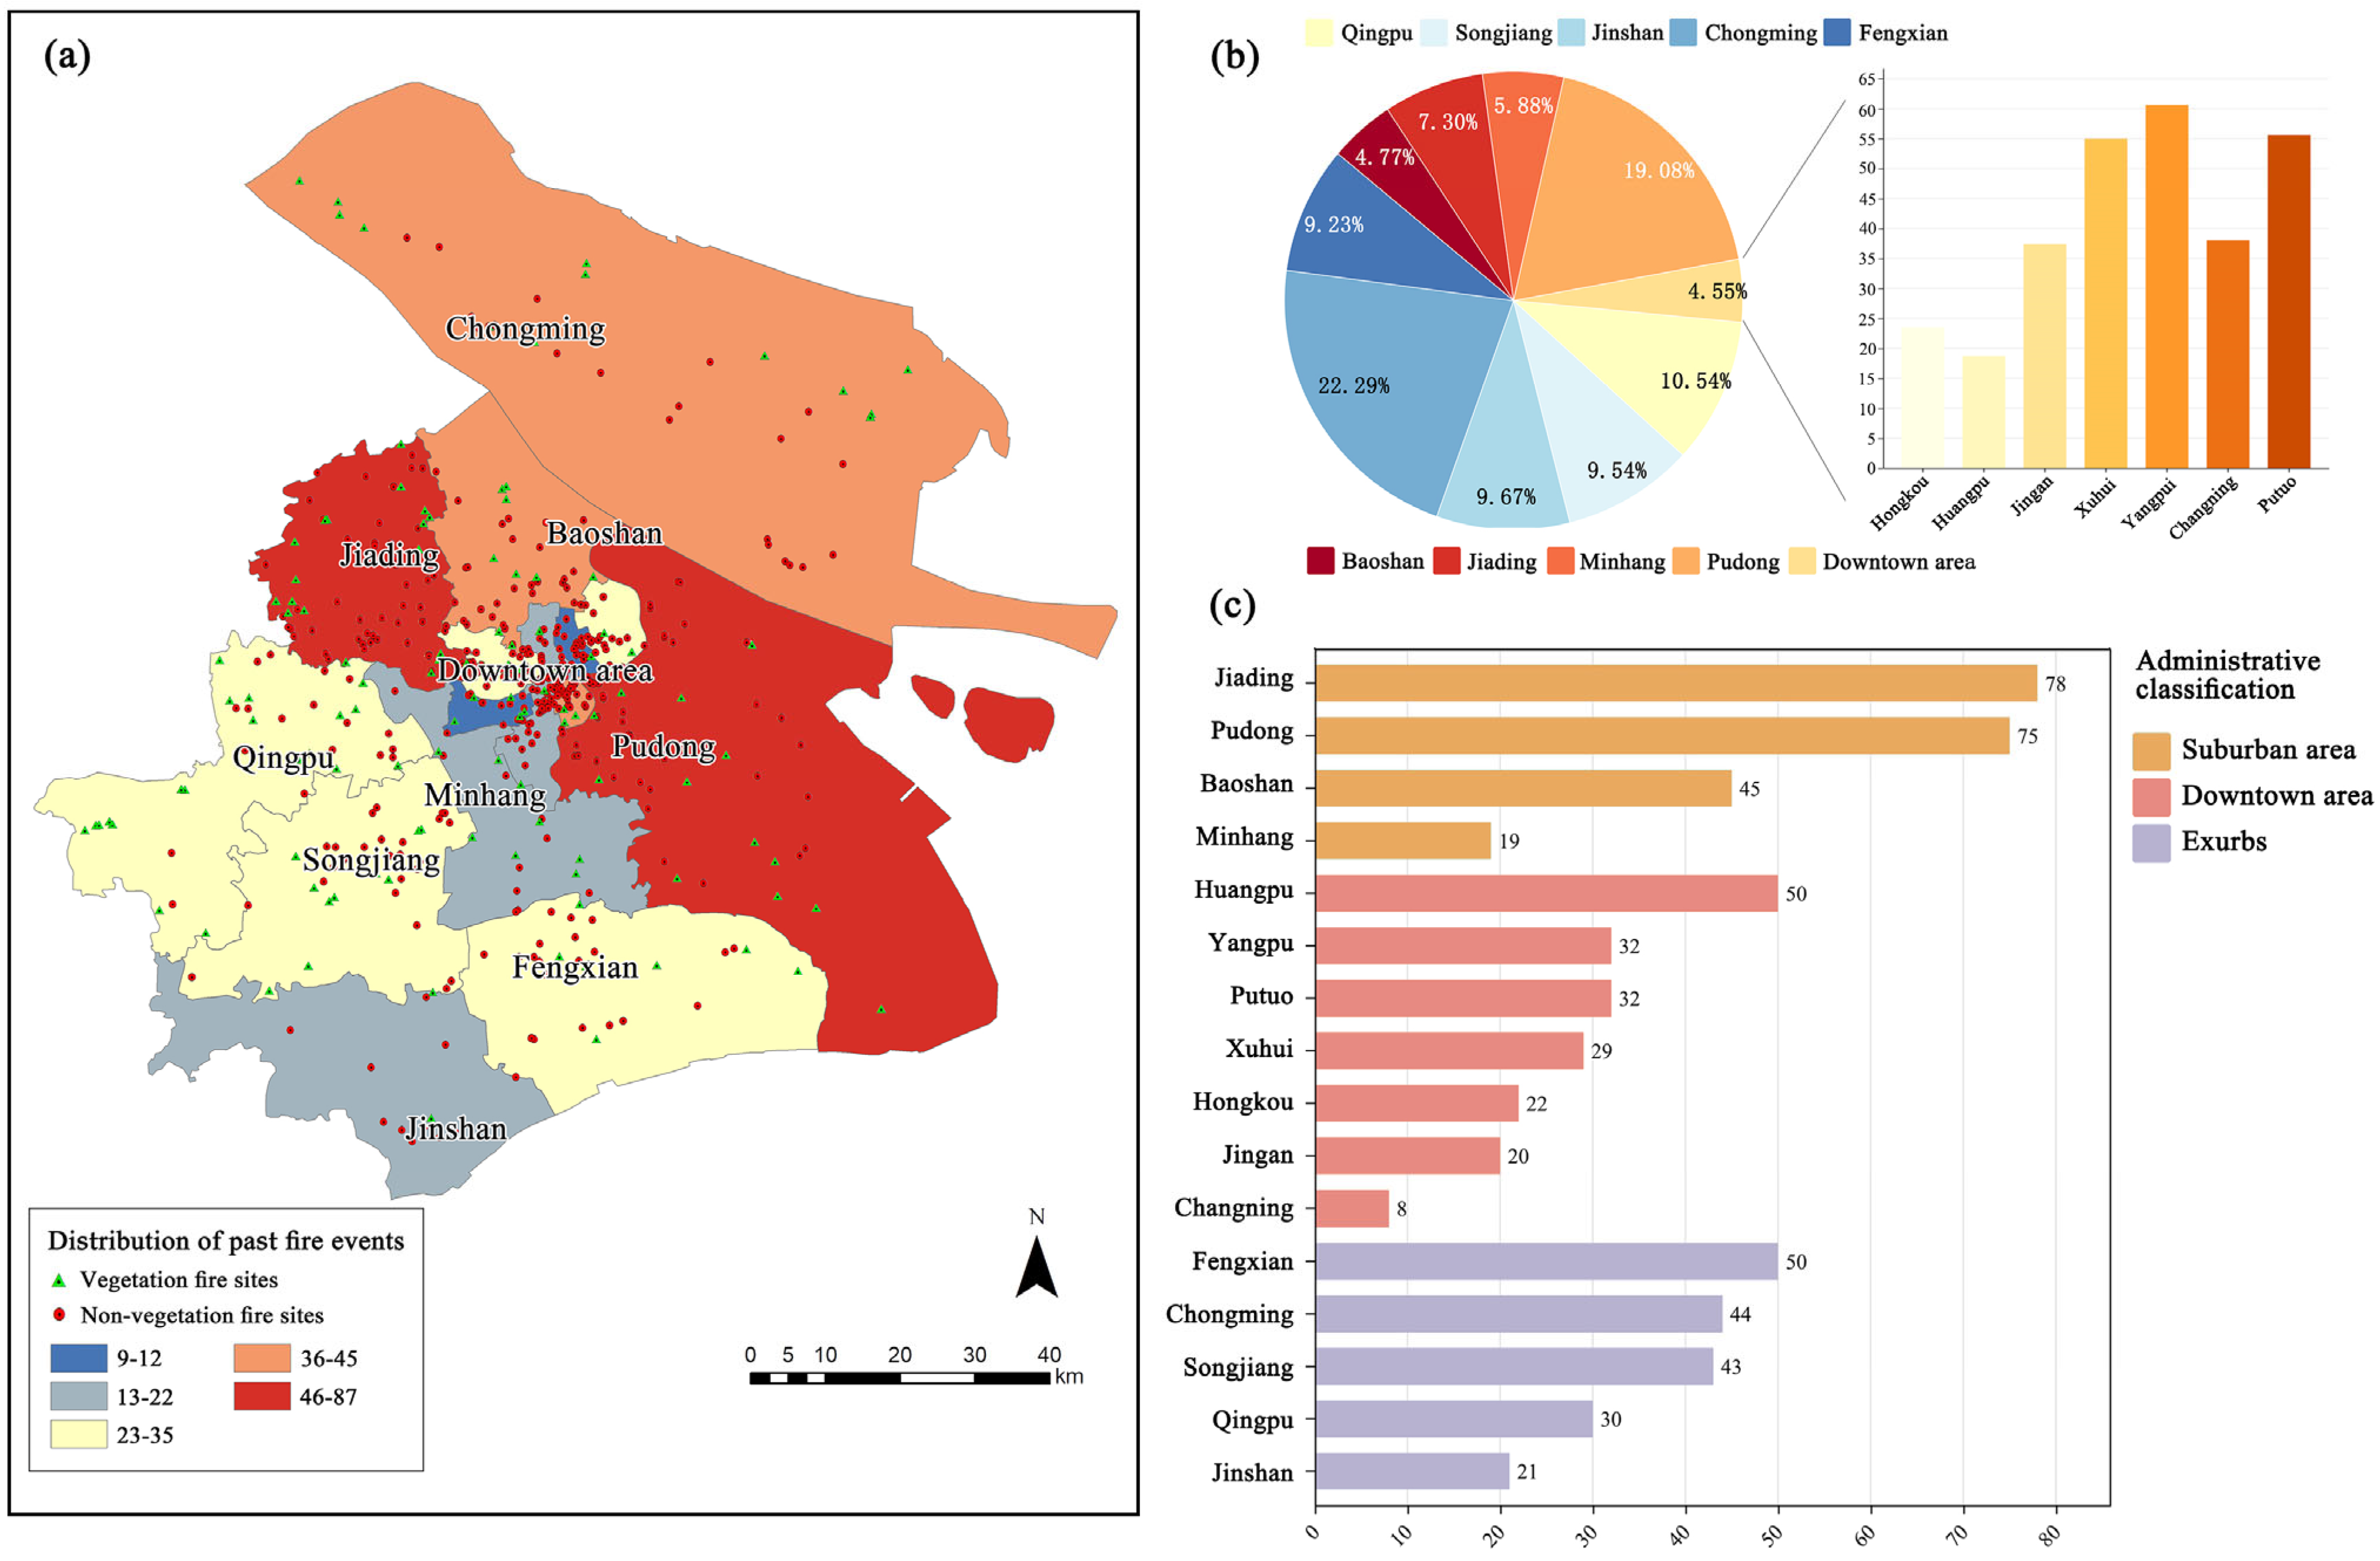
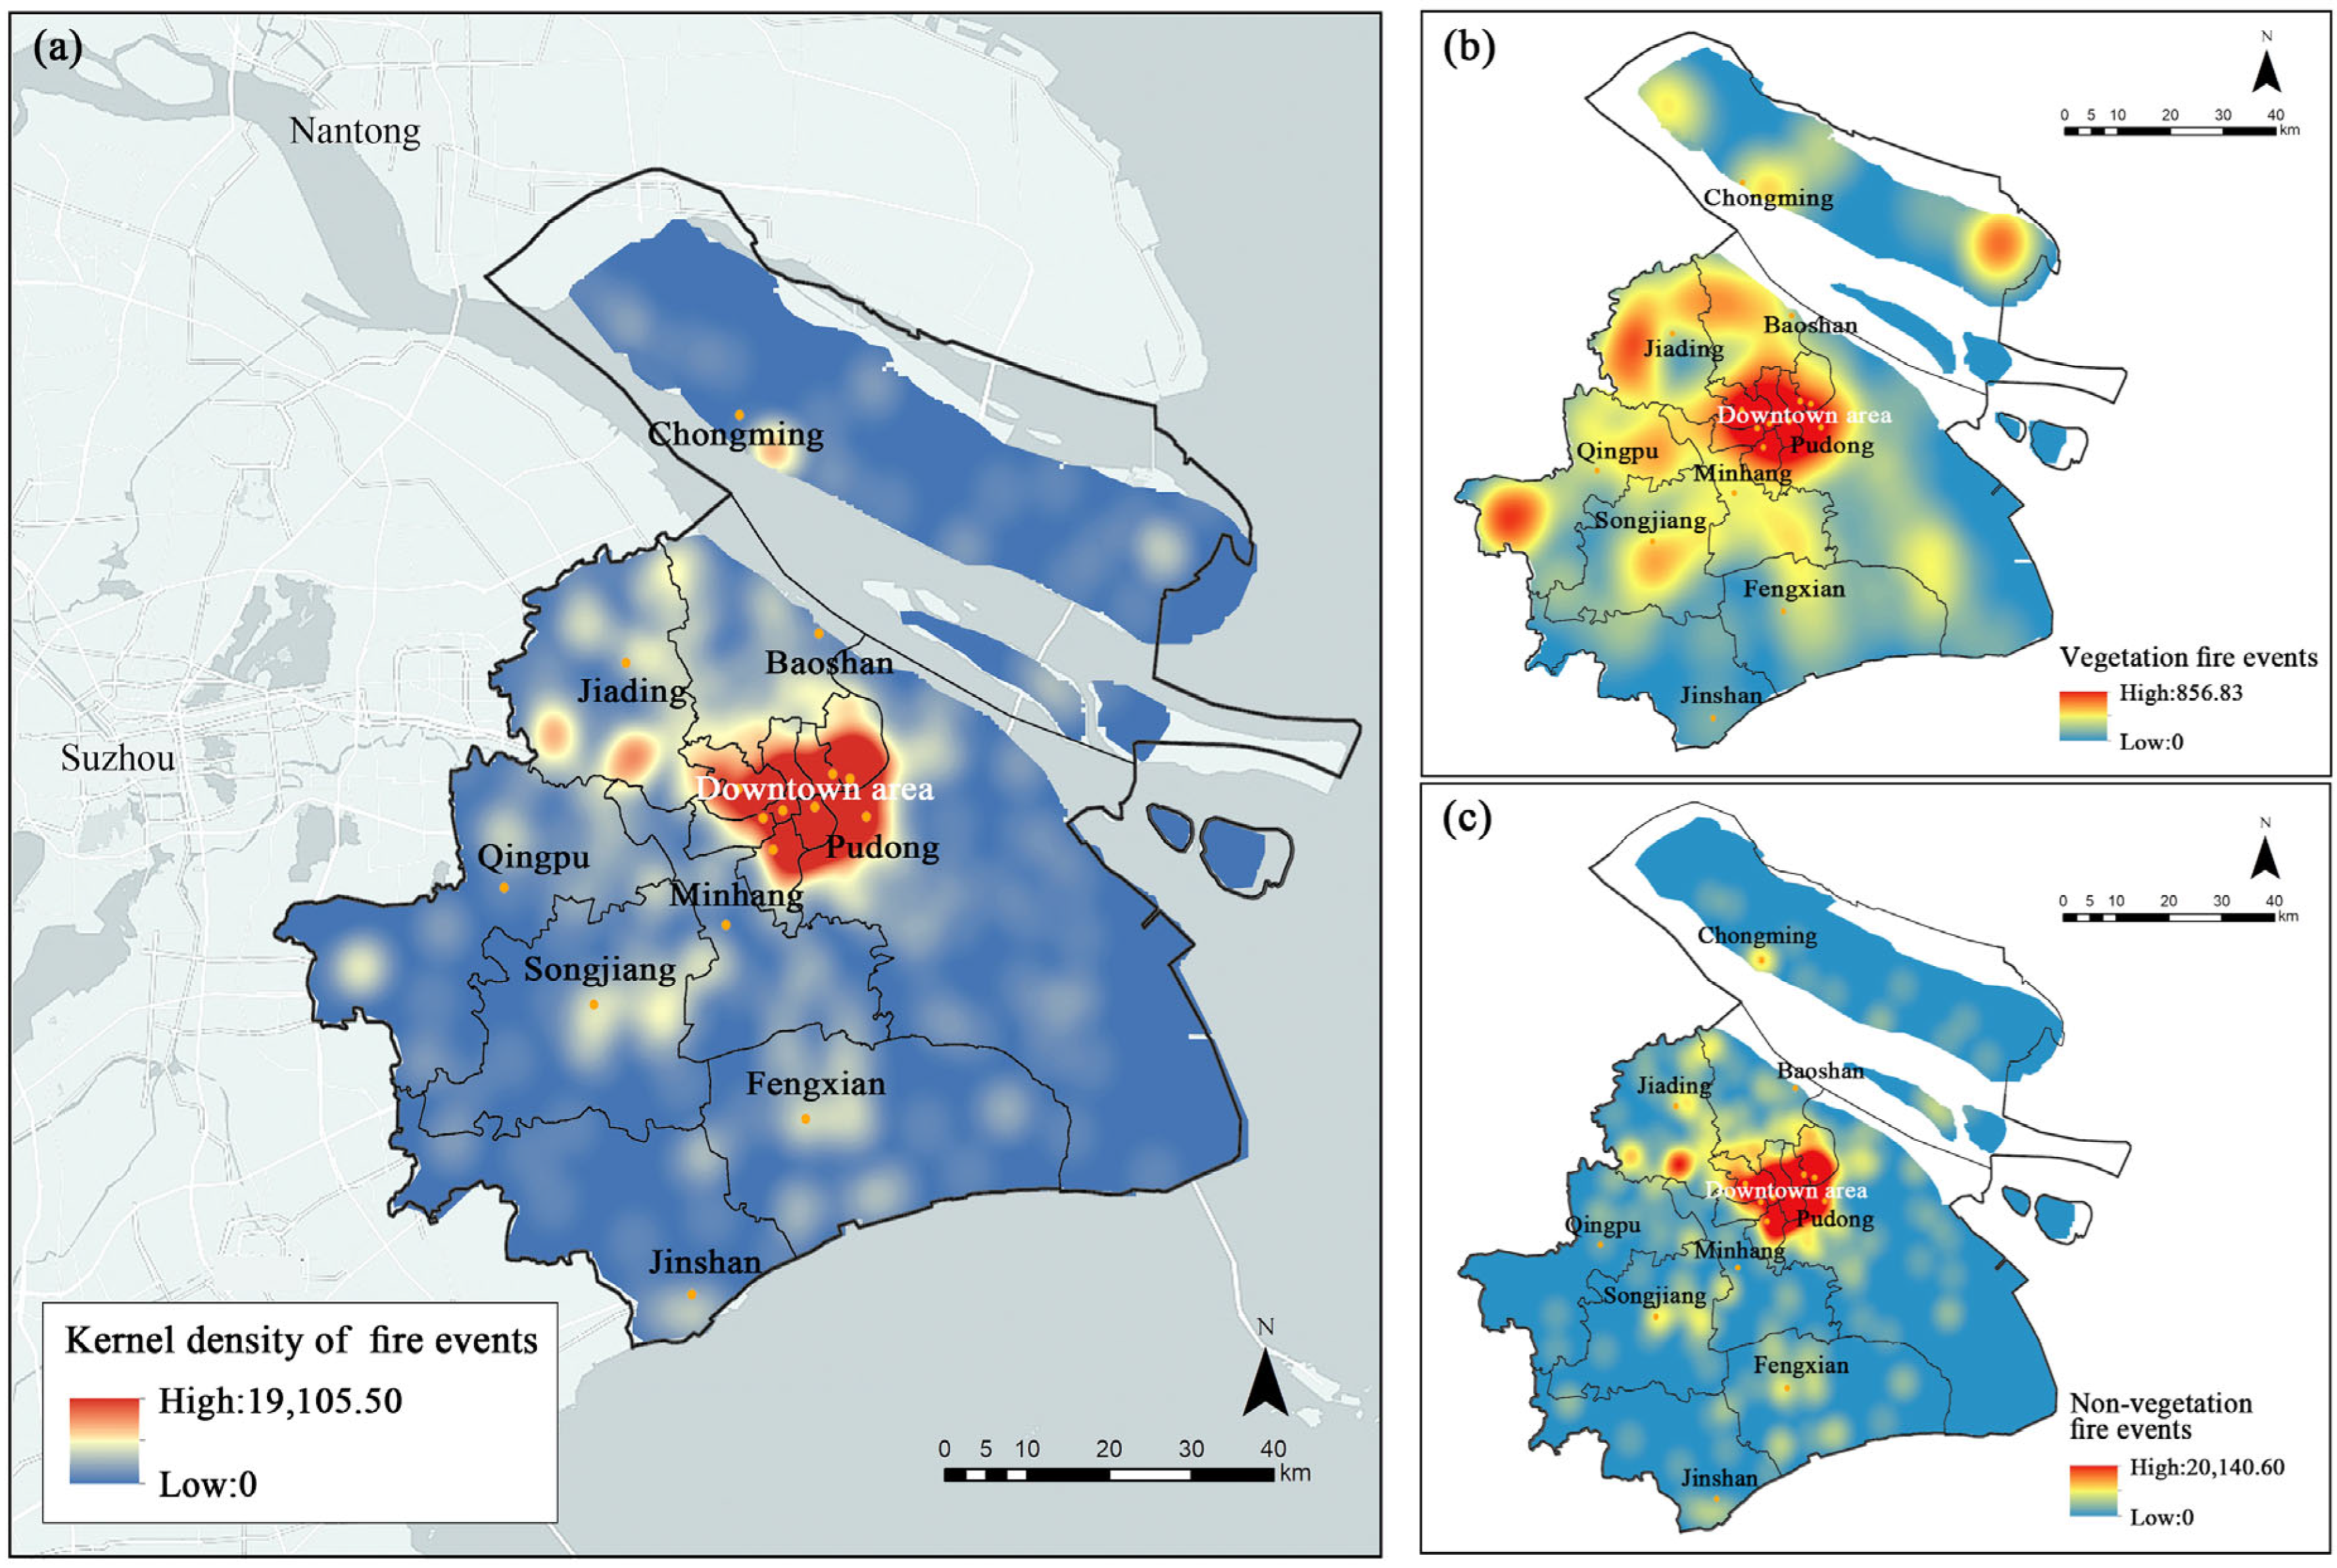
3.2. Spatial Distribution of Urban Fire

The urban fire data in Shanghai over the past five years comprise satellite records and historical statistics. Figure 6a illustrates the distribution of selected fire points, totaling 598 incidents, including 142 vegetation fires (23.74% of the total). High-fire-risk areas are identified in the city outskirts, with Jiading District and Pudong New District experiencing 78 and 75 urban fire incidents, respectively, representing 7.3% and 19.08% of Shanghai’s land area. Despite its smaller size, the central urban area exhibits a high frequency of fire incidents, particularly in the Huangpu District with 50 recorded fires. The far outskirts display relatively lower fire occurrence rates, with minimal variation among administrative districts. For instance, Fengxian District recorded the highest number of fire incidents in the far outskirts, with 50 fires between 2019 and 2023, while Jinshan District had the fewest incidents, totaling 20 during the same period (Figure 6b,c).
Kernel density estimation was employed to analyze the spatial distribution of historical fire incidents in Shanghai between 2019 and 2023. Figure 7a demonstrates a predominant concentration of fire points surrounding the city center, particularly in the northwest direction, indicating high density. While the intensity of fire points decreases towards the outskirts, scattered high-density hotspots persist in nearby suburban regions. As for vegetation fire distribution (Figure 7b), the central urban area of Shanghai, along with the northwest and southwest directions, exhibits the primary concentration. Secondary clusters are observed in Qingpu District and Jiading District. Additionally, a notable concentration of fire incidents is observed in the ring road area, with high-risk fire areas also present on Chongming Island.

3.3. Urban Fire Risk Assessment

3.3.1. Comprehensive Evaluation of Fire Risk in Shanghai

Based on the urban fire risk disaster theory, an evaluation index system is constructed. The weights from both methods undergo consistency testing, and the weight coefficients are calculated using game theory-based combination weighting. Table 2 presents the weighting results obtained from subjective weighting methods reflecting expert opinions, objective weighting methods based on data, and the comprehensive game theory-based combination weighting method.
The AHP weighting results reveal that factors such as the density of fire hazard units and density of residential area significantly impact fire risk in Shanghai. However, these results overlook the human factors like commercial and dining activities, which are often associated with urban fire incidents and secondary explosion disasters. Conversely, the entropy weighting method identifies factors such as the density of fire hazard units, density of residential area, density of food service venues, and density of vegetation fire sites as influential. Nevertheless, it fails to consider environmental factors like temperature, humidity, and urban greening, which can exacerbate fire risk.
Figure 8 depicts the clustering characteristics of urban fires in Shanghai. The central urban area and surrounding regions, namely, Jing’an District, Huangpu District, and Hongkou District, are identified as high- and relatively high-fire-risk areas. Furthermore, significant portions of Pudong New District, which adjoins the central urban area in the northwest, also exhibit high- and relatively high-fire-risk zones. The trend surface map of urban fire risk in Shanghai reveals two fire trend lines, indicating low risk at both ends and high risk in the middle. This clearly demonstrates the central clustering nature of urban fires in Shanghai. In addition to the extremely high values in the downtown area, there are two sub-centers surrounding it, demonstrating a dispersed clustering pattern. Moreover, while moderate-fire-risk areas are more widely distributed compared to high-fire-risk areas, their spatial structure aligns with the overall pattern. Moderate-fire-risk areas are present not only in the central urban area and its surroundings but also in the outskirts of the city, distinguishing them from the relatively high-fire-risk areas.
Table 3 reveals that the low-fire-risk area in Shanghai has the widest coverage, spanning 3013.01 km2 or 47.52% of the total area. The relatively low-fire-risk and moderate-fire-risk areas follow, accounting for 34.36% and 15.13%, respectively. In contrast, the high- and relatively high-fire-risk areas encompass 189.58 km2, constituting 2.99% of the total area. Moreover, there is a notable disparity in fire risk zoning between the AHP and EW methods, highlighting the uncertainty in fire risk assessment when employing different weighting methods.

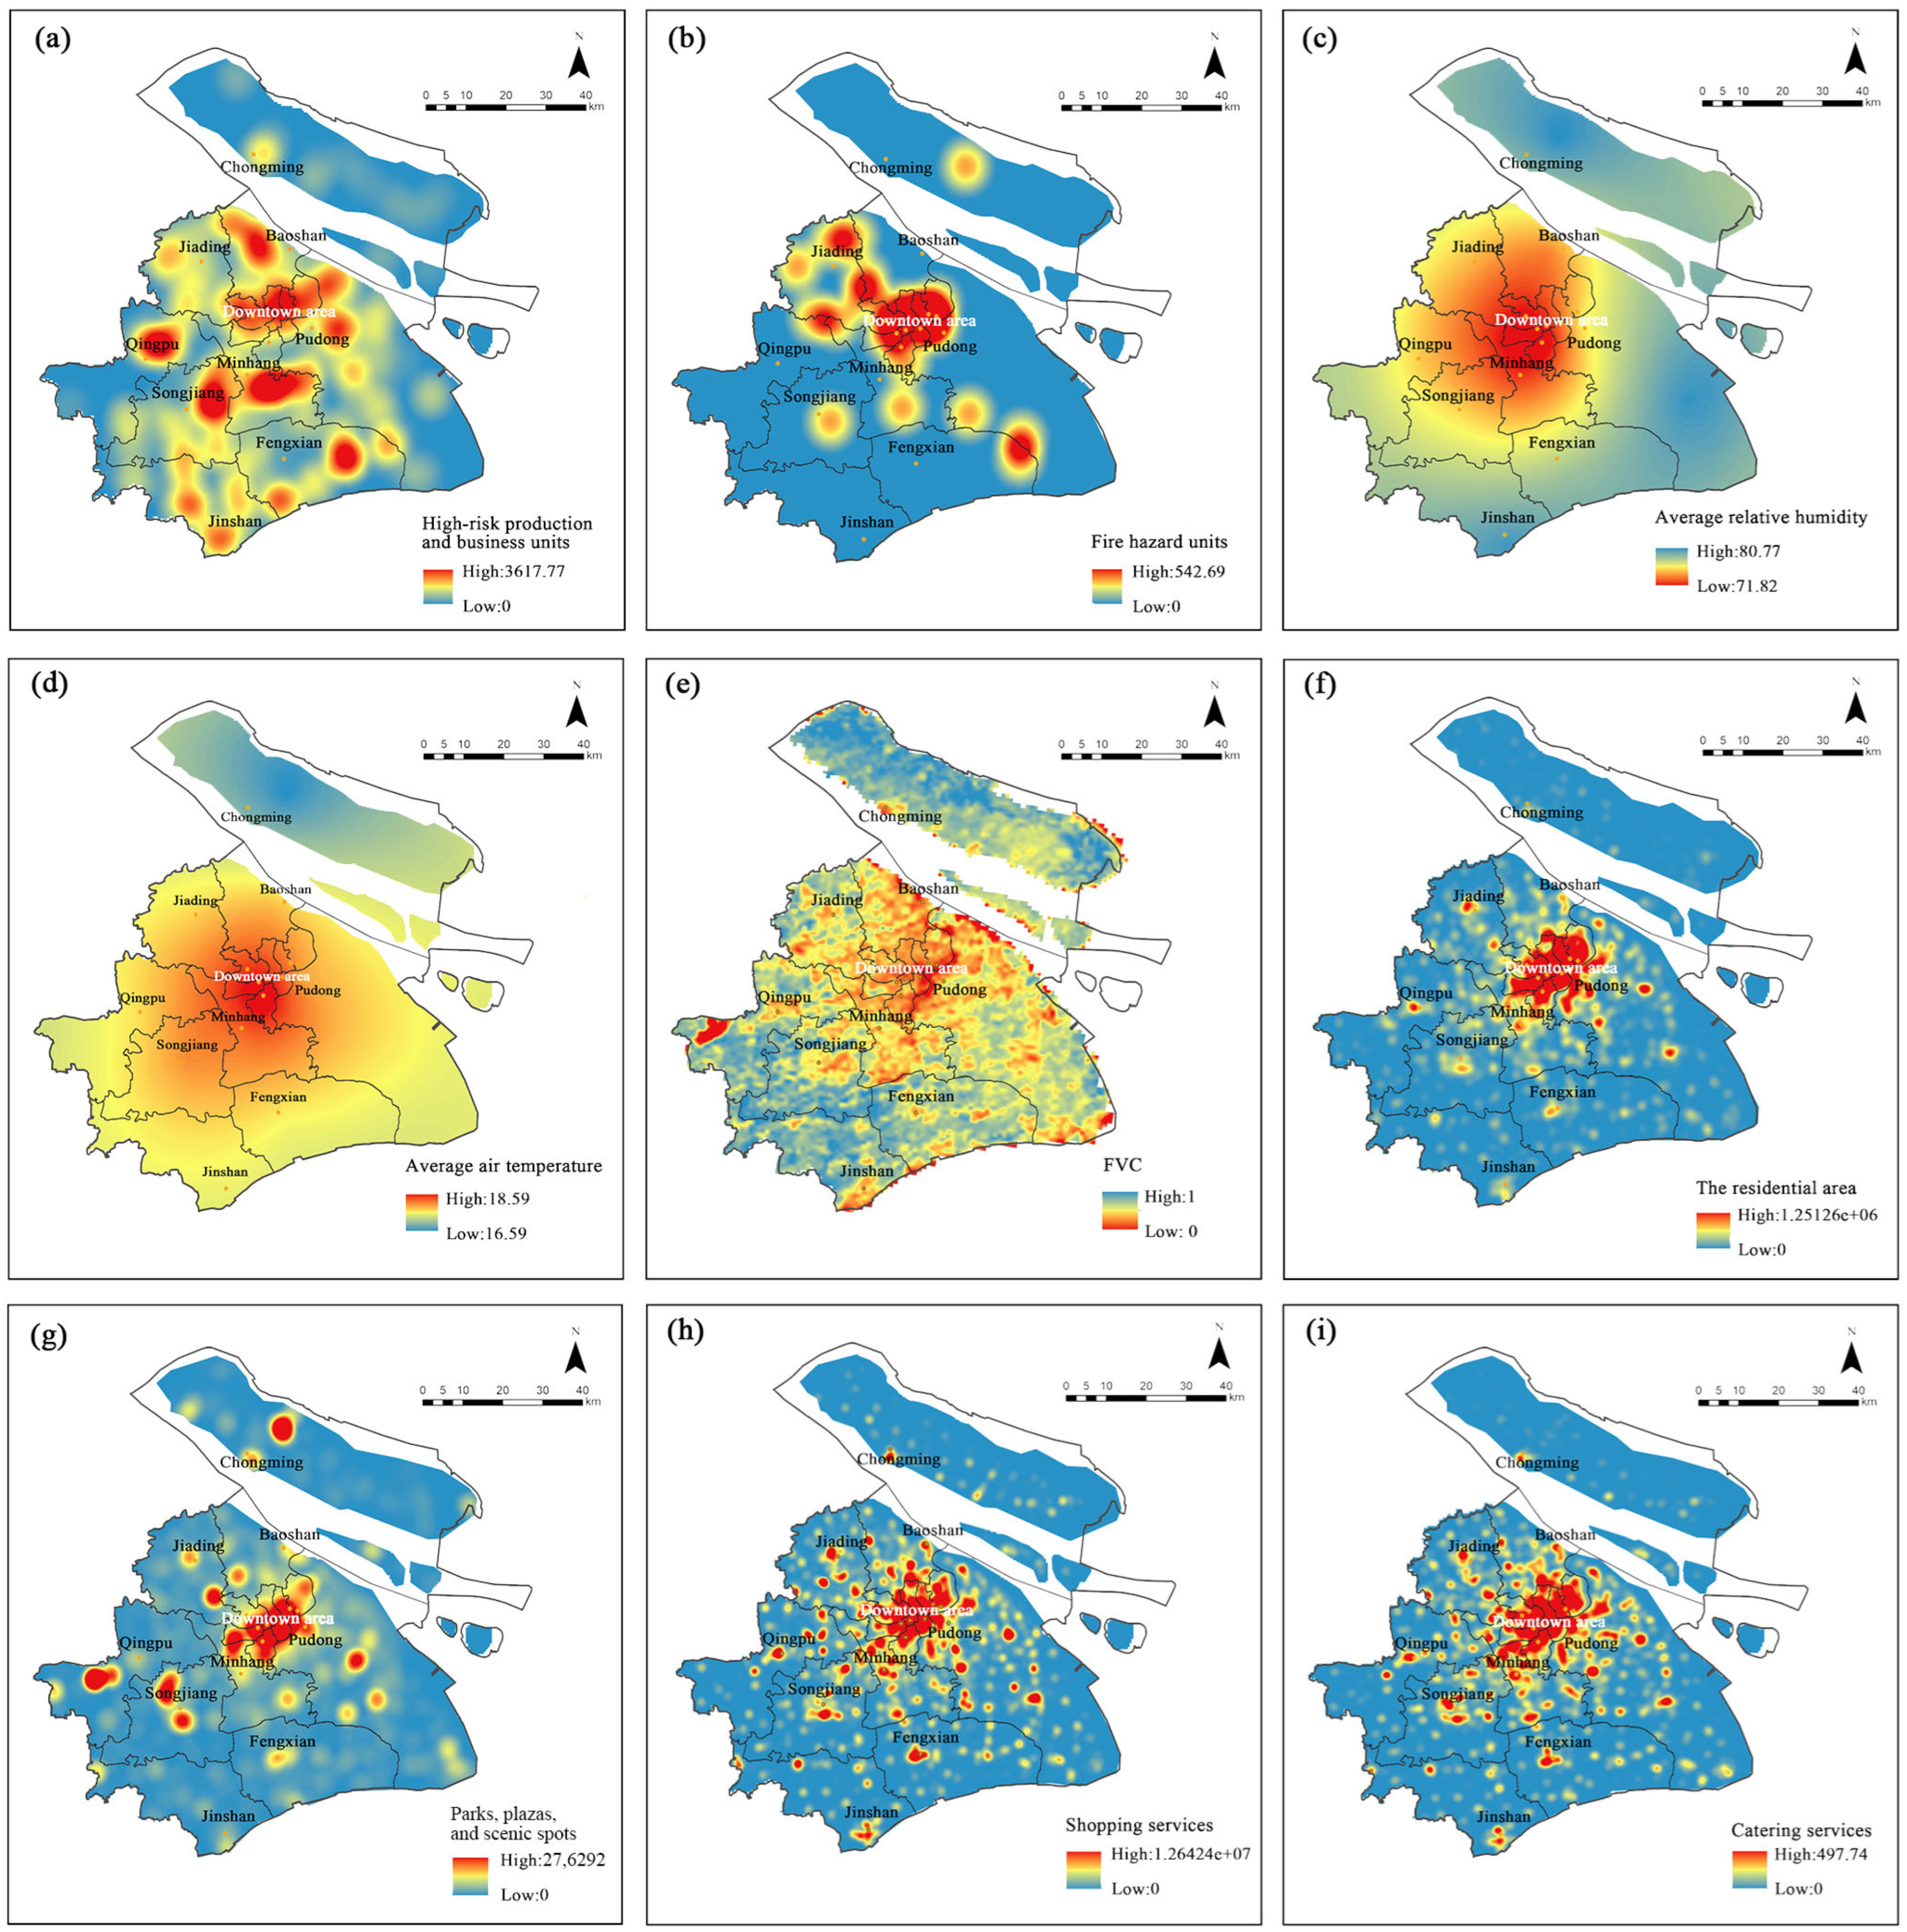
3.3.2. Spatial Distribution of Indicators

The distribution factors of past fire incidents have been detailed in Section 3.2.
High-risk production and business units include establishments involved in hazardous material production, operations, or management, such as metal smelting, road transportation, construction, and hazardous chemical industries. Due to the nature of their activities, these units are susceptible to various safety hazards, including fire, explosions, and mechanical accidents. Consequently, they are predominantly situated in suburban areas, particularly in the central part of Minhang District, the eastern part of Songjiang District, the northeast part of Qingpu District, and the eastern part of Fengxian District (Figure 9a).
Fire hazard units are characterized by their non-compliance with fire laws, regulations, or technical standards during their daily operations or management. They possess the potential to initiate or exacerbate fires; hinder personnel evacuation, firefighting, and rescue operations; and introduce unsafe conditions. These units are primarily distributed in the central area, Baoshan District, and the transitional zone between Fengxian District and Pudong New District (Figure 9b).
The temperature in the central area of Shanghai is often higher than that in the suburbs (Figure 9c), leading to the formation of an urban heat island effect, which is closely linked to a high level of urbanization. Due to the moderating influence of the ocean, the temperature variation in the coastal area is relatively moderate and humidity levels are comparatively high (Figure 9d).
Vegetation plays a crucial role in urban ecosystems, providing benefits such as aesthetics, air purification, and climate regulation. However, as natural combustible materials, vegetation is closely linked to the occurrence, development, and spread of urban fires. Analysis of Shanghai’s vegetation distribution (Figure 9e) reveals generally high coverage, with approximately 40% of the urban built-up area covered by green plants. The outskirts, particularly in Chongming District, Qingpu District, and Jinshan District, have significantly dense forest coverage, creating continuous combustible spaces that facilitate rapid fire propagation. Consequently, areas with high vegetation coverage pose a higher risk of fire incidents.
Human activity in Shanghai revolves around residential areas, shopping districts, dining establishments, parks, and tourist attractions. The kernel density distribution map clearly indicates that the downtown area is the primary hub of population activity, mainly concentrated within the Inner Ring Road. Significant human activity is also present near the Middle Ring Road and certain sections of the Outer Ring Road. The high-density and moderately high-density clusters of shopping and dining services surrounding the central urban area correspond to major business districts, commercial zones, universities, and research parks. For instance, notable locations include the Lujiazui Financial and Trade Zone in Pudong New District, the Hongqiao Business District in Minhang District, and Songjiang University Town in Songjiang District (Figure 9f,g). In the suburban and exurban residential areas near the Middle Ring Road, high-density points coincide with rail transit lines, particularly at interchange stations. This can be attributed to the prominence of rail transit as Shanghai’s primary mode of public transportation, resulting in the concentration of residential and commercial areas along these routes. Examples include Xinzhuang Station in Minhang District and Longyang Road Station in Pudong New District (Figure 9h).
Notably, renowned scenic spots in Shanghai are predominantly located in the central urban area, particularly in Huangpu District, such as the Bund, Yu Garden, and Tianzifang. These attractions experience a surge in visitors, both local and out-of-town, during holidays and peak tourist seasons, leading to temporary population concentrations. Parks and squares are more evenly distributed, with a historical emphasis on city center locations. However, recent years have witnessed the development of numerous parks and green spaces in the suburbs, resulting in a relatively equal density for leisurely walks across various suburban administrative districts (Figure 9i).

4. Discussion

4.1. The Main Factors Affecting the Occurrence of Fire in Shanghai

According to the Fire Triangle theory, combustion relies on three essential elements: combustible material (fuel), oxygen, and heat. In urban areas, combustible materials can be classified into vegetation and non-vegetation types, resulting in a complex composition [23]. Climatic factors, such as temperature and humidity, significantly influence the heat component in the combustion process [24].
Fire incidents in Shanghai have shown higher frequency and concentration during the spring and winter seasons, while summer and autumn seasons see fewer and more scattered occurrences. The clustering or dispersal of urban fires is closely linked to human activities within the study area. In terms of human factors, in spring season, increased agricultural activities, such as straw burning and weed clearing, contribute to fire incidents. In winter, the cold outdoor temperatures drive residents to engage in indoor activities, leading to heightened usage of heating devices and electricity, which increases fire risks [25]. Moreover, both spring and winter coincide with traditional festivals and celebrations. The Qingming Festival in spring involves burning paper money as an ancestral tribute, which is a prevalent practice, while the Chinese New Year and Lantern Festival in winter feature fireworks and firecrackers, posing additional fire hazards. Climate factors further contribute to the frequency of urban fire incidents. In spring, rising temperatures coupled with dry air and frequent strong winds make combustible materials more susceptible to ignition. In winter, low humidity and dry weather conditions promote static electricity accumulation and sustained flames, heightening the risk of fire incidents.
Furthermore, the occurrence of vegetation fires in spring and winter aligns with the vegetation growth cycle. Spring’s vigorous plant growth creates a mix of new branches, leaves, and accumulated debris, providing ample flammable material. In contrast, winter sees vegetation decline, leaving dry branches and fallen leaves to accumulate on the ground, coupled with low moisture content in plants, making them highly combustible [26].
The suburban areas of Shanghai have a high green coverage rate, primarily due to the distribution of urban greenbelts. This abundance of green spaces, combined with frequent human interaction, increases the risk of fire accidents in these regions. Furthermore, these suburban areas are home to industrial zones and logistics warehouses where flammable and explosive substances are commonly used and stored, posing a high risk of large-scale fires.
In contrast, the frequent fires in the central urban areas of Shanghai are influenced by their unique geographical environment. These areas experience the urban heat island effect and often have a microclimate characterized by high temperatures and low humidity. The high building density in these regions facilitates the rapid spread of fires once ignited. Moreover, the presence of aging facilities and inadequate maintenance in many old residential communities further elevates the risk of fire incidents. Human factors also contribute significantly to the occurrence of fires in the central urban areas, including improper indoor parking of electric bicycles, careless worship practices, and improper disposal of cigarette butts by residents, all of which can act as triggers for urban fires [27].
In the far suburban areas of Shanghai, fire incidents exhibit different characteristics. These incidents are often associated with self-built houses, which pose significant safety hazards due to the lack of necessary fire safety renovations and updates. Additionally, the far suburban areas have abandoned old buildings, ongoing construction sites, and densely vegetated areas, all of which serve as potential fire hazard zones.

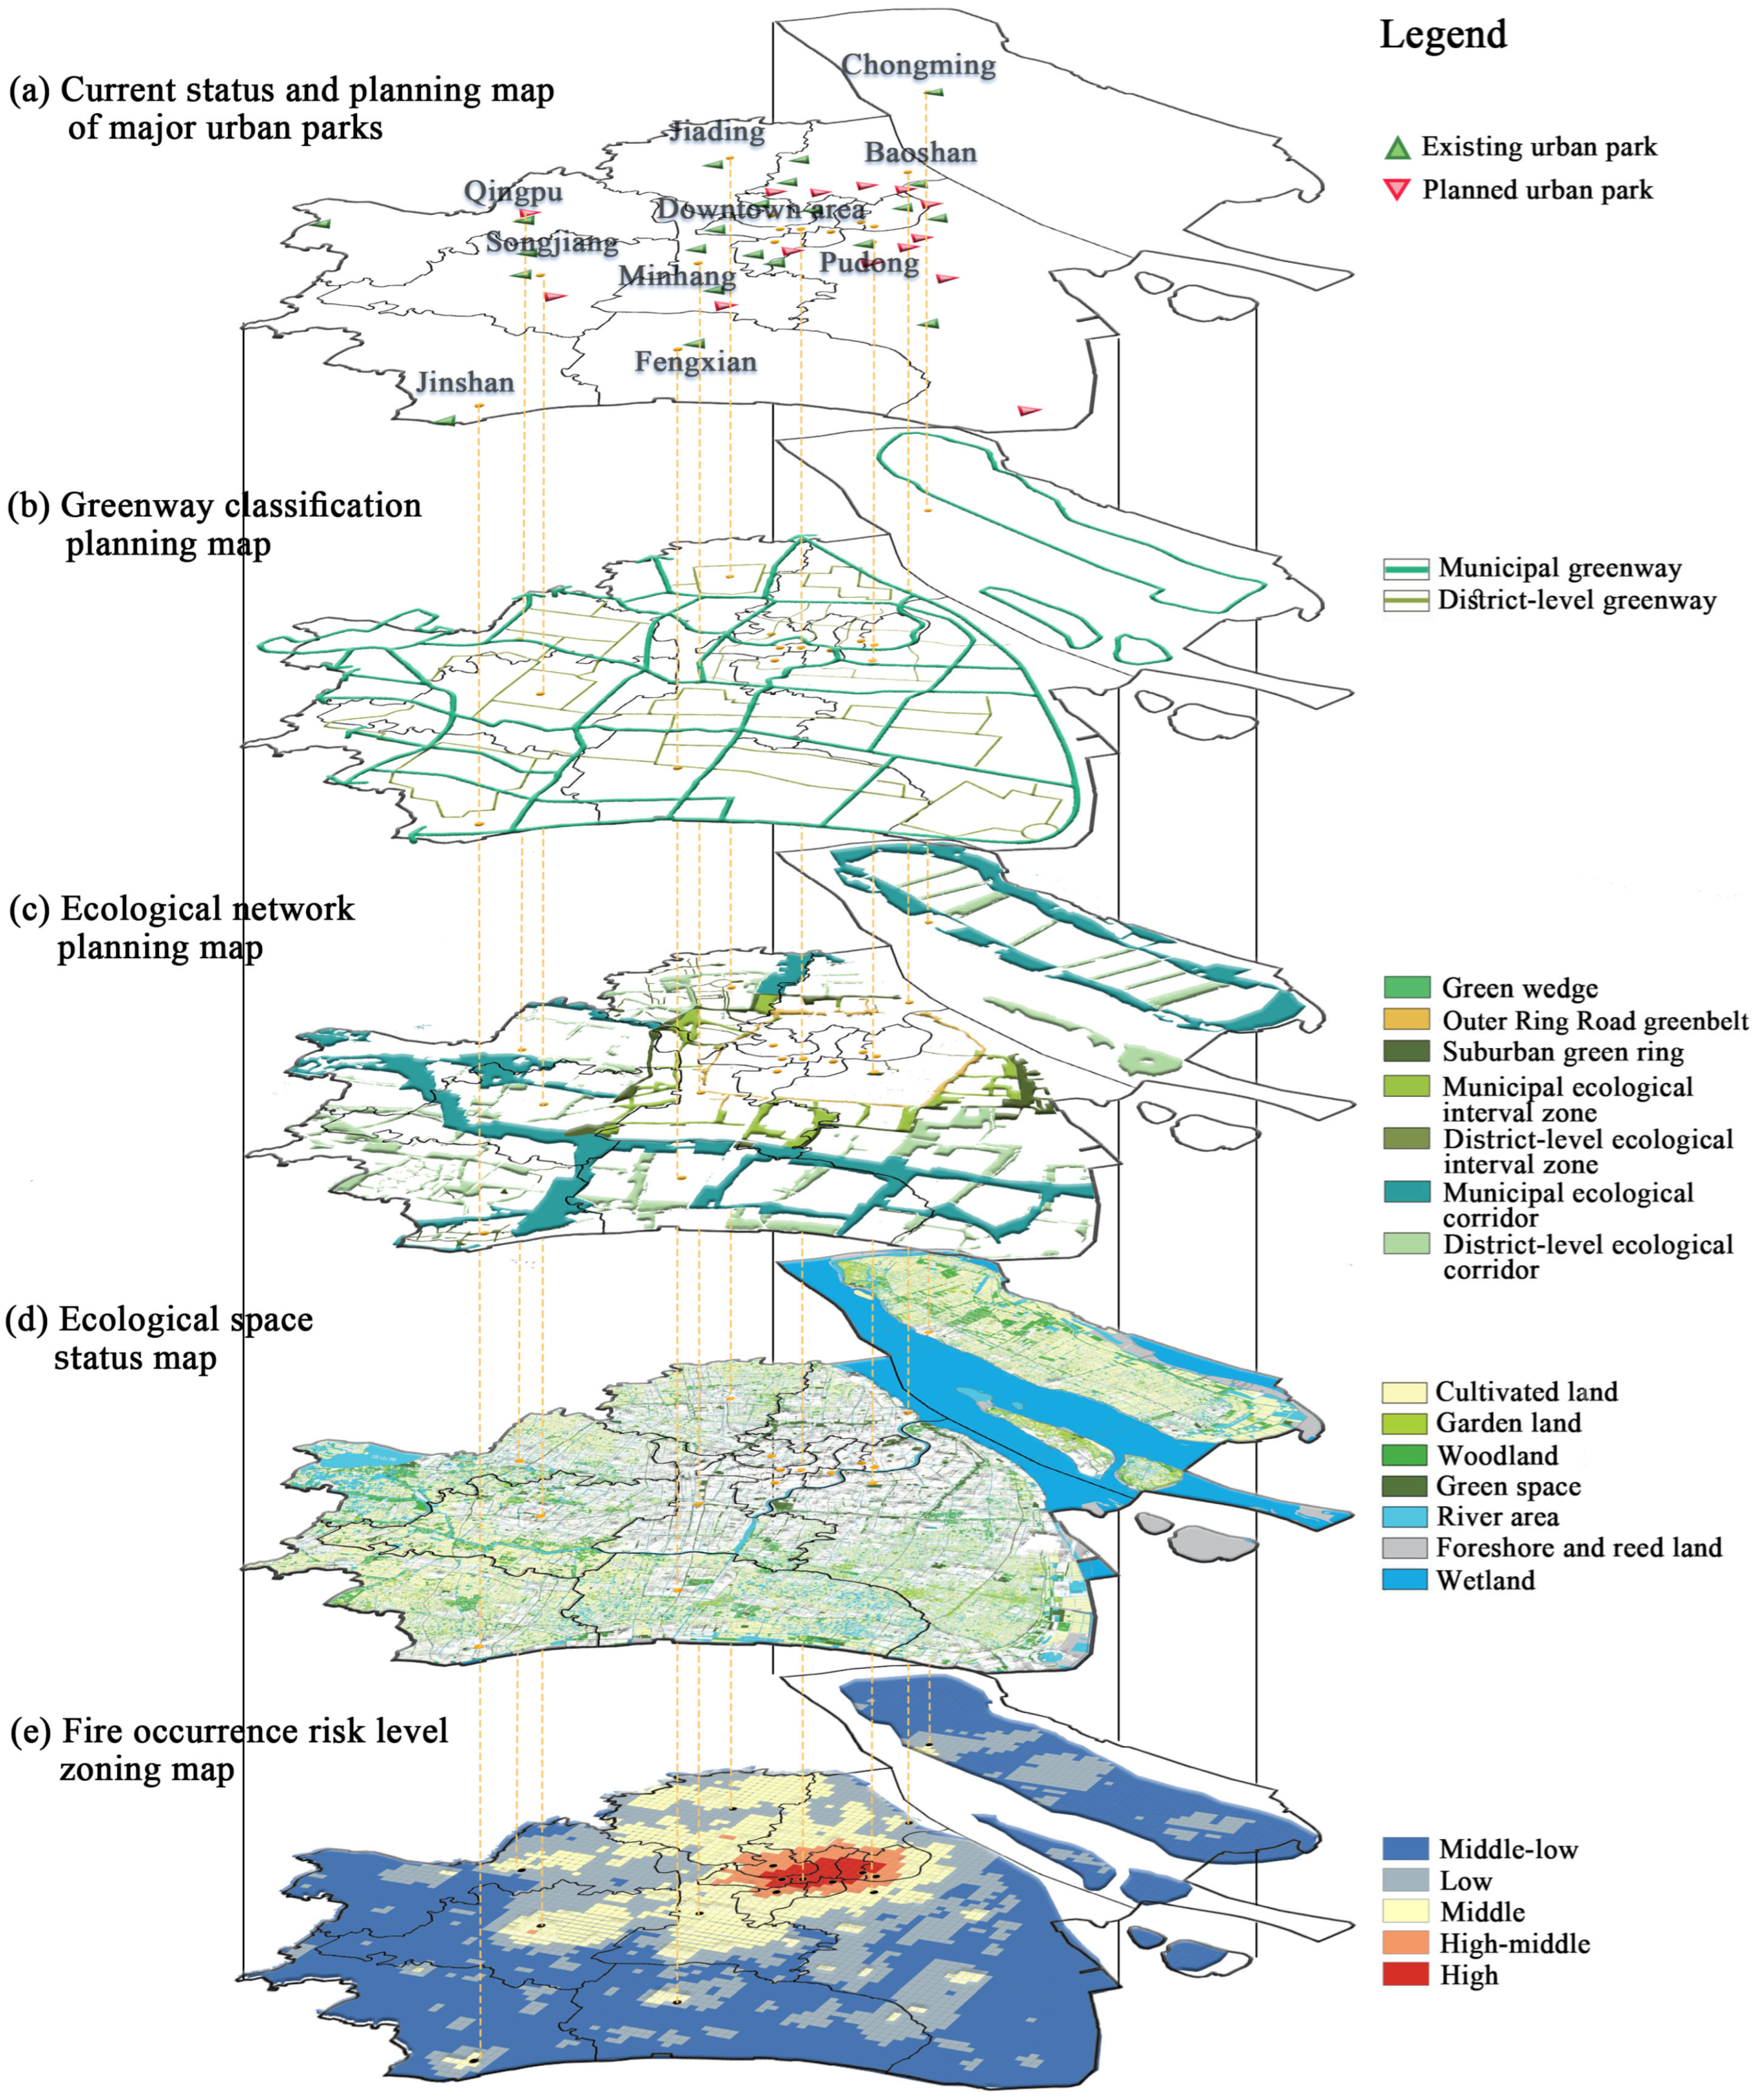
4.2. Effects of Urban Greening on Fire Risk and Countermeasures

The occurrence of fire hazards in Shanghai is primarily influenced by fire sources, regional characteristics, and contributing factors. Human factors play a significant role, resulting in a spatial structure of overall risk levels with higher risks in the central areas and lower risks in the surrounding regions. The risk level gradually decreases from the central urban areas towards the outer areas, with high-value sub-centers dispersed around the Inner and Middle Ring Roads (Figure 10).
Urban greenery, a major component of open spaces, is often subject to human activities. Combined with the continuous distribution of combustible materials, it can easily become the source of urban fires [28]. However, greenery also plays a crucial role in fire prevention and mitigation systems. In the event of fires from other sources, urban greenery can serve as emergency shelter and evacuation spaces. Plants, as the main components of green ecosystems, help prevent fire spread by physically isolating and suppressing combustion [29]. Effective greenery can control fire scope, slow down its spread, and reduce the occurrence of secondary disasters, thus minimizing disruption [30].
To enhance fire prevention and mitigation, it is crucial to employ scientifically proven biotechnical methods, select fire-resistant plants, and implement rational community configurations. By considering different site characteristics and formulating targeted adaptation strategies, the negative impacts of fires and their derived disasters on urban ecosystem services can be mitigated or eliminated. Enhancing disaster prevention and risk mitigation capabilities in urban greenery systems is urgently needed in current urban greening construction and management.
Field survey in high-risk areas revealed that existing urban greening systems prioritize landscape aesthetics and social attributes, neglecting ecological safety requirements, especially fire prevention and mitigation [31]. Currently, urban greening follows a “low maintenance” approach, with fire management strategies focusing more on suppression than prevention, relying heavily on signage and manual patrols. Consequently, urban green spaces pose significant fire risks [32].
To address this, it is recommended to select tree species with lower combustibility and higher ornamental value as backbone species in green spaces and affiliated areas in fire-prone regions. Examples include Viburnum odoratissimum, Taxodium mucronatum, and Magnolia grandiflora [26], creating fire-resistant emergency shelter spaces. In areas with moderate to low fire risks, characterized by greenways and wedge-shaped green spaces, evergreen tree species with lower branches and higher leaf moisture content should be chosen to enhance overall ecological resilience [3]. This establishes firebreaks or ecological buffer zones, preventing fire spread from high-risk areas to the periphery [33].
Future research should prioritize the dual attributes of “fire source-fire-resistant space” in urban greening, with a specific focus on the selection mechanism for fire-resistant plants. It is essential to clarify the complex and specific potential fire risk factors in urban greening and explore strategies to enhance the overall resilience of urban ecosystems by improving the fire resistance of urban greening.

5. Conclusions

The escalating frequency, intensity, scale, and severity of urban fires significantly threaten human safety, economic development, social order, and ecological balance, influenced by global warming, the urban heat island effect, and changes in land surface characteristics. This study includes two core parts: analyzing historical fire data in Shanghai to summarize recent spatiotemporal fire distribution characteristics and constructing an urban fire risk assessment model by integrating multiple data sources to evaluate and zone the occurrence risk of urban fires in Shanghai.
The findings reveal the following characteristics:
Temporal patterns: Shanghai exhibits peak fire occurrences at an 18a time scale, with periodic fluctuations over a 13-month cycle. Fire incidents peak in spring and winter, with vegetation fires most frequent in winter and spring.
Spatial patterns: A central high and peripheral low pattern is observed. High-value centers are primarily concentrated around the central urban area and in the northwest direction. Vegetation fires are scattered, with points mainly in central Shanghai and its northwest and southwest directions, while the outskirts serve as a sub-center.
Further analysis of each administrative district reveals that the suburban areas of Shanghai are high-risk fire occurrence zones, while the central urban area, despite its small area, has the second highest frequency of fire occurrences after the suburban regions.
A comprehensive assessment reveals a typical clustering pattern, with high-value centers in the central urban area and surrounding regions, particularly in the historically significant Jing’an District, Huangpu District, and Hongkou District. The northwest direction of the suburban area is also within the fire risk alert range. Overall, the central urban area of Shanghai faces higher fire risks. Extreme climate change and frequent human activities may spread high-fire-risk areas to adjacent suburban areas, indicating a concerning future outlook. Urban greening has dual attributes as a potential ignition source and a fire prevention space. The fire resistance capacity of plants is crucial for safeguarding urban ecological security, maintaining green health, and promoting sustainable development. Future research should focus on both plants’ fire resistance and the fire prevention space they create. At the micro level, quantifiable indicators of plant fire resistances can enrich evaluation systems. At the macro level, further investigation into the compositional structure of urban greening patches and corridors in relation to urban fires is needed.

Author Contributions

Conceptualization, M.Y. and D.Z.; methodology, M.Y., D.Z. and Y.C.; software, M.Y. and Y.C.; validation, M.Y. and M.E.; formal analysis, M.Y. and Y.C.; resources, M.Y. and Y.L.; data curation, M.Y. and Y.L.; writing—original draft preparation, M.Y.; writing—review and editing, M.Y., D.Z. and M.E.; visualization, M.Y. and Y.C.; supervision, D.Z.; project administration, D.Z.; funding acquisition, D.Z. All authors have read and agreed to the published version of the manuscript.

Funding

This work was supported by the National Natural Science Foundation of China (Project number: 32071824).

Data Availability Statement

Data available in a publicly accessible repository.

Conflicts of Interest

The authors declare no conflict of interest.

References

  1. Manzello, S.L.; Suzuki, S. The importance of combustion science to unravel complex processes for informal settlement fires, urban fires, and wildland-urban interface (WUI) fires. Fuel 2022, 314, 122805. [Google Scholar] [CrossRef]
  2. Zhang, W.H.; Shen, R.F. The summary, logical limitations and countermeasures of urban fire risk cognition. Syst. Eng. Theory Pract. 2019, 39, 387–396. [Google Scholar]
  3. Ryu, S.R.; Choi, H.T.; Lim, J.H.; Lee, I.K. Post-fire restoration plan for sustainable forest management in South Korea. Forests 2017, 8, 188. [Google Scholar] [CrossRef]
  4. Corcoran, J.; Higgs, G.; Brunsdon, C.; Ware, A.; Norman, P. The use of spatial analytical techniques to explore patterns of fire incidence: A South Wales case study. Comput. Environ. Urban Syst. 2007, 6, 623–647. [Google Scholar] [CrossRef]
  5. Zhang, X.; Yao, J.; Sila-Nowicka, K. Exploring spatiotemporal dynamics of urban fires: A case of Nanjing, China. ISPRS Int. J. Geo-Inf. 2018, 7, 7. [Google Scholar] [CrossRef]
  6. Wang, X.D.; Yang, S.; Zhang, S.Y.; Luo, W.Y.; Li, J.; Liu, H. Urban Fire Risk Prediction Based on Spatial-Temporal Big Data and Satellite Images. Comput. Eng. 2023, 6, 242–249. [Google Scholar]
  7. Bertrand, A.L.; Mckenzie, L.S. The Human Factor in High Fire Risk Urban Residential Areas: A Pilot Study in New Orleans, Louisiana; US Department of Commerce, National Fire Prevention and Control Administration: Washington, DC, USA, 1976. [Google Scholar]
  8. Zong, X.Z.; Tian, X.R.; Liu, C. Method and application of forest fire risk assessment on forest stand scale. For. Res. 2021, 34, 69–78. [Google Scholar]
  9. Fu, X.Q. A review of fire risk assessment methods in urban areas. Fire Sci. Technol. 2021, 11, 1622–1625. [Google Scholar]
  10. Ma, L.; Liu, H.; Bai, L. Fire risk assessment of the historic buildings based on AHP and entropy weight method. J. Xi’an Univ. Sci. Technol. 2017, 4, 537–543. [Google Scholar]
  11. Aksoy, E.; Kocer, A.; Yilmaz, İ.; Akcal, A.N.; Akpinar, K. Assessing Fire Risk in Wildland–Urban Interface Regions Using a Machine Learning Method and GIS data: The Example of Istanbul’s European Side. Fire 2023, 6, 408–433. [Google Scholar] [CrossRef]
  12. Pei, Z.; Li, J.; Guo, J.; Li, Q.; Chen, J. Using local co-location quotient and niche-based model to assess fire risk in urban environments: A case study of Beijing, China. Sustain. Cities Soc. 2023, 99, 104989. [Google Scholar] [CrossRef]
  13. Polinova, M.; Wittenberg, L.; Kutiel, H.; Brook, A. Reconstructing pre-fire vegetation condition in the wildland urban interface (WUI) using artificial neural network. J. Environ. Manag. 2019, 238, 224–234. [Google Scholar] [CrossRef] [PubMed]
  14. Knapp, E.E.; Valachovic, Y.S.; Quarles, S.L.; Johson, N.G. Housing arrangement and vegetation factors associated with single-family home survival in the 2018 Camp Fire, California. Fire Ecol. 2021, 17, 25. [Google Scholar] [CrossRef]
  15. Artan, H. Indexing the vegetated surfaces within WUI by their wildfire ignition and spreading capacity, a comparative case from developing metropolitan areas. Int. J. Disaster Risk Reduct. 2021, 63, 102434. [Google Scholar]
  16. Maria, M.; Lea, W.; Haim, K.; Brook, A. A novel urban vegetation mapping approach for fire risk assessment: A Mediterranean case study. Urban Ecosyst. 2023, 26, 1263–1274. [Google Scholar]
  17. Jiang, R.; Chen, L.; Xiang, W.N. Characteristics of extreme high temperature weather in Shanghai. J. Meteorol. Environ. 2016, 32, 66–74. [Google Scholar]
  18. Li, X.F.; Tan, X.; Qian, Z. Analysis and assessment of urban waterlogging risk in Shanghai. China Flood Drought Manag. 2024, 34, 26–32. [Google Scholar] [CrossRef]
  19. Aguilar-Velazouez, D.; Reyes-Ramirez, I. A wavelet analysis of multiday extreme ozone and its precursors in Mexico City During 2015–2016. Atmos. Environ. 2018, 188, 112–119. [Google Scholar] [CrossRef]
  20. Atsuyuki, O.; Toshiaki, S.; Kokichi, S. A kernel density estimation method for networks, its computational method and a GIS-based tool. Int. J. Geogr. Inf. Sci. 2009, 23, 7–32. [Google Scholar]
  21. Shi, P.J. Theory and practice on disaster system research in a fourth time. J. Nat. Disasters 2005, 14, 5–11. [Google Scholar]
  22. Su, G.Q.; Lv, H.S.; Zhu, Y.H.; Chen, T.X.; Hua, J.C. Flood risk assessment based on game theory combination weighting: A case study of Wuwei Area. Arid. Zone Res. 2022, 39, 801–809. [Google Scholar]
  23. Li, X.T.; Liu, Q.; Qian, X.L.; Liu, S.C.; Wang, C.Y. Method for national fuel types classification based on multi-source data. Natl. Remote Sens. Bull. 2022, 26, 480–492. [Google Scholar] [CrossRef]
  24. Gissi, E.; Manea, E.; Mazaris, A.D.; Fraschetti, S.; Katsanevakis, S. A review of the combined effects of climate change and other local human stressors on the marine environment. Sci. Total Environ. 2020, 755, 142564. [Google Scholar] [CrossRef]
  25. Ma, L.; Huang, X.; Gao, J.X.; Miao, J.M.; Zhang, P.Y. Distribution law and probability density prediction of urban area fire events. J. Xi’an Univ. Sci. Technol. 2022, 42, 260–267. [Google Scholar]
  26. Zhu, R.L. Fire Resistance Evaluation of Plant Communities Based on the Spatial Structure of Fire Spread. Master’s Thesis, Tongji University, Shanghai, China, 2023. [Google Scholar]
  27. Gao, F.; Du, M.Y.; Liang, M.Y. Fire Risk Evaluation System and Its Application in Planning of Urban Fire Control from the Space-temporal Perspective. Planners 2023, 39, 128–133. [Google Scholar]
  28. Li, H.Q.; Zhang, D.S. Research on Fireproof Landscape Plants: Progress and Prospect. J. Chin. Urban For. 2022, 20, 133–139. [Google Scholar]
  29. Chen, C.J.; Shi, X.F.; Hu, H.; Deng, S.F.; Huang, Y.L. Study on tree species selection in fireproof forest belt. J. Fujian For. Coll. 1988, 1, 1–12. [Google Scholar]
  30. Zhang, D.S.; Chen, Y.J.; Wu, X.; Zhang, B.C.; Yao, C.Y. Correlation between morphological characteristics and fire-retardant capabilities of landscape trees. J. Chin. Urban For. 2020, 18, 23–28. [Google Scholar]
  31. Fernández-Álvarez, M.; Armesto, J.; Picos, J. LiDAR-Based Wildfire Prevention in WUI: The automatic detection, measurement and evaluation of forest fuels. Agric. Week 2019, 10, 148. [Google Scholar] [CrossRef]
  32. Zhang, Y.N.; Huang, L.X.; Wen, X.Y.; Yang, D.; Ning, S.Y. Research status and prospect of fire disaster based on bibliometric method. J. Saf. Sci. Technol. 2022, 18, 181–188. [Google Scholar]
  33. Zhang, D.S.; Wu, X.; Chen LQ, Y.; Hu, L.H.; Li, K.K.; Zhan, Y.; Yao, C.Y. Combustibility Evaluation of 26 Landscape Tree Species in Shanghai. J. Tongji Univ. Nat. Sci. 2021, 49, 1399–1406. [Google Scholar]
Figure 1. An overview of the study area, Shanghai city.
Land 13 01125 g001
Figure 2. Urban fire risk assessment framework.
Land 13 01125 g002
Figure 3. Contour map of real part of wavelet coefficients.
Land 13 01125 g003
Figure 4. Analysis diagram of wavelet square difference and principal period change. ((a): wavelet difference chart, (b) main cycle trend chart).
Land 13 01125 g004
Figure 5. Fire occurrence in four seasons and each month in Shanghai, 2019–2023.
Land 13 01125 g005
Figure 6. Visualization of (a) distribution of past fire events, (b) proportion of each administrative district, and (c) frequency of past fire events by each administrative district about past fire events in Shanghai from 2019 to 2023.
Land 13 01125 g006
Figure 7. Kernel density map of past fire events distribution in Shanghai from 2019 to 2023 ((a) kernel density map of all past fire events, (b) kernel density map of vegetation fire events, (c) kernel density map of non-vegetation fire events).
Land 13 01125 g007
Figure 8. Urban fire risk assessment map.
Land 13 01125 g008
Figure 9. Spatial distribution of indicators. ((a) kernel density map of high-risk production and business units, (b) kernel density map of fire hazard units, (c) kernel density map of average relative humidity, (d) kernel density map of average air temperature, (e) kernel density map of FVC, (f) kernel density map of the residential area, (g) kernel density map of parks, plazas, and scenic spots, (h) kernel density map of shopping services, (i) kernel density map of catering services)
Land 13 01125 g009
Figure 10. Superimposed analysis map (Shanghai fire risk zoning map and urban greening system planning map).
Land 13 01125 g010
Table 1. Data items and sources.
DataSpatial ScaleData Sources
Satellite fire data/SatSee-Fire (http://satsee.radi.ac.cn:8080/index.html, accessed on 24 May 2024)
Fire notification/Shanghai Fire Rescue Corps (https://www.weibo.com/shanghaixiaofang, accessed on 2 April 2024)
High-risk production and business units/Shanghai Emergency Management Bureau (https://yjglj.sh.gov.cn/, accessed on 10 April 2024)
Fire hazard units/Shanghai Emergency Management Bureau (https://yjglj.sh.gov.cn/, accessed on 10 April 2024)
Average annual relative humidity/National Meteorological Information Center (http://data.cma.cn, accessed on 12 May 2024)
Annual mean temperature/National Meteorological Information Center (http://data.cma.cn, accessed on 12 May 2024))
Points of interest in human activities/Amap open platform (https://lbs.amap.com/, accessed on 5 February 2024)
NDVI500 mNational Earth System Science Data Center and US Geological Survey (http://www.usgs.gov/, accessed on 19 February 2024)
Status quo of ecological space in Shanghai/Shanghai Bureau of Planning and Natural Resources (https://ghzyj.sh.gov.cn/, accessed on 24 May 2024)
Shanghai greenway classification planning/Shanghai Bureau of Planning and Natural Resources (https://ghzyj.sh.gov.cn/, accessed on 24 May 2024)
Planning of ecological network in Shanghai/Shanghai Bureau of Planning and Natural Resources (https://ghzyj.sh.gov.cn/, accessed on 24 May 2024)
Table 2. Result of urban fire risk evaluation indicator weighting.
FactorsIndicatorsTypeWeights
AHPEMCombined
SourceDensity of high-risk production and business unitsPositive0.205 0.058 0.145
Density of fire hazard unitsPositive0.236 0.153 0.202
Density of vegetation fire sitesPositive0.058 0.138 0.091
Density of non-vegetation fire sitesPositive0.049 0.051 0.050
Environmental characteristicsAverage annual relative humidityNegative0.068 0.004 0.042
Annual mean temperaturePositive0.062 0.004 0.039
PossibilityFractional Vegetation CoverPositive0.070 0.058 0.066
Density of residential area Positive0.137 0.154 0.15
Density of shopping services Positive0.024 0.132 0.068
Density of food service venues Positive0.028 0.139 0.074
Density of scenic spots and park squares Positive0.062 0.108 0.081
Table 3. Fire occurrence risk classification and area statistics.
Risk LevelArea (km2)Proportion (%)
AHPEMCombinedAHPEMCombined
Middle-low801.444217.833013.01 12.6466.5247.52
Low3465.08 1565.252178.60 54.6524.6934.36
Middle659.41 405.80959.32 10.406.4015.13
High-middle1297.27 103.31125.54 20.461.631.98
High117.30 48.3164.04 1.850.761.01
Disclaimer/Publisher’s Note: The statements, opinions and data contained in all publications are solely those of the individual author(s) and contributor(s) and not of MDPI and/or the editor(s). MDPI and/or the editor(s) disclaim responsibility for any injury to people or property resulting from any ideas, methods, instructions or products referred to in the content.

