Article

Spatial–Temporal Pattern Evolution and Differentiation Mechanism of Urban Dual Innovation: A Case Study of China’s Three Major Urban Agglomerations

1
School of Architecture, South China University of Technology, Guangzhou 510641, China
2
State Key Laboratory of Subtropical Building and Urban Science, Guangzhou 510641, China
3
Party School of the Guangdong Provincial Committee of CPC, Guangzhou 510053, China
*
Author to whom correspondence should be addressed.
Land 2024, 13(9), 1399; https://doi.org/10.3390/land13091399
Submission received: 1 August 2024 / Revised: 21 August 2024 / Accepted: 28 August 2024 / Published: 30 August 2024

Abstract

:
Breakthrough innovation and incremental innovation have different impacts on economic development. For regional development, it is important to find a balance in dual innovation, which entails effective coordination of allocating innovation resources and managing risks. However, little attention has been given to the spatial relationship and differentiation mechanisms between breakthrough innovation and incremental innovation. Therefore, our research takes China’s three major urban agglomerations as examples, aiming to explore the spatial–temporal pattern evolution, influencing factors, spatial relationship, and spatial organizational patterns of breakthrough innovation and incremental innovation from 2000 to 2021. The research found that the spatial distribution of urban dual innovation is affected by the law of distance decay, and the spatial distribution of incremental innovation is more polycentric than that of breakthrough innovation. In terms of the differentiation mechanism, breakthrough innovation is more affected by the innovation atmosphere, while incremental innovation is more likely to be affected by the economic foundation and built environment. Our research effectively supplements the shortcomings in the spatial relationship research of breakthrough innovation and incremental innovation and provides references for formulating innovation policies.

1. Introduction

Innovation is a crucial driving force for economic development and a significant reflection of regional competitiveness [1,2]. Innovation is the introduction of new production factors and new production conditions into the original production system, which is a process of creative destruction [3]. In modern economies, the returns from products based on large-scale, standardized production gradually diminish over time, compelling producers to innovate in pursuit of higher profits [4,5]. Despite becoming the world’s second-largest economy, the value-added from China’s industrial activities remains relatively low, with certain industries still positioned in the mid-to-low levels of the Global Value Chain (GVC) [6,7,8]. To enhance its competitiveness in the global economy, China officially introduced the strategy of innovation-driven development as early as 2006 (National Medium and Long–term Plan for Science and Technology Development (2006–2020)). In the context of policy documents in China, innovation is defined as the primary driving force for economic development. Therefore, what are the evolving characteristics of China’s innovation activities? How do the mechanisms of formation differ among various types of innovation? Addressing these questions helps us to understand the mechanisms behind innovation activities and provides insights into China’s innovation-driven economy.
Innovation exhibits spatial characteristics, and the spatial distribution and organization of innovation activities have long been the focus of multidisciplinary research in geography, management, and economics [9]. Previous studies have concentrated on topics such as innovation factors [10,11], knowledge spillovers [12,13,14], innovation networks [15,16], and innovation systems [17,18]. These studies have conducted in-depth discussions on the flow and clustering of innovation factors [19,20,21], the causes of unequal agglomeration of innovative activities [22,23,24], innovation networks and evolutionary mechanisms [25,26,27], the construction of innovation systems, and innovation governance [28,29,30].
In most existing studies, innovation is often seen as a uniform activity, with little discussion on the diversity of innovation activities themselves. However, Schumpeter J pointed out the inherent unevenness of innovation, emphasizing that varying degrees of its impact can significantly influence economic cycles over long-, medium-, and short-term periods [3,31]. Based on the differences in innovation impact, researchers have proposed the concept of dual innovation, categorizing innovation into two types: breakthrough innovation and incremental innovation [32,33,34]. Breakthrough innovation has a profound impact on existing technology domains by deviating from conventional paths and development trends [35,36]. These changes frequently result in the obsolescence of established technologies and products. In contrast, incremental innovation refers to innovations that involve adjustments, improvements, and upgrades based on existing technological content [37,38,39]. Their focus lies in refining and updating existing technologies and products. There are several distinctions between these two types of innovation. Firstly, concerning risk and reward, breakthrough innovation is characterized by higher risks, greater investment, and potentially higher returns compared to incremental innovation. Secondly, there is a significant difference in scale, incremental innovation involves lower costs, faster development, and operates on a larger scale within its domain compared to breakthrough innovation. Thirdly, their focuses and goals diverge: breakthrough innovation aims to profoundly disrupt existing technologies to capture future markets with new technologies and products, while incremental innovation primarily aims to reduce the production costs of existing products [40,41,42,43].
However, a few studies have also focused on the differences between breakthrough innovation and incremental innovation, e.g., Esposito C’s exploration of the geographical patterns of breakthrough innovation in the U.S. since the 20th century. The findings reveal that despite undergoing three shifts in location, breakthrough innovations in the U.S. tend to congregate predominantly in densely populated and knowledge-intensive metropolitans [44]. Enrico B et al. conducted a study utilizing U.S. patent data to delve into the geography of unconventional inventions. Their findings are that inventions characterized by unconventional inventions are predominantly concentrated in high-density urban centers, whereas specialized clusters of such inventions emerge in lower-density urban areas [45]. Ren C et al. use China’s biomedical industry as an example to analyze the differentiation mechanisms of buzz and pipeline in driving dual innovation. The study found that both local buzz and global pipeline have positive impacts on incremental innovation while exhibiting an inverted U-shaped effect on breakthrough innovation [46]. These studies provide an in-depth examination of the long-term spatiotemporal evolution of breakthrough innovation, initially focusing on the distinctions between breakthrough innovation and incremental innovation. Nevertheless, there is a limited discussion on the spatial relationship and differentiation mechanisms between breakthrough innovation and incremental innovation.
However, dual innovation plays different roles in regional economic growth. Breakthrough innovation helps regions reduce the risk of path dependence and provides a new window of opportunity for regional development [47,48]. On the other hand, incremental innovation contributes to the stable development of the regional economy [33,43]. Our research argues that for regional development, it is not the best strategy to simply pursue a certain type of innovation. On the contrary, the key lies in achieving a balance between breakthrough innovation and incremental innovation, which helps to allocate innovation resources more rationally and manage risks effectively. Clarifying the relationship between these two types of innovation in terms of spatial layout and their inherent differences in mechanisms is crucial for revealing the formation mechanism of the dual innovation model. This insight is essential for guiding the strategic formulation of regional innovation policies.
Our research focuses on the similarities and differences between breakthrough innovation and incremental innovation, using China’s three major urban agglomerations as examples. Analyzing a dataset of 2.6954 million authorized patents from 2000 to 2021, we investigate how these innovations evolve and what factors influence their evolution. Based on this, we analyzed the spatial relationship between breakthrough innovation and incremental innovation, summarizing their spatial organizational patterns.
This study aims to address three core questions: Firstly, are there differences in the spatial evolution patterns between breakthrough and incremental innovations? Secondly, what factors influence the spatial evolution patterns of these two types of innovations? Third, what are the spatial organizational patterns of dual innovations in cities, and how do these patterns differ from each other?
This paper is structured as follows: Section 2 introduces the research area, dataset, and research methods. Section 3 presents the results and analysis, including evolutionary characteristics of the spatial–temporal patterns of dual innovation, influencing factors, the spatial relationship between breakthrough innovation and incremental innovation, and organizational patterns of dual innovations. Section 4 discusses the contributions and limitations of this study. Section 5 provides the research conclusions.

2. Materials and Methods
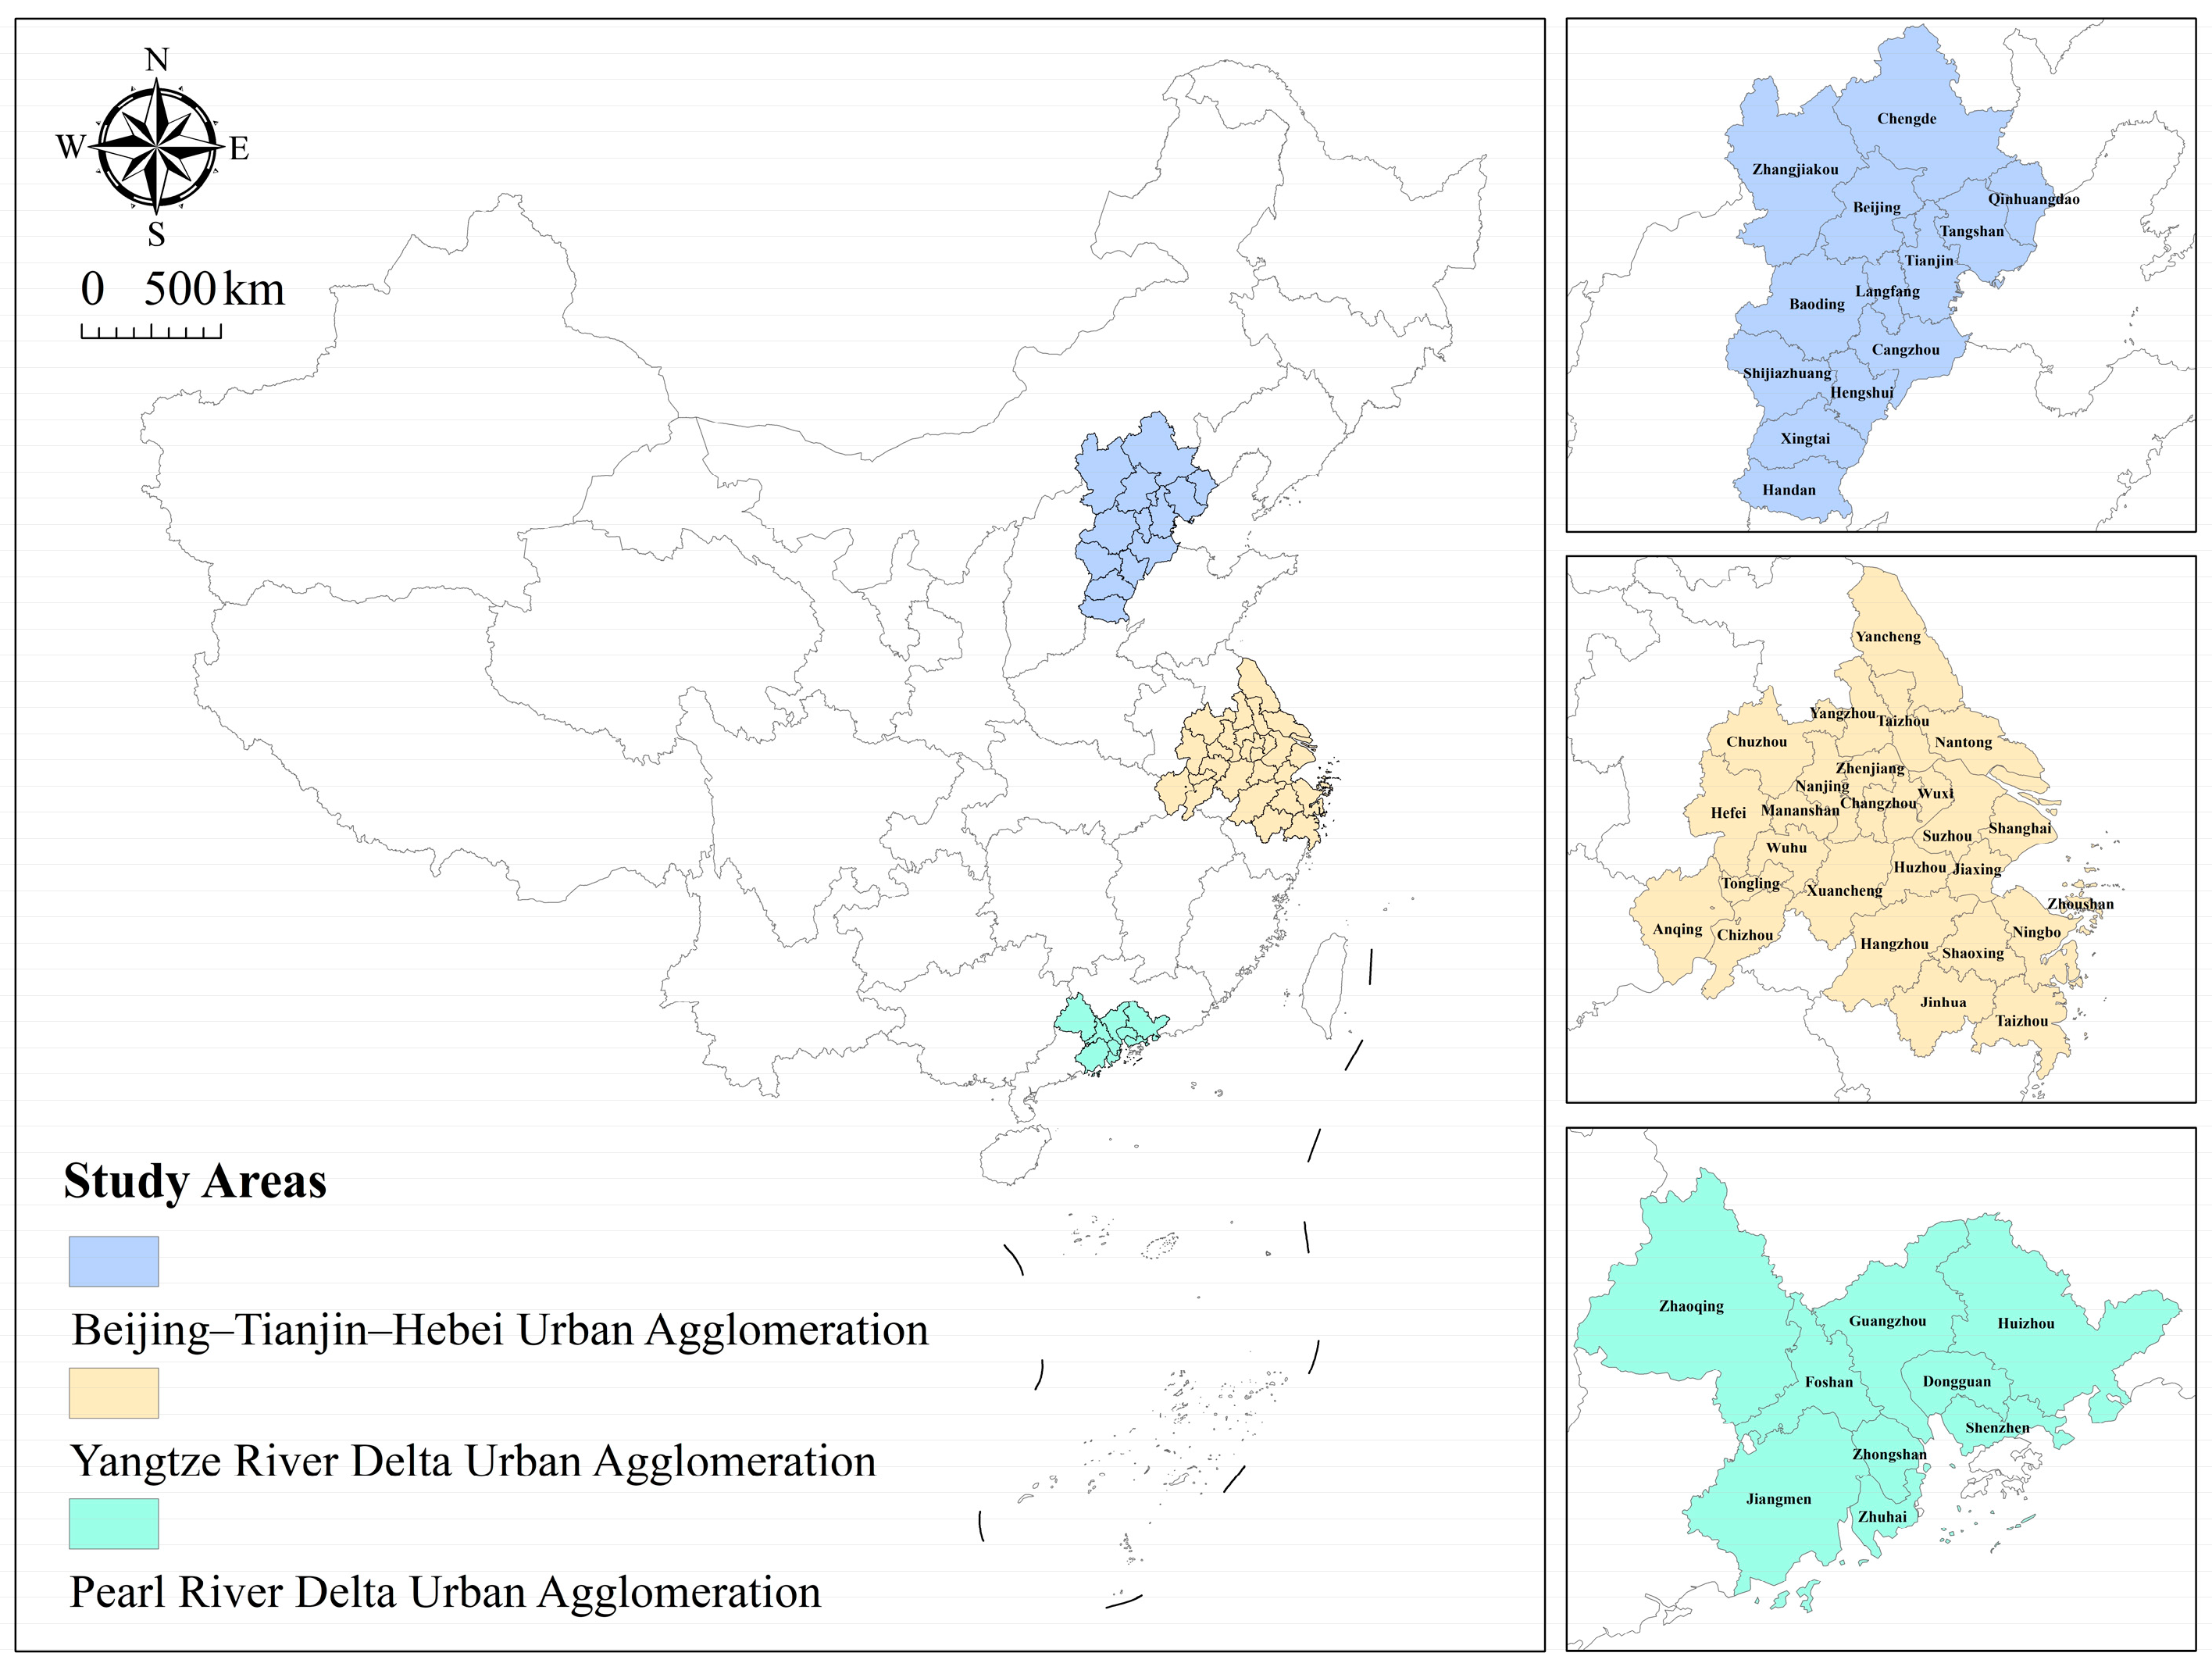
2.1. Study Areas

The Beijing–Tianjin–Hebei Urban Agglomeration (BTHUA), Yangtze River Delta Urban Agglomeration (YRDUA), and Pearl River Delta Urban Agglomeration (PRDUA) are the three urban agglomerations with the highest level of economic development in China (Figure 1). According to data from the China Statistical Yearbook, in 2021, the technology market turnover of three urban agglomerations accounted for 66.17% of the whole nation. Specifically, BTHUA reached CNY 5.34 trillion (30.18%), YRDUA reached CNY 3.42 trillion (19.33%), and PRDUA reached CNY 2.95 trillion (16.66%). This indicates that three major urban agglomerations hold an absolute leading position in China’s innovation economy and serve as typical case studies for studying dual innovation in China.

2.2. Data Sources and Processing

Patents are commonly used data for studying innovation. In China, patents are categorized into authorized inventions, utility models, and designs, among which authorized inventions have the strongest innovative attributes. Therefore, our research used authorized invention patent data to characterize urban innovation activities. The data were sourced from the database of the China National Intellectual Property Administration as indexed in PatSnap (www.patsnap.com, accessed on December 2023).
Given the minimum 18-month delay between patent application and publication in China, the research in this study covers data up to 31 December 2021, based on data acquired in December 2023. The patent search criteria are as follows: Firstly, the patent type is authorized invention patents. Secondly, the address of the patent applicant is located within the study areas (BTHUA, YRDUA, or PRDUA). Thirdly, the patent application date is between 1 January 2000 and 31 December 2021. Taking Beijing as an example, the patent data search formula is as follows: APD: [20000101 TO 20211231] AND AN_ADD: (Beijing). After that, our research obtained a total of 2.6954 million patent records, including 772,900 records from the Beijing–Tianjin–Hebei Urban Agglomeration, 1,225,900 records from the Yangtze River Delta Urban Agglomeration, and 696,600 records from the Pearl River Delta Urban Agglomeration.
The processing steps for patent data are as follows:
  • Defining the study periods: Based on the trend in patent application data over the years, this paper divides the study into four periods: 2000–2005, 2006–2010, 2011–2015, and 2016–2021.
  • Cleaning patent data: Removing irrelevant data and extracting patent applicant addresses.
  • Geocoding: Using Python, invoking the Amap Auto (www.amap.com, accessed on December 2023) API to geocode patent applicant addresses and obtain latitude and longitude coordinates.
This article’s statistical data are sourced from the China National Bureau of Statistics. Missing data points are supplemented through methods such as spatial interpolation and trend extrapolation.

2.3. Methods

2.3.1. Kernel Density

Kernel density is a commonly used method to describe the spatial distribution density of point data [49,50]. This paper intends to use this method to describe the evolutionary process of spatial patterns of breakthrough innovation and incremental innovation from 2000 to 2021. The formula is as follows:
D s = i = 1 n 1 r 2 k s c i r ,
In Equation (1), D s represents the kernel density value of point features at position s, r denotes the search radius, c i is a core point feature in a kernel density analysis, k signifies the spatial weighting function of kernel density, and n represents the number of patents in the s position whose distance from the core element c i is less than or equal to the search radius r.

2.3.2. Multi-Ring Buffer

Multi-Ring Buffer is a commonly used neighborhood analysis method, which can analyze the spatial proximity of types of point data [51,52]. Our research uses this method to explore the spatial relationship between breakthrough innovation and incremental innovation. This study was conducted using ArcGIS10.8 software. Firstly, based on the point layer representing breakthrough innovation patents, multiple buffers were set with unit radii of 0.1 km, 0.5 km, 1 km, 2 km, 3 km, and 5 km, respectively, generating six polygon layers with geospatial attributes. Subsequently, we utilized the Spatial Joins tool to sequentially count the number of incremental innovation patents contained within each of the six buffer polygons.

2.3.3. Model

(1)
Dependent variable
The dependent variable of our research is the number of patents related to breakthrough innovation and incremental innovation. Based on existing research, the characterization methods for breakthrough innovation and incremental innovation mainly include the following two categories.
The first type involves using IPC classification codes of patents to identify atypical combinations of IPC codes. Relevant studies suggest that innovations formed by atypical knowledge combinations are novel and creative. Patents characterized by such unconventional combinations are defined as breakthrough innovations [35,53]. However, a limitation of this method is its ability to only identify non-typical or unconventional combinations, failing to indicate whether these innovations will significantly influence subsequent developments. This is because new knowledge combinations may sometimes be meaningless.
The second type involves characterizing and distinguishing patents through their citation data. These studies posit that an important innovation should significantly influence subsequent inventions. Therefore, the more frequently a patent is cited, the more significant it is considered [47,54]. However, a drawback of this method is that the number of citations a patent receives can be influenced by its publication date. For instance, patents published in 2005 might have higher citation rates compared to those published in 2021 if data are collected in 2023.
Based on a comprehensive comparison of the advantages and disadvantages of the two methods, this paper argues that breakthrough innovation is an activity that significantly influences subsequent innovations. The more frequently a patent is cited, the more significant its importance is considered. Therefore, the second method was chosen for this study, drawing on previous research methods. Patents within the top 5% in terms of citation count are defined as breakthrough innovations [55,56,57]. Simultaneously, to address the issue of cross-sectional differences in citation probabilities between different years, this paper identifies patents within the top 5% of citation counts for each year. For example, breakthrough innovations in 2005 are patents from that year that rank within the top 5% of all patents in terms of citation counts for 2005, while others are categorized as incremental innovations. Based on this method, dual innovation in the BTHUA, YRDUA, and PRDUA is identified over each study period, as depicted in Figure 2.
(2)
Independent variable
Innovation is closely tied to economic development [23,24,58,59]. Our research aims to clarify the relationship between innovative activities and regional characteristics through the selection of relevant factors. Drawing on previous studies [60,61,62], we developed a factor system encompassing three dimensions—economic foundation, innovation atmosphere, and built environment (Table 1)—to analyze the influencing factors of dual innovation.
The first dimension is the economic foundation, which reflects the stage and level of urban economic development, including economic scale, industrial structure, and other aspects. Innovation, particularly breakthrough innovation, involves creative activities with inherent risks [35,36]. A strong economic foundation can provide support and security for the occurrence of innovation activities [63,64]. In our research, four factors—economic size (GDP), economic development level (per capita GDP), industrialization level (industrialization rate), and resident income (average wage of employees)—are used to characterize the economic foundation.
  • Economic Size (GDP): GDP reflects a city’s overall economic strength and market size. Typically, areas with larger economic outputs are more likely to foster innovation.
  • Economic Development Level (per capita GDP): Per capita GDP denotes the level and stage of economic development. Regions with higher per capita GDP are generally more conducive to innovation.
  • Industrialization Level (industrialization rate): The level of industrialization represents a region’s industrial base and manufacturing production capacity. On the one hand, a high level of industrialization can provide a material basis and technological platform for technological innovation. On the other hand, an excessively high industrial ratio may imply a reduction in the proportion of the tertiary sector, and innovation is more likely to occur in areas with a developed modern service industry rather than in a purely industrial city.
  • Resident Income (the average wage of employed staff): Income levels influence purchasing power. Higher average wages boost demand for innovative products and services and increase societal investment in innovation, thus impacting urban innovation development.
The second dimension is the innovation atmosphere, referring to the cultural and social environment of urban innovation activities, including the richness of innovation elements, the extent of policy support, the atmosphere for collaborative innovation, and the degree of openness. Previous studies have pointed out that an open and inclusive environment is conducive to the occurrence of innovation activities [46,64,65]. Therefore, this article primarily characterizes the innovation atmosphere through four factors: innovation elements (number of industrial enterprises), government support (public financial expenditure on scientific and technological activities), internationalization level (actual utilization of foreign capital), and collaboration innovation (number of cooperative patents).
  • Innovation Elements (number of industrial enterprises): A greater number of industrial enterprises may imply a richer pool of innovation resources and a more diverse range of technological demands, thereby influencing the occurrence and agglomeration of innovation.
  • Government support (public financial expenditure on scientific and technological activities): Government support is crucial for the occurrence and agglomeration of innovative activities. It provides strong financial guarantees for research and development through funding support and tax incentives, effectively promoting urban innovation.
  • Internationalization Level (actual utilization of foreign capital): Foreign direct investment not only brings in foreign capital but also advanced technology and management experience from foreign enterprises. On the one hand, this may promote urban innovation through knowledge spillover effects. On the other hand, it may also affect the development of urban innovation by capturing local enterprises’ market share and innovation resources due to the protection of core knowledge by foreign enterprises.
  • Collaborative Innovation (number of cooperative patents): Innovation cooperation can promote the exchange of knowledge and technology, thereby influencing the development of urban innovation.
The third dimension is the built environment. Innovation activities are localized and must be supported by specific spaces. The built environment of a city refers to urban infrastructure, public services, etc., which significantly influence the clustering of innovative talents and enterprises [60,66]. Therefore, this study employs infrastructure (per capita urban road area), ecological environment (green coverage rate of built-up areas), cultural services (number of library books per 100 people), and public services (number of hospital beds) to characterize the built environment.
  • Infrastructure (per capita urban road area): Per capita urban road area is an important indicator of urban infrastructure level. It directly affects the efficiency of logistics and the smoothness of economic activities, thereby providing the necessary material basis and transportation support for innovative activities.
  • Ecological Environment (green coverage rate of built-up areas): The green coverage rate of built-up areas is an important indicator reflecting the quality of the ecological environment. A good ecological environment can attract the agglomeration of innovative talents, which in turn affects the layout of innovative enterprises and elements, providing a favorable environmental foundation for the emergence of innovative activities.
  • Cultural Services (number of library books per 100 people): The number of books in public libraries is an indicator of the level of cultural resources and services in a region. Innovative activities are more likely to occur in regions with a diverse and open cultural atmosphere.
  • Public Services (number of hospital beds): The number of hospital beds is an important reflection of urban public service facilities and social security. A good level of public services and a social security system can effectively promote the agglomeration of innovative talents, thereby influencing urban innovation.
Furthermore, to explore whether the above factors can explain the dependent variables (breakthrough innovation and incremental innovation), our research uses the Geographical Detector Method (GDM) to characterize the extent to which the selected 12 indicators can explain the spatial differentiation of dual innovation [67,68]. Based on this analysis, factors showing significant influence will be selected for regression analysis. The formula for GDM is as follows:
q = 1 h = 1 L N h h 2 / N 2 ,
In Formula (2), q refers to the extent to which a certain independent variable X can explain the spatial differentiation of dependent variable Y. L represents the stratification or zoning of Y and X, where N h and N are the number of units of Y in stratum h and the entire area, respectively ( h = 1, …). The range of q is [0, 1]. and 2 denote the variance of Y in stratum h and the entire area, respectively. According to the principles of GDM, a larger q indicates a stronger explanatory power of the independent variable X on Y, and vice versa.
The calculation results of q-values (Table 2) indicate that the overall significance level of the indicator system is strong. Only two factors, which are the number of industrial enterprises and per capita urban road area show insignificant effects on both breakthrough innovation and incremental innovation. Therefore, these two indicators are excluded, and the remaining 10 indicators are used to construct a spatiotemporal panel dataset for regression analysis.
(3)
Panel data model
Referring to related research [69,70], we intend to use a panel data model to study the impact of different independent variables on the spatial pattern of urban dual innovation from 2000 to 2021. The equation of the panel data model is as follows:
i n n o i t = α + β 1 x 1 i t + β 2 x 2 i t + β 3 x 3 i t + + β n x n i t + ε i t ,
In Equation (3), i n n o i t represents the level of breakthrough innovation or incremental innovation, x n i t denotes the impact factors, and ε i t is the standard error term following a normal distribution. To mitigate the impact of heteroscedasticity on regression results, we conducted a regression analysis after taking the natural logarithm of both the dependent variables and independent variables. The regression analysis includes the following steps:
Step 1: Establish panel datasets for breakthrough innovation and incremental innovation. This dataset encompasses four study periods (2000–2005, 2006–2010, 2011–2015, and 2016–2021), and establishes eight panel datasets.
Step 2: Conduct panel data tests. Utilizing Stata16 software, we performed unit root tests and ADF tests to examine the stationarity and cointegration of the eight panel datasets (Table 3). The results of the unit root LCC test indicate that all ten independent variable indicators are first-order integrated, meaning no unit roots exist, thereby passing the stationarity test. The ADF test results for cointegration consistently reject the null hypothesis at the 5% significance level, confirming that the panel data are cointegrated and passing the cointegration test.
Step 3: Select an appropriate regression model. Panel data regression primarily encompasses the Fixed Effects Model (FE), Random Effects Model (RE), and Pooled Regression Model (PR). The Hausman test results for the two panel datasets in this study reject the null hypothesis at the 5% significance level, indicating that the Fixed Effects Model (FE) should be chosen for the regression analysis.
The Fixed Effects Model (FE) can compute Individual Fixed Effects, Time Fixed Effects, as well as Both Time and Individual Fixed Effects. In our research, to delve into the impacts of diverse factors on dual innovation across various cities and how these effects evolve across four periods, we employed both Individual Fixed Effects and Time Fixed Effects regressions. Thus, the equation used in our analysis is structured as follows:
i n n o i t = β 0 + β 1 x 1 i t + β 2 x 2 i t + + β n x n i t + μ i + e i t ,
In Equation (4), i n n o i t serves as the dependent variables, representing the number of breakthrough innovations and incremental innovations. x 1 i t , x 2 i t , and x n i t denote the 10 independent variables ultimately selected for our research, with β 1 , β 2 , and β n being their respective regression coefficients. I represents the number of research units, which in our research corresponds to 48 cities; t indicates the total number of observation periods for each cross-sectional sample spanning from 2000 to 2021 (specifically divided into 4 time periods); μ i represents the Individual/Time Fixed Effects; and e i t is the random error term.

3. Results and Analysis

3.1. Evolution of Urban Dual Innovation in Three Urban Agglomerations

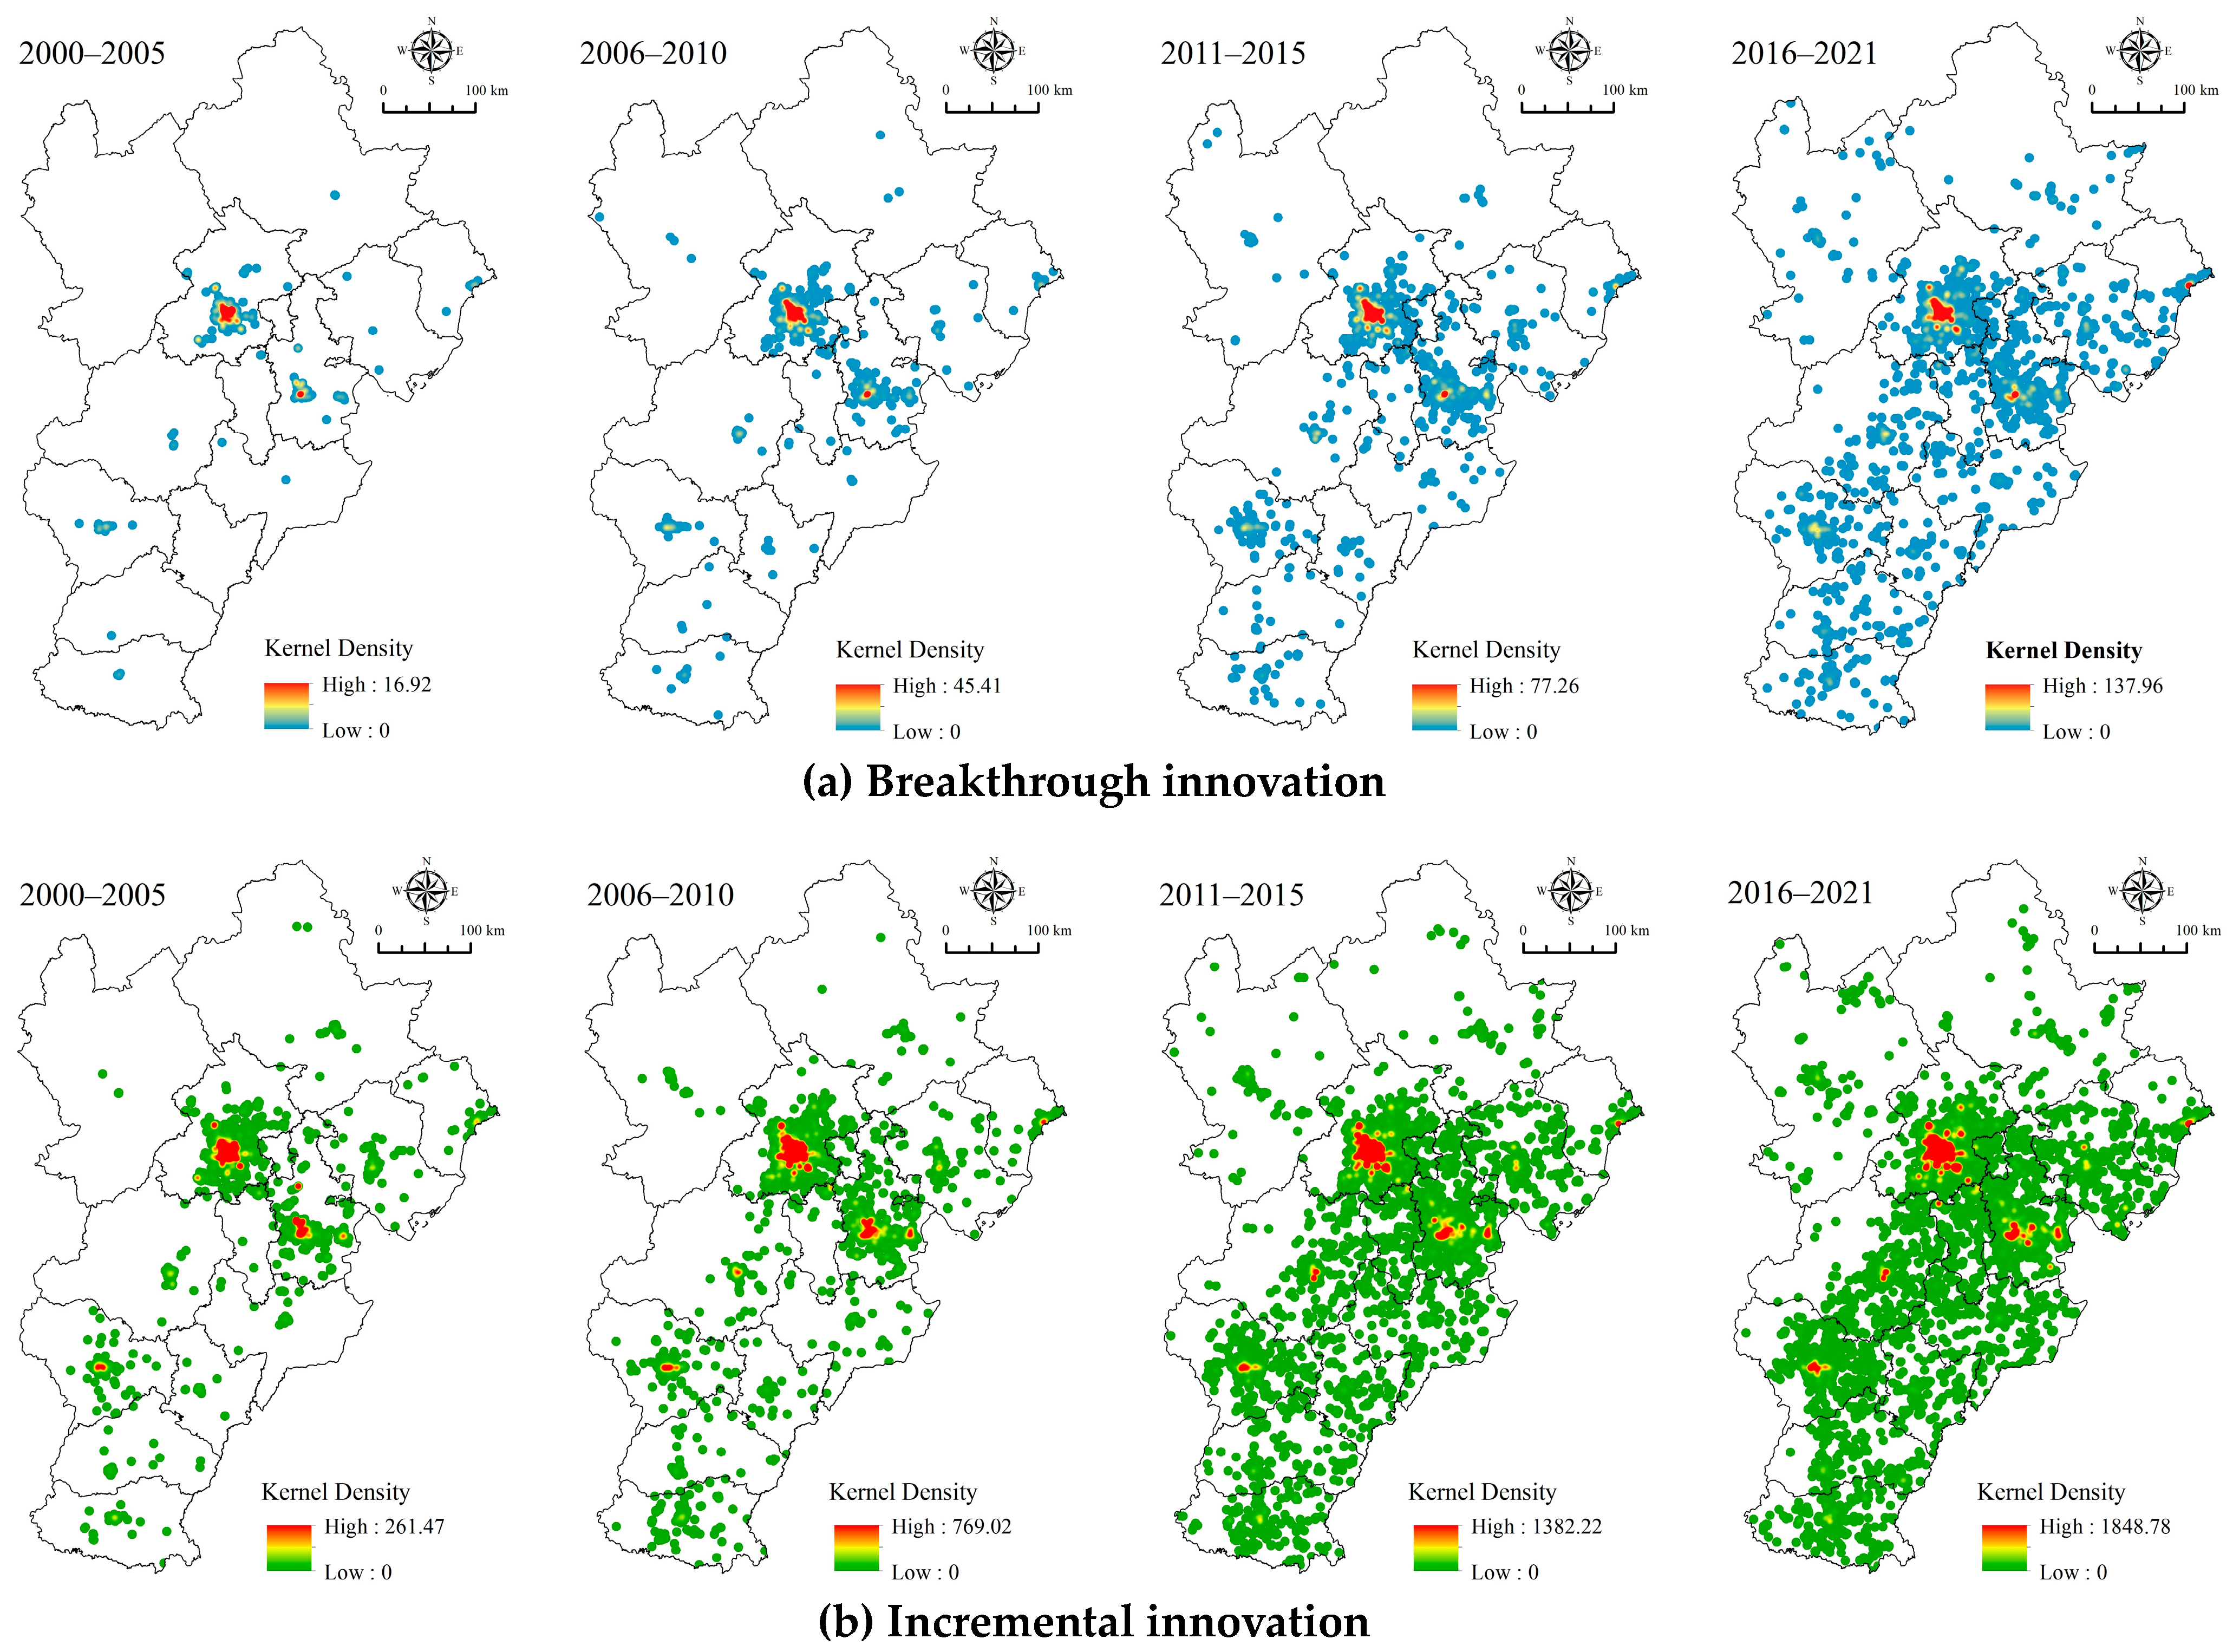
3.1.1. Beijing–Tianjin–Hebei Urban Agglomeration

The kernel density analysis results of dual innovation in the Beijing–Tianjin–Hebei Urban Agglomeration from 2000 to 2021 (Figure 3) show the following characteristics:
Firstly, from the overall evolution of the spatial patterns of dual innovation, breakthrough innovation mainly centers around Beijing as the primary core and Tianjin as a secondary core, forming a dual-center pattern in the Beijing–Tianjin–Hebei Urban Agglomeration. Incremental innovation primarily forms a multi-center pattern centered around cities such as Beijing, Tianjin, Shijiazhuang, Baoding, and Qinhuangdao.
Secondly, concerning the evolution of the agglomeration degree of dual innovation, both breakthrough innovation and incremental innovation exhibit characteristics of centripetal concentration, but their degrees of concentration differ. The highest concentration densities of breakthrough innovation in the four periods are 16.92, 45.41, 77.26, and 137.96, with an average growth rate of 49.32%. The highest concentration densities of incremental innovation in the four periods are 261.47, 769.02, 1382.22, and 1848.78, with an average growth rate of 45.20%. The centripetal concentration of breakthrough innovation is higher than that of incremental innovation.
Thirdly, regarding the main distribution areas of dual innovation, the primary core aggregation areas of breakthrough innovation include Beijing (76.01%) and Tianjin (11.61%). The primary core aggregation areas of incremental innovation include Beijing (81.62%), Tianjin (10.13%), and Shijiazhuang (2.45%). Moreover, during the evolution process, the number of patents in these core regions shows a stable growth trend.

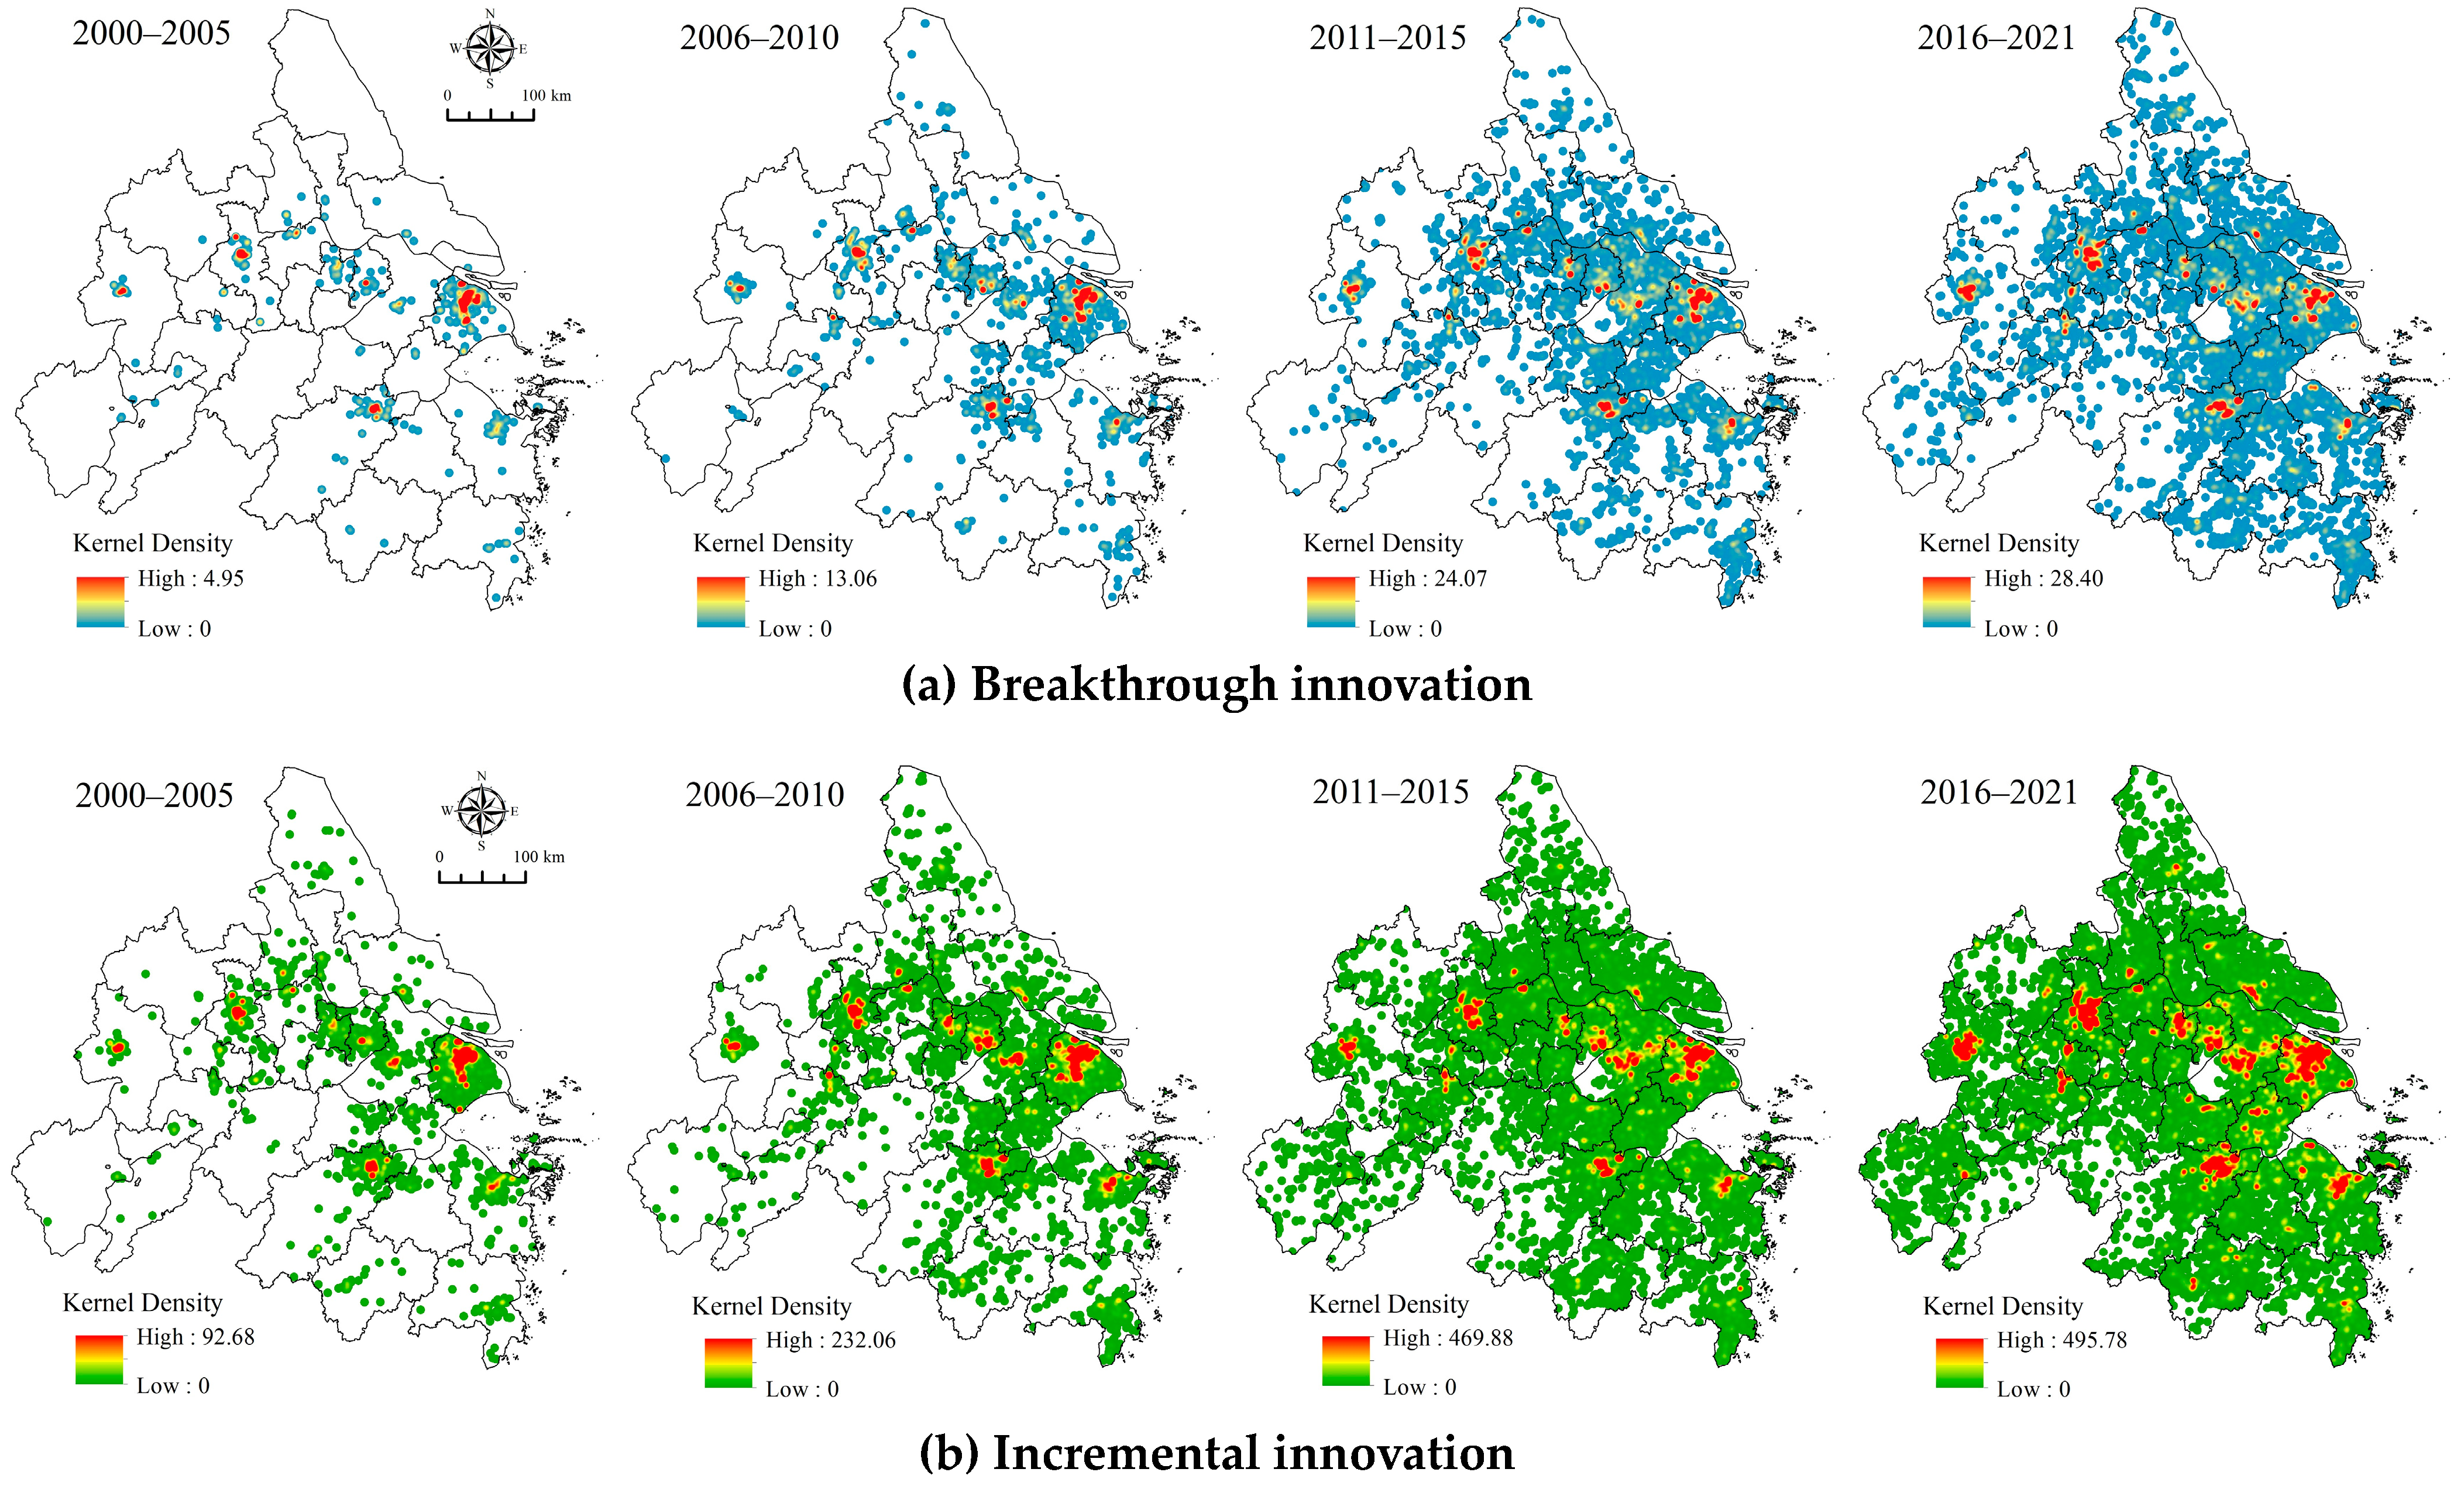
3.1.2. Yangtze River Delta Urban Agglomeration

According to the results of the kernel density model (Figure 4), the evolution of dual innovation patterns in the Yangtze River Delta Urban Agglomeration exhibits the following characteristics:
Firstly, regarding the overall evolution of the spatial patterns of dual innovation in the urban agglomeration, the spatial pattern of breakthrough innovation shows a multi-center distribution, while incremental innovation demonstrates a distinct corridor effect. It forms a “Z”-shaped spatial distribution pattern centered on Shanghai, encompassing two innovation corridors: “Shanghai–Suzhou–Wuxi–Zhenjiang–Nanjing–Hefei” and “Shanghai–Jiaxing–Hangzhou–Ningbo”.
Secondly, in terms of the spatial concentration degree of dual innovation, over the four study periods, the highest concentration densities of breakthrough innovation are 4.95, 13.06, 24.07, and 28.40, with an average growth rate of 41.03%. The highest concentration densities of incremental innovation are 92.68, 232.06, 469.88, and 495.78, with an average growth rate of 38.63%. Generally, the centripetal concentration growth rate of breakthrough innovation exceeds that of incremental innovation, notably so during the periods from 2006 to 2010 and 2011 to 2015.
Thirdly, regarding the main distribution areas of dual innovation, the primary core aggregation areas of breakthrough innovation include Shanghai (21.81%), Hangzhou (13.63%), Nanjing (13.11%), and Suzhou (9.21%). The primary core aggregation areas of incremental innovation include Shanghai (26.02%), Hangzhou (12.35%), Nanjing (11.80%), and Suzhou (9.93%). Remarkably, these four core innovation hubs exhibit a comparable proportion of participation in both breakthrough innovation and incremental innovation.

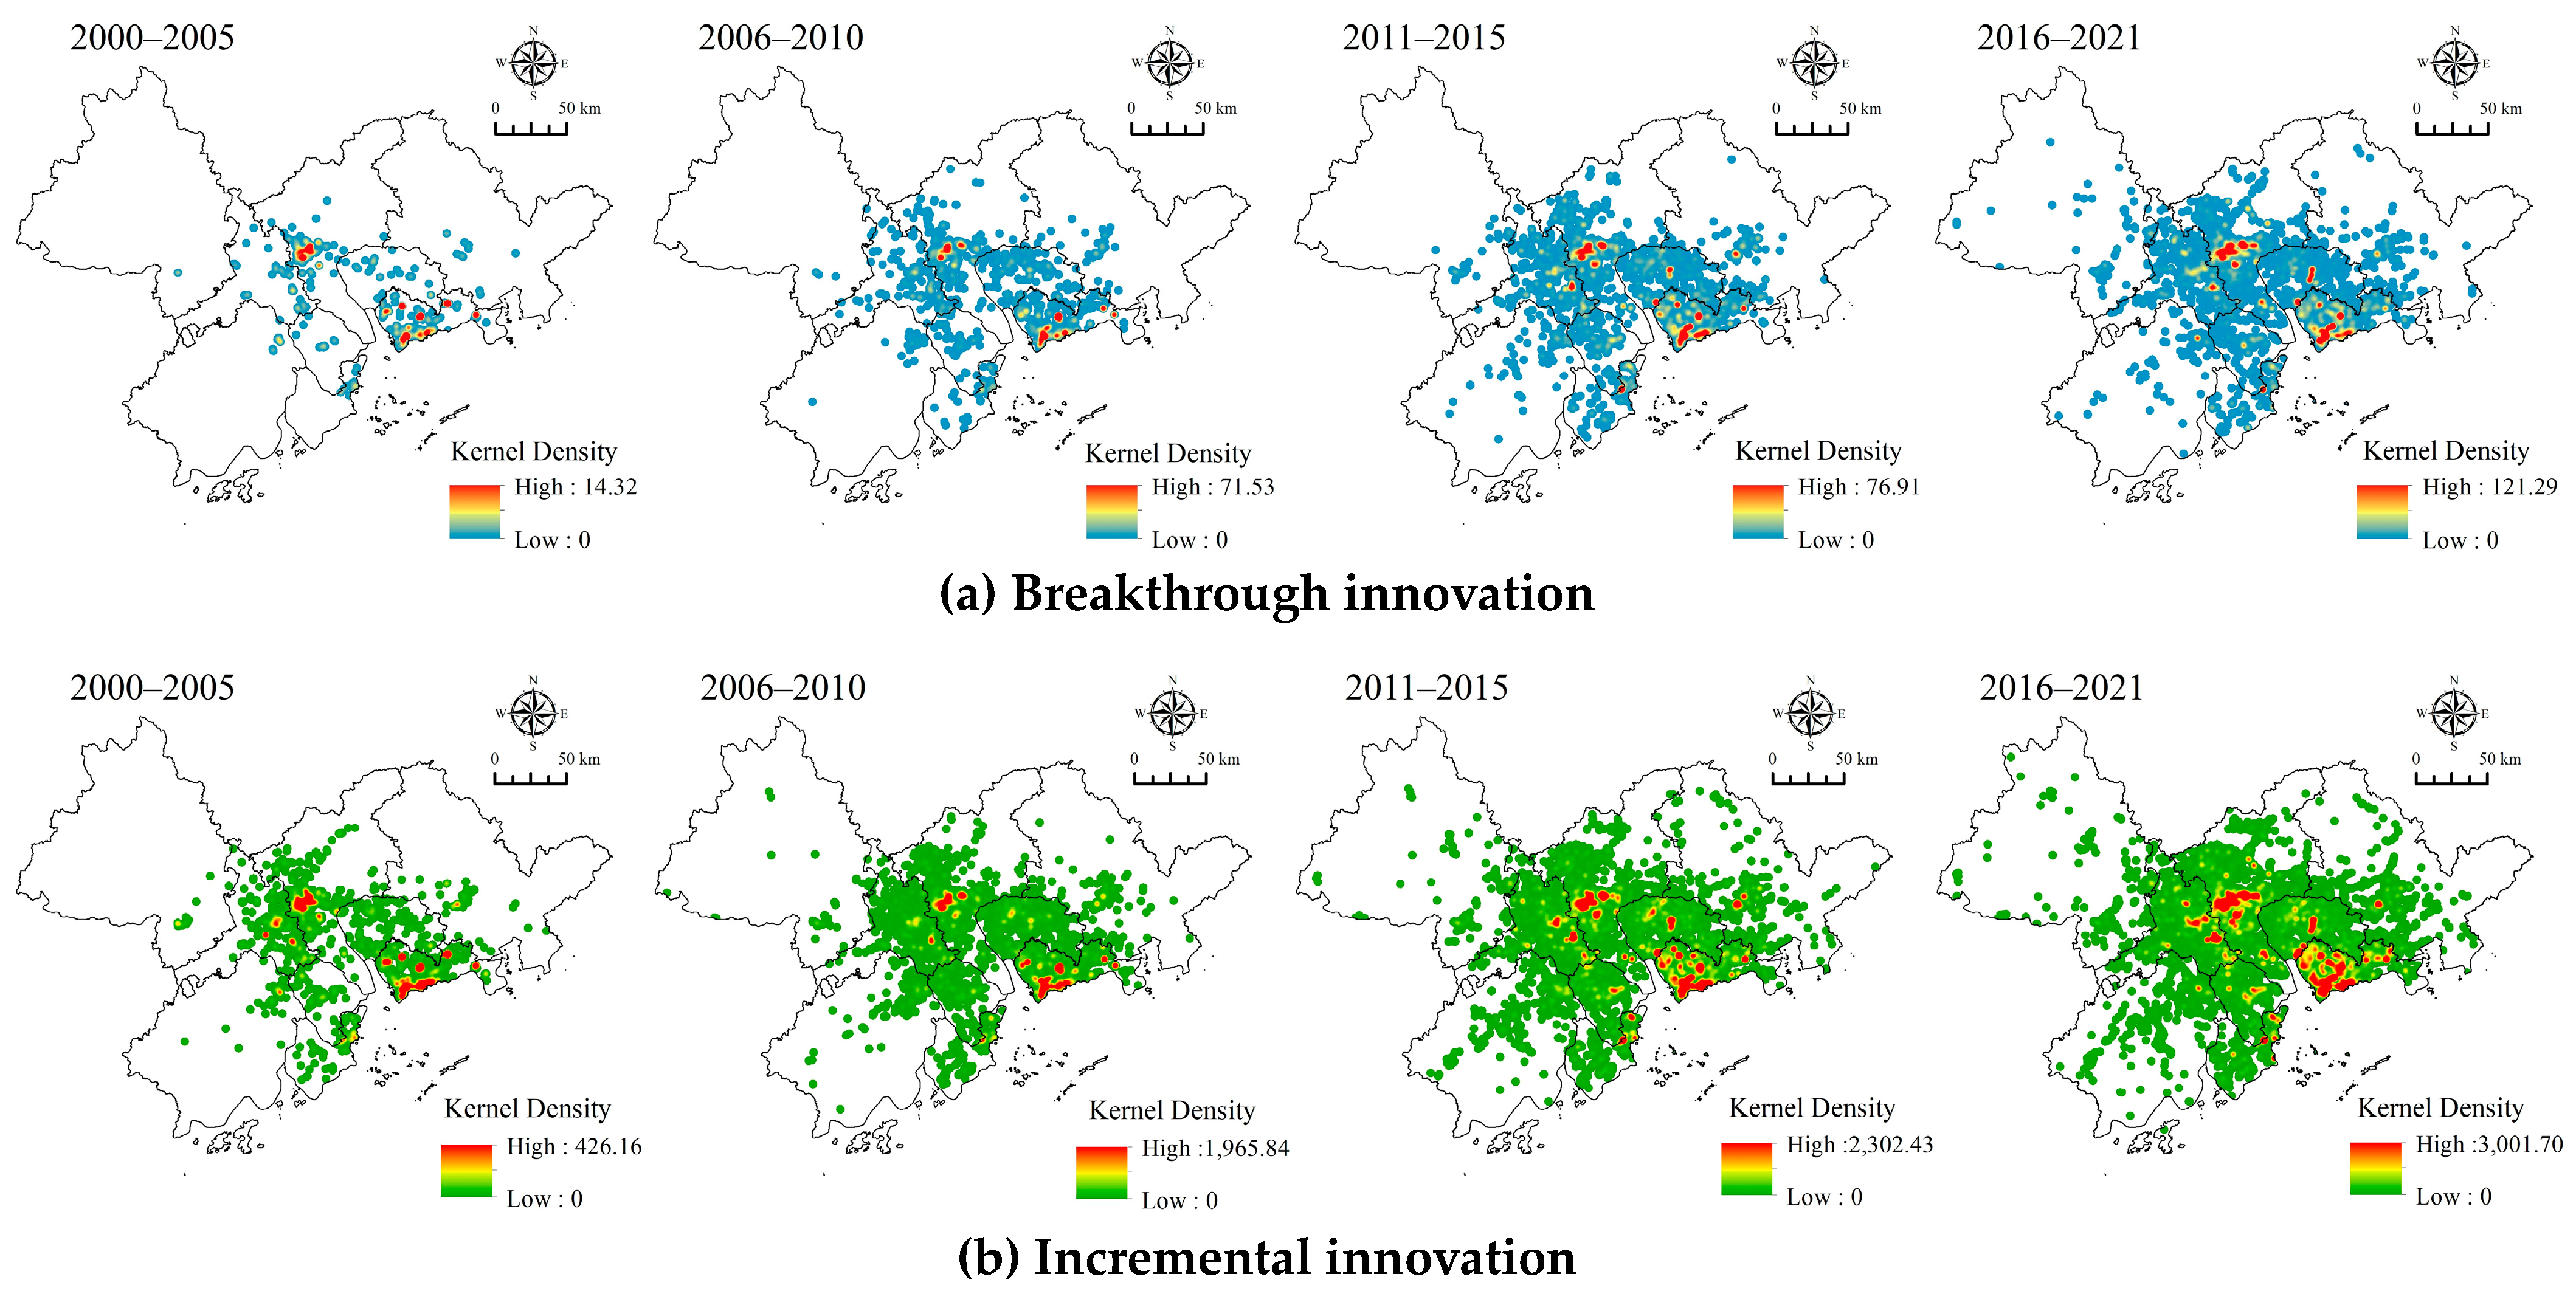
3.1.3. Pearl River Delta Urban Agglomeration

The kernel density results of dual innovation in the Pearl River Delta Urban Agglomeration exhibit distinct characteristics (Figure 5).
Firstly, concerning the overall evolution of the spatial patterns of dual innovation in the urban agglomeration, the spatial pattern of breakthrough innovation initially shows a dual-center structure composed of Guangzhou and Shenzhen, gradually evolving into a multi-core pattern incorporating Guangzhou, Shenzhen, and Dongguan. Meanwhile, the spatial pattern of incremental innovation transitions from a dual-center structure formed by Guangzhou and Shenzhen to a dual-cluster pattern formed by “Guangzhou–Foshan” and “Shenzhen–Dongguan”.
Secondly, regarding the spatial concentration degree of dual innovation activities, over the four study periods, the highest concentration densities of breakthrough innovation are 14.32, 71.53, 76.91, and 121.29, with an average growth rate of 41.19%. The highest concentration densities of incremental innovation are 426.16, 1965.84, 2302.43, and 3001.70, with an average growth rate of 38.75%. This indicates that breakthrough innovation shows a stronger centripetal trend than incremental innovation during the study periods, notably experiencing the most significant growth rates during the periods 2006–2010 and 2016–2021.
Finally, concerning the main distribution areas of dual innovation, the primary core aggregation areas of breakthrough innovation include Shenzhen (40.77%), Guangzhou (32.44%), Dongguan (8.33%), and Foshan (8.04%). The core aggregation areas of incremental innovation include Shenzhen (49.23%), Guangzhou (21.98%), Dongguan (10.43%), and Foshan (7.54%). It can be observed that Shenzhen and Guangzhou are the most crucial innovation centers in the Pearl River Delta Urban Agglomeration, while Dongguan and Foshan serve as secondary centers.
In summary, the spatial evolution characteristics of dual innovation in the three major urban agglomerations primarily exhibit the following features: Firstly, from the perspective of the spatial distribution trends of the two types of innovation, breakthrough innovation is distributed with both lower breadth and density within urban agglomerations compared to incremental innovations. Breakthrough innovation is primarily concentrated in the central urban areas of core cities, while incremental innovations have a relatively wider geographical distribution. This is related to the innovation foundation and environment of cities, as breakthrough innovation activities tend to be concentrated in regions with superior economic conditions. Secondly, regarding the spatial structural evolution in different cities, the spatial patterns of incremental innovation consistently demonstrate a stronger tendency towards multi-center distribution than those of breakthrough innovation. Thirdly, concerning the spatial relationship between breakthrough innovation and incremental innovation, they share a common origin and exhibit strong spatial correlations. For instance, in the Yangtze River Delta Urban Agglomeration, incremental innovation displays a distinct “Z”-shaped corridor effect, with the aggregation centers of breakthrough innovation distributed at critical nodes along this innovation corridor.

3.2. The Impact Factors of Urban Dual Innovation Evolution

3.2.1. Analysis of Individual Fixed Effects Regression Results

The results from Individual Fixed Effects regression models on dual innovation across different cities (Table 4) reveal the following insights:
Firstly, concerning breakthrough innovation, for cities with strong innovation capabilities such as Beijing, Shanghai, Shenzhen, Guangzhou, and Hangzhou, the influences of industrialization level and resident income are negative, while the remaining eight indicators show positive impacts. In contrast, cities with fewer instances of breakthrough innovation experience varying degrees of negative impacts from economic development level, government support, internationalization level, and collaborative innovation.
Secondly, for incremental innovation, the impact of the industrialization level is negative, while the other nine factors exhibit positive influences, albeit with significant variations across cities. Compared to large cities with strong innovation capabilities like Beijing, Shanghai, and Shenzhen, indicators related to economic foundation and the built environment have a more pronounced impact on innovation in small- to medium-sized cities with moderate innovation capabilities, such as Chizhou (3.41), Tongling (2.76), and Zhoushan (2.51). These factors are particularly influential, suggesting that they may play a key role in driving incremental innovation in these regions.
Finally, these indicators can be classified into three categories based on their impact on dual innovation across cities. The first category comprises indicators that significantly enhance both breakthrough innovation and incremental innovation, such as economic development level, resident income, government support, ecological environment, and public services. The greater these indicators’ values, the stronger their influence on dual innovation. The second category includes indicators that either have insignificant impacts or negative effects on urban dual innovation, such as economic size, internationalization level, and cultural services. The third category encompasses factors that demonstrate varied impacts across cities, such as industrialization level and collaborative innovation. For example, the industrialization level notably stimulates incremental innovation in cities with robust industrial bases like Foshan (4.00), Shenzhen (3.42), and Suzhou (3.22), whereas collaborative innovation plays a critical role in the output of incremental innovation.

3.2.2. Analysis of Time Fixed Effects Regression Results

Our research uses the Time Fixed Effects regression model to reveal the impact effects of various indicators on breakthrough innovation and incremental innovation across four time periods: 2000–2005, 2006–2010, 2011–2015, and 2016–2021 (Table 5). The results are as follows:
Firstly, regarding the impact of factors on breakthrough innovation, in the economic foundation dimension, economic volume, development level, and resident income significantly influence breakthrough innovation throughout all four research periods. Conversely, industrialization level shows a negative impact in the first three periods (−0.01, −2.58, and −3.90) but exhibits a slight positive effect after 2016 (0.09). Within the innovation dimension, policy support (1.15, 1.04, 1.07, and 1.28) demonstrates the strongest positive effect, with its influence increasing over time. Meanwhile, the positive effects of internationalization level and collaborative innovation are diminishing. In the built environment dimension, the ecological environment’s impact effect has accelerated since 2005, becoming a crucial factor in breakthrough innovation.
Secondly, concerning the impact of factors on incremental innovation, the average regression coefficients across the four periods show that resident income (4.73), ecological environment (3.27), and economic development level (2.98) are the top three factors with significant positive impact effects. These factors have regression coefficients for incremental innovation efficiency greater than 1, suggesting that a 1% increase in these factors leads to more than a 1% increase in efficiency in incremental innovation. In the economic foundation dimension, factors such as economic size, economic development level, and resident income all have a significant positive effect on incremental innovation. In contrast, the industrialization level factor has a negative impact on innovation. However, over time, this negative impact has been showing a gradual weakening trend. In terms of innovation atmosphere dimensions, government support (0.782) and collaborative innovation (0.671) exhibit the most substantial average impact effects.
Finally, considering the differences in the effects of various factors on breakthrough innovation and incremental innovation across the four study periods, to begin with, both breakthrough innovation and incremental innovation are positively influenced in the following order: economic foundation > urban construction > innovation atmosphere. Moreover, within the economic foundation dimension, economic size and economic development level show similar trends for both types of innovation but have a more pronounced effect on breakthrough innovation. This suggests that improving economic conditions can more effectively support breakthrough innovation. The negative impact of the industrialization level on both types of innovation has lessened over the four periods, with the industrialization level having a slight positive effect on disruptive innovation (0.087) between 2016 and 2021, likely due to China’s evolving industrial development. Historically, China’s industrial growth was driven by low-to-mid-end assembly manufacturing, which did not often stimulate innovation. However, recent shifts towards innovation and high-quality development in the industrial sector have mitigated the negative impact of industrialization on both types of innovation. Additionally, in the innovation atmosphere dimension, government support has a greater positive impact on disruptive innovation than on incremental innovation. Collaborative innovation had a more significant effect on disruptive innovation compared to incremental innovation during the 2000–2005 and 2006–2010 periods. However, since 2011, its influence on incremental innovation has exceeded that of disruptive innovation. The role of internationalization level in breakthrough innovation has decreased over time (0.935, 0.944, 0.809, and 0.859), while its effect on incremental innovation has increased (0.364, 0.655, 0.707, and 0.734). Ultimately, factors from the built environment—such as ecological environment, cultural services, and public services—play a significant role in influencing both types of innovation, underscoring the importance of the urban built environment in fostering innovation activities.

3.3. The Spatial Relationship and Organizational Patterns of Urban Dual Innovation

3.3.1. The Location Relationship between Breakthrough Innovation and Incremental Innovation

We established six buffer zones centered on breakthrough innovation patent points, with a radius of 0.1 km, 0.5 km, 1 km, 2 km, 3 km, and 5 km. Subsequently, we calculated the quantity of incremental innovation within each buffer zone, revealing the following findings (Figure 6):
From the spatial perspective, there exists a significant correlation between breakthrough innovation and incremental innovation. Within a 5 km radius centered around breakthrough innovation, over 95% of incremental innovations are concentrated, indicating a common spatial clustering center for both types of innovation.
Regarding the overall evolution trends across different research stages, the spatial correlation between breakthrough and incremental innovation continues to strengthen. Over time, within the same buffer zone ranges, the proportion of incremental innovation consistently increases. For example, in a 100 m radius buffer zone, the proportion of incremental innovation as a total quantity rose from 67.68% during 2000–2005 to 82.63% during 2016–2021.
When comparing the three case study areas, the average proportion of incremental innovation relative to breakthrough innovation is as follows: Beijing–Tianjin–Hebei Urban Agglomeration (79.73%, 89.10%, 93.50%, 96.27%, and 97.25%), Yangtze River Delta Urban Agglomeration (65.49%, 77.98%, 86.37%, 93.10%, and 95.60%), and Pearl River Delta Urban Agglomeration (81.25%, 87.68%, 92.67%, 96.43%, and 97.88%). These results indicate that the spatial relationship between breakthrough and incremental innovation is strongest in the Pearl River Delta Urban Agglomeration, followed by the Beijing–Tianjin–Hebei Urban Agglomeration and Yangtze River Delta Urban Agglomeration.

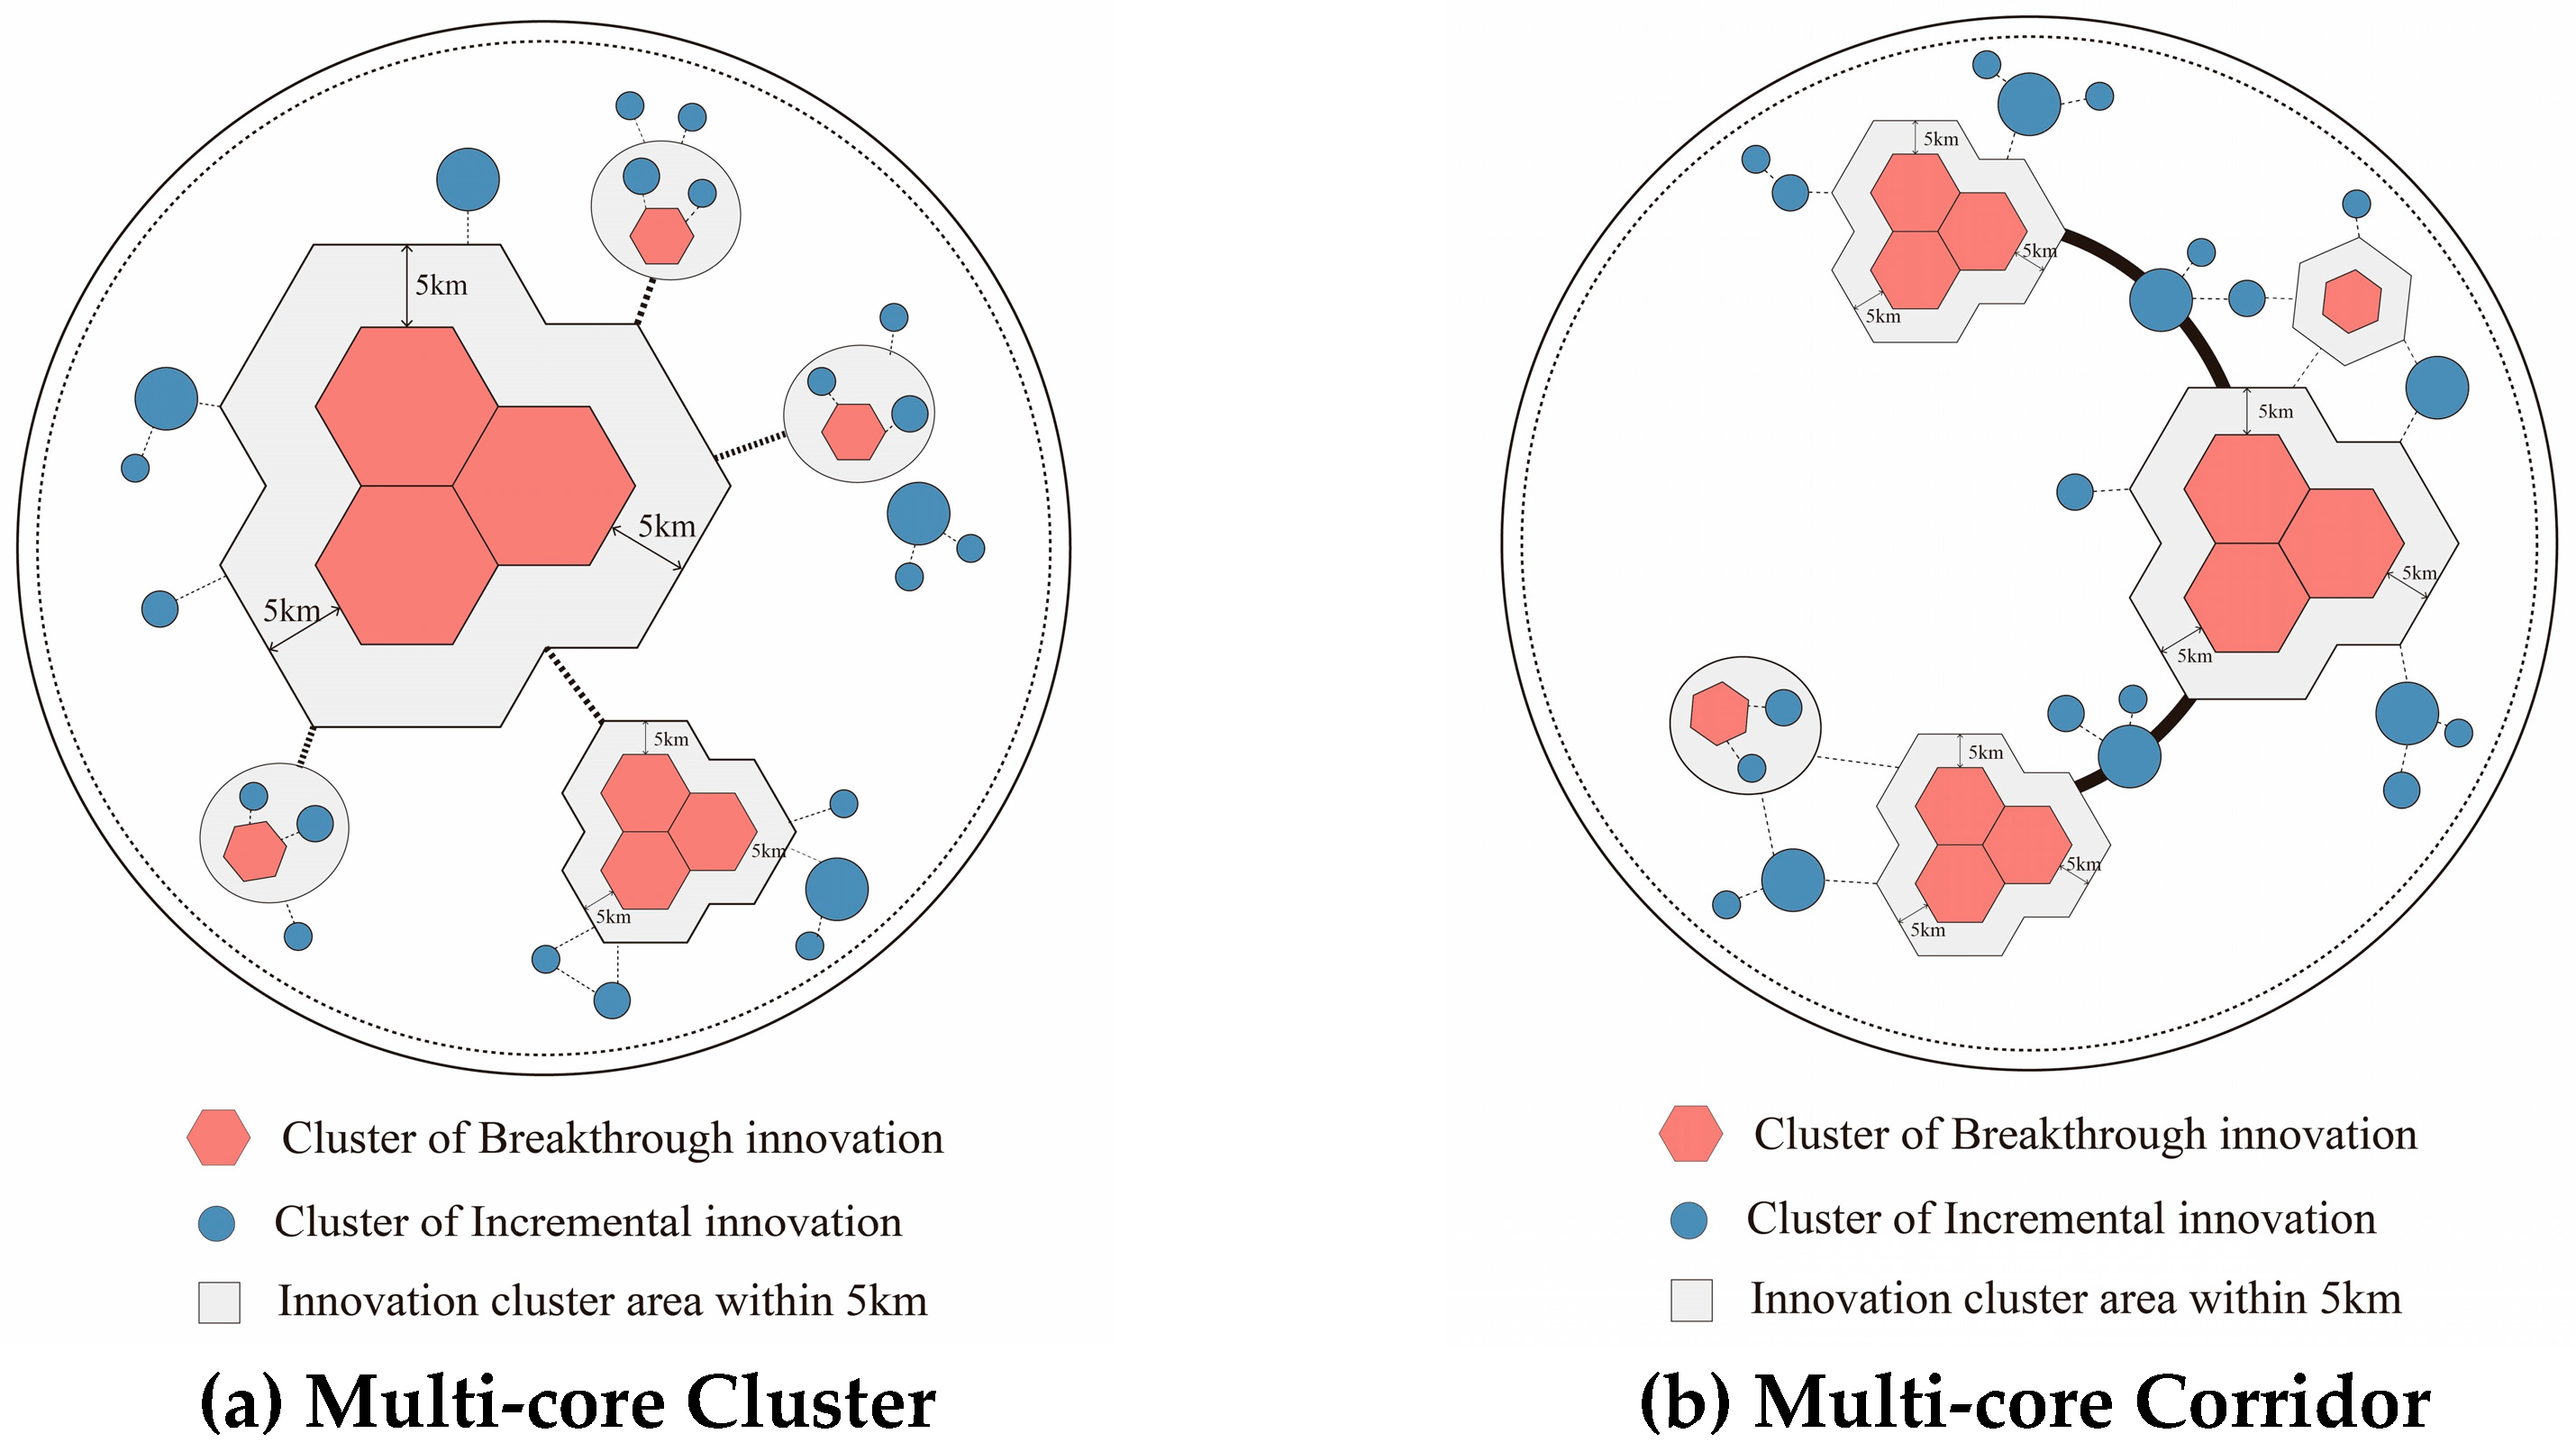
3.3.2. The Spatial Organization Patterns of Urban Dual Innovation

Based on the research above, several key findings emerge: First, breakthrough innovation and incremental innovation are closely interconnected spatially, indicating a strong correlation between them. Second, both types of innovation demonstrate multi-center clustering tendencies. Breakthrough innovation tends to concentrate in major urban centers, while incremental innovation tends to cluster around these breakthrough innovations, reflecting a robust multi-center distribution pattern. Thirdly, the spatial organization of dual innovations in the three major urban agglomerations reveals distinct similarities and differences: the Beijing–Tianjin–Hebei Urban Agglomeration exhibits a dual-center structure, the Yangtze River Delta Urban Agglomeration follows a corridor-like “Z”-shaped pattern, and the Pearl River Delta Urban Agglomeration displays a dual-cluster arrangement. Based on these observations, our research categorizes urban dual innovation spatial patterns into two main patterns (Figure 7): Multi-core Cluster and Multi-core Corridor.
The first pattern is the Multi-core Cluster. This spatial organization pattern of urban innovation has three core characteristics: First, the regional innovation landscape displays a distinct pyramid structure, where only a few areas within the region possess robust innovation capabilities, typically functioning as economic, political, and cultural centers. Secondly, a limited number of regions with exceptional innovation capacities serve as primary aggregation points for breakthrough innovations within the region, concentrating over 70% of such activities. Thirdly, the spatial distribution of breakthrough and incremental innovations in these regions resembles each other, with incremental innovation predominantly centered around the primary aggregation hubs of breakthrough innovation. Within the context of the three major urban clusters, the Beijing–Tianjin–Hebei and Pearl River Delta clusters exemplify this organizational model. For example, in the Beijing–Tianjin–Hebei cluster, a dual-core structure is observed with Beijing as the primary innovation hub and Tianjin as a secondary core area. Urban dual innovation is heavily concentrated in these two core cities, while other cities within the cluster exhibit a pattern of innovation distribution that is small-scale and dispersed.
Another pattern is the Multi-core Corridor. This spatial organization pattern of innovation is characterized by several key features: Firstly, it features a less pronounced pyramid structure in the regional innovation division, instead favoring a flatter, olive-shaped distribution. This results in a relatively balanced distribution of top innovation areas, core innovation areas, and general innovation areas within the region. Secondly, the region forms a continuous aggregation area for innovation along major transportation routes, rivers, and other infrastructural corridors. This creates distinct corridor effects, with top innovation areas serving as significant nodes along these corridors. Thirdly, the top innovation areas act as crucial hubs for breakthrough innovation, while other cities situated along the corridor develop into innovation hubs focused on incremental innovations. Examining the three major urban clusters, the Yangtze River Delta urban cluster exemplifies this organizational model. Along the Yangtze River and major highways in the region, an innovation corridor has emerged, with cities like Shanghai, Nanjing, Suzhou, and Hangzhou serving as pivotal innovation nodes. Surrounding cities such as Zhenjiang, Ningbo, and Nantong contribute to the cluster with strong concentrations of incremental innovation.

4. Discussion

In recent years, innovation issues have garnered interdisciplinary attention. However, there has been relatively little discussion in these studies regarding the variations in innovation activities. Our research takes a perspective focusing on the varying degrees of innovation impact, investigating the evolution and influencing factors of urban dual innovation spatial patterns. We explored the spatial relationship and organizational patterns of these two types of innovation, which are essential for comprehending the formation and evolutionary principles of urban dual innovation spatial patterns.
Theoretically, our research deepens the discussion on the spatial relationship between breakthrough innovation and incremental innovation. Previous studies on dual innovation relationships have primarily focused on the geographic patterns of breakthrough innovation [44,54,55], the strategic balance of firms in choosing dual innovation [33,71,72,73], and the mechanisms underlying breakthrough innovation and incremental innovation [74,75,76]. However, there has been limited research on the spatial relationship between breakthrough innovation and incremental innovation. Our research delves into this aspect using case studies from China’s three major urban agglomerations. The research reveals that breakthrough innovation and incremental innovation share common locational characteristics. Specifically, within a 5 km radius centered on breakthrough innovation patents, over 95% of incremental innovation patents can be found, demonstrating a pattern of distance decay. This discovery has significant implications for a deeper understanding of the relationship between breakthrough innovation and incremental innovation.
Empirically, our research provides a compelling case study for understanding the aggregation patterns of breakthrough innovation and incremental innovation between developing and developed countries through an analysis of China. Compared to developed regions like Europe and America, China exhibits a relatively lower value-added industry [6]. Examining the spatial distribution of breakthrough innovation and incremental innovation within a developing economy and comparing it with developed nations helps us refine our understanding of this phenomenon. Our findings demonstrate that breakthrough innovation is mainly concentrated in the core areas of urban agglomerations, consistent with research findings from Western countries such as the U.S. [44,45,77]. These core areas possess a diverse knowledge base and abundant innovation resources [12,47]. Additionally, the high density of these core areas promotes informal linkages and knowledge spillovers, which help innovation actors acquire new knowledge and engage in unconventional knowledge creation [44,78]. Moreover, our study reveals that innovative activities diffuse along major transportation routes (e.g., rivers, and highways), forming corridor-like spatial structures where breakthrough innovations serve as pivotal nodes. This suggests two key points: firstly, whether in developed or developing contexts, breakthrough innovation tends to occur in core areas abundant in innovation factors and resources; secondly, the clustering of dual innovation activities within urban agglomerations follows a “Point-Axis” model based on their spatial structures.
Furthermore, our research advances discussions on the correlations between factors such as government support, collaborative innovation, and internationalization levels with dual innovation activities. Regarding policy support, our research finds that over four periods from 2000 to 2021, policy support had a stronger positive impact on breakthrough innovation compared to incremental innovation. This finding represents a step forward from previous research, which only indicated a positive impact of policy on innovation [60,79]. Our research demonstrates that increased public financial expenditure on scientific and technological activities is more likely to foster breakthrough innovation activities. Concerning collaborative innovation, our research confirms a positive correlation between collaborative innovation and dual innovation activities. Specifically, its positive effect on breakthrough innovation is stronger than that on incremental innovation. This aligns with prior research suggesting that collaboration among inventors contributes to breakthrough innovation [57,80]. Our conclusions indicate that breakthrough innovation is more likely to emerge from collaborative innovation efforts.
In the study of differences in innovation mechanisms across different cities, this article and previous research have reached similar conclusions. Rodríguez-Pose et al. found significant differences in innovation mechanisms between more and less developed cities in China. They noted that in more developed cities, indicators related to innovation, such as R&D activities, and large human capital endowments exhibit a positive correlation, whereas these indicators seldom impact less developed cities. Instead, the latter are primarily influenced by factors related to the urban public environment [64]. Our study aligns with these findings, showing that cities with prominent innovation capabilities like Beijing and Shanghai experience a stronger impact from factors such as collaborative innovation, industrialization level, and resident incomes. In contrast, cities with average innovation capabilities are primarily influenced by indicators like ecological environment, public services, and cultural services.
This study provides several insights into the formulation of innovation policies. Firstly, breakthrough innovation and incremental innovation serve different functions in regional economic development. Breakthrough innovation facilitates the creation of new technological pathways and higher profit margins, whereas incremental innovation enhances market adaptability, thereby promoting steady regional economic growth. Consequently, when crafting regional innovation policies, it is essential to balance the allocation of innovation resources, manage risks effectively, and achieve the organic coordination of breakthrough innovation and incremental innovation. For example, the United States has coordinated the allocation of innovation resources through various sectors, established the National Network for Manufacturing Innovation (NNMI, later renamed Manufacturing USA), and set up research and innovation institutions in key areas to lead innovation development in crucial industrial sectors. Secondly, our research underscores the need for tailored innovation strategies based on the innovation capabilities of cities. Cities with robust innovation capabilities should cultivate an environment conducive to innovation, focusing specifically on breakthrough innovations to capture a larger market share in global competition. Conversely, cities with moderate innovation capabilities should identify suitable roles within regional divisions of labor and supplement their innovation deficits by integrating external technologies. For instance, Singapore promotes local innovation development primarily by offering policy incentives to attract multinational companies to establish their R&D headquarters in the country. It also fosters innovation connections between multinational corporations and local Small and Medium-sized Enterprises (SMEs), thereby advancing local innovation development.
It is important to acknowledge that our research is not without its limitations. Firstly, patents are but one facet of innovation, thereby limiting the comprehensiveness of patent data in capturing the full spectrum of innovative activities within a region. Furthermore, in attempting to quantify the significance of breakthrough innovation, this research predominantly relies on the count of patent citations, which, however, masks substantial variations across industries. Consequently, this approach risks overlooking pivotal innovations in niche sectors that may not be adequately reflected by mere citation counts.
Inevitably, our research also has some limitations. For example, patents are merely one form of innovation, and patent data cannot represent all innovative activities within a region. Additionally, there are significant variations in the number of patent citations across different industries, which means relying solely on patent citation data to measure the importance of patents may overlook important innovations in niche industries.

5. Conclusions

Existing research often views innovation as a homogenized behavior and rarely discusses the differences in its impacts. Our research, based on patent data from China’s three major urban agglomerations spanning from 2000 to 2021, defines the top 5% of the most cited patents as breakthrough innovation and categorizes the rest as incremental innovation. We investigated the spatial pattern evolution, influencing factors, spatial relationship, and organizational patterns of breakthrough innovation and incremental innovation. Our research is crucial for supplementing the current research by addressing the spatial relationship between breakthrough innovation and incremental innovation, thereby enhancing our understanding of the differentiation mechanism of urban dual innovation. The key findings of this study include the following:
Firstly, the evolution of spatial patterns of urban dual innovation demonstrates a multi-center agglomeration, with breakthrough innovation primarily concentrated within the core areas of urban agglomeration, while incremental innovation predominantly surrounds these core areas.
Secondly, the effects of different factors on dual innovation vary across different periods and cities with different innovation capacities. Across four study periods, indicators related to economic foundation consistently exerted a stronger positive influence on dual innovation compared to indicators related to the built environment and innovation atmosphere dimensions. This suggests that innovation tends to occur more frequently in cities with a robust economic foundation. Regarding differentiated impacts among cities with different innovation capabilities, breakthrough innovation in cities with strong innovation capabilities is primarily associated with indicators related to the innovation atmosphere, while incremental innovation in cities with moderate innovation capabilities is mainly influenced by factors related to economic foundation and built environment.
Thirdly, the spatial relationship between breakthrough innovation and incremental innovation exhibits a distance decay pattern. This implies that as geographic locations move further away from the core agglomeration areas of breakthrough innovation, the frequency of incremental innovation activities tends to decrease. This highlights spatial dependence and gradient differences in the influence of dual innovations. Moreover, the innovation spillover effect from breakthrough innovation clusters to surrounding areas diminishes with greater geographic distance.
Finally, drawing on empirical research from China’s three major urban agglomerations, we identified two spatial organizational patterns of urban dual innovation: the Multi-core Cluster and the Multi-core Corridor. In the Multi-core Cluster pattern, the regional innovation division features a prominent pyramid structure, with innovation concentrated primarily in a few key areas. Conversely, the Multi-core Corridor pattern shows a more flattened olive-shaped structure in the regional innovation division, where distinctions in numbers between leading innovation areas, core innovation areas, and general innovation areas are less pronounced.
In future research, we recommend focusing on the following key areas: Firstly, there is an urgent need to address the issue of inequality in urban innovation, particularly the differentiated mechanisms of breakthrough and incremental innovation between developed and underdeveloped regions. Research should delve into the specific differences in these regions and analyze the fundamental causes of these differences. Second, studies should further examine the interrelationship and impact of breakthrough innovation and incremental innovation within urban innovation systems. Specifically, it is necessary to analyze whether these two types of innovations are complementary or mutually exclusive, how they jointly affect urban economic development, and their specific impact on the regional division of labor between cities. Through this research, we can gain a deeper understanding of how dual innovation functions in urban economic development and how targeted policy adjustments should be made.

Author Contributions

This paper was written with the contributions of all authors as follows: conceptualization, Q.C. and Y.L.; methodology, Q.C. and Z.Y.; data curation, Q.C.; funding acquisition, Q.C. and Y.L.; project administration, Y.L.; writing—original draft, Q.C. and Z.Y.; writing—review and editing, Y.L. All authors have read and agreed to the published version of the manuscript.

Funding

This research was funded by the State Key Laboratory of Subtropical Building and Urban Science, grant number 2023ZB17.

Data Availability Statement

The data presented in this study are available upon request from the corresponding author. The data are not publicly available due to data being in use.

Conflicts of Interest

The authors declare no conflicts of interest.

References

  1. Romer, P. Endogenous technological-change. J. Polit. Econ. 1990, 98, 71–102. [Google Scholar] [CrossRef]
  2. Balland, P.; Rigby, D. The geography of complex knowledge. Econ. Geogr. 2017, 93, 1–23. [Google Scholar] [CrossRef]
  3. Schumpeter, J. The Theory of Economic Development; Springer: London, UK, 1921; pp. 181–186. [Google Scholar]
  4. Prahalad, C.; Hamel, G. The core competence of the corporation. Harv. Bus. Rev. 1990, 68, 71–91. [Google Scholar] [CrossRef]
  5. Teece, D.; Pisano, G. The dynamic capabilities of firms: An introduction. Ind. Corp. Chang. 1994, 3, 537–556. [Google Scholar] [CrossRef]
  6. Meng, B.; Ming, Y. Smile curves in global value chains: Foreign vs. domestic-owned firms; the U.S. vs. China. Struct. Chang. Econ. Dyn. 2022, 60, 15–29. [Google Scholar] [CrossRef]
  7. Dennis, W.; Li, J.; Ning, Y. Corporate networks, value chains, and spatial organization: A study of the computer industry in China. Urban Geogr. 2010, 31, 1118–1140. [Google Scholar] [CrossRef]
  8. Sun, Y.; Zhou, Y.; Lin, G.; Wei, Y. Subcontracting and supplier innovativeness in a developing economy: Evidence from China’s information and communication technology industry. Reg. Stud. 2013, 47, 1766–1784. [Google Scholar] [CrossRef]
  9. Feldman, P. The Geography of Innovation; Springer: London, UK, 1994; pp. 66–68. [Google Scholar]
  10. Florida, R. The economic geography of talent. Ann. Am. Assoc. Geogr. 2002, 92, 743–755. [Google Scholar] [CrossRef]
  11. Liu, Y.; Huang, C.; Zhang, F.; Ma, H. Locational preferences of high-level overseas talent returning to China: Evidence from microdata analysis. Popul. Space Place 2023, 29, e2650. [Google Scholar] [CrossRef]
  12. Esposito, R.; Rigby, L. Buzz and pipelines: The costs and benefits of local and nonlocal interaction. J. Econ. Geogr. 2019, 19, 753–773. [Google Scholar] [CrossRef]
  13. Suntje, S. Balancing the spatial localisation ‘Tilt’: Knowledge spillovers in processes of knowledge-intensive services. Geoforum 2015, 65, 374–386. [Google Scholar] [CrossRef]
  14. Kramer, J.; Diez, R. Catching the local buzz by embedding? Empirical insights on the regional embeddedness of multinational enterprises in Germany and the UK. Reg. Stud. 2021, 46, 1303–1317. [Google Scholar] [CrossRef]
  15. Balland, P.-A.; Belso-Martínez, J.A.; Morrison, A. The dynamics of technical and business knowledge networks in industrial clusters: Embeddedness, status, or proximity? Econ. Geogr. 2016, 92, 35–60. [Google Scholar] [CrossRef]
  16. Harmaakorpi, V.; Melkas, H. Knowledge management in regional innovation networks: The case of Lahti, Finland. Eur. Plan. Stud. 2005, 13, 641–659. [Google Scholar] [CrossRef]
  17. Cooke, P.; Uranga, G.; Etxebarria, G. Regional systems of innovation: An evolutionary perspective. Environ. Plan. A 1998, 30, 1563–1584. [Google Scholar] [CrossRef]
  18. Makkonen, T.; Weidenfeld, A.; Williams, M. Cross-border regional innovation system integration: An analytical framework. Tijdschr. Econ. Soc. Geogr. 2017, 6, 805–820. [Google Scholar] [CrossRef]
  19. Docquier, F.; Rapoport, H. Globalization, brain drain, and development. J. Econ. Lit. 2012, 50, 681–730. [Google Scholar] [CrossRef]
  20. Dequiedt, V.; Zenou, Y. International migration, imperfect information, and brain drain. J. Dev. Econ. 2013, 102, 62–78. [Google Scholar] [CrossRef]
  21. Gu, H.; Francisco, R.; Liu, Y.; Shen, T. Geography of talent in China during 2000–2015: An eigenvector spatial filtering negative binomial approach. Chin. Geogr. Sci. 2021, 31, 297–312. [Google Scholar] [CrossRef]
  22. Shearmur, R. Are cities the font of innovation? A critical review of the literature on cities and innovation. Cities 2012, 29, 9–18. [Google Scholar] [CrossRef]
  23. Balland, P.; Broekel, T.; Diodato, D.; Giuliani, E.; Hausmann, R.; O’Clery, N.; Rigby, D. The new paradigm of economic complexity. Res. Policy 2022, 51, 104450. [Google Scholar] [CrossRef] [PubMed]
  24. Nico, P.; Thomas, S. The complex nature of regional knowledge production: Evidence on European regions. Res. Policy 2022, 51, 104170. [Google Scholar] [CrossRef]
  25. Ascani, A.; Bettarelli, L.; Resmini, L.; Balland, P. Global networks, local specialisation and regional patterns of innovation. Res. Policy 2020, 49, 104031. [Google Scholar] [CrossRef]
  26. Liang, X.; Hidalgo, A.; Balland, P.; Zheng, S.; Wang, J. Intercity connectivity and urban innovation. Comput. Environ. Urban 2024, 109, 102092. [Google Scholar] [CrossRef]
  27. Michael, E.; Araki, D.; Bennett, G. Regional innovation networks & high-growth entrepreneurship. Res. Policy 2024, 53, 104900. [Google Scholar] [CrossRef]
  28. Doh, S.; Kim, B. Government support for SME innovations in the regional industries: The case of government financial support program in South Korea. Res. Policy 2014, 43, 1557–1569. [Google Scholar] [CrossRef]
  29. Fiore, A.; Grisorio, M.; Prota, F. Regional innovation systems: Which role for public policies and innovation agencies? Some insights from the experience of an Italian region. Eur. Plan. Stud. 2011, 19, 1399–1422. [Google Scholar] [CrossRef]
  30. Benedikt, W. Place-based allocation of R&D funding: Directing the German innovation system for hydrogen technologies in space. Environ. Innov. Soc. Transit. 2024, 52, 100878. [Google Scholar] [CrossRef]
  31. Schumpeter, J. Business Cycles: A Theoretical Historical and Statistical Analysis of the Capitalist Process; McGraw-Hlill Book Company: New York, NY, USA, 1939; pp. 83–90. [Google Scholar]
  32. March, G. Exploration and exploitation in organizational learning. Organ. Sci. 1991, 2, 71–87. [Google Scholar] [CrossRef]
  33. Christensen, C. The Innovator’s Dilemma; Harvard Business School Press: Boston, MA, USA, 2000; pp. 66–72. [Google Scholar]
  34. Ritala, P.; Hurmelinna-Laukkanen, P. Incremental and radical innovation in coopetition—The role of absorptive capacity and appropriability. J. Prod. Innov. Manag. 2013, 30, 154–169. [Google Scholar] [CrossRef]
  35. Uzzi, B.; Mukherjee, S.; Stringer, M.; Jones, B. A typical combinations and scientific impact. Science 2013, 342, 468–472. [Google Scholar] [CrossRef] [PubMed]
  36. Kim, D.; Cerigo, D.; Jeong, H.; Youn, H. Technological novelty profile and invention’s future impact. EPJ Data Sci. 2016, 5, 8. [Google Scholar] [CrossRef]
  37. Guan, J.; Liu, N. Exploitative and exploratory innovations in knowledge network and collaboration network: A patent analysis in the technological field of nano-energy. Res. Policy 2016, 45, 97–112. [Google Scholar] [CrossRef]
  38. Mewes, L.; Ebert, T.; Obschoka, M.; Rentfrow, P.; Atof, J.; Gosling, S. Psychological openness and the emergence of breakthrough vs. Incremental innovations: A regional perspective. Econ. Geogr. 2022, 98, 379–410. [Google Scholar] [CrossRef]
  39. Azoulay, P.; Graff Zivin, J.; Li, D.; Sampat, P. Public R&D investments and private-sector patenting: Evidence from NIH funding rules. Rev. Econ. Stud. 2019, 8, 117–152. [Google Scholar] [CrossRef]
  40. D’Este, P.; Marzucchi, A.; Rentocchini, F. Exploring and yet failing less: Learning from past and current exploration in R&D. Ind. Corp. Chang. 2018, 27, 525–553. [Google Scholar] [CrossRef]
  41. Stephan, P.; Veugelers, R.; Wang, J. Reviewers are blinkered by bibliometrics. Nature 2017, 544, 411–412. [Google Scholar] [CrossRef]
  42. Wang, J.; Lee, Y.; Walsh, J. Funding model and creativity in science: Competitive versus block funding and status contingency effects. Res. Policy 2018, 47, 1070–1083. [Google Scholar] [CrossRef]
  43. Kahn, K. Understanding innovation. Bus. Horiz. 2018, 3, 453–460. [Google Scholar] [CrossRef]
  44. Esposito, C. The geography of breakthrough invention in the United States over the 20th century. Res. Policy 2023, 52, 104810. [Google Scholar] [CrossRef]
  45. Enrico, B.; Ruben, G. The geography of unconventional innovation. Econ. J. 2021, 131, 1466–1514. [Google Scholar] [CrossRef]
  46. Ren, C.; Wang, T.; Wang, L.; Zhang, Y. ‘Buzz-and-Pipeline’ dynamics of urban dual innovation: Evidence from China’s biomedical industry. Appl. Geogr. 2023, 158, 103048. [Google Scholar] [CrossRef]
  47. Castaldi, C.; Frenken, K.; Los, B. Related variety, unrelated variety and technological breakthroughs: An analysis of us state-level patenting. Reg. Stud. 2015, 49, 767–781. [Google Scholar] [CrossRef]
  48. Martin, R.; Sunley, P. Path dependence and regional economic evolution. J. Econ. Geogr. 2006, 6, 395–437. [Google Scholar] [CrossRef]
  49. Wang, Z.; Zeng, Y.; Wang, X.; Gu, T.; Chen, W. Impact of urban expansion on carbon emissions in the urban agglomerations of Yellow River Basin, China. Land 2024, 13, 651. [Google Scholar] [CrossRef]
  50. Ke, N.; Zhang, X.; Lu, X.; Kuang, B.; Jiang, B. Regional disparities and influencing factors of eco-efficiency of arable land utilization in China. Land 2022, 11, 257. [Google Scholar] [CrossRef]
  51. Ma, Z.; Huang, Y. The spatial pattern and influencing factors of urban knowledge-intensive business services: A case study of Wuhan metropolitan area, China. Sustainability 2024, 16, 1110. [Google Scholar] [CrossRef]
  52. Shukla, A.; Jain, K. Critical analysis of spatial-temporal morphological characteristic of urban landscape. Arab. J. Geosci. 2019, 12, 112. [Google Scholar] [CrossRef]
  53. Mewes, L. Scaling of atypical knowledge combinations in American metropolitan areas from 1836 to 2010. Econ. Geogr. 2019, 95, 41–361. [Google Scholar] [CrossRef]
  54. Carolina, C.; Bart, L. Geographical patterns in us inventive activity 1977–1998: The “regional inversion” was underestimated. Res. Policy 2017, 46, 1187–1197. [Google Scholar] [CrossRef]
  55. Phene, A.; Fladmoe-Lindquist, K. Breakthrough innovations in the US biotechnology industry: The effects of technological space and geographic origin. Strateg. Manag. J. 2006, 27, 369–388. [Google Scholar] [CrossRef]
  56. Dirk, A.; Carolina, C.; Bart, L. Do ‘liberal market economies’ really innovate more radically than ‘coordinated market economies’?: Hall and Soskice reconsidered. Res. Policy 2009, 38, 181–191. [Google Scholar] [CrossRef]
  57. Singh, J.; Fleming, L. Lone Inventors as Sources of Breakthroughs: Myth or Reality? Manag. Sci. 2010, 56, 41–56. [Google Scholar] [CrossRef]
  58. Vasin, S.M.; Timokhina, D.M. Specific effect of innovation factors on socioeconomic development of countries in view of the global crisis. Economies 2024, 12, 190. [Google Scholar] [CrossRef]
  59. Dempere, J.; Muhammad, Q.; Hesham, A.; Sabir, M. The impact of innovation on economic growth, foreign direct investment, and self-employment: A global perspective. Economies 2023, 11, 182. [Google Scholar] [CrossRef]
  60. Wu, K.; Chen, Y.; Zhang, H.; Liu, Y.; Wang, M.; Ye, Y.; Gong, W. ICTs capability and strategic emerging technologies: Evidence from Pearl River Delta. Appl. Geogr. 2023, 157, 103019. [Google Scholar] [CrossRef]
  61. Usman, K.; Liu, Z.; Anjum, M. The evaluation of innovation capacity of China and its influencing factors. Asian Soc. Sci. 2015, 11, 180. [Google Scholar] [CrossRef]
  62. Fan, P.; Wan, G.; Lu, M. China’s regional inequality in innovation capability, 1995–2006. China World Econ. 2021, 20, 16–36. [Google Scholar] [CrossRef]
  63. Capello, R.; Caragliu, A.; Lenzi, C. Is innovation in cities a matter of knowledge-intensive services? An empirical investigation. Innovation 2012, 25, 151–174. [Google Scholar] [CrossRef]
  64. Rodríguez-Pose, A.; Wilkie, C.; Zhang, M. Innovating in “lagging” cities: A comparative exploration of the dynamics of innovation in Chinese cities. Appl. Geogr. 2021, 132, 102475. [Google Scholar] [CrossRef]
  65. Bathelt, H.; Li, P. Global cluster networks: Foreign direct investment flows from Canada to China. J. Econ. Geogr. 2014, 14, 45–71. [Google Scholar] [CrossRef]
  66. Agrawal, A.; Galasso, A.; Oettl, A. Roads and innovation. Rev. Econ. Stat. 2017, 99, 417–434. [Google Scholar] [CrossRef]
  67. Yu, H.; Liu, D.; Zhang, C.; Yu, L.; Yang, B.; Qiao, S.; Wang, X. Research on spatial-temporal characteristics and driving factors of urban development intensity for Pearl River Delta region based on Geodetector. Land 2023, 12, 1673. [Google Scholar] [CrossRef]
  68. Liu, K.; Liu, W.; Wu, J.; Chen, Z.; Zhang, W.; Liu, F. Spatial differences and influencing factors of urban water utilization efficiency in China. Front. Environ. Sci. 2022, 10, 890187. [Google Scholar] [CrossRef]
  69. Chang, Q.; Sha, Y.; Chen, Y. The coupling coordination and influencing factors of urbanization and ecological resilience in the Yangtze River Delta urban agglomeration, China. Land 2024, 13, 111. [Google Scholar] [CrossRef]
  70. Qian, H.; Zhao, C. Space-time analysis of high technology entrepreneurship: A comparison of California and New England. Appl. Geogr. 2018, 95, 111–119. [Google Scholar] [CrossRef]
  71. Cabrales, A.; Medina, C.; Lavado, A.; Cabrera, R. Managing functional diversity, risk taking and incentives for teams to achieve radical innovations. RD Manag. 2008, 38, 35–50. [Google Scholar] [CrossRef]
  72. Varadarajan, R. Fortune at the bottom of the innovation pyramid: The strategic logic of incremental innovations. Bus. Horiz. 2009, 52, 21–29. [Google Scholar] [CrossRef]
  73. Wu, J.; Harrigan, K.; Ang, S.; Wu, Z. The impact of imitation strategy and R&D resources on incremental and radical innovation: Evidence from Chinese manufacturing firms. J. Technol. Transfer. 2019, 44, 210–230. [Google Scholar] [CrossRef]
  74. Sun, Y.; Liu, J.; Ding, Y. Analysis of the relationship between open innovation, knowledge management capability and dual innovation. Technol. Anal. Strateg. 2020, 32, 15–28. [Google Scholar] [CrossRef]
  75. Bouncken, R.; Fredrich, V.; Ritala, P.; Kraus, S. Coopetition in new product development alliances: Advantages and tensions for incremental and radical innovation. Br. J. Manag. 2018, 29, 391–410. [Google Scholar] [CrossRef]
  76. Chen, X.; Xie, H.; Zhou, H. Incremental versus radical innovation and sustainable competitive advantage: A moderated mediation model. Sustainability. 2024, 16, 4545. [Google Scholar] [CrossRef]
  77. Castaldi, C. The geography of urban innovation beyond patents only: New evidence on large and secondary cities in the United States. Urban Stud. 2023, 61, 1248–1272. [Google Scholar] [CrossRef]
  78. Agrawal, A.; Cockburn, I.; Rosell, C. Not invented here? Innovation in company towns. J. Urban Econ. 2010, 67, 78–89. [Google Scholar] [CrossRef]
  79. Guo, D.; Guo, Y.; Jiang, K. Government- subsidized R&D and firm innovation: Evidence from China. Res. Policy 2016, 45, 1129–1144. [Google Scholar] [CrossRef]
  80. Abbasiharofteh, M.; Kogler, F.; Lengyel, B. Atypical combinations of technologies in regional co-inventor networks. Res. Policy 2023, 52, 104886. [Google Scholar] [CrossRef]
Figure 1. China’s three major urban agglomerations.
Land 13 01399 g001
Figure 2. Dual innovation dynamics trend of China’s three major urban agglomerations. (a) Represents the breakthrough innovation; (b) represents the incremental innovation.
Land 13 01399 g002
Figure 3. The spatial–temporal evolution of dual innovation in the Beijing–Tianjin–Hebei Urban Agglomeration from 2000 to 2021. (a) Represents the breakthrough innovation; (b) represents the incremental innovation.
Land 13 01399 g003
Figure 4. The spatial–temporal evolution of dual innovation in the Yangtze River Delta Urban Agglomeration from 2000 to 2021. (a) Represents the breakthrough innovation; (b) represents the incremental innovation.
Land 13 01399 g004
Figure 5. The spatial–temporal evolution of dual innovation in the Pearl River Delta Urban Agglomeration from 2000 to 2021. (a) Represents the breakthrough innovation; (b) represents the incremental innovation.
Land 13 01399 g005
Figure 6. The spatial relationship between breakthrough innovation and incremental innovation. (a) Shows the results for the Beijing–Tianjin–Hebei Urban Agglomeration Multi-Ring Buffer; (b) shows the results for the Pearl River Delta Urban Agglomeration Multi-Ring Buffer; and (c) shows the results for the Pearl River Delta Urban Agglomeration Multi-Ring Buffer.
Land 13 01399 g006
Figure 7. The spatial organization patterns of urban dual innovation. (a) Shows the Multi-core Cluster; (b) shows the Multi-core Corridor.
Land 13 01399 g007
Table 1. Urban dual innovation impact factor index system.
DimensionsImpact FactorsCodeEvaluation Index/Unit
Economic foundationEconomic sizeGDPGDP (in billion CNY)
Economic development levelPGDPPer capita GDP (in CNY)
Industrialization levelIndLIndustrialization rate (%)
Resident incomeResIThe average wage of employed staff (in CNY)
Innovation atmosphereInnovation elementsInnovENumber of industrial enterprises (units)
Government supportGovSPublic financial expenditure on scientific and technological activities (in ten thousand CNY)
Internationalization levelIntLActual utilization of foreign capital (in ten thousand USD)
Collaborative innovationCollabINumber of cooperative patents (units)
Built environmentInfrastructureInfra Per   capita   urban   road   area   ( m 2 )
Ecological environmentEcoEGreen coverage rate of built-up areas (%)
Cultural servicesCultSNumber of library books per 100 people (pieces)
Public servicesPubSNumber of hospital beds (units)
Table 2. The q-value results of urban dual innovation based on GDW.
Type of InnovationImpact Factors2000–20052006–20102011–20152016–2021
Breakthrough innovationGDP0.840 ***0.721 ***0.639 ***0.664 ***
PGDP0.310 ***Not Sig.0.205 ***0.287 ***
IndL0.351 ***0.881 ***0.909 ***0.519 ***
ResI0.368 ***0.918 ***0.605 ***0.685 ***
InnovE0.660 ***0.724 ***0.627 ***0.627 ***
GovSNot Sig.Not Sig.Not Sig.Not Sig.
IntL0.286 ***0.523 ***0.923 ***0.718 ***
CollabI0.989 ***0.992 ***0.979 ***0.695 ***
InfraNot Sig.Not Sig.Not Sig.Not Sig.
EcoENot Sig.0.880 ***0.427 ***Not Sig.
CultS0.892 ***0.509 ***0.415 ***Not Sig.
PubS0.806 ***0.689 ***Not Sig.0.511 ***
Incremental innovationGDP0.628 ***0.757 ***0.657 ***0.705 ***
PGDP0.341 ***Not Sig.0.180 ***0.436 ***
IndLNot Sig.0.761 ***0.945 ***Not Sig.
ResI0.422 ***0.819 ***0.641 ***0.819 ***
InnovE0.626 ***0.810 ***0.647 ***0.714 ***
GovSNot Sig.Not Sig.Not Sig.0.353 ***
IntL0.334 ***0.502 ***0.960 ***0.584 ***
CollabI0.989 ***0.993 ***0.992 ***Not Sig.
InfraNot Sig.Not Sig.Not Sig.0.307 ***
EcoENot Sig.0.772 ***0.448 ***Not Sig.
CultS0.994 ***0.598 ***0.425 ***0.463 ***
PubS0.559 ***0.696 ***Not Sig.0.402 ***
Note: *** indicate significance at the 1‰ levels.
Table 3. Panel data test results of p-values.
Panel CodeADFE-GHausman Test
P10.0801 *0.0488 **0.0176 **
P20.0552 *0.0777 *0.0004 ***
P30.0017 ***0.0663 *0.0263 **
P40.0867 *0.0424 **0.0002 ***
P50.0038 ***0.0305 **0.0024 ***
P60.0141 **0.0956 *0.0974 *
P70.0377 **0.0232 **0.0352 **
P80.0284 **0.0816 *0.0646 *
Note: *, **, and ***, respectively, indicate significance at the 1%, 5‰, and 1‰ levels.
Table 4. Individual Fixed Effects regression results.
Impact FactorsBreakthrough InnovationIncremental Innovation
RCTop 3 Positive EffectsRCTop 3 Positive Effects
GDP1.271 ***Beijing, Chizhou, Shenzhen2.817 **Qinhuangdao, Xuzhou, Jiaxing
PCGDP1.284 **Beijing, Shenzhen, Shanghai3.094 **Beijing, Shanghai, Shenzhen
IndL−4.921 ***Shenzhen, Foshan, Suzhou−7.776 **Foshan, Shenzhen, Suzhou
ResI−4.921Shenzhen, Foshan, Suzhou1.287 *Beijing, Shenzhen, Shanghai
GovS0.396 ***Beijing, Shenzhen, Guangzhou0.879 ***Shenzhen, Nanjing, Beijing
IntL0.513 **Beijing, Shenzhen, Shanghai1.317 **Taizhou, Taizhou, Xingtai
CollabI0.437 ***Beijing, Shenzhen, Shanghai0.554 ***Shanghai, Shenzhen, Nanjing
EcoE1.780 *Beijing, Shenzhen, Shanghai4.721 **Shenzhen, Shanghai, Beijing
CultS1.366 **Beijing, Baoding, Hengshui3.142 *Baoding, Xuzhou, Hengshui
PubS0.273 *Beijing, Shenzhen, Shanghai0.480 **Shenzhen, Beijing, Shanghai
Note: *, **, and ***, respectively, indicate significance at the 1%, 5‰, and 1‰ levels.
Table 5. Time Fixed Effects regression results.
Impact FactorsBreakthrough InnovationIncremental Innovation
2000–20052006–20102011–20152016–20212000–20052006–20102011–20152016–2021
GDP1.6751.8451.7301.6600.7501.2941.4721.453
PCGDP2.4563.0042.9133.5330.9451.7972.4101.980
IndL−0.007−2.581−3.9040.087−1.578−3.611−3.678−2.752
ResI4.5327.5090.1376.7481.9015.2316.4845.392
GovS1.1151.0381.0691.2790.5520.6870.9270.962
IntL0.9350.9440.8090.8590.3640.6550.7070.734
CollabI0.9910.9941.0050.2040.4660.6300.8770.711
EcoE0.8363.7744.6733.7830.3621.8684.0480.219
CultS1.7271.5431.2941.9320.8621.0671.1581.234
PubS1.8581.7470.2361.3300.9901.3610.1821.540
Note: The above regression results are significant at the 1‰ level.
Disclaimer/Publisher’s Note: The statements, opinions and data contained in all publications are solely those of the individual author(s) and contributor(s) and not of MDPI and/or the editor(s). MDPI and/or the editor(s) disclaim responsibility for any injury to people or property resulting from any ideas, methods, instructions or products referred to in the content.

