Article

Analysis of the Spatiotemporal Differentiation and Influencing Factors of Land Use Efficiency in the Beijing–Tianjin–Hebei Urban Agglomeration

School of Economics and Management, Northwest University, Xi’an 710127, China
*
Author to whom correspondence should be addressed.
Land 2024, 13(9), 1508; https://doi.org/10.3390/land13091508
Submission received: 15 August 2024 / Revised: 11 September 2024 / Accepted: 16 September 2024 / Published: 17 September 2024
(This article belongs to the Special Issue Applying Earth Observation Data for Urban Land-Use Change Mapping)

Abstract

:
Optimizing urban land use is of significant practical importance for promoting economic development, enhancing the standard of living for individuals residing in metropolitan areas, enhancing urban infrastructure and public services, driving urban transformation and upgrading, and attaining synchronized progress of the economy, society, and environment. This paper uses the super-efficiency SBM model to measure the urban land use efficiency (ULUE) of 13 cities in the Beijing–Tianjin–Hebei (BTH) urban agglomeration from 2005 to 2020 and explores the spatiotemporal evolution characteristics and influencing factors of ULUE in this urban agglomeration using analysis of spatial data and application of geographic detector methods. The results show that (1) from 2005 to 2020, the ULUE of the BTH urban agglomeration had an initial rise followed by a decline; however, the overall efficiency score is above 1, suggesting an overall effective state; (2) a distribution pattern with Beijing as its core was established, exhibiting greater ULUE in the northern region and poorer efficiency in the southern region, with significant correlation characteristics in efficiency values between adjacent cities; and (3) capital input, labor input, social welfare, and ecological environment are all influencing factors that promote the improvement in ULUE in the BTH region, and the interaction of any two factors explains the ULUE in this region better than a single factor. The empirical research results can provide useful references for improving the input–output ratio of land units and further spatial planning and policy formulation in the BTH region.

1. Introduction

With the advancement of modernization and industrialization, a large amount of farmland, forests, and other lands have been used for development and construction, exacerbating the continuous reduction of land resources and making the scarcity of land resources increasingly apparent. Especially in urban areas, the conflict between land resources and human social and economic development is more pronounced [1,2], specifically manifesting in issues such as insufficient urban land carrying capacity, soil erosion, ecological environment deterioration, and inefficient land use [3]. However, to attract capital investment and talent influx to promote economic growth, land expansion has become common in both developed and developing countries [4]. Therefore, under the constraint of scarce land resources, increasing the input–output ratio per unit of land is the key to achieving sustainable economic development [5]. By improving urban ULUE, more economic value and social benefits can be created in a limited space [6,7]. One of the main reasons China has been able to achieve the miracle of rapid economic growth is the significant increase in land resource investment [8]. As the capital of China, Beijing and its surrounding areas have historically held an important political and strategic position, with a deep cultural heritage and a long history of development, gathering a large amount of capital, technology, and talents, while also bearing the important responsibility of spreading traditional Chinese culture and modern civilization to the world. With 2.4% of the country’s land carrying 8.1% of the country’s resident population and producing about 8.5% of the country’s GDP, the Beijing–Tianjin–Hebei region is one of China’s most vibrant, most open, most innovative, and most populous regions and is an important engine for pulling China’s economy forward. In 2014, the strategy of Beijing–Tianjin–Hebei’s coordinated development had risen to the height of national strategy. The realistic needs and strategic tasks of urbanization development have placed unprecedented pressure on land use in the Beijing–Tianjin–Hebei region. Therefore, strengthening the research on land use efficiency in the Beijing–Tianjin–Hebei region is of great value in addressing the problems and challenges faced in the new era and in realizing the sustainable and coordinated development of urban economic, social, and ecological benefits.
To rationally allocate land resources and improve the efficiency of land use, many theories have been gradually formed in the academic world. The basic theory on urban land use efficiency can be traced back to the early 20th century, when the ecological location school of thought established concentric circles, fan-shaped, and multi-core models based on human ecology [9]. In the 1960s and 1970s, the economic location school of thought built a monocentric, exogenous, dynamic model based on neoclassical economics [10,11,12]. The social location school of thought has built a theory of decision analysis and interaction based on behavioral science [13]. In the 1970s and 1980s, the political location school of thought emphasized social relations of production and government intervention [14,15], arguing that social relations of production, political power, and government intervention are key factors in determining changes in the spatial structure of urban land use [16]. From the 20th century to the present, modern concepts such as compact cities and smart growth have culminated in an effort to reduce transportation demand, increase resource efficiency, and improve environmental quality [17,18].
Based on the above theories, scholars have mainly focused on land green use efficiency [19], factors affecting land green use efficiency [20], the impact of land use on ecosystem services [21,22], and measurement methods of land use efficiency [23]. At present, a unified evaluation index system for urban land use efficiency has not yet been formed, but in general, the evaluation indexes are gradually developing from single indicators to multi-dimensional indicators, and non-desired output factors such as environmental constraints are included in the examination. In terms of research methods, the comprehensive evaluation method has developed into parametric and non-parametric methods, and DEA models [24,25] have been fully applied to the measurement of land use efficiency, using kernel density estimation, Terrell’s index, exploratory spatial data analysis, and center of gravity models to analyze the spatial and temporal variations in urban land use efficiency [26,27,28,29]. The factors affecting land use efficiency were also studied through regression models such as the Tobit model, spatial panel econometric model, and geodetector model. The research scale mainly focuses on provincial units or single cities; for example, Kuang [30] measured the provincial arable land use efficiency of 31 provinces in China from 2000 to 2017, and Fu [31] analyzed and studied the urban land use efficiency of Jiangsu Province, China, from 2006 to 2017, by using the data envelopment analysis method and the information entropy method. The regional synergistic development of urban agglomerations is less involved. From the results of studies, it is clear that economic [2,32] and social factors [33,34] are the main factors affecting the efficiency of urban land use. For example, Masini studied 417 metropolitan areas in Europe and found a positive correlation between the level of economic development and land use efficiency [35]. Using a spatial panel model, Gao found that regional economic integration in metropolitan areas contributes to the optimal allocation of resources in socio-economic transformation, which improves urban land use efficiency [36]. Cao found a positive correlation between land use efficiency and factors such as the level of comprehensive economic development, fixed asset investment and environmental protection [37].
Therefore, this paper makes the following marginal contributions: Firstly, the land-averaged carbon emissions of cities are included in the rating index system of land use efficiency, and the SBM-DEA model is used to measure the land use efficiency of the Beijing–Tianjin–Hebei city cluster. This method overcomes the subjectivity in the process of determining the weights of the comprehensive evaluation indexes, makes the determination of the efficiency boundary clearer, and can better identify the less efficient parts. Considering that the correlation between the independent and dependent variables may come from spatial similarity, this paper explores the spatial and temporal evolution characteristics of land use efficiency and its influencing factors in this urban agglomeration using exploratory spatial data analysis as well as geodetectors.

2. Study Area and Datasets

2.1. Overview of the Study Region

The Beijing–Tianjin–Hebei metropolitan agglomeration is situated in the North China Plain (longitude 113°04′–119°53′ E, latitude 36°01′–42°37′ N), covering a total area of 218,000 km2. The cultivated land, forest land, grassland, and wetlands in BTH are 64,400 km2, 75,500 km2, 19,700 km2, and 1800 km2, respectively, encompassing 13 cities including Beijing, Tianjin, Baoding, Tangshan, and Shijiazhuang (as shown in Figure 1). In terms of economic development, the GDP of the BTH region in 2020 was 8639.3 billion yuan, accounting for 8.5% of the national GDP. In terms of technological research and development, the region had 37 invention patents per 10,000 permanent residents in 2020. In terms of transportation, the total length of expressways in the three provinces and cities of BTH reached 10,307 km in 2020. The coordinated division of labor and cooperation among Tianjin and Hebei ports has continued to deepen, with Tianjin Port focusing on container trunk transportation and optimizing the structure of bulk cargo transportation, Hebei ports consolidating functions for the transportation of energy and raw materials, and all nine planned airports in BTH, including Beijing Daxing International Airport, being put into operation. This region is one of the most dynamic, open, innovative, and populous areas in China. From 2005 to 2020, the area of construction land in the BTH region increased by approximately 6275.89 km2. As the coordinated cooperation of the BTH urban agglomeration deepens, problems such as environmental degradation and soil damage will become increasingly prominent. Therefore, it is imperative to measure the ULUE of the BTH urban agglomeration, which can provide more targeted reference and guidance for improving the input–output ratio per unit of land and further spatial planning and policy formulation.

2.2. Data Sources

This paper collected and preprocessed the input and output indicators such as capital, land, and labor of 13 cities in the BTH urban agglomeration from 2005 to 2020. The data are sourced from the China Statistical Yearbook, China City Statistical Yearbook, China Population and Employment Statistical Yearbook, China Urban Construction Statistical Yearbook, provincial and municipal statistical yearbooks, and the CNKI statistical database. The carbon dioxide emission data were obtained from the China Cities Greenhouse Gas Working Group (CCG).

3. Analysis Method

3.1. ULUE Evaluation Index System

Production efficiency refers to the amount of output achieved per unit of input [38]. Therefore, ULUE is the input–output ratio that includes production factors such as labor, capital, and land. This paper, referencing Liao [39], constructs an evaluation index system for ULUE in the BTH urban agglomeration based on inputs, desired outputs, and undesired outputs. While focusing on the economic and social benefits produced by land development in the BTH urban agglomeration, it also comprehensively considers the negative environmental impacts of land development and utilization. In terms of index selection, the per unit land fixed capital investment is used as the capital input index [24], the proportion of built-up land area as the land input index [39], and the number of urban employees per unit land area as the labor input index [40] (Table 1). Among them, the per unit land fixed asset investment can measure the economic development level and capital input situation of a region, reflecting the relationship between the accumulation of fixed assets and the economic development level of a region. The built-up area proportion is the ratio of the built-up area, which encompasses buildings, transportation facilities, and other urban planning elements, to the overall area of a city or region. This ratio serves as a measure of urbanization and urban land utilization. The number of urban employees per unit land area refers to the average number of urban employees within a unit area, which can measure the degree of urbanization and the employment situation of a region. For output index selection, economic benefits, social welfare, and ecological environment [41] are chosen as desired output indicators, while per unit land sewage discharge and per unit land carbon emissions are chosen as undesired output indicators. In terms of desired outputs, per unit land GDP and the average wages of on-the-job employees reflect the economic development level of a region from macro and micro perspectives, respectively, and are thus used to reflect the economic benefits of the BTH urban agglomeration. Healthcare and education are key to people’s welfare, so the number of beds in public health institutions per unit land and the number of primary and secondary schools per unit land are selected to reflect the social welfare of the BTH urban agglomeration. The green coverage rate of built-up areas and per capita green area reflect the ecological livability from macro and micro dimensions [42], respectively, and hence, they are utilized to mirror the ecological conditions of the BTH urban agglomeration. In terms of undesired outputs, sewage discharge and greenhouse gas emissions are two major factors that negatively affect the environment during production activities. Therefore, per unit land sewage discharge and per unit land carbon emissions are chosen as indicators to measure undesired outputs.

3.2. SBM-DEA Model

The Slacks-Based Measure (SBM) model, introduced by Tone, represents a sophisticated extension of the conventional Data Envelopment Analysis (DEA) approach. It addresses the inherent limitations of radial and angular measures employed in traditional DEA models by focusing on slack variables—indicators of inefficiency derived from the excess inputs required or the deficient outputs produced by a decision-making unit (DMU) to achieve optimal efficiency. This methodology offers a more nuanced and comprehensive assessment of efficiency, particularly in scenarios involving multiple inputs and outputs. Specifically, the super-efficiency SBM model extends the basic SBM framework to evaluate DMUs that already lie on the efficiency frontier, as determined by traditional DEA models. By excluding each DMU from its own reference set during evaluation, the model enables a more discriminating analysis of efficiency among these ostensibly efficient units. The following is the formula used for calculation:
ρ = 1 + 1 n i = 1 n r i x i k 1 1 r 1 + r 2 m = 1 r 1 r m g y m k g + m = 1 r 2 r m b y m k b s.t.
x k X A r y k g Y g A + r g z k g Z g A r b r 0 , r g 0 , r b 0 , A 0
Among them, ρ is the measured ULUE value; n is the number of input indicators; r 1 is the number of desired output indicators; r 2 is the number of undesired output indicators; r is the slack variable for inputs; r g is the slack variable for desired outputs; r b is the slack variable for undesired outputs; x is the input value; y g is the desired output value; z b is the undesired output value; A is the weight vector; X is the input matrix; Y g is the desired output matrix; and Z b is the undesired output matrix.

3.3. Exploratory Spatial Data Analysis

The ESDA method involves describing and visualizing the spatial distribution patterns of phenomena or objects to discover spatial clustering in the data and reveal the spatial interaction mechanisms between the subjects of study, thereby providing reference and guidance for more effectively solving some current practical problems [43]. This paper uses the Moran’s I index to explore whether there is spatial clustering or heterogeneity in the ULUE of the BTH urban agglomeration, analyzing and comparing the interaction relationships and degree of differentiation between various cities. The following is the formula used for calculation:
I = n i = 1 n j = 1 n W i j X i X ¯ X j X ¯ i = 1 n j = 1 n W i j X i X ¯
In the formula, I is the global spatial autocorrelation coefficient; n represents the number of municipal administrative units; X i and X j are the observed values of city i and city j ;   X ¯ is the average value of the observed values X i ; and W i j is the spatial weight matrix, using the Queen contiguity spatial weight matrix. When I > 0 , there is a positive spatial correlation; when I = 0 , there is no spatial autocorrelation, when I < 0 there is a negative spatial correlation.
Further, the local Moran’s I index is used to analyze the spatial clustering characteristics of local areas within the BTH urban agglomeration, reflecting the interaction relationships and degree of differentiation between various cities. The following is the formula used for calculation:
I i = X i X ¯ i = 1 , j 1 n ( X j X ¯ ) 2 / n 1 j = 1 , i 1 n W i j X j X ¯
In the formula, I i is the local spatial autocorrelation coefficient, and the other variables have the same meaning as in Formula (3). When I i > 0 , it indicates a positive spatial correlation among local areas, and the larger the value is, the more evident the spatial correlation; when I i < 0 , it indicates a negative spatial correlation among local areas, and the larger the value is, the more evident the spatial differentiation; when I i = 0 , it indicates a random spatial distribution.

3.4. Efficiency Evolution Analysis

Early DEA models were used for evaluating enterprise efficiency, comparing the efficiency of similar enterprises in the same period. Therefore, they were mainly used for cross-sectional data processing. The emergence of panel data has expanded the application scenarios of DEA models, making them suitable not only for macro data analysis but also for the construction and decomposition of productivity indices. Therefore, this paper selects the GML model to measure the ULUE of the BTH urban agglomeration, addressing the shortcomings of the super-efficiency SBM model in dynamic efficiency analysis of time series data, thereby enabling a comprehensive analysis of the dynamic evolution of ULUE in the BTH urban agglomeration from 2005 to 2020. The specific formula is as follows:
M x t , y t , x t + 1 , y t + 1 = M t * M t + 1 = D t + 1 ( x t + 1 , y t + 1 ) D t ( x t , y t ) × D t + 1 ( x t + 1 , y t + 1 ) D t ( x t , y t ) = D t + 1 ( x t + 1 , y t + 1 ) D t ( x t , y t ) × D t ( x t , y t ) D t + 1 ( x t , y t ) × D t ( x t + 1 , y t + 1 ) D t + 1 ( x t + 1 , y t + 1 )
In the formula, D t x t , y t and D t ( x t + 1 , y t + 1 ) respectively represent the distance functions of the decision-making unit between periods t and t + 1 when the base period is taken as a reference; D t + 1 x t , y t and D t + 1 ( x t + 1 , y t + 1 ) respectively represent the distance functions of the decision-making unit between periods t and t + 1 when period t + 1 is taken as the base period; and M x t , y t , x t + 1 , y t + 1 represents the change in ULUE of the decision-making unit between periods t and t + 1 . When M > 1 , it indicates an improvement in urban ULUE; otherwise, it indicates a decline. The GML index can be further decomposed into changes in catch-up efficiency and technological progress. EC reflects the efficiency changes caused by factors such as factor allocation and management under the existing technological level, while TC refers to the efficiency changes brought about by technological progress. When EC > 1, it signifies that the decision-making unit’s technical efficiency has experienced a relative improvement; otherwise, it indicates that the technology has not been fully utilized. When TC > 1, It signifies that the decision-making entity has achieved advancements in technology; otherwise, it indicates technological regression.

3.5. Geographical Detector

The geographical detector can effectively explore spatial differentiation characteristics. Therefore, this paper uses the factor detector and interaction detector in the geographical detector to investigate the relationship between ULUE (Y) and influencing factors (X) in the BTH urban agglomeration. The factor detector is capable of identifying the impact of various factors on the spatial arrangement of specific items, thereby resolving the issue of causation in the heterogeneous spatial distribution among diverse objects. The results of the factor detector are measured by the q value, which is calculated using the following formula:
q = 1 1 N σ 2 h = 1 L N h σ h 2
In the formula, h = 1,2 , , L represents the stratification of the driving factors; N h is the number of layers on h ; and N σ 2 and N σ h 2 respectively represent the total variance of the entire observation area and the sum of the intra-layer variances. The value of q ranges from [0, 1], with a larger q value indicating a greater driving effect of the factor on the improvement of ULUE, and vice versa. Additionally, this paper introduces interaction detection to explore the interactive explanatory effect of factor combinations on the dependent variable, i.e., whether the explanatory power of two factors on the dependent variable is enhanced or weakened when they interact. The results of the interaction between two factors can be divided into five categories (as shown in Table 2).

4. Results and Analysis

4.1. Spatial Temporal Analysis of Land Use Changes in BTH Urban Agglomeration

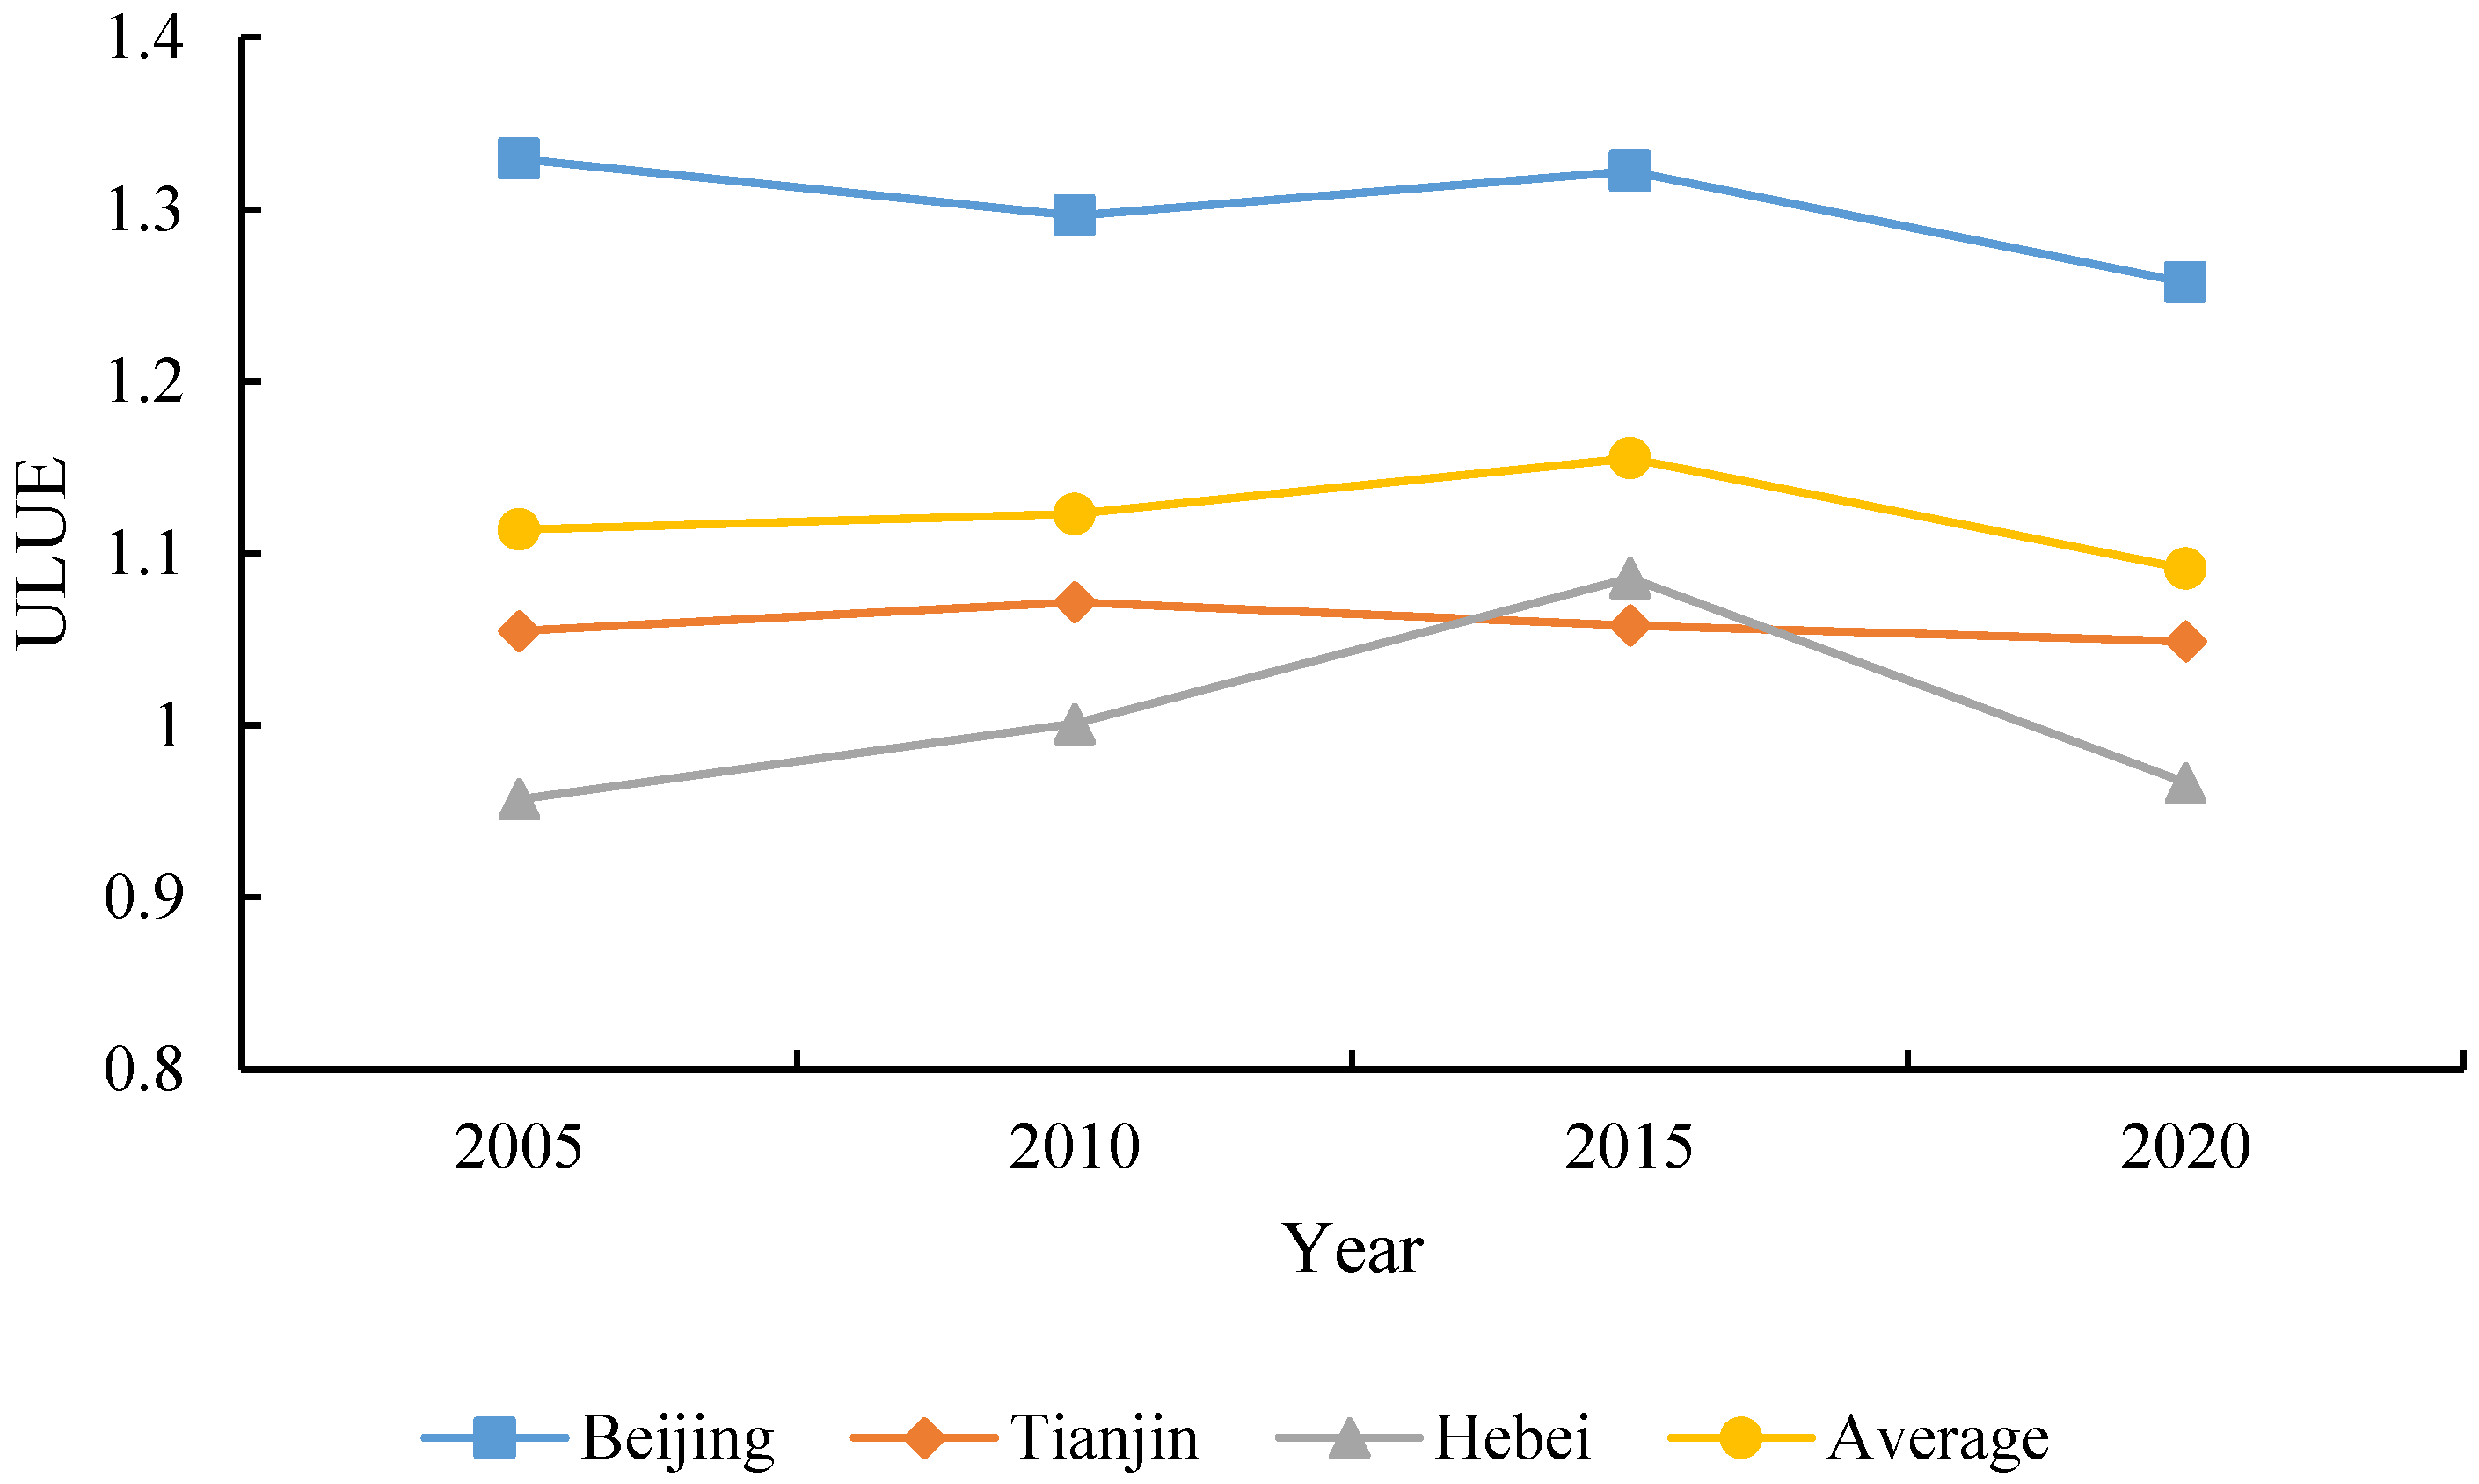
4.1.1. Temporal Evolution Characteristics

This paper utilizes the MAXDEA Ultra 8.0 software to measure the land use efficiency of the BTH urban agglomeration in 2005, 2010, 2015, and 2020 (as shown in Figure 2). Overall, the ULUE of the three regions of Beijing, Tianjin, and Hebei varies, with Beijing consistently leading and being significantly higher than the average of the BTH urban agglomeration. Specifically, Beijing’s ULUE generally shows an inverted “N” pattern, where it is first decreasing, then increasing, and decreasing again, reaching a trough of 1.30 in 2010 and a peak of 1.32 in 2015. As Beijing’s urbanization has accelerated, the expansion of urban construction land has encroached on ecological land, leading to environmental degradation, which in turn caused a decline in Beijing’s ULUE from 2005 to 2010. With the transformation of the economic development model and the introduction of various environmental regulations, Beijing has gradually moved towards green development, resulting in an increase in ULUE from 2010 to 2015. However, due to the impact of the COVID-19 pandemic, economic activities were restricted, leading to a decline in Beijing’s ULUE in 2020. The ULUE of Tianjin generally shows an inverted “U” pattern, first increasing and then decreasing, with a peak of 1.07 in 2010. From 2005 to 2010, with economic development, Tianjin’s construction land was fully utilized, and the ULUE increased accordingly. However, from 2010 to 2015, land use efficiency declined, possibly due to the devastating explosion at Tianjin Port in 2015, which claimed over a hundred lives, damaged 304 buildings, 12,428 vehicles, and 7533 containers, significantly impacting Tianjin’s social governance. In 2020, Tianjin’s land use efficiency also declined due to the COVID-19 pandemic. The ULUE of Hebei Province generally shows an inverted “U” pattern, first increasing and then decreasing, reaching a peak of 1.09 in 2015, which is consistent with the overall trend of the BTH urban agglomeration. From 2005 to 2015, Hebei’s ULUE significantly improved, surpassing Tianjin in 2015. However, it is worth noting that there was a sharp decline in the ULUE in 2020, indicating that Hebei’s development resilience is still lacking. Overall, the BTH urban agglomeration was affected by the COVID-19 pandemic in 2020, resulting in an overall decline in ULUE.

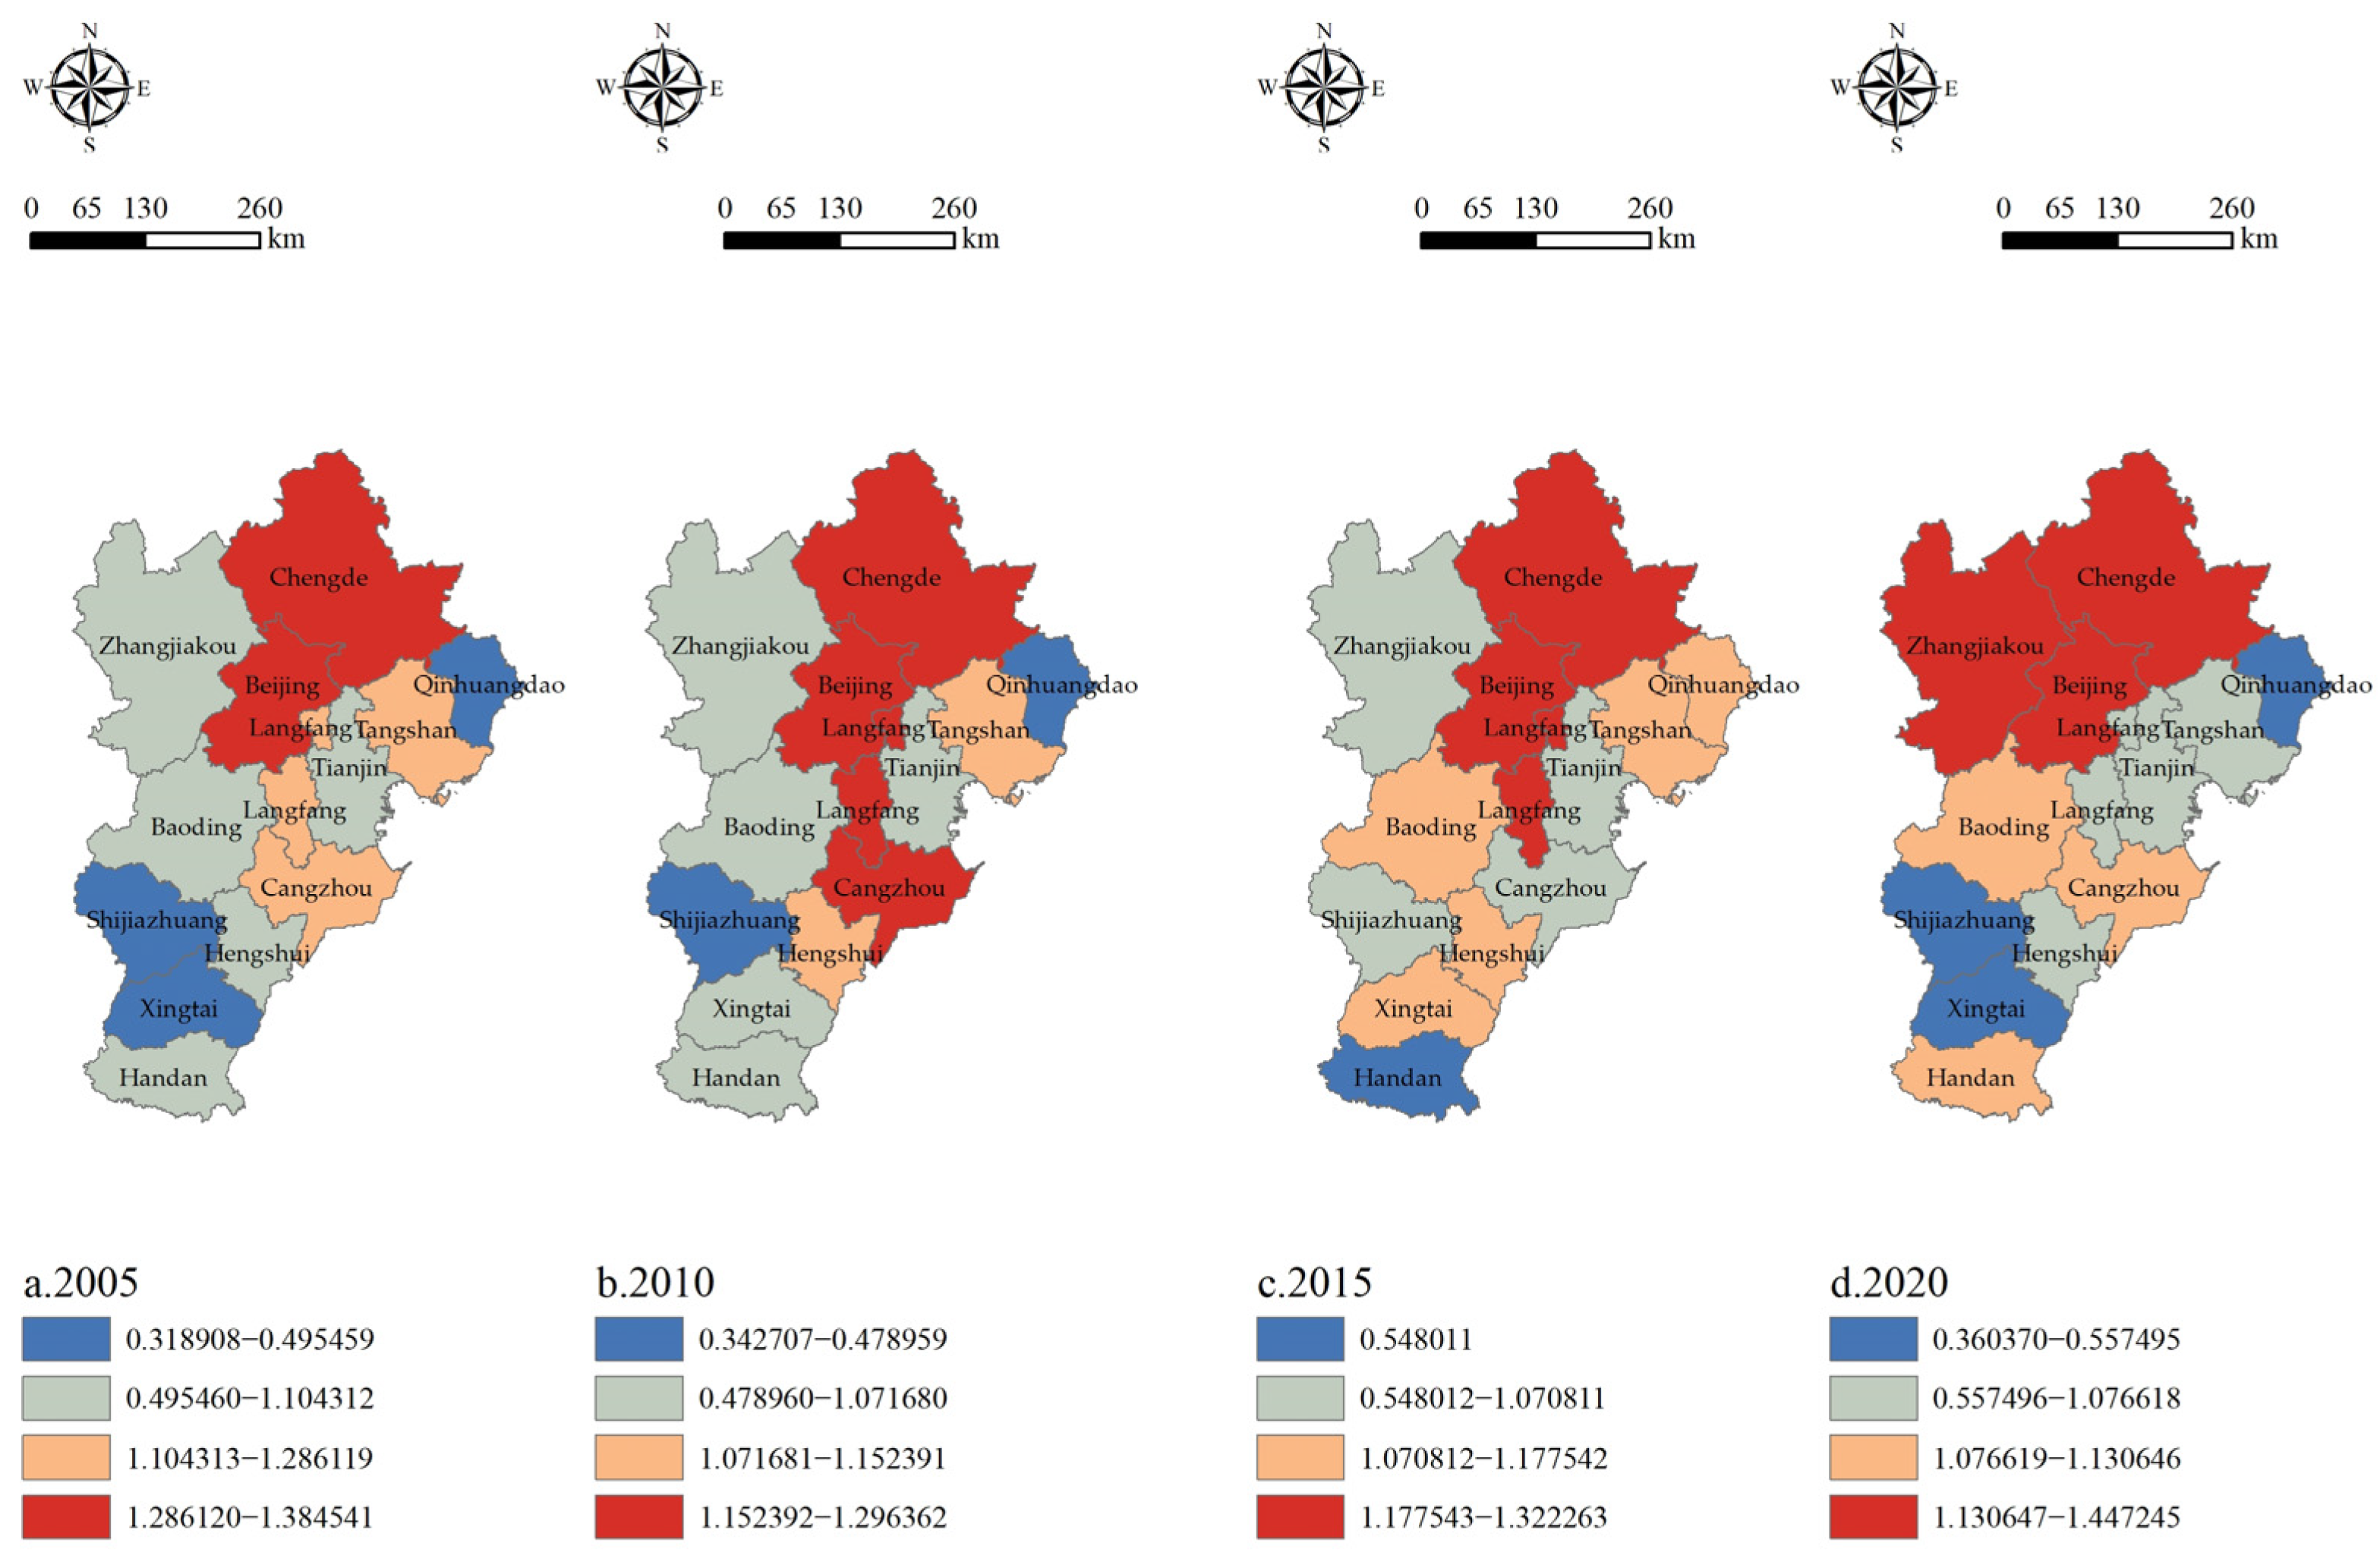
4.1.2. Spatial Evolution Characteristics

This paper uses ArcGIS10.8 and the natural breaks method to classify the ULUE of 13 cities in the BTH urban agglomeration in 2005, 2010, 2015, and 2020 into four categories: low-level areas, lower-level areas, higher-level areas, and high-level areas (as shown in Figure 3). The ULUE of the BTH urban agglomeration shows significant spatial distribution differences, presenting a spatial distribution pattern of high in the north and low in the south, forming a polarization of the development characteristic centered on Beijing. Among them, Beijing and Chengde in Hebei Province are the regions with high and relatively stable ULUE in the entire BTH urban agglomeration. Undoubtedly, as the capital of China, Beijing is far ahead of other cities in terms of development model, environmental regulations, and resource utilization efficiency. Chengde’s “advantage lies in ecology, potential lies in ecology, hope lies in ecology”. Currently, the city has a forest area of 35.56 million mu, accounting for more than one-third of the BTH region. The forest coverage rate stands at 60.03%, surpassing the national average by 36 percentage points and the province average by 25 percentage points, giving it a great advantage in green development.
From the temporal cross-section, the cities with high and higher ULUE levels in the BTH urban agglomeration in 2005 were Beijing, Chengde, Langfang, Tangshan, and Cangzhou. Due to its status as the political, cultural, and international exchange and the technological innovation center, Beijing leads in ULUE. Chengde has always adhered to the concept of green development and is a green barrier for the BTH urban agglomeration, hence its high ULUE. Cities with a certain industrial base require substantial capital, labor, and land investments in the early stages of development, and the extensive economic model leads to lower ULUE. In 2010, the cities with high and higher ULUE levels in the BTH urban agglomeration were Beijing, Chengde, Langfang, and Cangzhou, indicating that the urban scale of Cangzhou and Langfang had initially formed, no longer requiring substantial factor inputs, and effectively undertaking the industrial transfer from Beijing and Tianjin, which alleviated Beijing’s non-capital functions. In 2015, The quantity of cities exhibiting elevated and even more elevated ULUE levels inside the BTH urban agglomeration has risen, including Beijing, Chengde, Langfang, Tangshan, Qinhuangdao, Baoding, Hengshui, and Xingtai. This indicates that the BTH urban agglomeration has begun to transform into an intensive development model, significantly improving overall ULUE. The cities in the BTH urban agglomeration that had elevated levels of ULUE in 2020 were Beijing, Chengde, Zhangjiakou, Baoding, Cangzhou, and Handan. The COVID-19 pandemic had a substantial impact on Qinhuangdao, Tangshan, Cangzhou, and Xingtai, leading to a decrease in ULUE levels. It is worth noting that in 2020, Zhangjiakou and Handan showed a leap in ULUE levels. Further exploration of the reasons is provided in the following text.

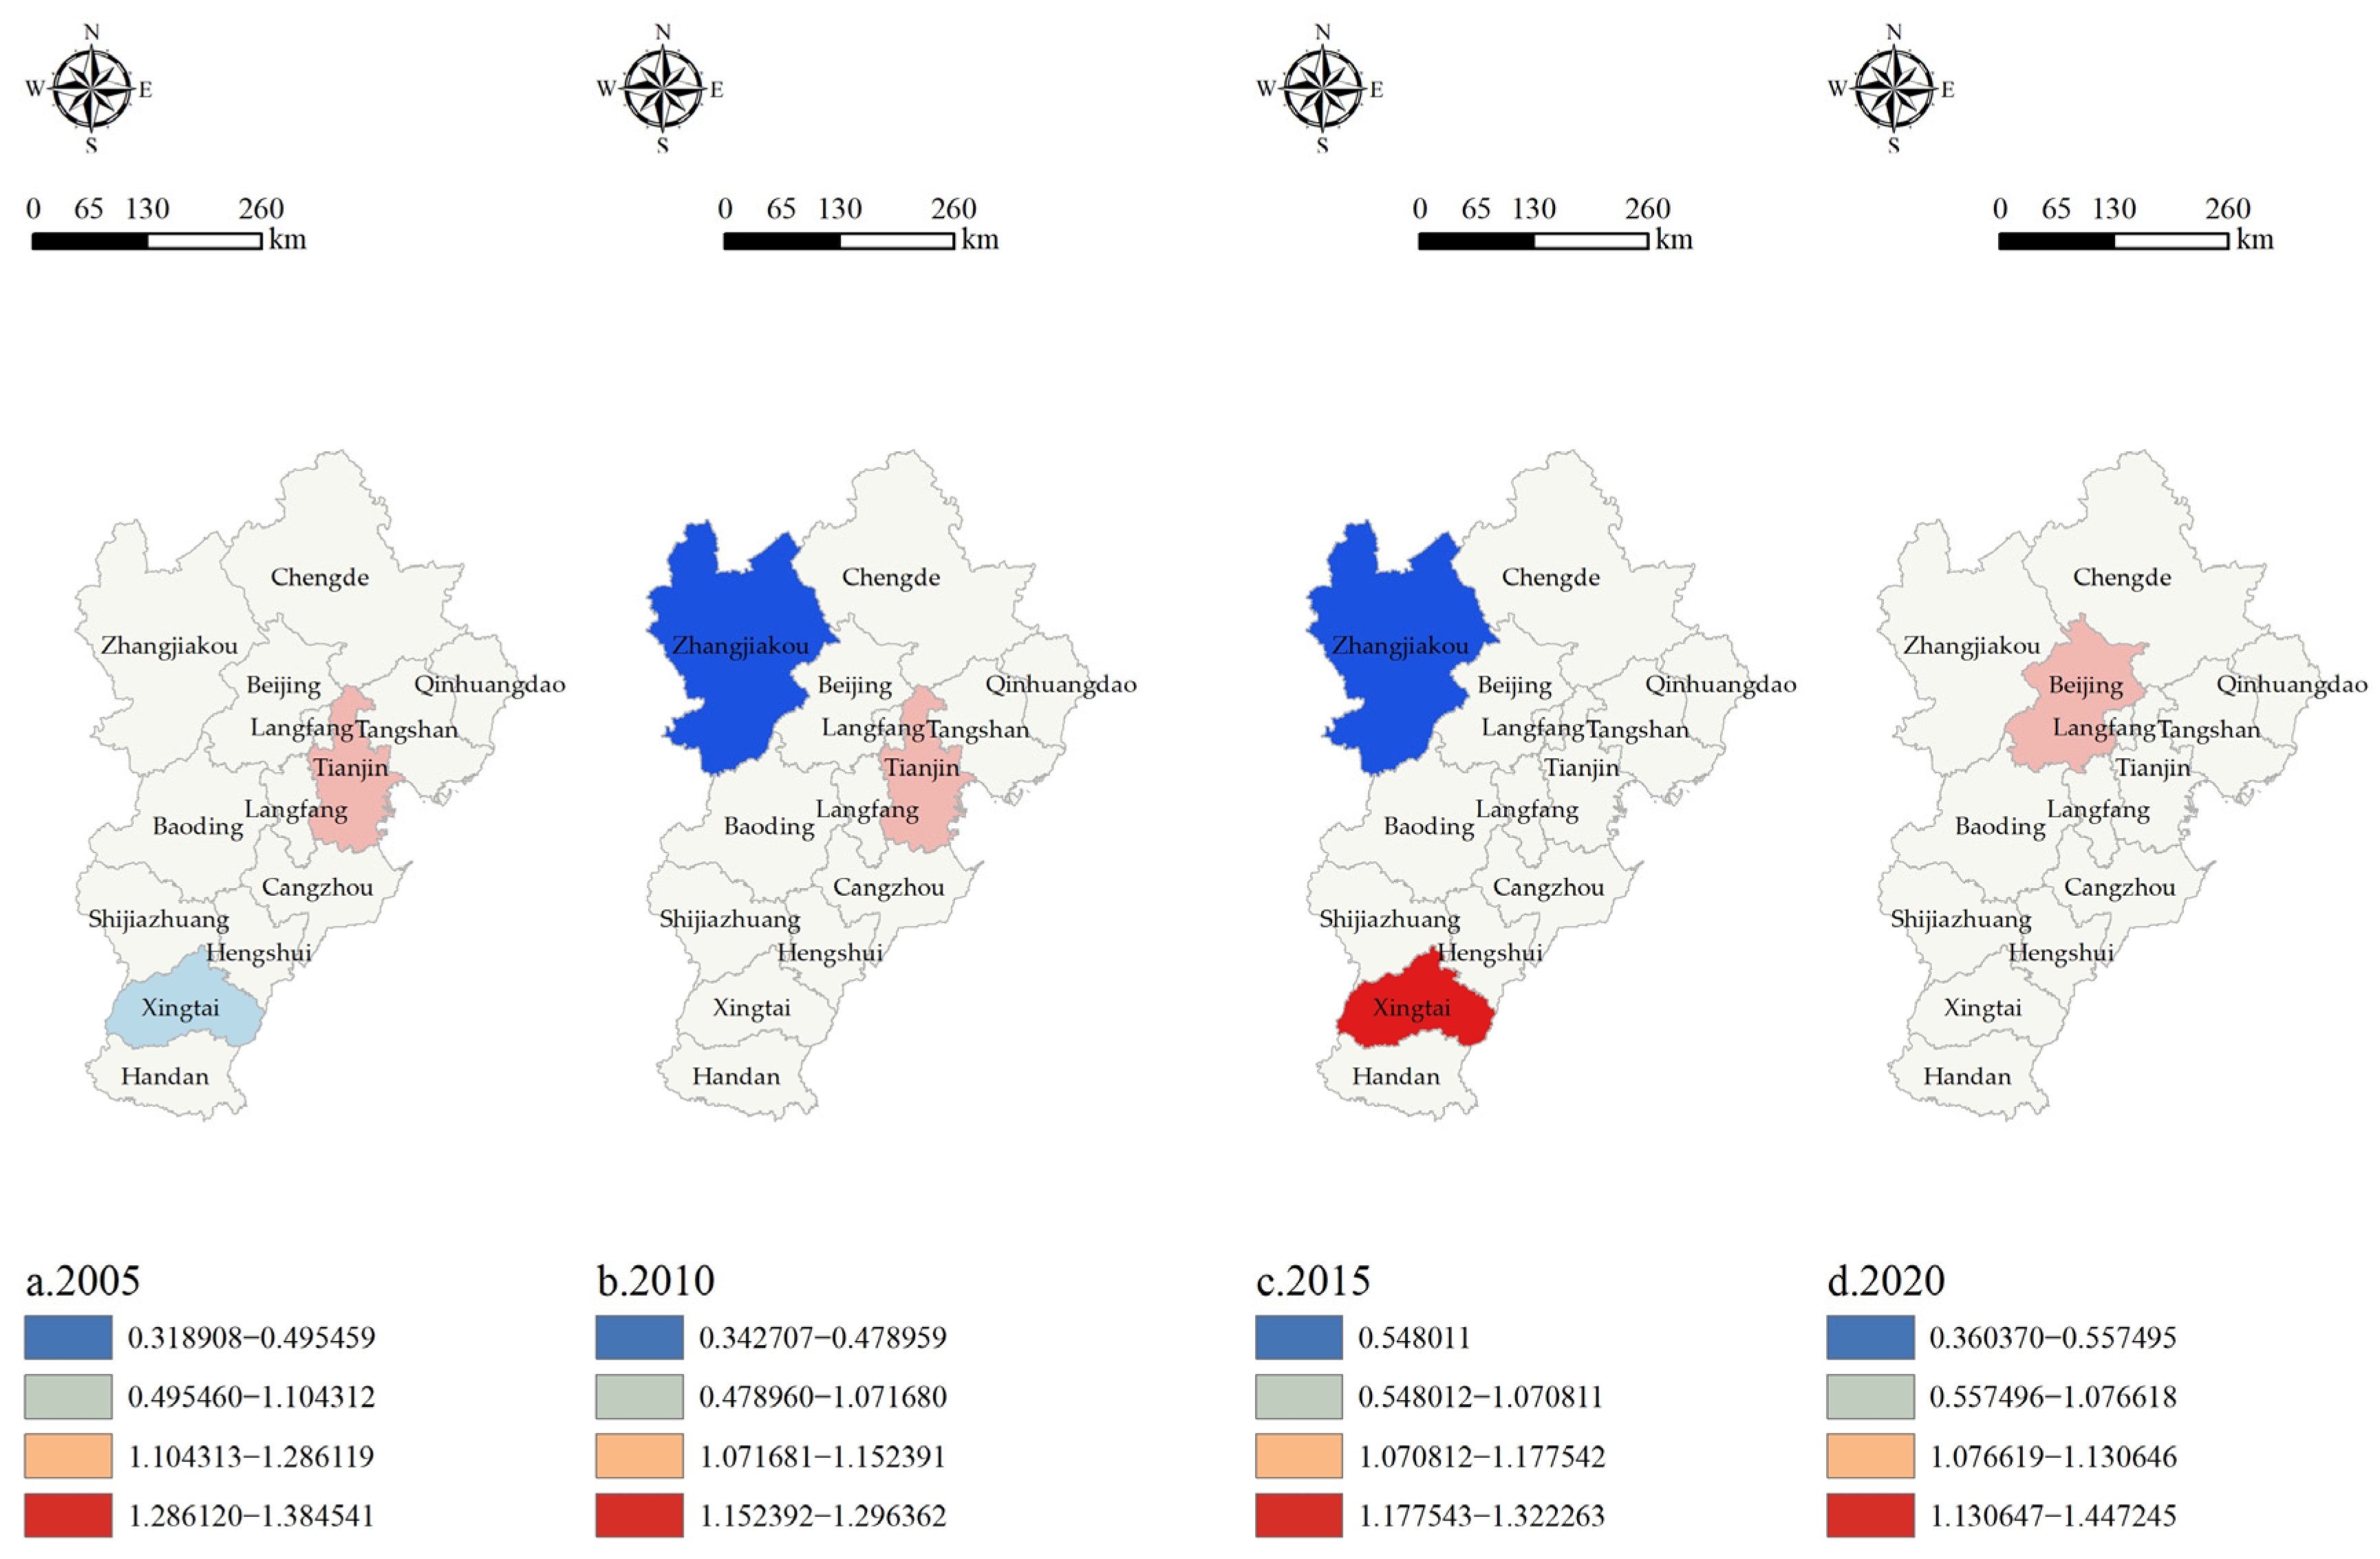
4.2. Spatial Agglomeration Characteristics of Urban ULUE

To further analyze the spatial correlation of the BTH urban agglomeration, Geoda 1.20 software was used to calculate the global Moran’s I index values for the ULUE of the BTH urban agglomeration in 2005, 2010, 2015, and 2020, which were −0.134, −0.157, 0.016, and −0.182, respectively (Table 3). Except for 2005, all passed the 10% significance level test in statistical terms. The results show that urban ULUE in 2010 and 2020 exhibited a negative spatial correlation, while in 2015, it showed a positive spatial correlation. This indicates that the spatial distribution of ULUE in the BTH urban agglomeration exhibits certain spatial homogeneity or heterogeneity characteristics, but the stability is weak. The negative Moran’s I index in 2010 indicates that the initial development level of the region was low, with significant differentiation. The development of high-level cities would create an echo effect on surrounding cities, attracting talent and capital inflow from neighboring areas, thus leading to the aggregation of high- and low-level regions. With the overall improvement in economic levels and infrastructure enhancement, the expansion diffusion effect would increase, leading to aggregation among regions of the same level. This is evidenced by the transition of the Moran’s I index from negative to positive in the BTH urban agglomeration in 2015. In 2020, the Moran’s I index once again shifted from positive to negative, indicating that the region was affected by external factors or that a particular city implemented institutional innovations, causing production factors to be attracted to high levels again, resulting in the echo effect surpassing the diffusion effect once more. While the global Moran’s I index for 2005 did not meet the criteria for statistical significance, it does not necessarily imply that the ULUE in the BTH urban agglomeration has no spatial correlation at all. Spatial correlation may be a complex phenomenon that could exist in specific areas but not in others, or positive and negative correlations may offset each other, leading to insignificance overall. Therefore, it is not possible to simply judge the presence of spatial correlation based on the outcomes of the global Moran’s I index. To more comprehensively understand the spatial relationships between different regions within the BTH urban agglomeration, it is necessary to calculate the local Moran’s I index. By using the local Moran’s I index, significant spatial correlation hotspots and cold spots can be identified, revealing the spatial distribution patterns of ULUE in local areas. This analytical method can help us deeply explore the spatial characteristics of ULUE within the BTH urban agglomeration, providing more targeted reference and guidance for further spatial planning and policy formulation.
The local spatial association characteristics of ULUE in the BTH urban agglomeration are shown in Figure 4. In 2005, Tianjin was a high-high cluster, while Xingtai was a low-low cluster. Tianjin, with its significant seaport and airport, serves as an important transportation hub in the BTH urban agglomeration, thus forming a high-level cluster. Xingtai and neighboring cities are far from the central cities, with underdeveloped urban scale and insufficient resource allocation capabilities, resulting in a low-level cluster. In 2010, Tianjin was a high-high cluster, while Zhangjiakou was a low-high cluster. Located in the northern part of the BTH urban agglomeration, Zhangjiakou is an important ecological conservation area and environmental protection barrier for the urban agglomeration. Compared to cities in the central and southern parts with an industrial base, the economic benefits of green investments in Zhangjiakou may not be immediately apparent and require more input of production factors, thus forming a low-high cluster spatially. In 2015, Xingtai was a high-low cluster, while Zhangjiakou was a low-high cluster. In 2015, Xingtai ranked first in the province for reducing the number of days with severe or worse pollution and achieved an online monitoring data transmission efficiency of 99.45% for key national pollution sources, exceeding the national target of 75% and ranking first among prefecture-level cities in the province. Specific environmental protection measures, including strengthening air pollution control, promoting energy conservation and emission reduction in industrial enterprises, enhancing water resource protection and management, and improving the rural ecological environment, led to improvements in Xingtai’s non-expected outputs and increased ULUE, thus forming a high-low cluster spatially. In 2020, Beijing exhibited a high-high cluster spatial distribution pattern, gradually forming the prototype of a world-class urban agglomeration centered on the capital, with green, smart, and livable urban development as the goal of the BTH urban agglomeration. However, overall, more than 80% of the cities did not show significant spatial clustering characteristics, indicating that there is still considerable room for improvement in the ULUE of the BTH urban agglomeration.

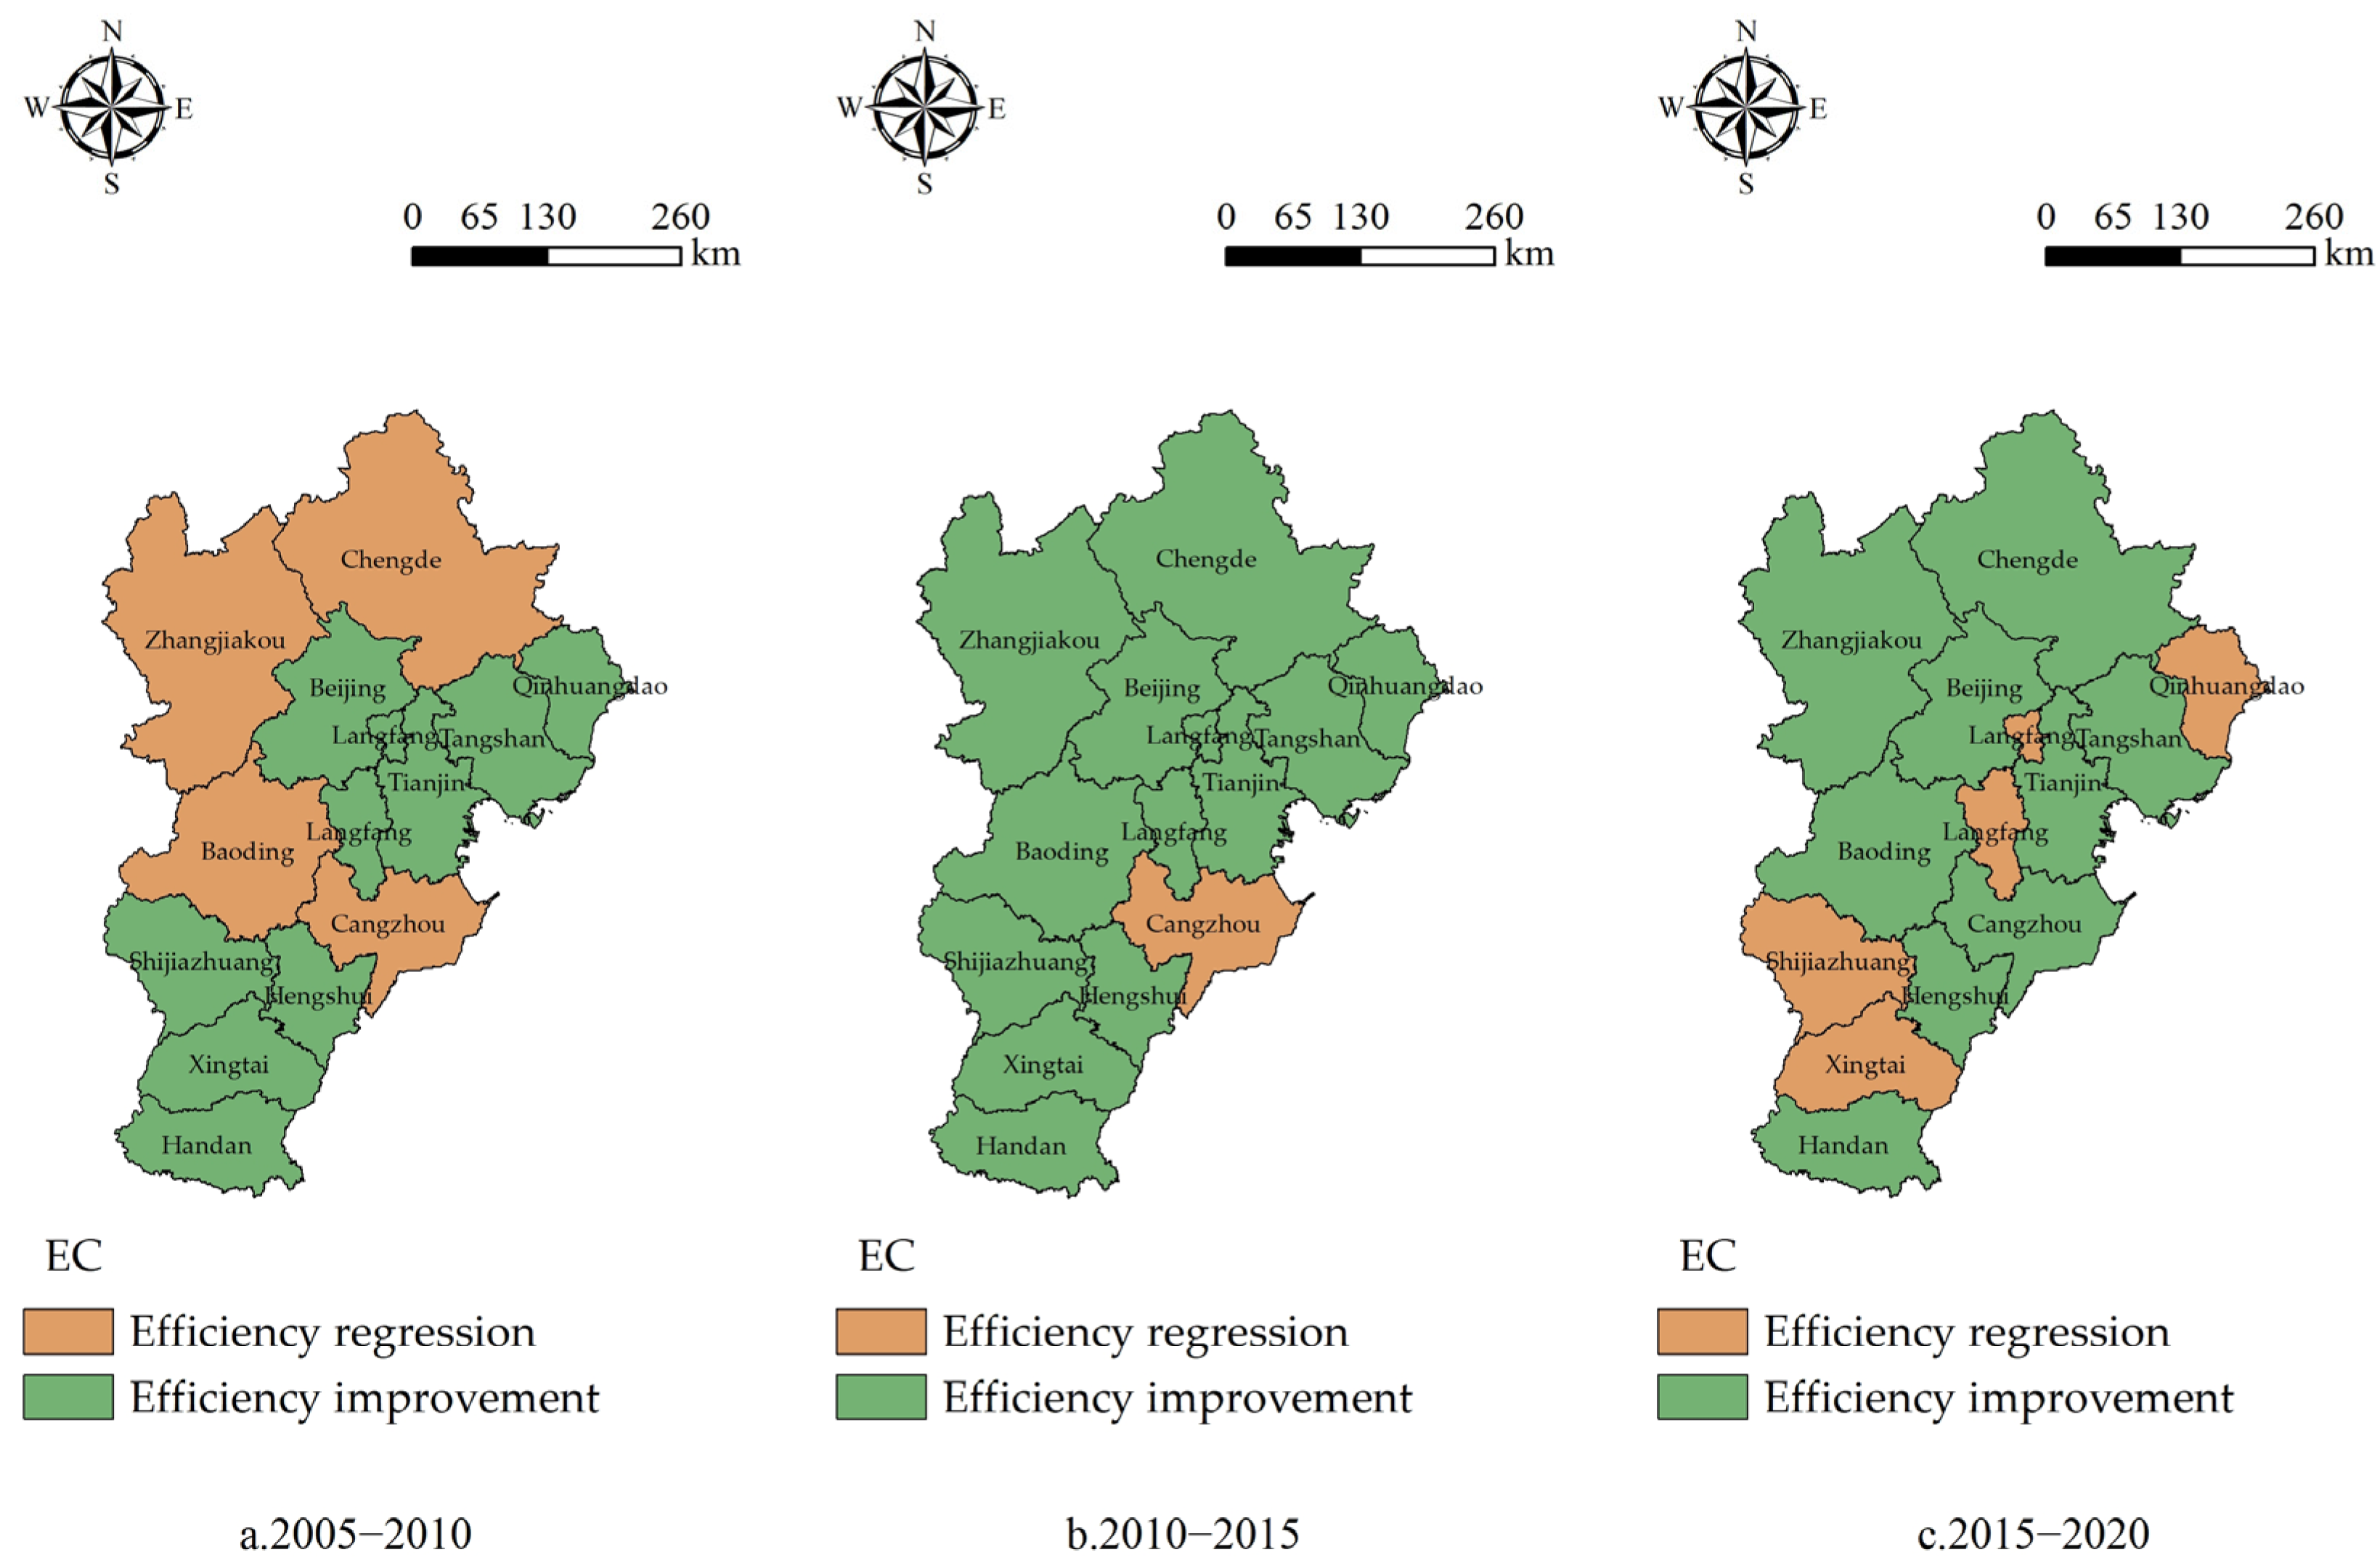
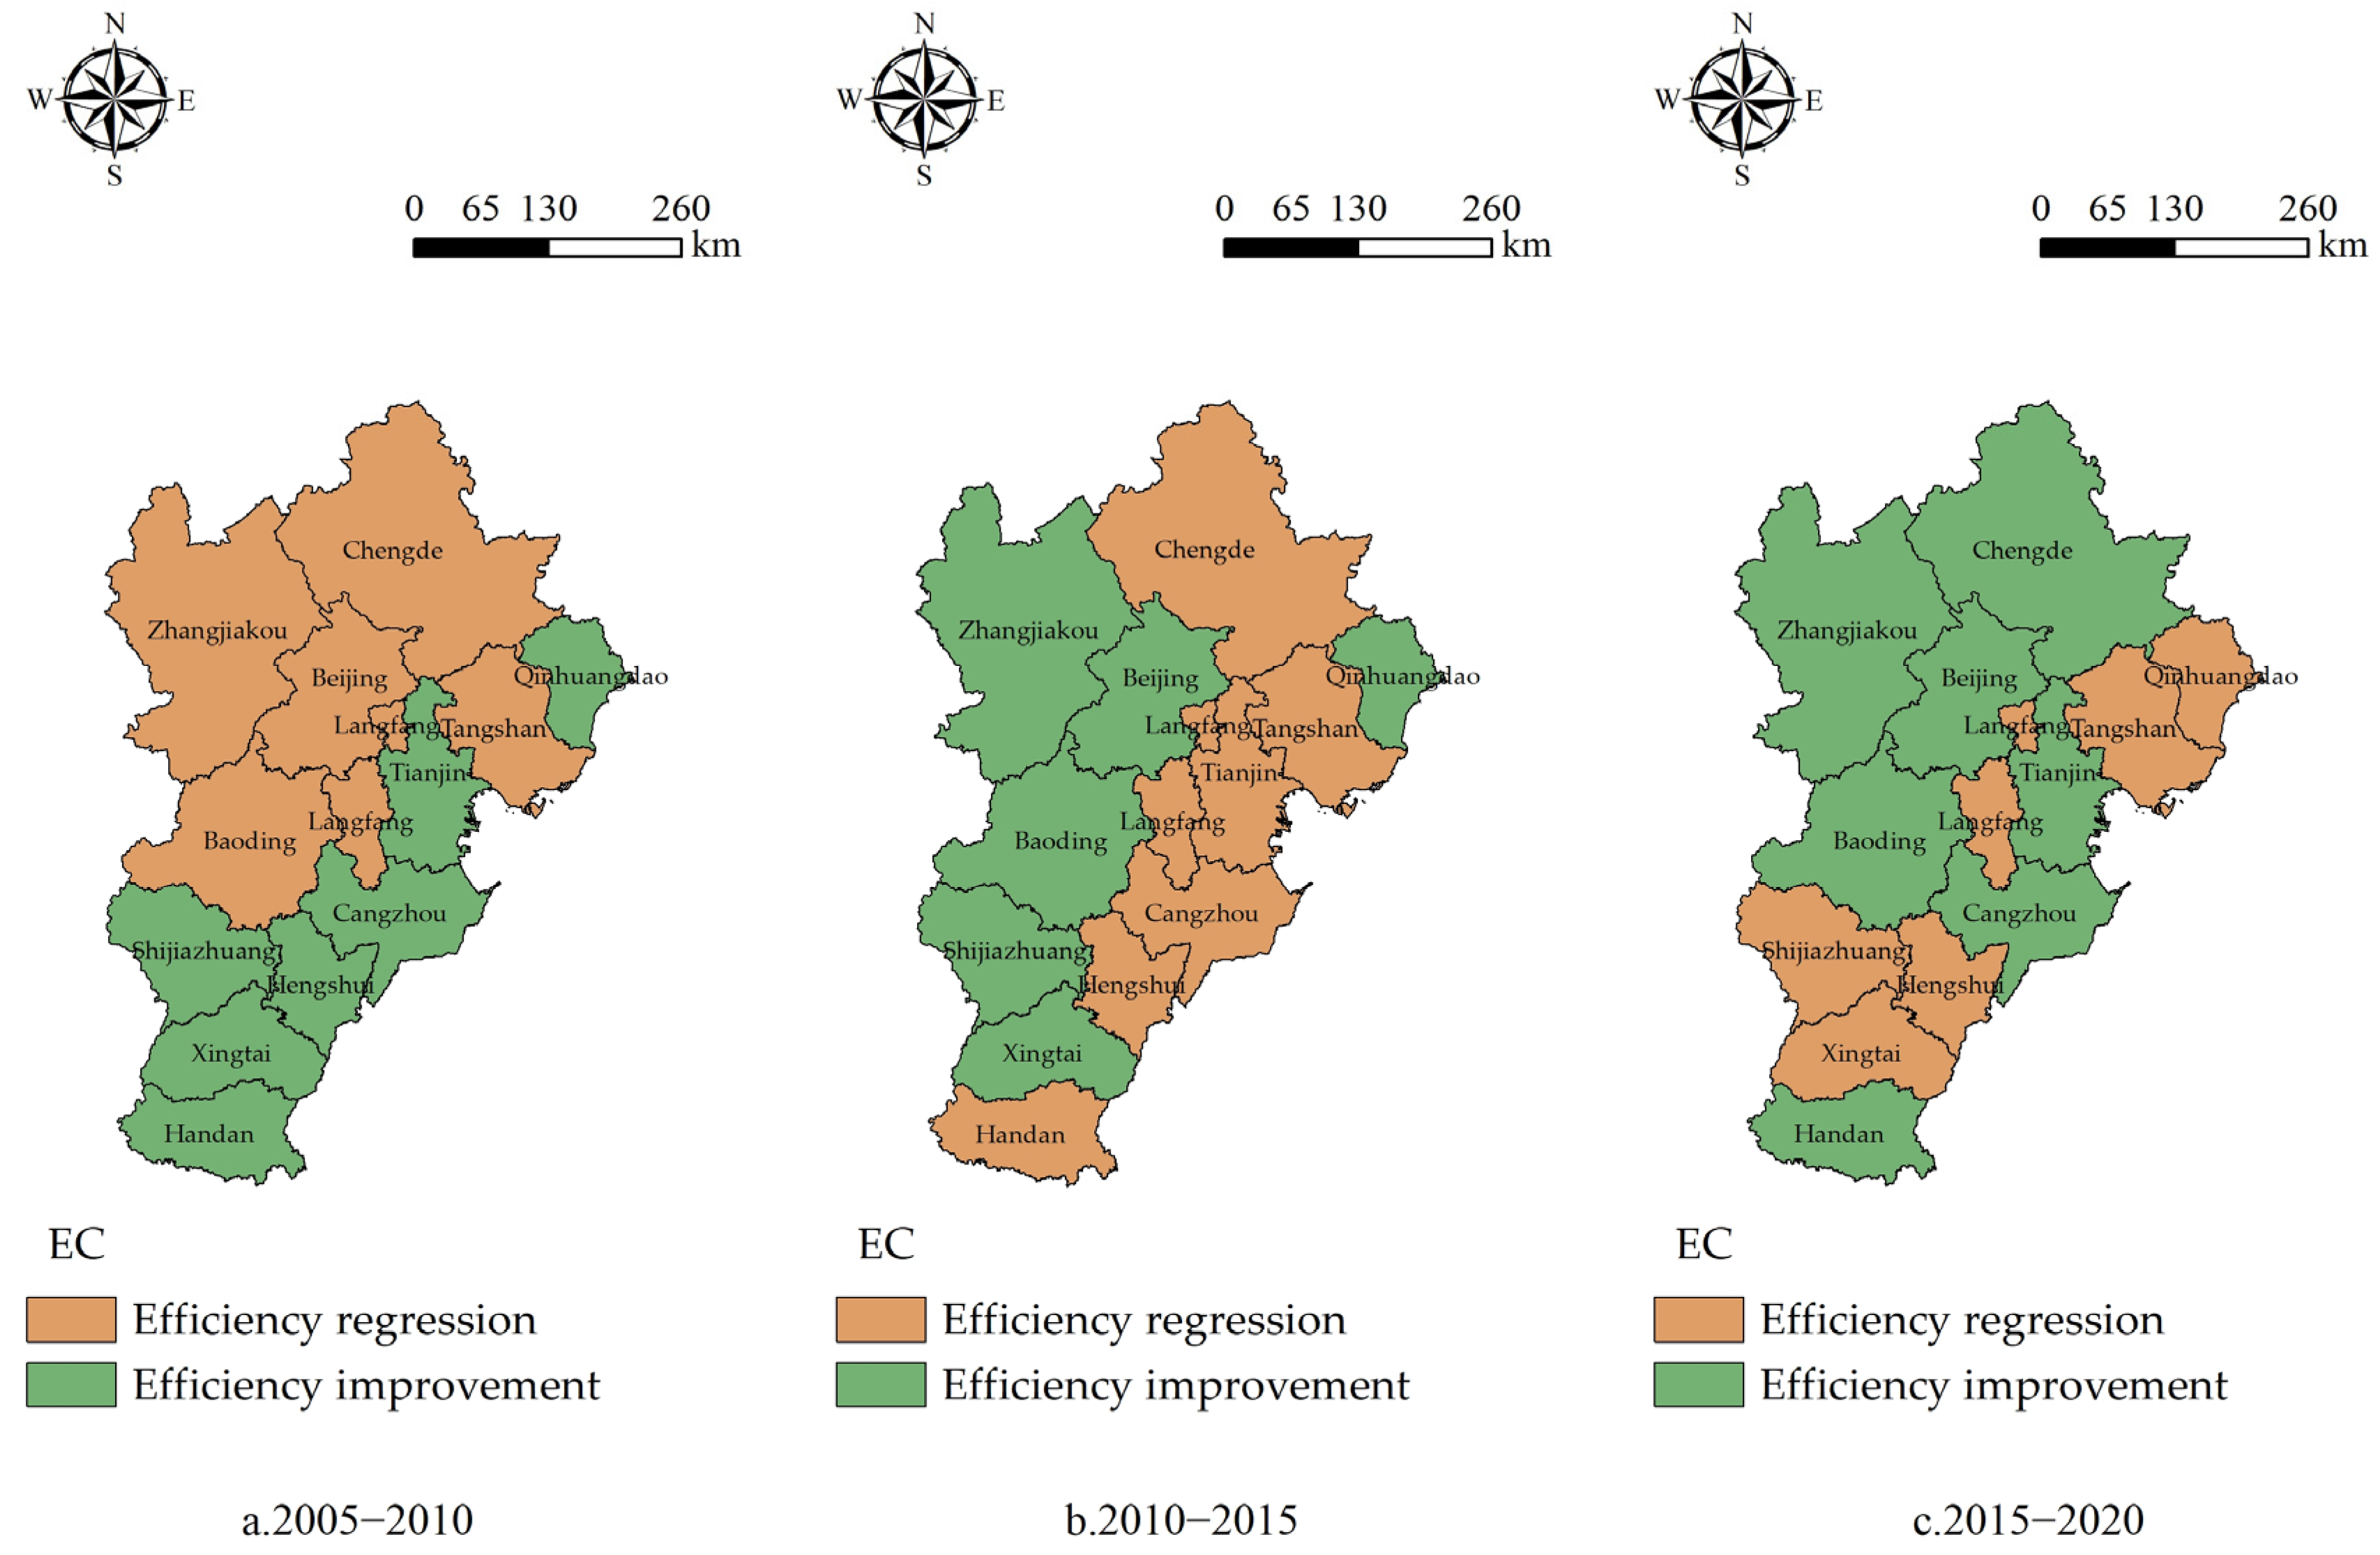
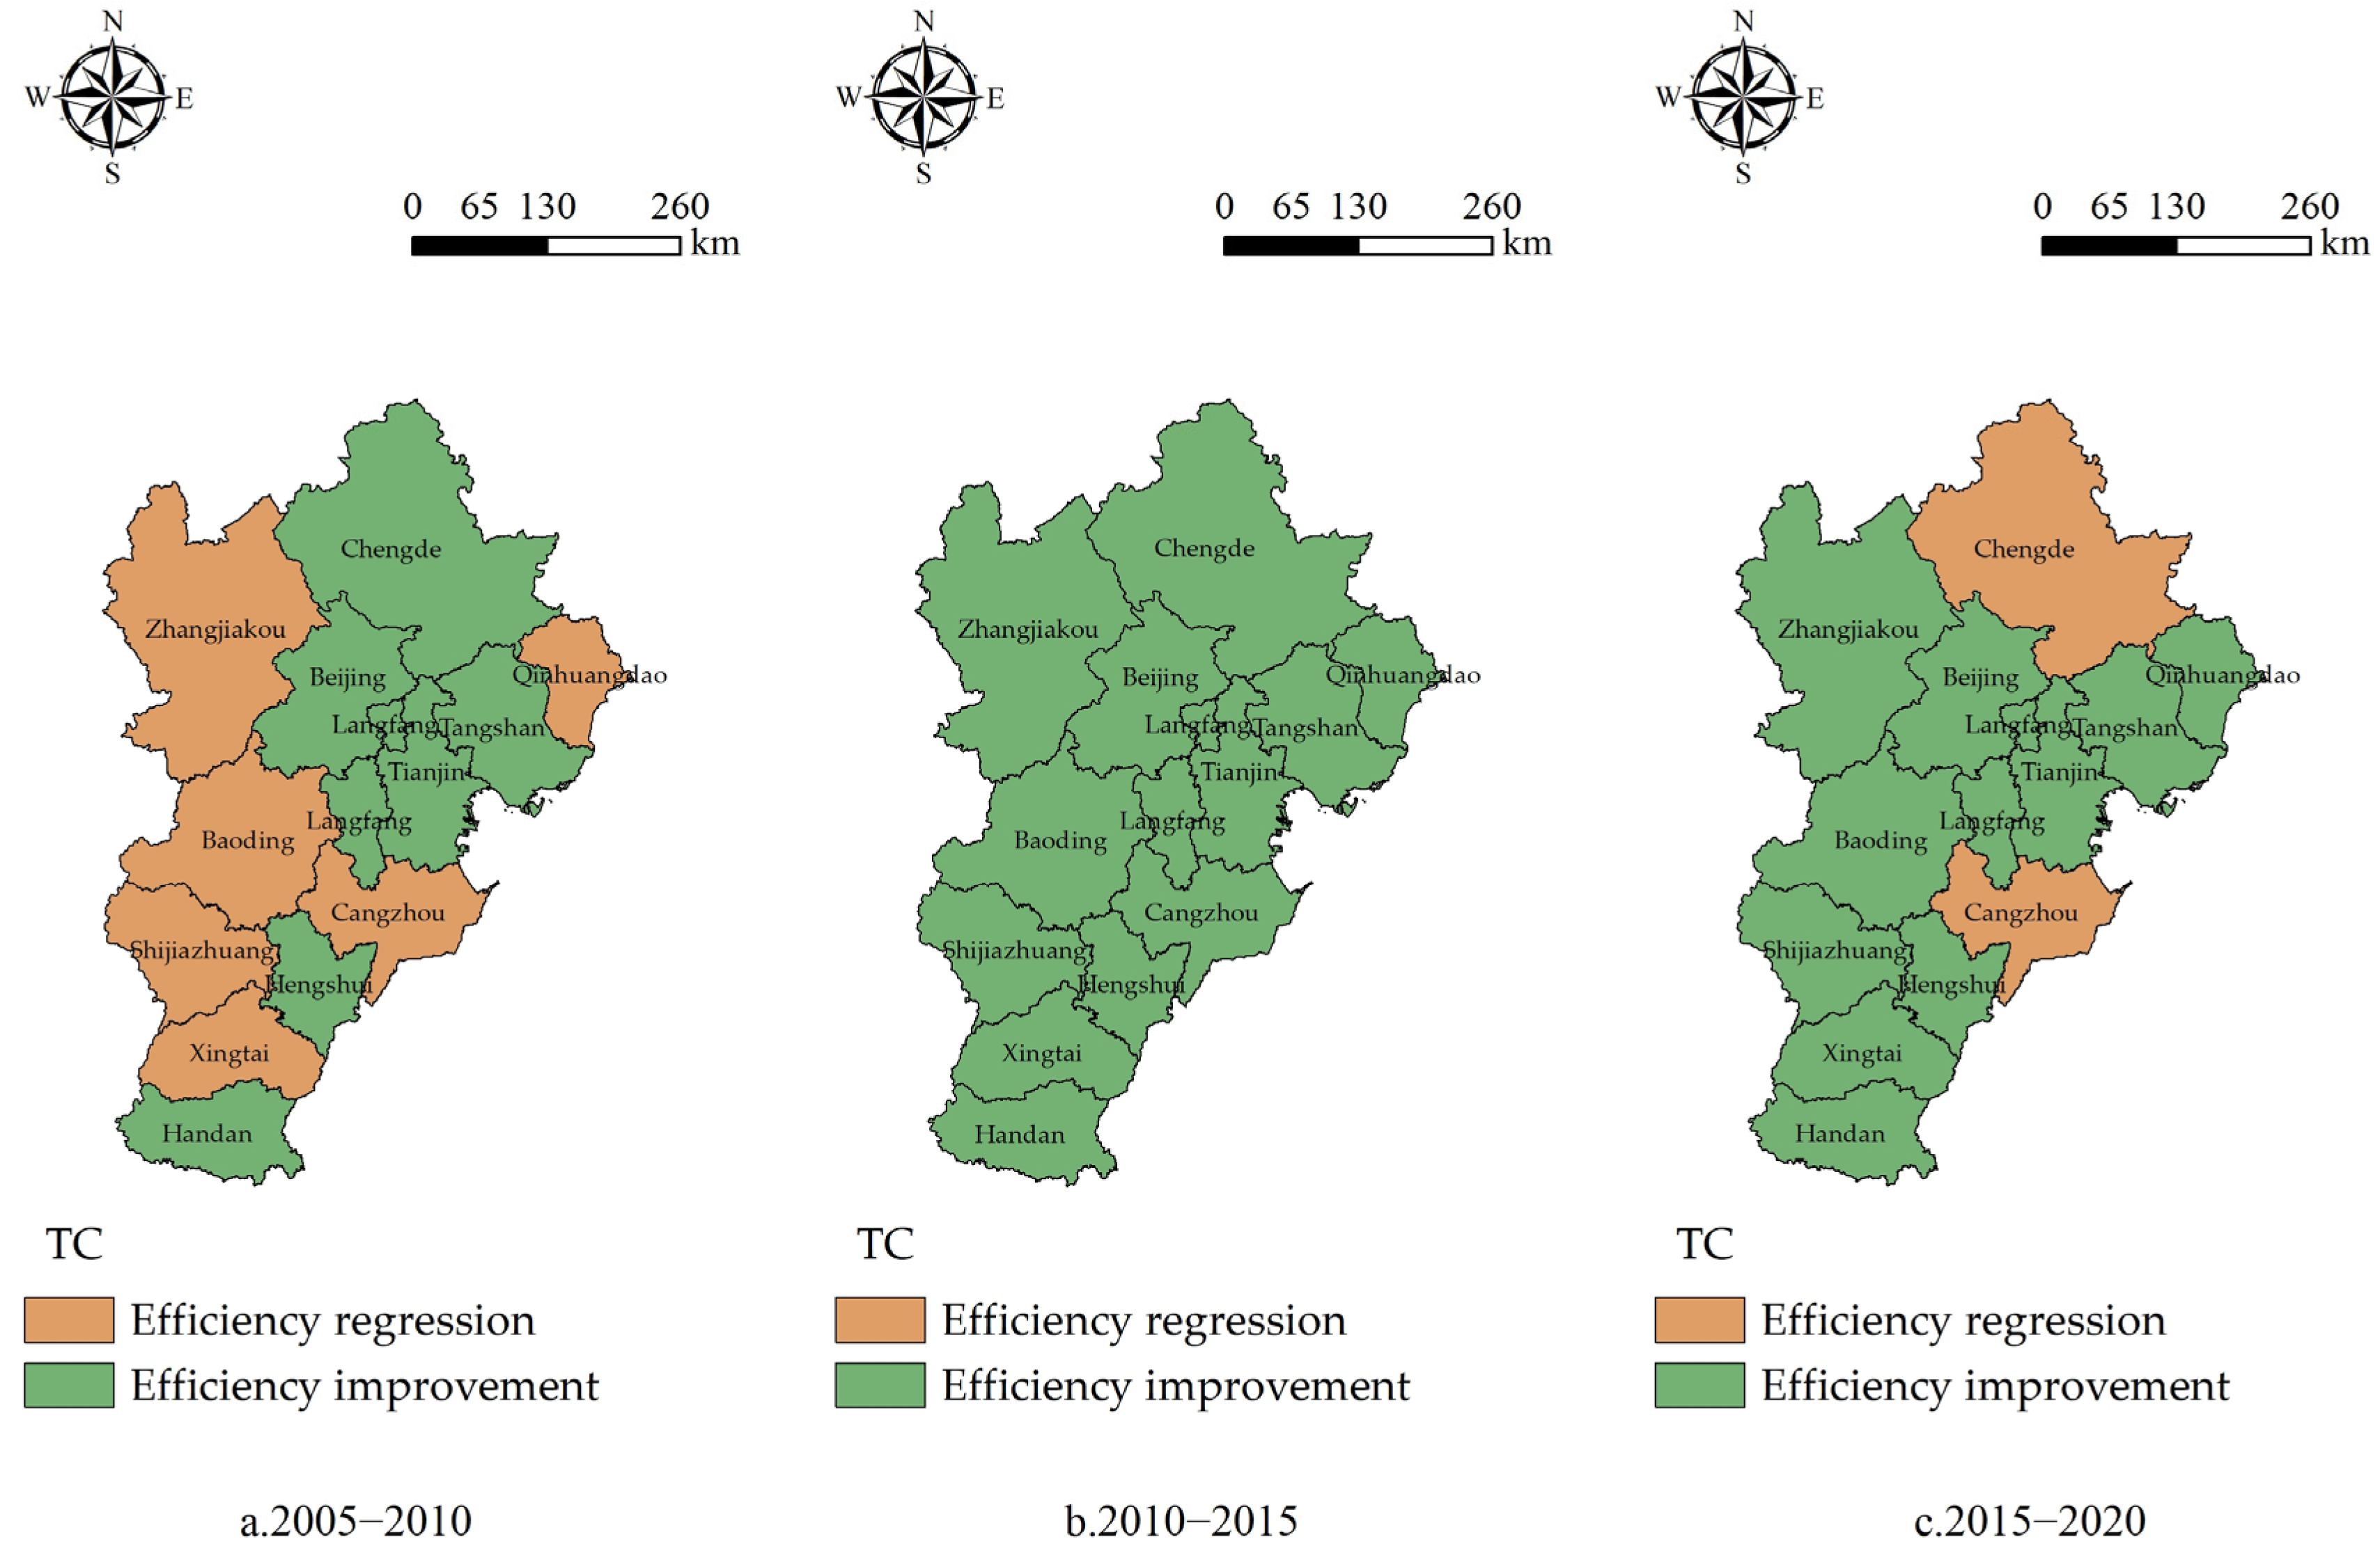
4.3. Spatial Evolution Characteristics of Urban Land Use Decomposition Efficiency

This paper uses the cumulative change values and geometric averages of the Global Malmquist–Luenberger (GML), efficiency change (EC), and technological progress (TC) indices from the Malmquist model for the years 2005–2020 to reflect the cumulative changes and annual average changes of each index (Table 4).
From 2005 to 2020, the Global Malmquist–Luenberger in the BTH region increased cumulatively by 9.55%, and ULUE improved (as shown in Figure 5). Specifically, the ULUE of seven cities increased, while six cities saw a decrease in ULUE. Among them, Handan had the largest increase at 2.01, while Xingtai had the largest decrease at −0.77. Using ArcGIS 10.8 software, the spatial evolution maps of the Global Malmquist–Luenberger, catch-up efficiency, and technological progress in the BTH region from 2005 to 2020 were drawn. From the perspective of the Global Malmquist–Luenberger, during the period 2005–2010, there were more areas with efficiency decline and fewer areas with efficiency improvement; during the period 2010–2015, the areas with efficiency decline decreased, while the areas with efficiency improvement increased; during the period 2015–2020, the areas with efficiency decline further decreased, while the areas with efficiency improvement further increased. This indicates that the overall efficiency level of the BTH urban agglomeration is showing an upward trend. Specifically, from 2005 to 2010, 9 out of the 13 cities in the BTH urban agglomeration showed efficiency improvement, while Chengde, Zhangjiakou, Baoding, and Cangzhou experienced efficiency decline. From 2010 to 2015, 12 out of the 13 cities in the BTH urban agglomeration showed efficiency improvement, with only Cangzhou showing efficiency decline. From 2015 to 2020, 9 out of the 13 cities in the BTH urban agglomeration showed efficiency improvement, while Qinhuangdao, Langfang, Shijiazhuang, and Xingtai experienced efficiency decline.
From the perspective of EC, during the period from 2005 to 2010, most regions in the BTH urban agglomeration showed a downward trend in efficiency, with only a few areas experiencing an increase, indicating an overall decline in the efficiency level of the BTH urban agglomeration (as shown in Figure 6). During the period from 2010 to 2015, the areas with declining efficiency decreased, while the areas with increasing efficiency increased, indicating that the overall efficiency level of the BTH urban agglomeration began to rise. During the period from 2015 to 2020, the areas with declining efficiency further decreased, while the areas with increasing efficiency further increased, indicating a significant upward trend in the overall efficiency level of the BTH urban agglomeration. This indicates that the ULUE of the urban agglomeration is highly dependent on scale effects, leading to issues of land resource waste. For cities with declining catch-up efficiency, it is necessary to strengthen the input of production factors and pay attention to the benefits brought by scale effects. It is worth noting that the trend of efficiency changes in the BTH urban agglomeration is not uniform. Some regions showed an upward trend in efficiency at an earlier stage, while others began to show an upward trend at a later stage. This may be related to the development strategy and industrial structure adjustment of the BTH urban agglomeration.
From the perspective of TC, from 2005 to 2010, most regions in the BTH urban agglomeration experienced a decline in efficiency, with only a few areas showing an improvement (as shown in Figure 7). From 2010 to 2015, the areas with declining efficiency decreased, while the areas with improving efficiency increased. From 2015 to 2020, the areas with declining efficiency further decreased, while the areas with improving efficiency further increased. This indicates that the overall efficiency level of the BTH urban agglomeration has shown an upward trend in recent years. Specifically, from 2005 to 2010, most cities in the BTH urban agglomeration experienced a decline in efficiency, mainly concentrated in the northern regions of Hebei Province and parts of Tianjin. This may be due to the over-reliance on traditional industries in these areas, leading to slow industrial structure adjustments and efficiency declines. From 2010 to 2015, the BTH urban agglomeration began implementing a series of industrial transformation and upgrading policies, promoting industrial structure adjustment and optimization, and strengthening regional coordinated development, which improved the overall efficiency of the urban agglomeration. By the period from 2015 to 2020, the trend of efficiency improvement in the BTH urban agglomeration became more evident, with further reductions in areas with declining efficiency and further increases in areas with improving efficiency. This indicates that the industrial structure adjustment and regional coordinated development in the BTH urban agglomeration have achieved significant results.

4.4. Geographical Detector

4.4.1. Factor Detection and Result Analysis

Using the geographical detector, ULUE is taken as the explained variable, and input indicators and expected outputs are taken as explanatory variables to study the impact of factors influencing the ULUE of the BTH region when acting alone. The results are shown in Table 5.
The per capita fixed capital investment (x1), the per capita urban employment number (x3), the per capita GDP (x4), the average wage of on-the-job employees (x5), and the per capita number of beds in public health institutions (x6) all passed the 1% significance test in statistical terms. The ranking of the influence intensity of the spatiotemporal differentiation factors of ULUE in the BTH urban agglomeration is as follows: average wage of on-the-job employees (0.9486) > per capita number of beds in public health institutions (0.8764) > per capita fixed capital investment (0.7904) > per capita urban employment number (0.7761) > per capita GDP (0.6771). Specifically, the level of average wages for on-the-job employees affects ULUE. Higher wages mean higher productivity and innovation capability, which can promote more effective land use methods. The number of beds in public health institutions per capita also impacts ULUE; sufficient health resources can improve residents’ quality of life, thereby influencing land use demand and methods. The amount of per capita fixed capital investment reflects the level of regional economic development. High levels of fixed capital investment drive industrial upgrading and technological innovation, thus affecting ULUE. The increase in urban employment numbers drives the urbanization process, impacting land use patterns and efficiency. Cities with higher per capita GDP have more funds and resource allocation capabilities, enabling more effective planning and utilization of land resources. Moreover, with the increase in per capita GDP, environmental awareness and investment in the region are enhanced. Regions that pay more attention to environmental protection and sustainable development tend to adopt more scientific and reasonable land use methods to ensure the sustainable use and protection of land.

4.4.2. Interaction Detection Results and Analysis

The results of the factor interaction detector indicate that the explanation of ULUE in the BTH region by single factors does not act independently. The interaction values of two factors are greater than the q values of single factors, indicating that the interaction of two factors enhances the explanatory power of ULUE in the BTH region, either through bivariate enhancement or nonlinear enhancement. Based on the thermal map resulting from the interactive influence of the driving factors in the geographic detector, the darker the color, the more intense the interaction effect (as shown in Figure 8). It can be observed that the interaction value between the wage level of on-the-job employees and the per capita public green space area is the highest, reaching 0.9674. This interaction result indicates that in the process of land use and development, it is essential to ensure that each unit of land brings economic benefits to every city resident while also considering the protection of the ecological environment, especially the green space resources each resident can enjoy. The interaction value between the proportion of built-up area and the per capita public green space area is the lowest, indicating that in the land development process in the BTH region, there may be development at the expense of environmental destruction. The expansion of construction land does not adequately meet the ecological needs of residents.

5. Discussion

5.1. Conclusions

This paper analyzes the spatiotemporal characteristics of ULUE in 13 cities of the BTH urban agglomeration based on the municipal scale. The GML model is used to decompose the evolution of efficiency, and the geographical detector is employed to analyze the factors driving the improvement in ULUE. The following conclusions are drawn:
First, from 2005 to 2020, the ULUE of the BTH urban agglomeration exhibited an inverted “U”-shaped evolution pattern, initially increasing and then decreasing. The overall level was relatively low, with significant regional differences, indicating substantial room for improvement. Second, the ULUE of the BTH urban agglomeration showed significant spatial distribution differences, presenting a pattern of higher efficiency in the north and lower in the south, forming a polarized development characteristic centered on Beijing. The northern cities of Chengde and Zhangjiakou, serving as green barriers for the region, had higher ULUE than the industrial cities in the central and southern parts of the BTH region. Local areas showed a high-high clustering evolution characteristic converging towards Beijing. Third, the ULUE of the BTH urban agglomeration cumulatively increased by 9.55%. The ULUE in the Beijing–Tianjin region was effectively improved through the combined effects of catch-up efficiency and technological progress. Fourth, the geographical detector indicated that the main factors driving the improvement in ULUE in the BTH region were the per unit fixed capital investment, per unit urban employment number, per unit GDP, average wage of on-the-job employees, and per unit number of beds in public health institutions, with the average wage of on-the-job employees having the greatest impact. Improving residents’ income while ensuring that green space resources are available to each resident can better enhance ULUE.

5.2. Theorical Implications

The theoretical implications of this paper mainly have two aspects. Firstly, the measurement methods of ULUE mainly use the DEA model, SFA model, and SBM model [44,45,46]. The efficiency measured by the traditional DEA model is often affected by unexpected factors. The SFA model cannot match the real production process well and can only calculate the unique output efficiency. The SBM model can consider the expected output and non-expected output in the production process, and the introduction of relaxation variables makes the measurement of land use efficiency more accurate. In this paper, considering China’s carbon peaking and carbon neutrality goals, the average carbon emission in the ground is introduced into the index of efficiency measurement, and the interaction between influencing factors is revealed through the geographical detector model, to improve the scientific evaluation results. Secondly, the development of urban agglomerations has a strong correlation in space, similar endowments in the natural environment, similar cultures in historical development, similar systems in transportation, and coordinated development strategies in policymaking. Research based on the scale of urban agglomerations is of great value to enrich, develop, and improve the evaluation of urban land use efficiency.

5.3. Practical Implications

Considering the conclusions above, the potential policy recommendations are proposed. Firstly, it can be deduced from the research conclusion that the Beijing–Tianjin–Hebei region is mainly developed centering around Beijing, and it is highly necessary to remove the non-capital functions of Beijing. The central urban area adheres to the characteristic development orientation of service economy, knowledge economy, and green economy. The suitability of natural conditions and the carrying capacity of resources and the environment should be fully considered. Attention should be paid to the orderly growth of the intensity of land development and the spatial and temporal scale. Secondly, it is essential to integrate the industrial layout and enhance the efficiency of land utilization. Considering the conclusions above, the main factors driving the improvement in ULUE in the BTH region were the per unit fixed capital investment, per unit urban employment number, per unit GDP, and so on. It is of great significance to evaluate the required land, capital, and manpower, as well as the jobs and GDP contribution that can be obtained by the determined industrial land scale to achieve sustainable development.

5.4. Limitations and Future Research

Firstly, this paper examines data from the Beijing–Tianjin–Hebei urban cluster covering the period from 2005 to 2020. Future studies may extend the analysis to additional cities, focusing on micro and meso levels including counties, cities, industrial parks, economic development zones, and various city types. The observation period could also be lengthened to identify more universally applicable patterns. Secondly, limited data availability means this paper has shortcomings in selecting evaluation indicators and influencing variables for land use efficiency. Finally, the use of geographic detectors to discuss the factors influencing land use efficiency in this paper may have resulted in omissions in the selection of explanatory variables. Therefore, further research is needed to enhance the selection of indicators and variables.

Author Contributions

Methodology, J.Y.; Writing—original draft, H.H. and J.Y.; Writing—review and editing, H.H. All authors have read and agreed to the published version of the manuscript.

Funding

This research received no external funding.

Data Availability Statement

The experimental data are mainly downloaded from the EPS data platform. The website of this data platform is: https://www.epsnet.com.cn/index.html#/Index, accessed on 13 August 2024. It is used to support the findings of this study, which are available from the corresponding author upon request.

Conflicts of Interest

The author declares that he has no conflicts of interest.

References

  1. Ramachandra, T.V.; Aithal, B.H.; Sanna, D.D. Insights to Urban Dynamics through Landscape Spatial Pattern Analysis. Int. J. Appl. Earth Obs. Geoinf. 2012, 18, 329–343. [Google Scholar] [CrossRef]
  2. Zou, L.; Liu, Y.; Wang, J.; Yang, Y.; Wang, Y. Land Use Conflict Identification and Sustainable Development Scenario Simulation on China’s Southeast Coast. J. Clean. Prod. 2019, 238, 117899. [Google Scholar] [CrossRef]
  3. Dong, G.; Liu, Z.; Niu, Y.; Jiang, W. Identification of Land Use Conflicts in Shandong Province from an Ecological Security Perspective. Land 2022, 11, 2196. [Google Scholar] [CrossRef]
  4. Chen, D.; Hu, W.; Li, Y.; Zhang, C.; Lu, X.; Cheng, H. Exploring the Temporal and Spatial Effects of City Size on Regional Economic Integration: Evidence from the Yangtze River Economic Belt in China. Land Use Policy 2023, 132, 106770. [Google Scholar] [CrossRef]
  5. Zhao, J.; Zhu, D.; Cheng, J.; Jiang, X.; Lun, F.; Zhang, Q. Does Regional Economic Integration Promote Urban Land Use Efficiency? Evidence from the Yangtze River Delta, China. Habitat Int. 2021, 116, 102404. [Google Scholar] [CrossRef]
  6. Jingxin, G.; Jinbo, S.; Lufang, W. A New Methodology to Measure the Urban Construction Land-Use Efficiency Based on the Two-Stage DEA Model. Land Use Policy 2022, 112, 105799. [Google Scholar] [CrossRef]
  7. Jiang, H. Spatial–Temporal Differences of Industrial Land Use Efficiency and Its Influencing Factors for China’s Central Region: Analyzed by SBM Model. Environ. Technol. Innov. 2021, 22, 101489. [Google Scholar] [CrossRef]
  8. Zhang, X.; Jie, X.; Ning, S.; Wang, K.; Li, X. Coupling and Coordinated Development of Urban Land Use Economic Efficiency and Green Manufacturing Systems in the Chengdu-Chongqing Economic Circle. Sustain. Cities Soc. 2022, 85, 104012. [Google Scholar] [CrossRef]
  9. Bardo, J.W.; Hartman, J.J. Urban Sociology: A Systematic Introduction; F.E. Peacock: Itasca, IL, USA, 1982. [Google Scholar]
  10. Koopmans, T.C.; Beckmann, M.J. Assignment Problems and the Location of Economic Activities. Econometrica 1957, 25, 53. [Google Scholar]
  11. Wheaton, W.C. Urban Residential Growth under Perfect Foresight. J. Urban Econ. 1982, 12, 1–21. [Google Scholar] [CrossRef]
  12. Capozza, D.R.; Helsley, R.W. The Fundamentals of Land Prices and Urban Growth. J. Urban Econ. 1989, 26, 295–306. [Google Scholar] [CrossRef]
  13. Fava, S.F.; Chapin, F.S. Urban Land Use Planning. Am. Sociol. Rev. 1957, 22, 765. [Google Scholar]
  14. Scott, A.J. The Urban Land Nexus and the State; Routledge: London, UK, 1980. [Google Scholar]
  15. Russett, B.M. Locational Approaches to Power and Conflict. Am. Political Sci. Rev. 1977, 71, 1617–1618. [Google Scholar]
  16. Williams, O.P. Urban Politics as Political Ecology; Palgrave Macmillan: London, UK, 1975. [Google Scholar]
  17. Jenks, M.; Burton, E.J.; Williams, K. The Compact City: A Sustainable Urban Form? Routledge: London, UK, 1996. [Google Scholar]
  18. Gabriel, S.A.; Faria, J.A.; Moglen, G.E. A Multiobjective Optimization Approach to Smart Growth in Land Development. Socio-Econ. Plan. Sci. 2006, 40, 212–248. [Google Scholar]
  19. Irwin, E.G. New Directions for Urban Economic Models of Land Use Change: Incorporating Spatial Heterogeneity and Transitional Dynamics. J. Reg. Sci. 2009, 50, 65–91. [Google Scholar]
  20. Verburg, P.H.; van Berkel, D.B.; van Doorn, A.M.; van Eupen, M.; van den Heiligenberg, H.A.R.M. Trajectories of Land Use Change in Europe: A Model-Based Exploration of Rural Futures. Landsc. Ecol. 2010, 25, 217–232. [Google Scholar] [CrossRef]
  21. Thornton, P.E.; Calvin, K.; Jones, A.D.; Di Vittorio, A.V.; Bond-Lamberty, B.; Chini, L.; Shi, X.; Mao, J.; Collins, W.D.; Edmonds, J.; et al. Biospheric Feedback Effects in a Synchronously Coupled Model of Human and Earth Systems. Nat. Clim. Change 2017, 7, 496–500. [Google Scholar] [CrossRef]
  22. Edwards, D.P.; Socolar, J.B.; Mills, S.C.; Burivalova, Z.; Koh, L.P.; Wilcove, D.S. Conservation of Tropical Forests in the Anthropocene. Curr. Biol. 2019, 29, R1008–R1020. [Google Scholar]
  23. Kaur, H.; Garg, P. Urban Sustainability Assessment Tools: A Review. J. Clean. Prod. 2019, 210, 146–158. [Google Scholar] [CrossRef]
  24. Zhu, X.; Zhang, P.; Wei, Y.; Li, Y.; Zhao, H. Measuring the Efficiency and Driving Factors of Urban Land Use Based on the DEA Method and the PLS-SEM Model—A Case Study of 35 Large and Medium-Sized Cities in China. Sustain. Cities Soc. 2019, 50, 101646. [Google Scholar] [CrossRef]
  25. Tone, K.; Tsutsui, M. Dynamic DEA with Network Structure: A Slacks-Based Measure Approach. Omega 2014, 42, 124–131. [Google Scholar] [CrossRef]
  26. Xie, H.; Wang, W. Exploring the Spatial-Temporal Disparities of Urban Land Use Economic Efficiency in China and Its Influencing Factors under Environmental Constraints Based on a Sequential Slacks-Based Model. Sustainability 2015, 7, 10171–10190. [Google Scholar] [CrossRef]
  27. Wu, C.; Wei, Y.D.; Huang, X.; Chen, B. Economic Transition, Spatial Development and Urban Land Use Efficiency in the Yangtze River Delta, China. Habitat Int. 2017, 63, 67–78. [Google Scholar] [CrossRef]
  28. Xie, H.; Chen, Q.; Lu, F.; Wang, W.; Yao, G.; Yu, J. Spatial-Temporal Disparities and Influencing Factors of Total-Factor Green Use Efficiency of Industrial Land in China. J. Clean. Prod. 2019, 207, 1047–1058. [Google Scholar] [CrossRef]
  29. Yuan, X.; Liu, R.; Huang, T. Analyzing Spatial–Temporal Patterns and Driving Mechanisms of Ecological Resilience Using the Driving Force–Pressure–State–Influence–Response and Environment–Economy–Society Model: A Case Study of 280 Cities in China. Systems 2024, 12, 311. [Google Scholar] [CrossRef]
  30. Kuang, B.; Lu, X.; Zhou, M.; Chen, D. Provincial Cultivated Land Use Efficiency in China: Empirical Analysis Based on the SBM-DEA Model with Carbon Emissions Considered. Technol. Forecast. Soc. Change 2020, 151, 119874. [Google Scholar] [CrossRef]
  31. Fu, Y.; Zhou, T.; Yao, Y.; Qiu, A.; Wei, F.; Liu, J.; Liu, T. Evaluating Efficiency and Order of Urban Land Use Structure: An Empirical Study of Cities in Jiangsu, China. J. Clean. Prod. 2021, 283, 124638. [Google Scholar] [CrossRef]
  32. Seto, K.C.; Fragkias, M.; Güneralp, B.; Reilly, M.K. A Meta-Analysis of Global Urban Land Expansion. PLoS ONE 2011, 6, e23777. [Google Scholar] [CrossRef]
  33. Paulsen, K. Geography, Policy or Market? New Evidence on the Measurement and Causes of Sprawl (and Infill) in US Metropolitan Regions. Urban Stud. 2014, 51, 2629–2645. [Google Scholar] [CrossRef]
  34. Xia, J.; Yan, Z.; Zhou, W.; Fong, S.K.; Leong, K.C.; Tang, I.M.; Chang, S.W.; Leong, W.K.; Jin, S. Projection of the Zhujiang (Pearl) River Delta’s Potential Submerged Area Due to Sea Level Rise during the 21st Century Based on CMIP5 Simulations. Acta Oceanol. Sin. 2015, 34, 78–84. [Google Scholar] [CrossRef]
  35. Masini, E.; Tomao, A.; Barbati, A.; Corona, P.; Serra, P.; Salvati, L. Urban Growth, Land-Use Efficiency and Local Socioeconomic Context: A Comparative Analysis of 417 Metropolitan Regions in Europe. Environ. Manag. 2019, 63, 322–337. [Google Scholar] [CrossRef]
  36. Gao, X.; Zhang, A.; Sun, Z. How Regional Economic Integration Influence on Urban Land Use Efficiency? A Case Study of Wuhan Metropolitan Area, China. Land Use Policy 2020, 90, 104329. [Google Scholar] [CrossRef]
  37. Cao, X.; Liu, Y.; Li, T.; Liao, W. Analysis of Spatial Pattern Evolution and Influencing Factors of Regional Land Use Efficiency in China Based on ESDA-GWR. Sci. Rep. 2019, 9, 520. [Google Scholar] [CrossRef]
  38. Reynès, F. The Cobb–Douglas Function as a Flexible Function: A New Perspective on Homogeneous Functions through the Lens of Output Elasticities. Math. Soc. Sci. 2019, 97, 11–17. [Google Scholar] [CrossRef]
  39. Liao, X.; Fang, C.; Shu, T.; Ren, Y. Spatiotemporal Impacts of Urban Structure upon Urban Land-Use Efficiency: Evidence from 280 Cities in China. Habitat Int. 2023, 131, 102727. [Google Scholar] [CrossRef]
  40. Yan, S.; Peng, J.; Wu, Q. Exploring the Non-Linear Effects of City Size on Urban Industrial Land Use Efficiency: A Spatial Econometric Analysis of Cities in Eastern China. Land Use Policy 2020, 99, 104944. [Google Scholar] [CrossRef]
  41. Bellassen, V.; Luyssaert, S. Carbon Sequestration: Managing Forests in Uncertain Times. Nature 2014, 506, 153–155. [Google Scholar] [CrossRef]
  42. Hong, J.; Mao, Y. How Does the Green Efficiency of Urban Land Use Evolve in the Urban Agglomeration of China’s Middle Yangtze River? Nat. Resour. Model. 2024, 37, e12392. [Google Scholar] [CrossRef]
  43. Anselin, L. Local Indicators of Spatial Association—LISA. Geographical Analysis 1995, 27, 93–115. [Google Scholar] [CrossRef]
  44. Meng, Q.; Pi, H.; Xu, T.; Li, L. Exploring the Relationship between Regional Tourism Development and Land Use Efficiency: A Case Study of Guangxi Zhuang Autonomous Region, China. PLoS ONE 2024, 19, e0297196. [Google Scholar] [CrossRef]
  45. Lin, Q.; Bai, S.; Qi, R. Cultivated Land Green Use Efficiency and Its Influencing Factors: A Case Study of 39 Cities in the Yangtze River Basin of China. Sustainability 2024, 16, 29. [Google Scholar] [CrossRef]
  46. Han, D.; Cao, Z. Evaluation and Influential Factors of Urban Land Use Efficiency in Yangtze River Economic Belt. Land 2024, 13, 671. [Google Scholar] [CrossRef]
Figure 1. Location of BTH urban agglomeration.
Land 13 01508 g001
Figure 2. ULUE values of the BTH urban agglomeration from 2005 to 2020.
Land 13 01508 g002
Figure 3. Spatial pattern of ULUE in the BTH urban agglomeration during 2005−2020.
Land 13 01508 g003
Figure 4. Local spatial association characteristics of ULUE in the BTH urban agglomeration during 2005−2020.
Land 13 01508 g004
Figure 5. Spatiotemporal evolution of GML in BTH region from 2005−2020.
Land 13 01508 g005
Figure 6. Spatiotemporal evolution of EC in BTH region from 2005−2020.
Land 13 01508 g006
Figure 7. Spatiotemporal evolution of TC in BTH region during 2005−2020.
Land 13 01508 g007
Figure 8. Heatmap of interaction effects of driving factors detected by geographical detector.
Land 13 01508 g008
Table 1. Construction of the ULUE evaluation index system for the BTH urban agglomeration.
Primary IndicatorsSecondary IndicatorsTertiary IndicatorsCalculation Method
Input IndicatorsCapitalFixed Capital Investment Per Unit Land Area (x1)Total Social Fixed Asset Investment in the Urban Area/Area of the Urban Area
LandProportion of Built-up Land Area (x2)Built-up Area of the Urban Area/Area of the Urban Area
LaborNumber of Urban Employees Per Unit Land Area (x3)Number of Urban Employees/Area of the Urban Area
Desired OutputsEconomic BenefitsGDP Per Unit Land Area (x4)GDP of the Urban Area/Area of the Urban Area
Average Wages of On-the-job Employees (x5)Total Wages of On-the-job Employees/Number of On-the-job Employees
Social WelfareNumber of Beds in Public Health Institutions Per Unit Land Area (x6)Number of Beds in Public Health Institutions in the Urban Area/Area of the Urban Area
Education Level Per Unit Land Area (x7)Number of Primary and Secondary Schools in the Urban Area/Area of the Urban Area
Ecological EnvironmentPer Capita Public Green Area (x8)Public Green Area in the Urban Area/Total Population of the Urban Area
Green Coverage Rate of Built-up Areas (x9)Total Green Area in the Urban Area/Area of the Urban Area
Undesired OutputsSewage DischargeSewage Discharge Per Unit Land Area (x10)Sewage Discharge/Area of the Urban Area
Carbon EmissionsCarbon Emissions Per Unit Land Area (x11)Total Carbon Emissions/Area of the Urban Area
Table 2. Types of interactions between two independent variables and dependent variables.
Judgement CriteriaInteraction Effect
q X 1 X 2 < min ( q X 1 , q ( X 2 ) ) Nonlinear weakening
min ( q X 1 , q ( X 2 ) ) < q X 1 X 2 < max ( q X 1 , q ( X 2 ) ) Univariate nonlinear weakening
q X 1 X 2 > max ( q X 1 , q ( X 2 ) ) Bivariate enhancement
q X 1 X 2 = q X 1 + q X 2 Independent
q X 1 X 2 > q X 1 + q X 2 Nonlinear enhancement
Table 3. Moran’ I index values.
YearGlobal Moran’ Iz-Valuep-Value
2005−0.134−1.00410.116
2010−0.157−1.65250.048
20150.0162.43790.034
2020−0.182−1.94300.012
Table 4. Malmquist exponent and its decomposition value.
AreaCumulative Change ValueGeometric Mean
GMLECTCGMLECTC
Beijing0.0232430.058350.0507471.0417541.0261421.061249
Tianjin−0.03632−0.02563−0.010721.044871.0065571.046793
Shijiazhuang−0.43522−0.600780.7978561.3272821.1546141.274292
Tangshan0.2397690.0777580.197461.1742960.9333071.254153
Qinhuangdao−0.17902−0.138141.5950691.4531721.0084621.466284
Handan2.0122820.0659090.4975051.5187471.0325571.48238
Xingtai−0.77352−0.147150.6723461.2476531.0094161.199544
Baoding0.0575110.0453780.0407461.1221561.0302641.08913
Zhangjiakou0.5763651.3466110.0942041.2130281.2872171.108462
Chengde0.0359830.199405−0.092621.0945330.9668011.104921
Cangzhou0.049150.0022580.0508150.9928720.9808431.016284
Langfang−0.30318−0.13193−0.078921.1192440.9434931.183914
Hengshui−0.02581−0.147260.1151111.1873911.0159241.172685
BTH region0.0954810.0465220.3022771.1951541.030431.189238
Table 5. Factor recognition results of geographical detector.
x1x2x3x4x5x6x7x8x9
q statistic0.79040.11650.77610.67710.94860.87640.35800.04770.1246
p value0.0000.11510.0000.0000.0000.0000.25710.52590.1360
Disclaimer/Publisher’s Note: The statements, opinions and data contained in all publications are solely those of the individual author(s) and contributor(s) and not of MDPI and/or the editor(s). MDPI and/or the editor(s) disclaim responsibility for any injury to people or property resulting from any ideas, methods, instructions or products referred to in the content.

