Article

Exploring the Balance Between Ecosystem Services and Economic Benefits via Multi-Objective Land Use Optimization

Faculty of Geography, Tianjin Normal University, Tianjin 300387, China
*
Author to whom correspondence should be addressed.
Land 2025, 14(5), 920; https://doi.org/10.3390/land14050920
Submission received: 5 March 2025 / Revised: 6 April 2025 / Accepted: 21 April 2025 / Published: 23 April 2025
(This article belongs to the Special Issue Energy-Water-Land Nexus Under Low-Carbon Globalization)

Abstract

:
Excessive human activities associated with rapid industrialization and urbanization have exerted tremendous pressure on limited land resources. Scientific land use planning is essential for attaining sustainable development. This study focuses on multi-objective land use optimization in Xinjiang, China’s largest arid region, targeting the dual goals of maximizing ecosystem services and economic benefits. The non-dominated sorting genetic algorithm II (NSGA-II) and the future land simulation (FLUS) model are integrated innovatively to explore optimal land use in terms of both quantity and spatial distribution. Four distinct development scenarios are predefined and compared: natural development, ecological preservation, economic development, and sustainable development. The main results are as follows: (1) The fragile ecosystem of Xinjiang has been under tremendous pressure during the past 40 years. The predominant pattern in land use transition was the increase in construction land (+115.66%) and cultivated land (+47.18%) at the expense of grassland (−5.48%) and forest land (−4.15%), both of which hold substantial ecological significance. (2) Among these predefined scenarios, the sustainable development scenario is considered more favorable in the future due to its ability to balance ecological preservation and economic development. All the ecologically valuable lands will have certain degrees of growth, whereas the expansion scale of construction land will be effectively controlled. (3) The lack of high-quality land and the unpredictability of water resources will be the two major obstacles to implementing this sustainable development scenario. To overcome them, the government should provide policy and financial support for restricting construction land expansion, exploiting unused land, and strengthening water conservation. This study contributes to formulating more effective land use strategies under multiple conflicting goals and ultimately achieving sustainable development of the economy and ecology in Xinjiang as well as other similar regions.

1. Introduction

A harmonious human–land relationship is essential for achieving sustainable development [1]. Since the advent of industrial civilization, however, the conflicts between excessive human activities and limited land resources have become increasingly prominent. Rapid economic growth and urbanization have resulted in substantial alterations in land use and, subsequently, various eco-environmental issues, including soil erosion, land desertification, vegetation degradation, and reduction in organic carbon reserves, etc. [2]. Land use/cover change (LUCC) research has become increasingly important recently in the context of rapid global change [3]. LUCC is a direct indicator of the effects of human activities on natural systems, thus greatly facilitating the comprehension of their complex interactions. The current research topics on LUCC include impacts on ecosystem services [4], optimizations [5], driving mechanisms [6], etc.
Land use simulation plays a pivotal role in LUCC studies, aiding in the elucidation of driving mechanisms and the prediction of evolutionary trends. Basically, there are two categories of land use simulation methods: qualitative methods and quantitative methods. The former focuses on analyzing the area changes and change rates of different land use types without taking into account their spatial distribution. Methods such as the Markov chain and SD (System Dynamics) are representative. The latter mainly focuses on simulating the spatial distribution of land use and examining the spatial differences under various natural and socio-economic factors. Commonly used methods include CA (Cellular Automata) [7], CLUE-S (Conversion of Land Use and its Effect at Small Region Extent) [8], PLUS (Patch-Generating Land Use Simulation) [9], FLUS (Future Land Use Simulation) [10], etc. These methods generally involve establishing mathematical models that utilize historical data and relevant factors to predict future land use patterns. In addition, some hybrid approaches, such as CA-Markov [11], are gaining popularity because they offer combined advantages.
Land use optimization is a process of reallocating land resources under certain objectives and constraints. Early studies mostly concentrated on maximizing or minimizing a single objective, such as land use suitability [12], land compactness [13], ecological suitability [14], etc. However, conflicting objectives may arise in practice, such as the trade-off between ecological preservation, economic development, and social well-being. Especially for the complex human–land system, deriving the optimal solution from several conflicting objectives is quite challenging. Thus, the significance of multi-objective optimization in LUCC research is on the rise [15,16]. The study conducted by Ma and Wen [17] developed a Fuzzy Multi-Objective Linear Programming (FMLP) model to optimize land use structure and achieved a trade-off between economic development and ecological preservation. The study conducted by Li et al. [18] coupled the Grey Multi-Objective Optimization (GMOP) and the PLUS model for optimizing the land use structure and, thus, improving values of ecosystem services and economic benefits. The study conducted by Song et al. [19] integrated the Particle Swarm Optimization Algorithm (PSO) and Genetic Algorithm (GA) to achieve the dual goals of maximizing economic benefits and ecosystem service values.
Ecosystem services refer to ecological products and services that humans acquire either directly or indirectly from ecosystems, namely the benefits that people derive from nature. In recent decades, ecosystem services have undergone significant losses worldwide and are expected to keep declining [20]. Human-induced land use changes have been widely recognized as the primary factor contributing to this decline [21,22]. Changes in land use type, land use intensity, and landscape all have impacts on an ecosystem’s structure and function [23]. Therefore, it is essential to incorporate the ecosystem service assessment into the land use optimization process. The monetary evaluation of an ecosystem’s benefits is known as ecosystem service value, or ESV [24]. It provides an effective tool for determining how ecosystem services will react to land use change as well as other influencing factors. Commonly applied methods for evaluating ESV include the cost-based method, the InVEST model, the benefit transfer method, the energy analysis model, etc. [25]. In particular, the equivalent factor method has become the most widely used method owing to its simplicity and feasibility [26]. It differentiates several land ecosystems and service functions, with the economic value of each determined by the product of an equivalent coefficient, the standard economic value, and the corresponding land area.
Xinjiang is the largest province and the most typical arid region in China [27]. Deserts cover over 25% of its total area, while oases, which sustain almost all human activities, only comprise less than 10%. Despite Xinjiang’s vast territory, there is still an urgent need for land use optimization. On the one hand, the ecological environment in arid regions is highly fragile and difficult to recover after damage due to its severe climate, hydrological, and topographic conditions [28]. The overall ecological vulnerability in Xinjiang has shown an upward trend since the beginning of this century, with 36.6% of the total area experiencing an increase in ecological vulnerability intensity [29]. On the other hand, the implementation of “the Belt and Road Initiative” provides Xinjiang with numerous growth opportunities in resource development and utilization, infrastructure construction, and international economic and trade cooperation [30]. The rapid socio-economic development and urbanization [31] have exerted enormous pressure on its fragile ecological environment, with land desertification and water scarcity being the primary concerns. Its land desertification area comprises 41.52% of the total land desertification area in China, while its water resources merely constitute 3% of the total water resources. Therefore, Xinjiang needs to prioritize sustainable land use planning and management to resolve the conflict between ecological conservation and economic development.
To address the above conflict, this study focuses on multi-objective land use optimization in Xinjiang, targeting the dual goals of maximizing ecosystem services and economic benefits. An integrated multi-objective optimization framework, namely NSGA-II-FLUS, is developed (Figure 1). Firstly, the structural optimization of land use is performed based on the non-dominated sorting genetic algorithm II (NSGA-II). This process includes establishing optimization functions, setting constraints, and then predicting the optimal land use structure in 2030 under four predefined development scenarios, i.e., natural development (ND, i.e., the future land use change will follow the historical trend without external intervention or regulatory measure), economic development (ED), ecological preservation (EP), and sustainable development (SD). Secondly, the spatial simulation of the optimized land use structure is conducted using the FLUS model. Finally, land use change characteristics, land use optimization results—in terms of both quantity and spatial distribution—and the impacts of land use change on ESV are obtained and analyzed, providing a foundation for future land use planning.

2. Materials and Methods

2.1. Study Area

Xinjiang (73°33′–96°42′ E, 34°25′–49°17′ N) is the largest provincial-level administrative unit in China (Figure 2), situated in the northwest. It covers an area of 1.66 × 10⁶ km2, which is approximately one-sixth of China’s total land area. Xinjiang’s topography is made up of alternating high mountains and basins, creating a distinctive feature of “three mountains surrounding two basins”. The three mountains are the Altai Mountains in the north, the Tianshan Mountains in the middle, and the Kunlun Mountains in the south. Between the three mountains are the Tarim Basin and the Junggar Basin. Due to its mountainous surroundings and distant distance from oceans, Xinjiang presents a temperate continental arid climate. This makes Xinjiang the largest arid region in China, accounting for over 60% of the total arid area. The average annual precipitation ranges from 100 to 230 mm, whereas the average annual evaporation ranges from 2000 to 3000 mm.

2.2. Data Sources

The integrated NSGA-II-FLUS model requires basic geographic data, natural environment data, and socio-economic data of Xinjiang. These data are obtained from various sources, as given in Table 1.

2.3. ESV Assessment Method: Equivalent Factor Method

ESV is a monetary assessment of an ecosystem’s benefits. The equivalent factor method is utilized herein to calculate ESV. Its basic idea is to assign an equivalent coefficient to each land use type with respect to the standard economic value. Then, it is multiplied by the corresponding land area to derive the total ESV. The standard economic is defined as the economic value of grain output per unit area of cultivated land, whereas the equivalent coefficient is derived from a meta-analysis. Given the complexity and diversity of ecosystems, there are no universally applicable standard economic values or equivalent coefficients. The author of this paper has recently conducted a comprehensive assessment of the ESV for Xinjiang [32]. The standard economic value is 54,914 USD/km2, which is derived from the annual net profit of three major grains (wheat, corn, and rice) from 1980 to 2020.
The equivalent coefficient table is displayed in Table 2, which is obtained by modifying China’s equivalent coefficients while taking into account various regional factors (NPP: net primary productivity; PRE: precipitation; SCC: soil conservation capacity; GDP: gross domestic product; EN: Engel coefficient; UR: urbanization rate). Then, the ESV is expressed as:
E S V = i = 1 m j = 1 n R i j × E C o i j × E s × A i
R i 1 , 2 , 4 , 5 , 9 , 10 = N P P / N P P ¯
R i 3 , 7 = P R E / P R E ¯
R i 9 = S C C / S C C ¯
R i 11 = T × W = G D P G D P ¯ × 1 / ( 1 + e 3 1 E N ) 1 / ( 1 + e 3 1 E N ¯ ) × U R U R ¯
where Rij denotes the correction factor; ECoij denotes China’s equivalent coefficient for the land use type i and the ES type j, respectively; Es denotes the standard economic value; Ai is the area of the land use type i; m and n are the total numbers of land use types and ecosystem service types, respectively. In this study, m equals 6, which includes cultivated land, forest land, grassland, water bodies, construction land, and unused land. In particular, unused land is predominantly comprised of the desert, Gobi, saline–alkali land, swampy land, and bare land. n equals 11, which includes food production, raw material production, and water supply that belong to the provision services; gas regulation, climate regulation, water treatment, and hydrological regulation that belong to the regulation services; soil conservation, nutrient cycle maintenance, and biodiversity maintenance that belong to support services; and aesthetic landscape that belongs to the cultural services.

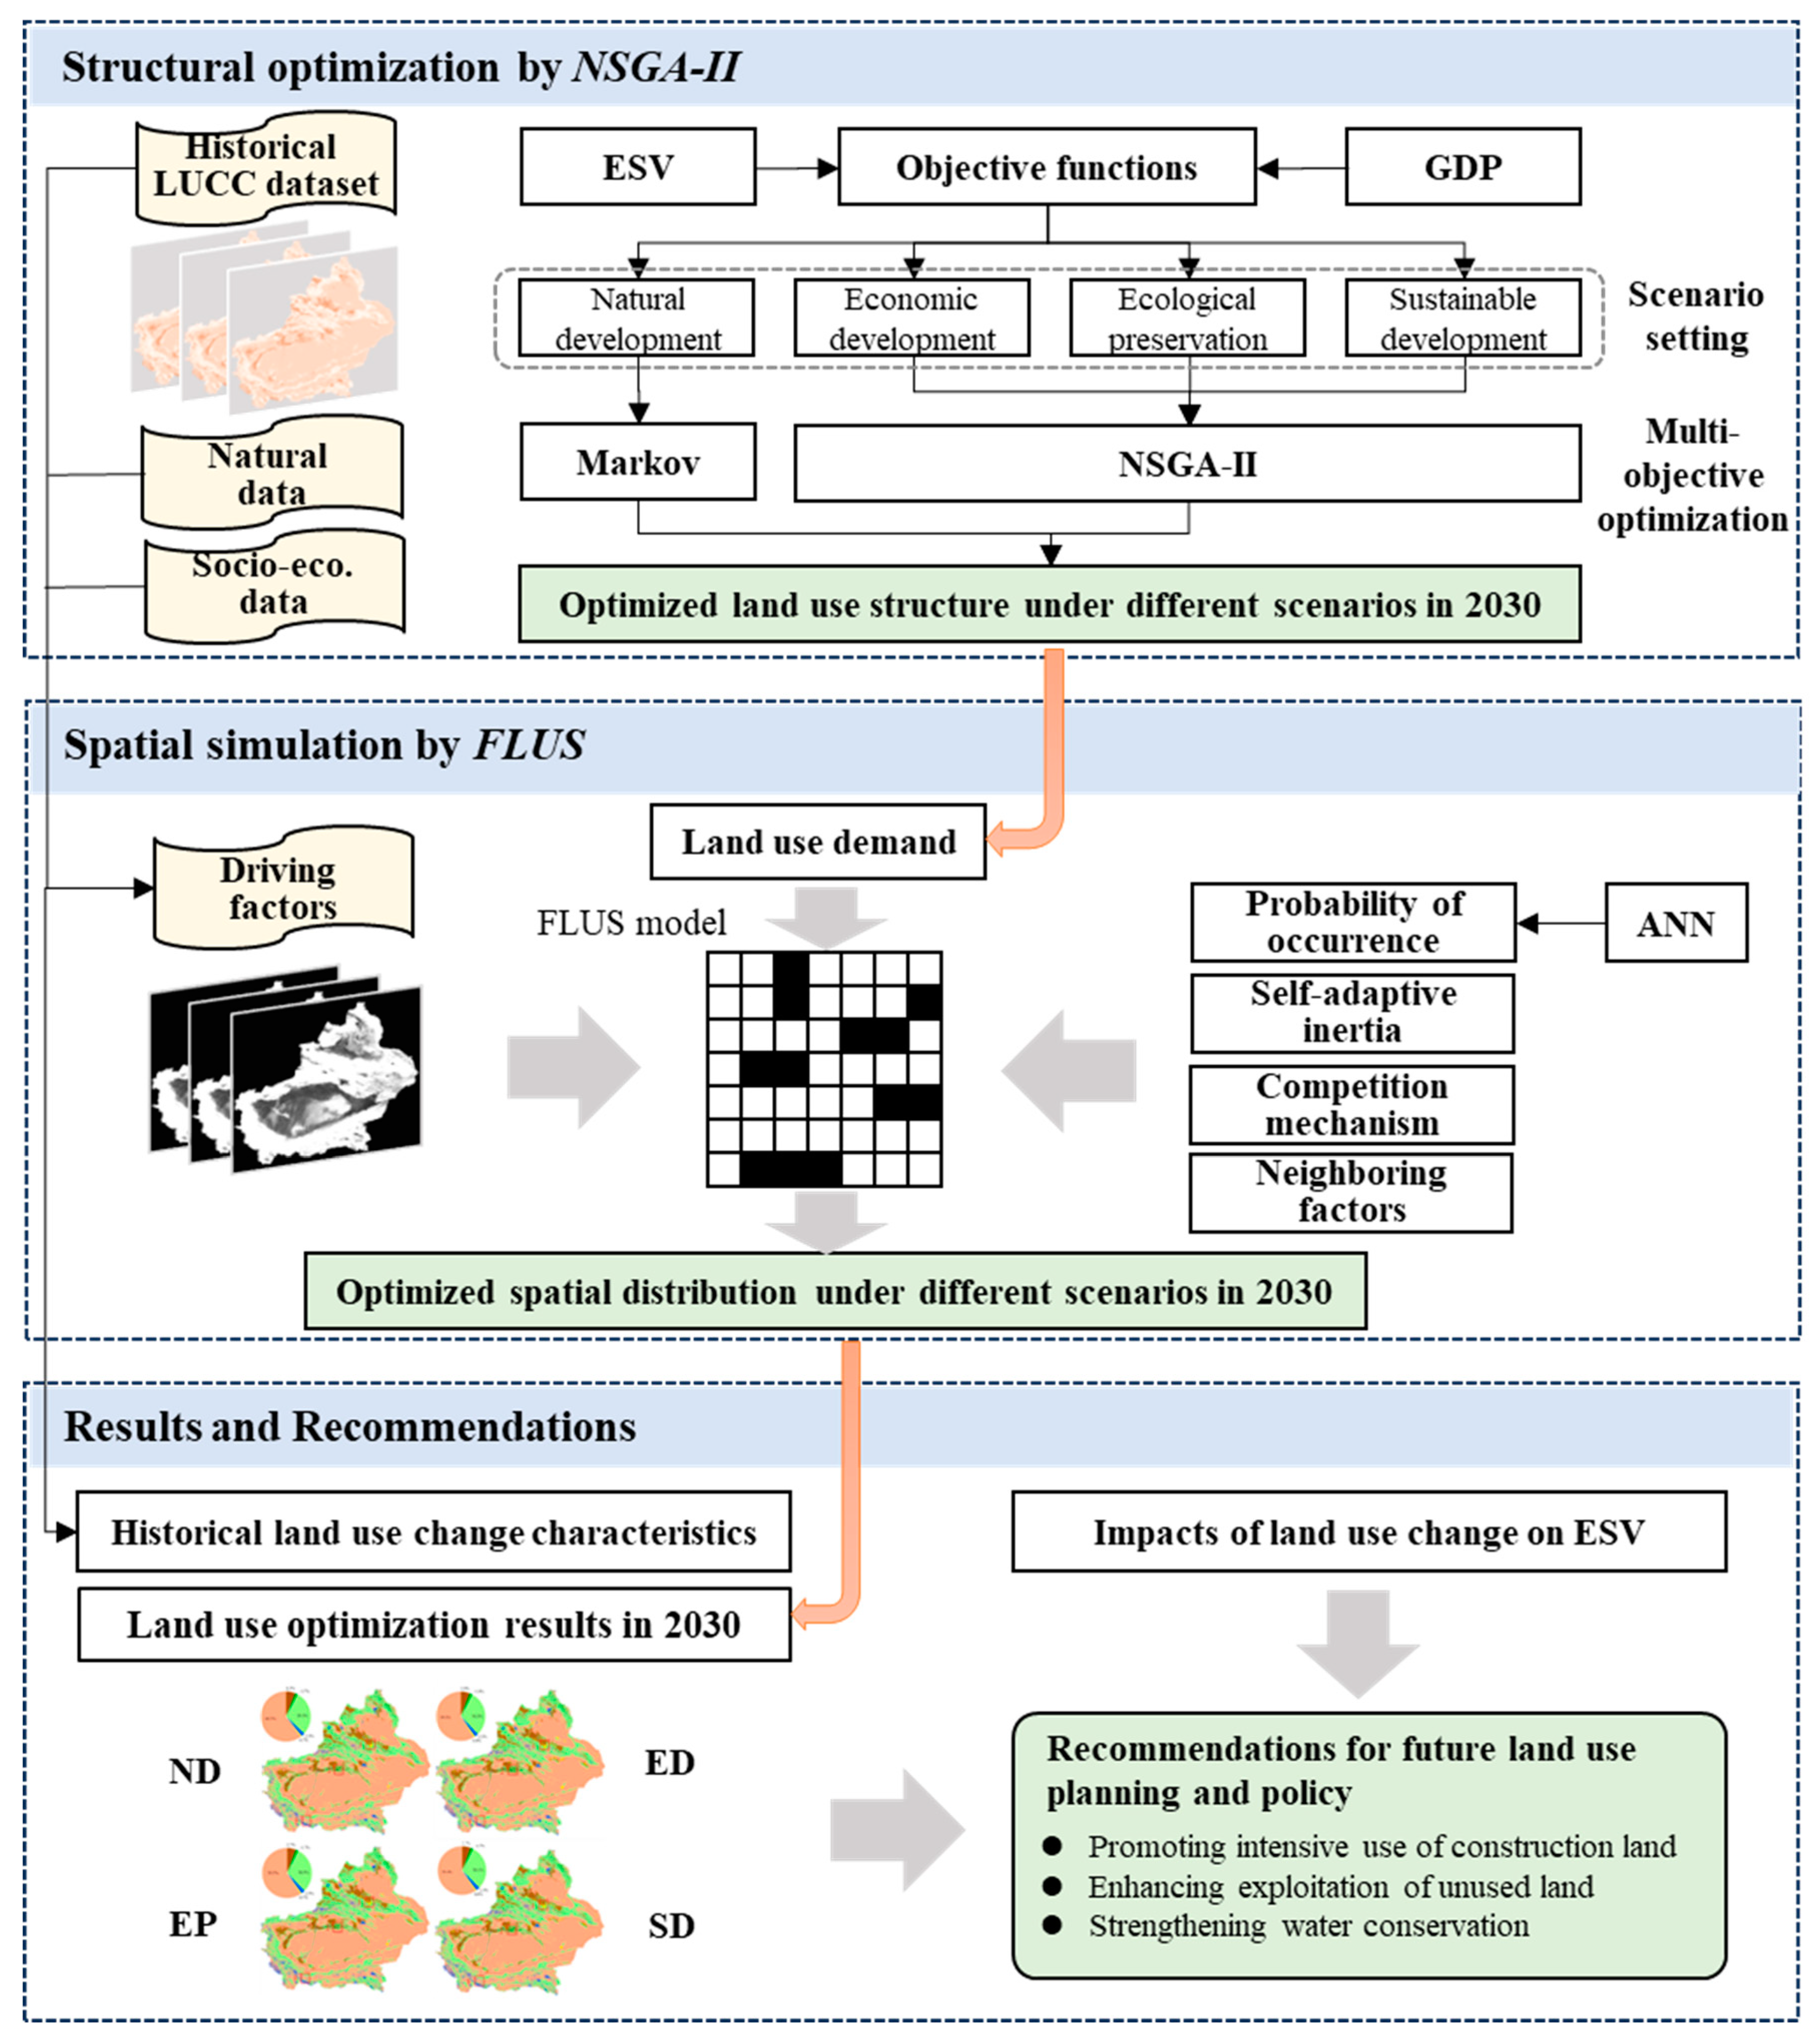
2.4. Multi-Objective Optimization Algorithm: NSGA-II

Unlike single-objective optimization, multi-objective optimization looks for a group of solutions that represent the best trade-offs among the objectives. These solutions constitute the Pareto front. NSGA-II utilizes a fast, non-dominated sorting approach, elitism, and a crowding distance mechanism to guarantee a well-distributed Pareto front [33]. It offers a hierarchy-based, non-dominated sorting approach to choose the best solution through hierarchical sorting. The parent population is combined with the offspring population to retain the better individuals by selecting the best solution using an elite strategy. A crowding distance comparison operator is given to solve the original problem that requires a specified shared radius and makes the optimal solution evenly distributed in space. This study employs the “gamultiobj” function in MATLAB software (R2024a) for the calculation. Prior to executing NSGA-II, the objective functions and the constraint conditions should be determined.

2.4.1. Objective Functions

This study considers both ecological benefits and economic benefits. To begin with, the mathematical correlations between the two objectives and the land use types that are to be optimized need to be established.
The economic benefits can be measured by GDP. Generally, GDP comprises the values added by primary, secondary, and tertiary industries. Moreover, the primary industry comprises agriculture, forestry, animal husbandry, and fishery. Thus, the economic benefits produced by cultivated land, forest land, grassland, and water bodies can be represented, respectively, by the production values of agriculture, forestry, animal husbandry, and fishery. The economic benefits produced by construction land can be represented by the total production value of the secondary and tertiary industries. Since GDP is a dynamic value, the GM (1.1) model is applied to predict the GDP of Xinjiang in 2030, based on which the first objective function regarding the economic benefits is obtained:
m a x   F 1 = 1335116 x 1 + 82434 x 2 + 67121 x 3 + 41410 x 4 + 32361275 x 5
where x1 denotes cultivated land area (km2); x2 denotes forest land area (km2); x3 denotes grassland area (km2); x4 denotes water body area (km2); x5 denotes construction land area (km2); and x6 denotes unused land area (km2).
The ecological benefits can be measured by the ESV. Based on the ESV equivalent coefficient table for Xinjiang (Table 2), the second objective function regarding the ecological benefits is obtained:
m a x   F 2 = 218850 x 1 + 1387100 x 2 + 784260 x 3 + 6175400 x 4 + 35583 x 6

2.4.2. Scenario Setting

In the execution of the NSGA-II algorithm, we can obtain a large number of global Pareto front solutions [34]. This implies that there are various combinations of land use evolution possibilities. Here, we present four distinct development scenarios with different preferences: natural development (ND), economic development (ED), ecological preservation (EP), and sustainable development (SD). The ND scenario assumes that the change in future land use will basically follow the historical evolution trend. This scenario, presenting the state without external intervention, serves as a reference for other scenarios. Its future land use structure is predicted based on the Markov chain. The ED scenario places a high priority on economic growth, with GDP being the primary objective. This scenario potentially leads to the intensification of urbanization, industrialization, and agricultural expansion, which might come with ecological and environmental costs. The EP scenario places ecological preservation as the top priority, with ESV being the primary objective. This scenario envisions a future wherein land use decisions are driven by the principle of minimizing environmental impacts and maximizing ecological benefits, even at the expense of some economic growth opportunities. The SD scenario seeks to establish a balanced relationship between ecological preservation and economic development. Recognizing the interdependence of the human–land system, this scenario aims to promote sustainable land use practices that support both ecological preservation and economic growth. Among the solutions of NSGA-II, the one with the highest F1 is chosen as the target for the ED scenario, while the one with the highest F2 is chosen as the target for the EP scenario. In addition, the solution with F1 and F2 values in the middle is chosen as the target for the SD scenario.

2.4.3. Constraint Conditions

Optimization can only be performed under certain constraint conditions. Otherwise, the acquired results will not match the actual situation. The land use change rates between 2020 and 2030 should not diverge too much from those observed between 2010 and 2020 [34]. Historical land use data suggest that the change rate for construction land should be confined to a maximum of 50%, while the change rates for other land types should be kept within 10%. Certainly, relevant policies also influence certain land use types, which should be taken into account. For instance, the Chinese government has formulated a strict cultivated land protection policy, which greatly limits the transformation of cultivated land into other types of land use. Based on the above analysis, the constraint conditions are established for the multi-objective optimization, as presented in Table 3.

2.5. Future Land Use Simulation (FLUS)

FLUS is a novel technique for the spatial simulation of land use. It comes from the theory of CA but incorporates an artificial neural network (ANN) module and an elaborate self-adaptive inertia and competition mechanism (Figure 1). Specifically, the aim of the ANN module is to simulate the probability of occurrence for each land use type at a certain location under a range of human and natural driving factors, which refer to the forces that may affect the future spatial distribution of land use. The aim of the elaborate self-adaptive inertia and competition mechanism is to handle the competition and interaction among different land use types under the constraints of land use demand, cost matrix, and weight of the neighborhood.
A total of nine driving factors are chosen to calculate the probability of occurrence. These factors include elevation, slope, aspect, and precipitation for natural aspects; GDP and population for socio-economic aspects; and distance to city centers, town centers, and key roadways for distance aspects. The cost matrix represents the difficulty level of conversion between different land use types. All elements in the cost matrix are set to 1, indicating that all land use types can be interchangeable. The neighborhood weight represents the expansion intensity of each land use type, ranging from 0 to 1. The closer the value is to 1, the stronger the expansion ability. The neighborhood weights for cultivated land, forest land, grassland, water body, construction land, and unused land are set to 0.5, 0.1, 0.2, 0.1, 1, and 0.3, respectively, according to a previous study [10].
To validate the reliability of the FLUS model, a comparison between the predicted and the actual land use data for 2020 was conducted, taking the year 2010 as the base year. The Kappa coefficient, a statistical measure of agreement, was utilized for this validation. The calculated Kappa coefficient of 0.91, exceeding the minimum threshold of 0.8, indicates that the FLUS model has a high degree of confidence.

3. Results

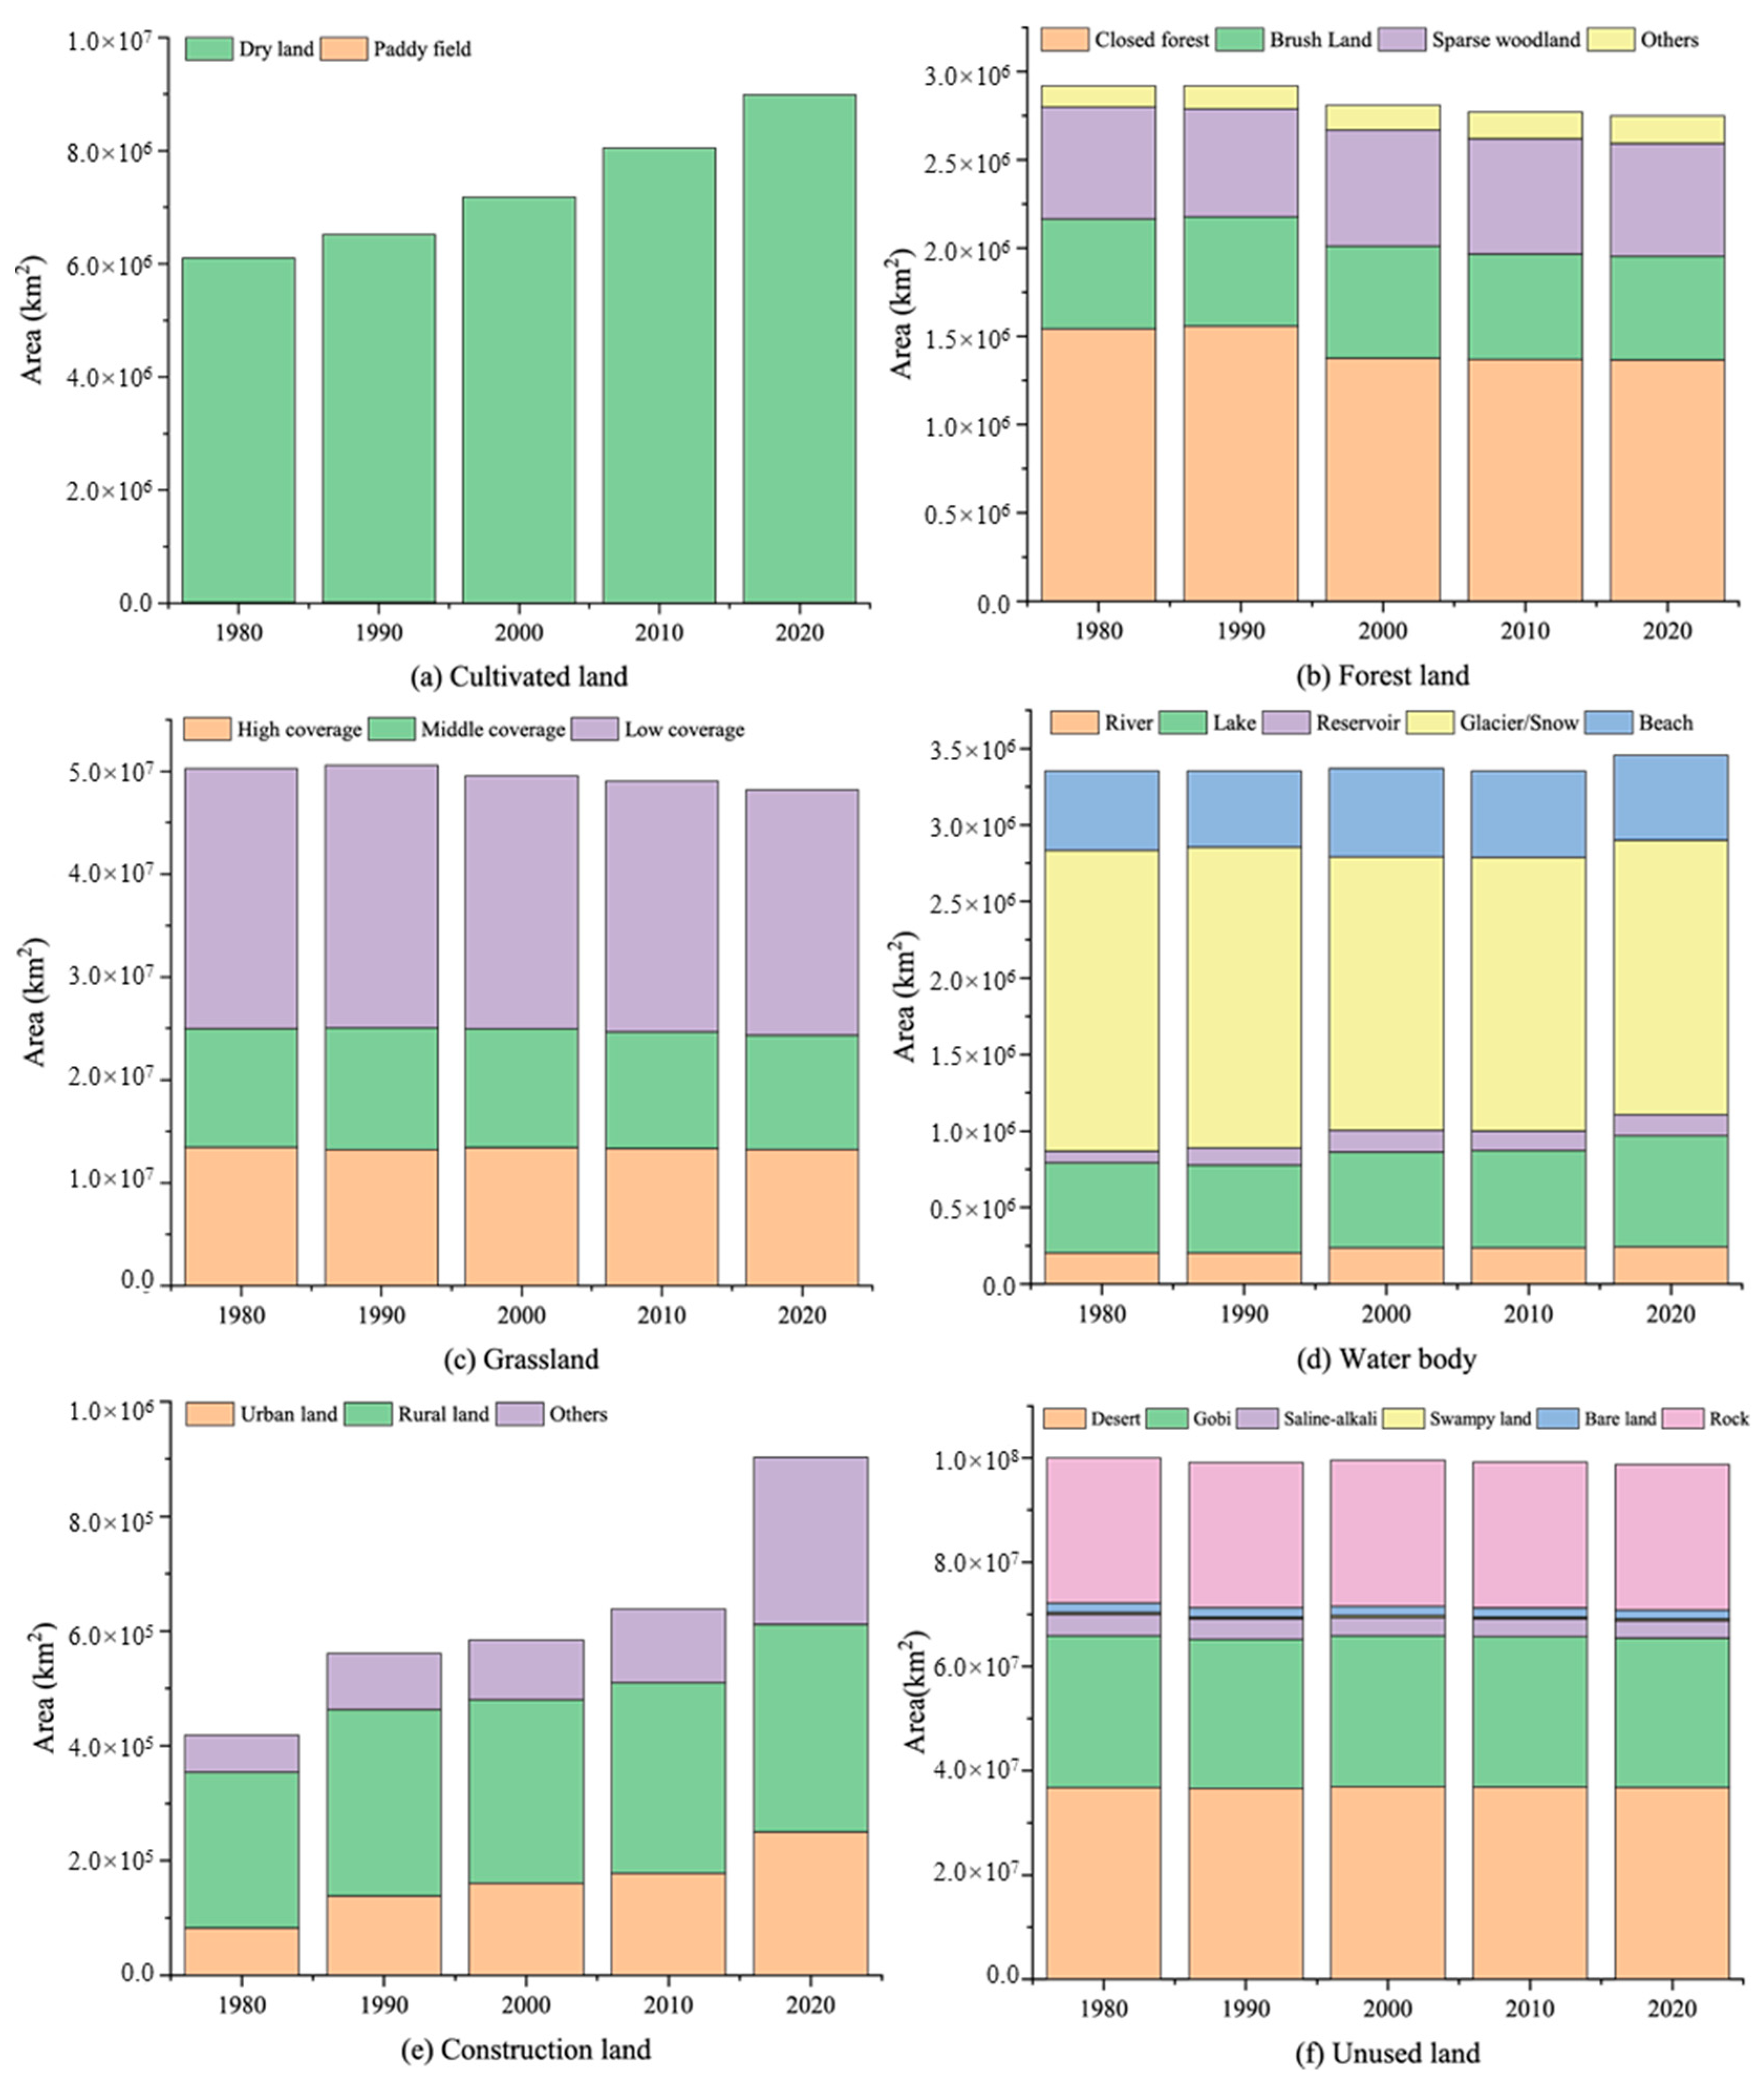
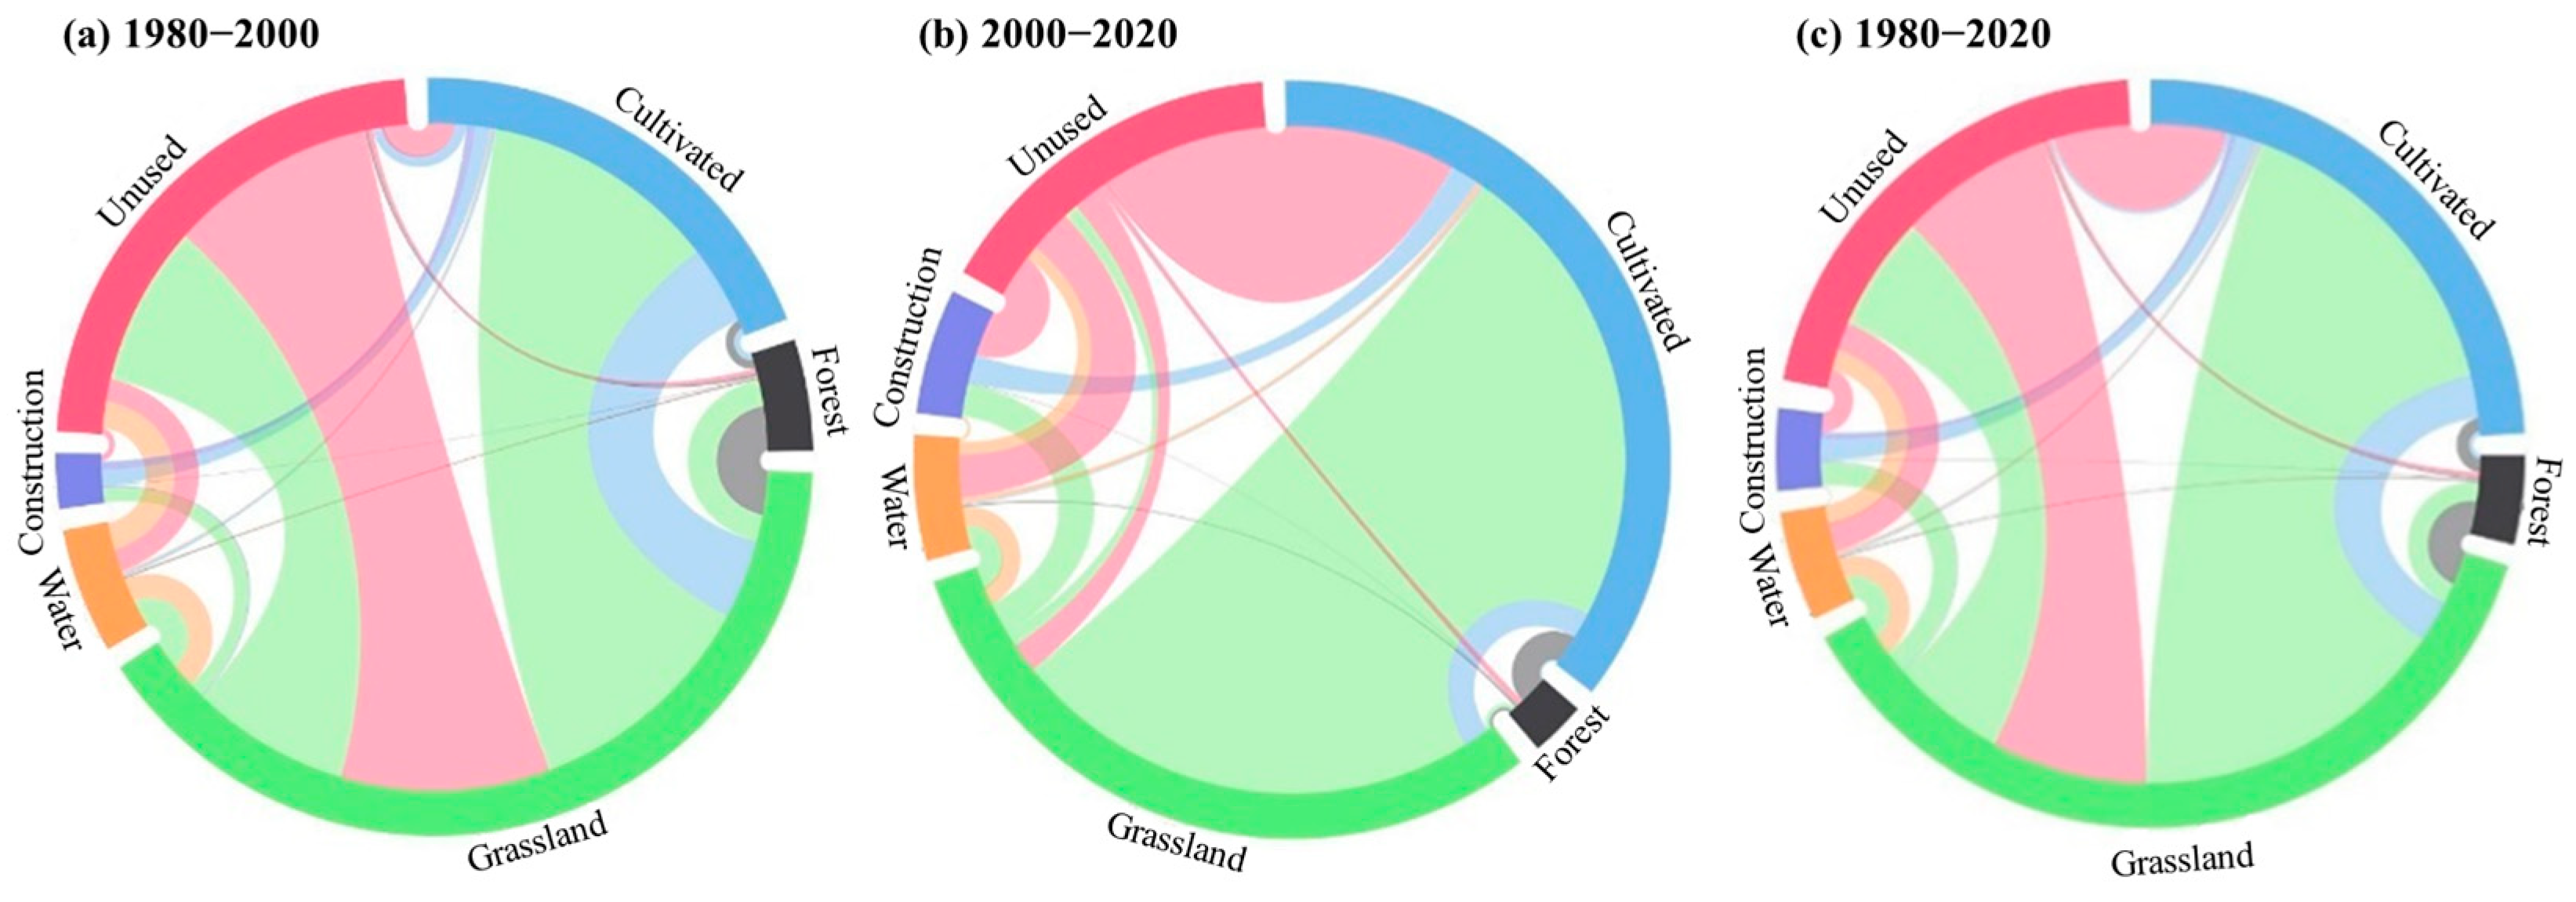
3.1. Historical Land Use Change Characteristics from 1980 to 2020

Figure 3 presents the area changes of the six primary land use types from 1980 to 2020. Further, they are subdivided into 24 subtypes to illustrate their internal structures. During the research period, unused land was consistently the most dominant type, accounting for around 60%, followed by grassland at around 30% and cultivated land at around 6%. In contrast, the scales of water bodies, forest land, and construction land were quite small (less than 3%). Cultivated land, mostly in the form of dryland due to its arid climate, exhibited a considerable expansion of 47.18%. Forest land encountered the most degradation, a drop of 5.84%, primarily due to the loss of closed forests and brushland. Low, medium, and high-coverage grasslands all suffered various degrees of degradation, resulting in an overall drop of 4.15% in the total grassland area. The degradation of forest land and grassland was partly due to arid climate and poor soil and partly due to excessive human reclamation. The permanent glacier and snow, constituting about 50% of the water body, experienced a reduction of 8.45% as a result of global climate change. However, there was a 3.04% increase in the overall area of the water body due to the enlargement of rivers, lakes, reservoirs, ponds, and beaches. The construction land was a carrier of high-intensity human activities, and thus, its expansion scale was the most remarkable, with an increase of 115.66%. Furthermore, there was a noticeable reorganization within construction land; that was, the proportion of land devoted to transportation, industrial, and urban construction grew substantially relative to that of rural residential land. Unused land accounted for more than 60% of Xinjiang’s total area, which remained steady during the research period (−1.21%). This was due to the fact that the majority of unused land consisted of the desert, Gobi, saline–alkali land, swampy land, and bare land, which significantly heightened the challenges of development and exploitation. In summary, the predominant pattern in land use transition during the research period was the increase in construction land (+115.66%) and cultivated land (+47.18%) at the expense of grassland (−5.48%) and forest land (−4.15%), both of which hold substantial ecological significance.
Figure 4 and Table 4 show the land use transition statistics from 1980 to 2020. An area of 81,100 km2 underwent alterations in land use types, accounting for approximately 4.9% of Xinjiang’s total area. Cultivated land accounted for the most significant transfer-in area, with 43.32% of the total predominantly derived from grassland and unused land. The second was grassland, comprising 26.28% of the total, mostly originating from unused land and cultivated land. The following were unused land, construction land, water body, and forest land, respectively. Grassland accounted for the largest transfer-out area, with 52.01% of the total, primarily converted into cultivated land and unused land. The second was unused land, with 29.52% of the total predominantly converted into grassland and cultivated land. The following were cultivated land, forest land, water bodies, and construction land, respectively. Overall, there was a considerable mutual transition among cultivated land, grassland, and unused land during the research period.

3.2. Structural Optimization Results of Land Use Under Different Scenarios in 2030

Table 5 presents the optimization results of land use structure, economic benefits, and ecological benefits in 2030 under different development scenarios.
Under the ND scenario, the land use change from 2020 to 2030 will basically follow the historical evolutionary trend from 2010 to 2020. The two most active land use types will still be construction land and cultivated land, with expansion rates of 29.46% and 10.13%, respectively. The consequence is the degradation of other land use types. Grassland will suffer the greatest loss, dropping 1.53%, followed by forest land and unused land, dropping 1.20% and 0.44%, respectively. The water body will remain relatively stable, with an increase of less than 1%. The ESV is predicted to decrease by 0.11%, from 97.73 × 10⁹ USD in 2020 to 97.62 × 10⁹ USD in 2030, whereas the economic benefits will rise by 21.80%, from 64.03 × 10⁹ to 77.99 × 10⁹ USD.
Under the EP scenario, the expansion rates of both construction land and cultivated land will slow down compared to the ND scenario, dropping to 20.05% and 3.45%, respectively. In contrast, there will be an obvious enlargement in grassland and water bodies, at 2.43% and 10.0%, respectively. Only forest land and unused land will shrink—by 1.84% and 1.98%, respectively. Owing to the vast area of grassland and the high ecological significance of the water body, the ESV will exhibit the most substantial rise compared to the other three scenarios, increasing by 4.36% to 101.99 × 10⁹ USD. However, the restricted construction land growth will result in the lowest economic benefits, amounting to only 73.11 × 10⁹ USD.
Under the ED scenario, the construction land will experience the most substantial growth of 48.97% among the four scenarios. Consequently, the economic benefits are likewise the highest, rising by 34.52% to 86.14 × 10⁹ USD. Except for the unused land (−2.49%), all of the cultivated land, forest land, grassland, and water bodies will experience varying degrees of growth, at 6.42%, 7.88%, 3.15%, and 5.34%, respectively. In such a situation, the ESV will also increase by 3.35%, but not as much as that in the EP scenario.
Under the SD scenario, both the economic benefits (79.94 × 10⁹ USD) and the ESV (101.72 × 10⁹ USD) levels will fall between those of the ED and the EP scenarios. This means that the SD scenario will achieve a relatively balanced state of ecological preservation and economic development. Compared to the ED scenario, the expansion scales of construction land and cultivated land will be more tightly regulated, increasing by 36.62% and 3.01%, respectively. Besides, all of the forest land, grassland, and water bodies will have certain degrees of growth, increasing by 2.99%, 1.78%, and 9.43%, respectively. Only unused land will suffer a decrease of 1.89%.
Overall, the final optimization results align well with the definitions of these scenarios, demonstrating the efficacy of the proposed multi-objective optimization method.

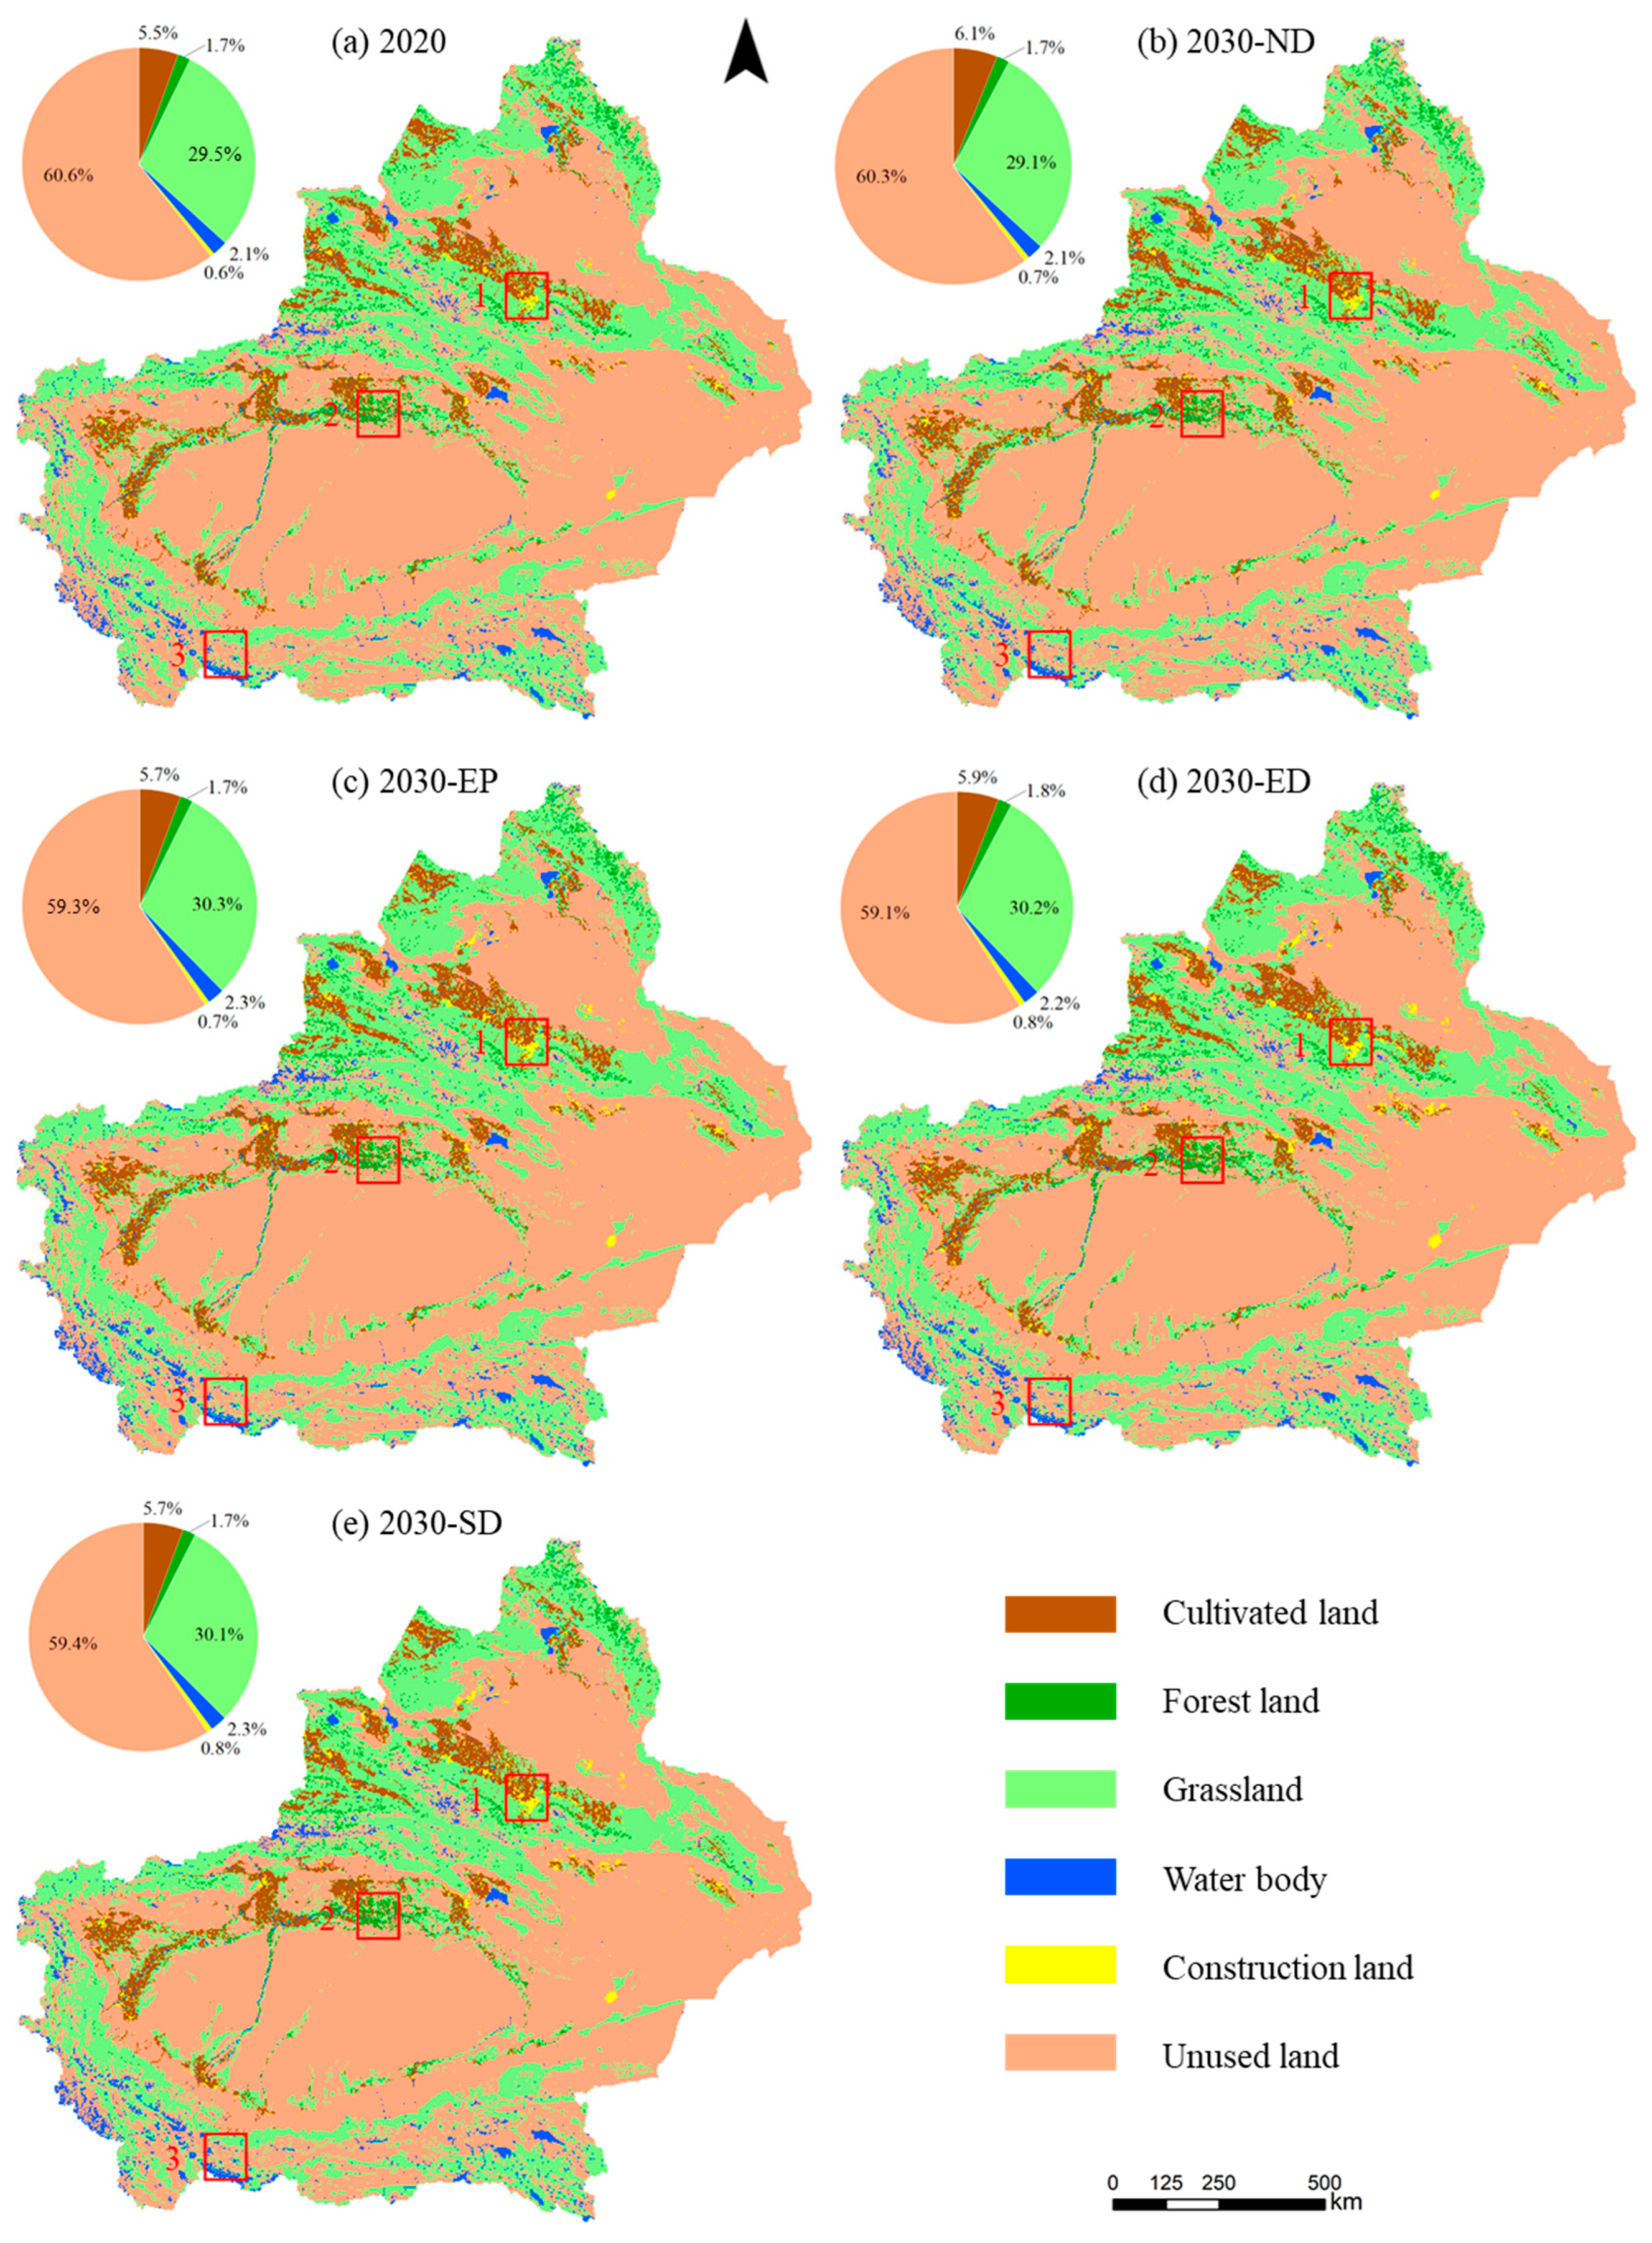
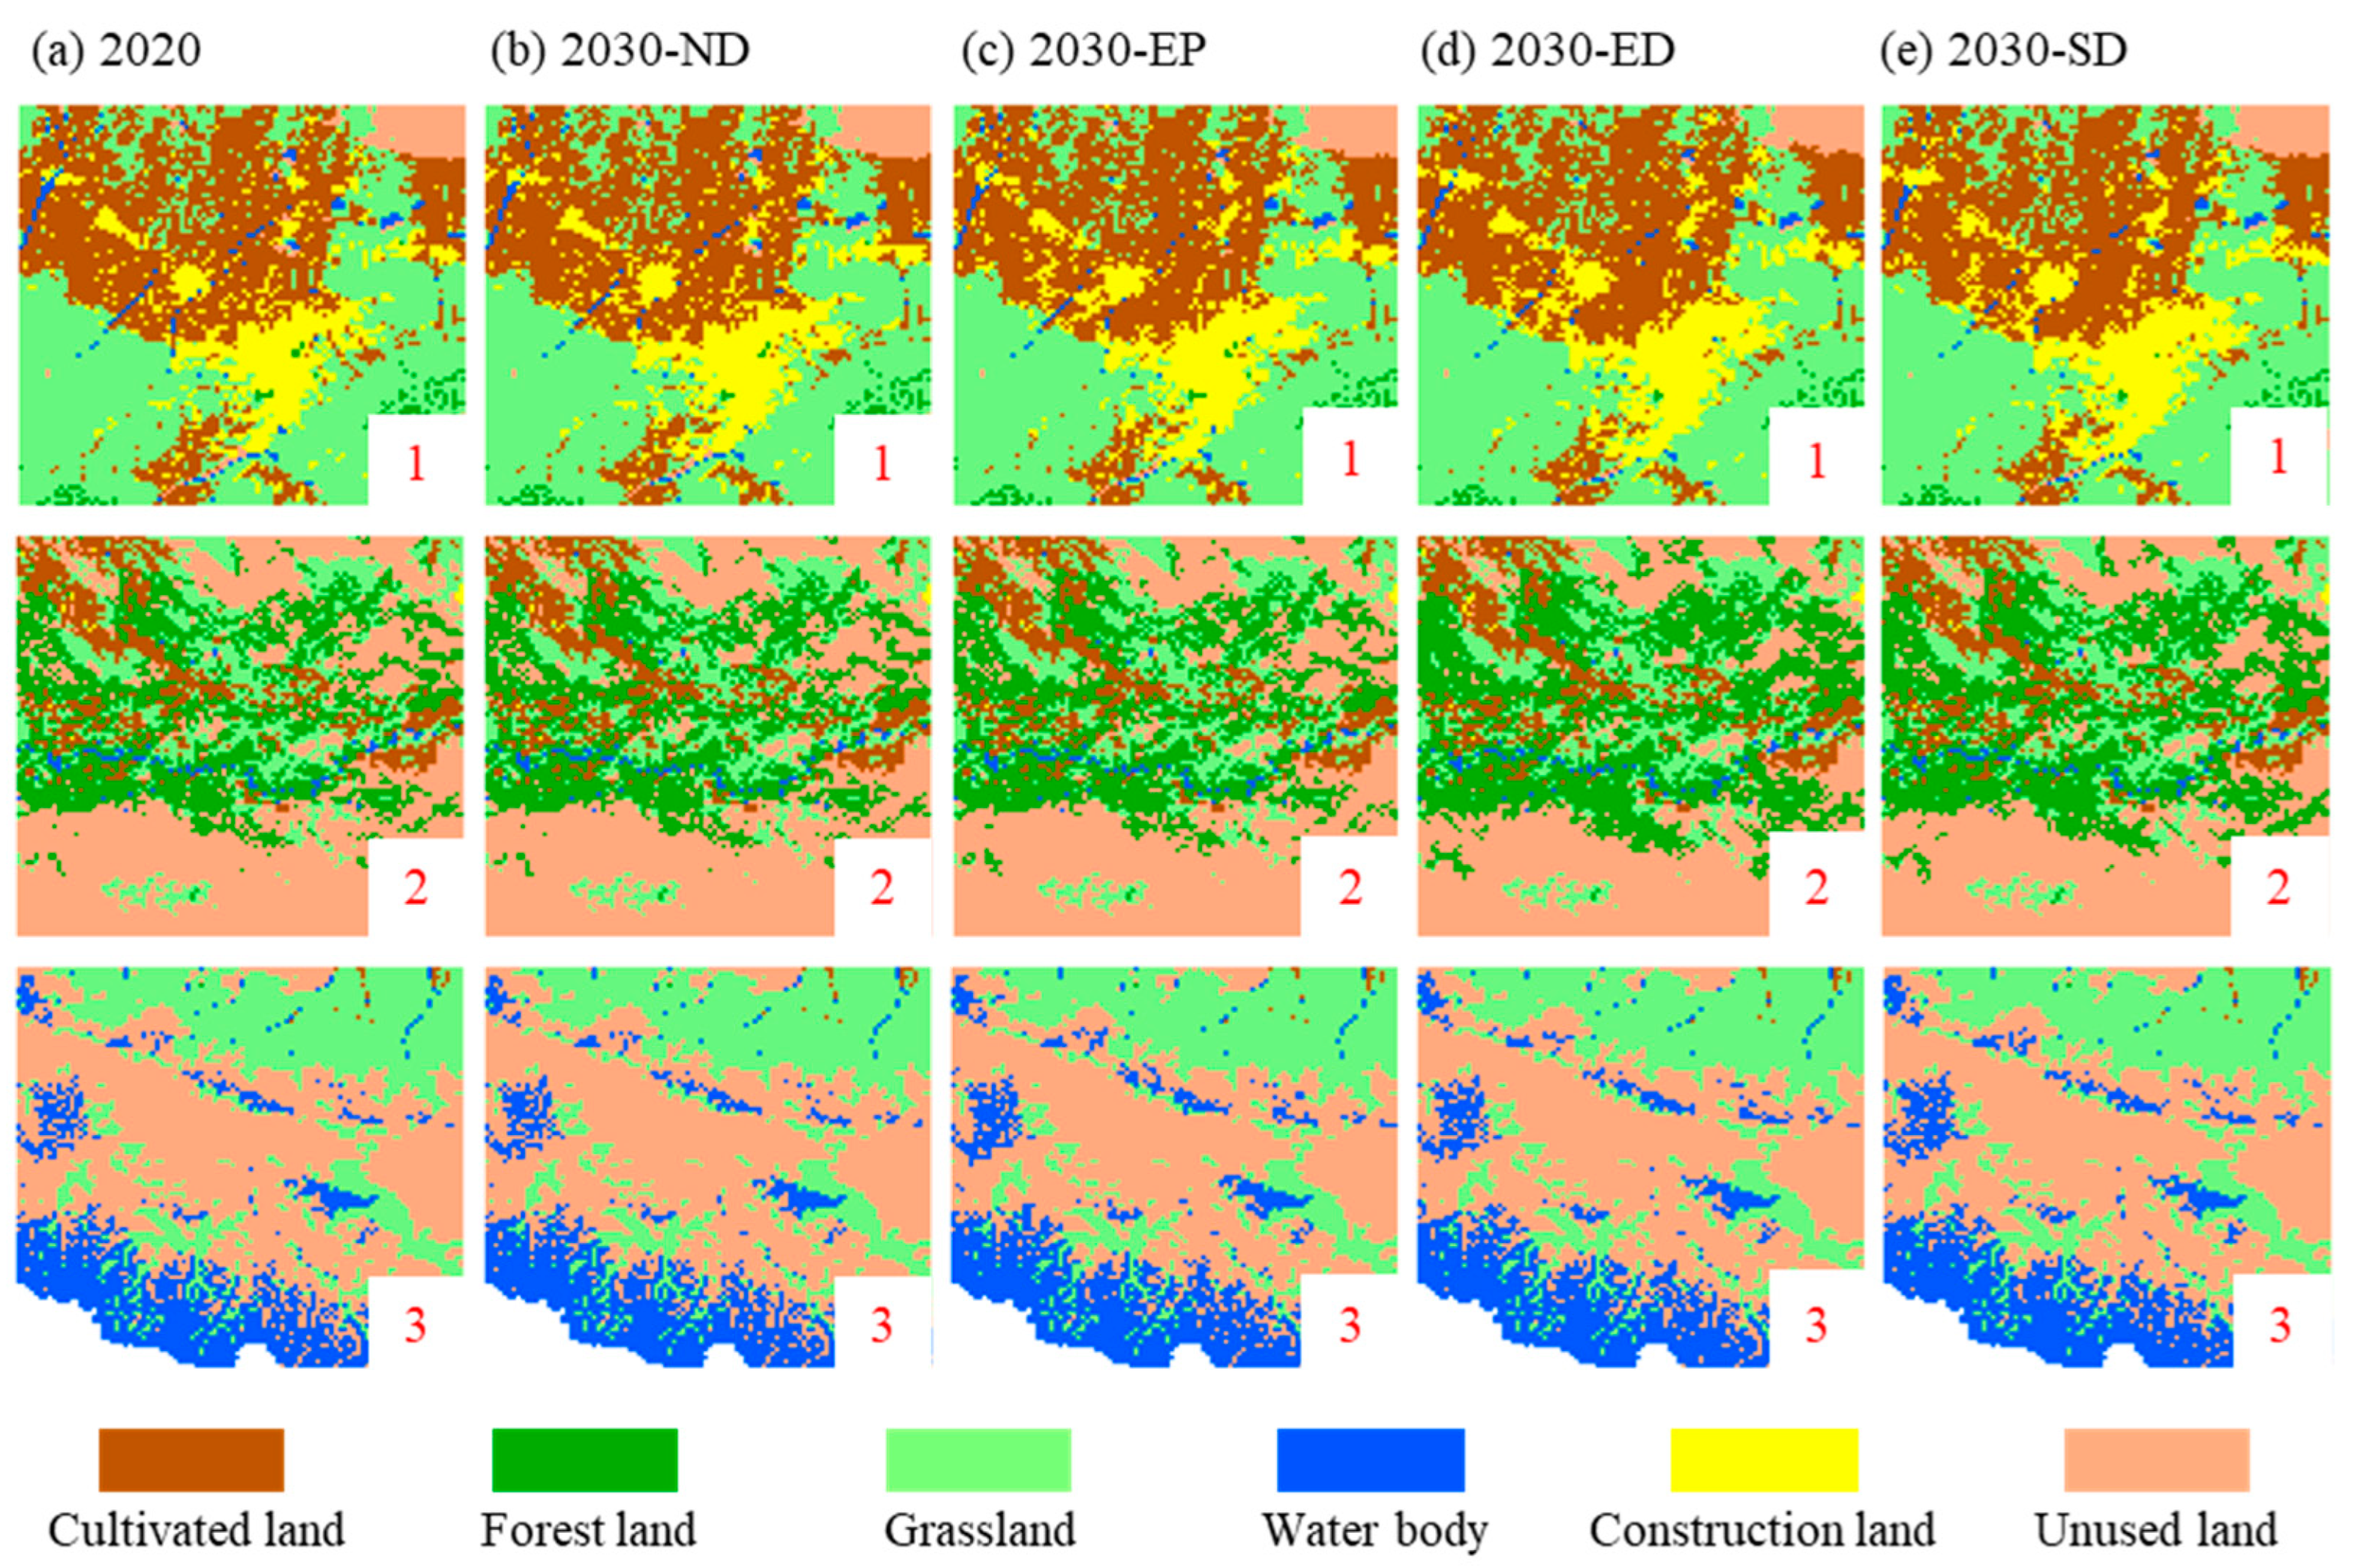
3.3. Spatial Simulation Results of Land Use Under Different Scenarios in 2030

The optimized land use structures in 2030 under different scenarios, along with the driving factor data, were input into the FLUS model according to the flowchart in Figure 1. Then, the spatial simulation outcomes for 2030 corresponding to each scenario were generated, as displayed in Figure 5. Across all these scenarios, the land use distribution characteristics remain basically consistent. In particular, they are highly correlated with the unique topography of Xinjiang, i.e., “three mountains surrounding two basins”. Forest land and grassland are predominant in the mountainous regions and the adjacent basin regions. Oases are primarily located in some narrow zones between mountains and basins, where cultivated land and construction land are predominant. These regions have relatively better soil and irrigation conditions. Water bodies are scattered across valleys and high-altitude areas. Furthermore, unused land, primarily in the form of desert and Gobi, occupies the majority of the two basins.
Given the vast territory of Xinjiang, we select three typical regions for comparative analysis of different scenarios, as seen in Figure 6. Region 1 is Urumqi, the provincial capital of Xinjiang, which represents the urban agglomeration area; Region 2 is the southern Tianshan Mountains, which represents the agglomeration area of forest land; and Region 3 is the southern high-altitude area, where the water bodies are widely distributed. In Region 1, all four scenarios in 2030 exhibit a notable expansion in construction land compared to 2020, with ES being the most prominent. Besides, the expansion of construction land generally occupies the surrounding cultivated land and grassland. The population density, urbanization rate, industrial concentration, and economic level in Urumqi and the adjacent regions are much higher than in other regions, thus greatly increasing the demand for construction land. In Region 2, the growth of forest land in the ED and SD scenarios is more prominent. The coverage density of the original forest land is relatively high, and the primary direction of expansion is towards the surrounding unused land. In Region 3, the expansion of the water body is particularly noticeable in the EP, ED, and SD scenarios. In view of the high altitude of this region, the observed increase in water bodies is likely attributed to glacial melting as a result of climate change. In summary, land use change patterns differ significantly across various regions, based on which regional land use policies can be devised.

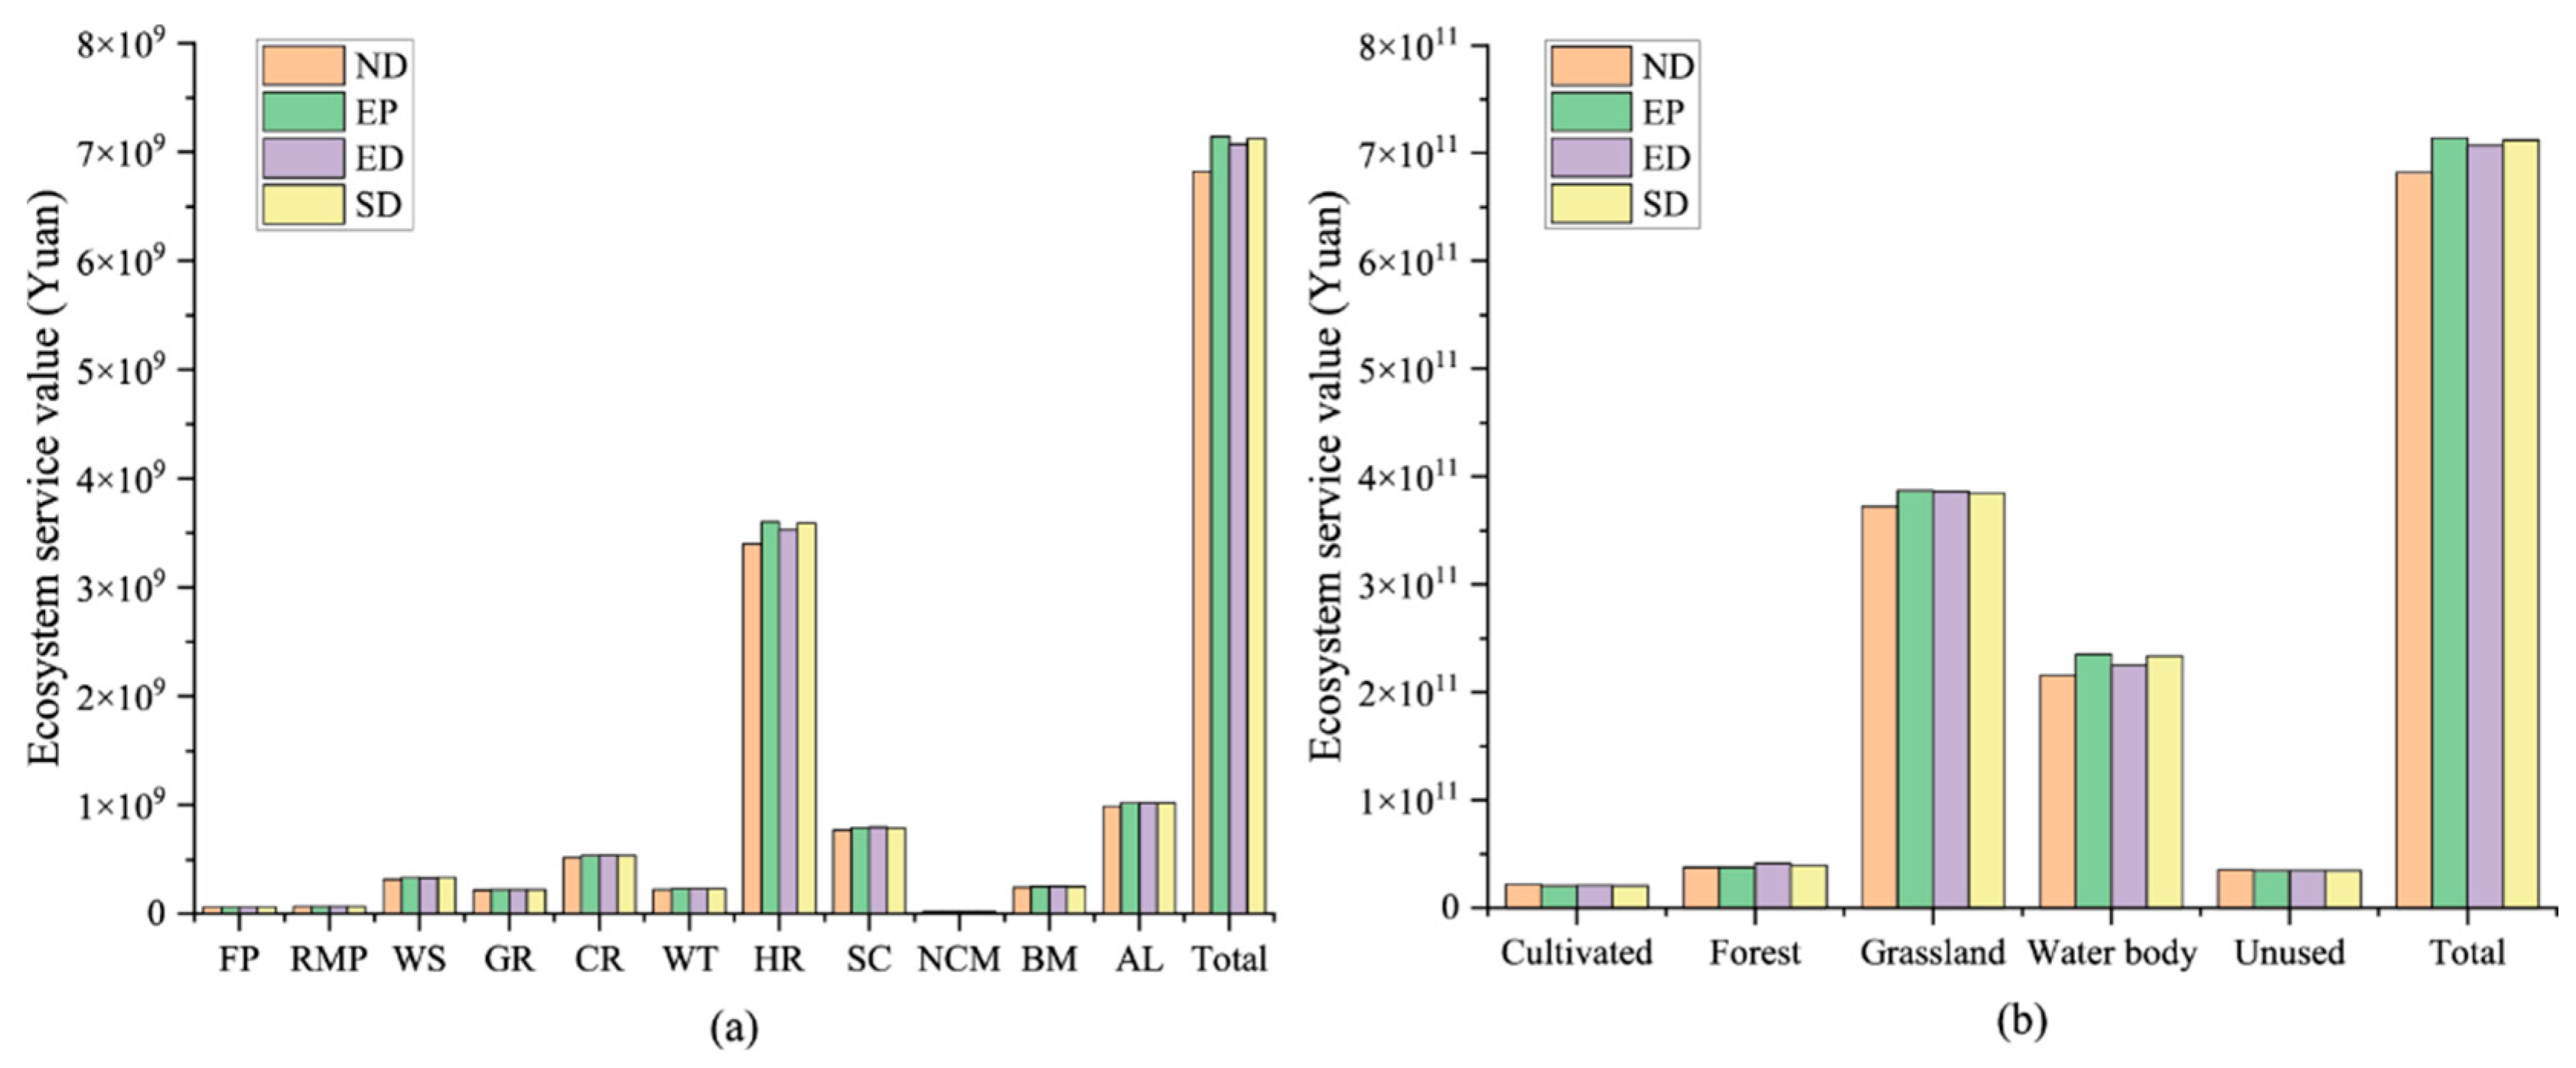
3.4. Impacts of Land Use Change on ESV

The results of the predicted ESV in Table 3 are further analyzed to illustrate the impacts of land use change on ESV, as presented in Figure 7. The ranking of the ESV among these development scenarios is as follows: EP > SD > ED > ND. The fact that the ND scenario comes in last indicates that neither economic nor ecological benefits could attain their full potential in the absence of external intervention or regulatory measures. For individual ecosystem service functions (Figure 7a), hydrological regulation, aesthetic landscape, and soil conservation services are the three most significant contributors to the total ESV. In particular, the hydrological regulation service accounts for around 50%, owing to the high ecological significance of the water body (see Table 2). As a consequence, the total ESV exhibits a high correlation with the value of the hydrological regulation service. This highlights the significance of water resources for Xinjiang. The contributions of different land use types to the total ESV are in the following order: grassland > water body > forest land > unused land > cultivated land (Figure 7b). Grassland contributes the most, representing around 50% of the total. This is mainly due to the widespread distribution of grassland, as well as its important role in hydrological regulation and soil conservation services (Table 2). Water body ranks second despite being the fourth largest in terms of area, accounting for around 30%. This explains why the EP scenario has the highest ESV since its grassland and water body areas are obviously larger than the other scenarios. Furthermore, the overall contribution of cultivated land, forest land, and unused land to the total ESV is below 20%, although they make up about 70% of Xinjiang’s total area. In all, grassland and water bodies play a crucial role in Xinjiang’s ecological benefits and should be prioritized in land use planning.

4. Discussion

4.1. The Integrated NSGA–II–FLUS Model

The significance of multi-objective optimization in LUCC research is increasingly being recognized. While several studies have addressed the optimization issues within Xinjiang [35] as well as local cities [36], our research stands out through the novel integration of NSGA-II and FLUS. NSGA-II outperforms traditional multi-objective optimization approaches in terms of convergence rate and solution quality, especially in high-dimensional and complex optimization scenarios, showing robustness and adaptability in resource allocation applications [33]. FLUS is able to address the limitations of conventional spatial simulation methodologies in terms of simulation accuracy, computational efficiency, and the integration of socio-economic and natural environmental factors [37]. By integrating NSGA-II and FLUS, we are able to utilize the individual strengths of both models. What is more, the optimization accuracy also depends on the accuracy of the ESV assessment. In this study, we assess the ESV in Xinjiang based on a modified equivalent factor method. Specifically, we modify the equivalent coefficients of China by incorporating various regional factors specific to Xinjiang, including net primary productivity, precipitation, soil conservation capacity, and socio-economic factors. By doing so, our study can improve the accuracy of ESV assessment to a certain extent, in contrast to the previous studies that neglect these regional factors.
Based on the proposed model, this study further provides four predefined development scenarios, i.e., ND, EP, ED, and SD, with different preferences. Each scenario represents one land use evolution possibility under certain objectives and constraints. It is observed that all of the ED, EP, and SD scenarios have certain superiorities in comparison to the ND scenario (the situation without external intervention). The ESV under the ND scenario is the lowest. This further highlights the necessity of optimizing land use in Xinjiang. The ED scenario places a high priority on economic growth; hence, its economic growth is also the highest. However, this process is accompanied by the most substantial expansion of construction land, which results in less ESV in comparison to the EP and SD scenarios. The EP scenario places ecological preservation as the top priority; hence, its ESV is also the highest. However, the cost is the lowest economic growth among the four scenarios. The SD scenario is believed to be more favorable for Xinjiang in terms of a relatively balanced state between ecological preservation and economic development. The expansion scale of construction land will be controlled within a reasonable range, and all the ecologically valuable lands will have certain degrees of growth. Nevertheless, given Xinjiang’s arid climate and coupled oasis–mountain–desert ecosystem, we must carefully assess if this predefined scenario can be implemented in practice.

4.2. Policy Implications

Although the SD scenario is preferred for Xinjiang, there exist two major obstacles to implementing it in practice. The first lies in the lack of high-quality land. Under the SD scenario, all of the cultivated land (+3.01%), forest land (+2.99%), grassland (+1.78%), water body (+9.43%) and construction land (+36.62%) will experience varying degrees of growth, except for unused land (−1.89%). Oases only comprise less than 10% of Xinjiang’s total area, as previously stated. Thus, there will not be sufficient high-quality land for exploitation or construction. Moreover, the majority of unused land consists of desert (34%), bare land (27%), and Gobi (19%), which are actually not suitable for exploitation. The second obstacle stems from the unpredictability of water resources. In Xinjiang, water resources are distributed unevenly in space and time, with both resource and engineering water shortages coexisting. Despite a slight increase in water body area over the past 40 years, rapid global climate change still makes it the most uncertain factor in the future.
In light of the preceding discussions, this study proposes three recommendations for the consideration of decision-makers to ensure that the SD scenario can be realized in the future. (1) Regarding urban agglomerations, the government should formulate strict containment policies to restrict construction land expansion. Otherwise, a large amount of cultivated land and grassland surrounding construction land will be occupied, as demonstrated in Figure 6. To prevent the over-expansion of construction land in 2030, its annual growth rate should be kept below 3%. Besides, it is also crucial to enhance the intensive use of construction land to meet the growing demand [38]. Measures such as concentrating industries in industrial parks and attracting rural populations to gather in small towns are encouraged to raise the land utilization rate. (2) Regarding unused land, the government should provide policy and financial support for exploiting and utilizing unused land. As illustrated in Figure 6, the primary expansion direction of forest land is towards the surrounding unused land. However, the inherent poor quality of unused land will hinder this process. Previous studies have shown that there still remain possibilities to improve poor soils with the aid of appropriate technologies. Arid soils are generally characterized by insufficient water, salinization, barrenness, and decreased biomass, which are not conducive to plant growth and agricultural production. Managing irrigation and drainage, enhancing native beneficial soil microbes, and combining soil amendments, conditioners, and residue management are all effective ways to improve the soil environment and increase soil fertility [39]. (3) Regarding water resources, the government should formulate protective measures in advance to cope with future uncertainties. Despite being extremely important for ESV, water is always the scarcest resource. Constructing and upgrading water storage infrastructures, such as reservoirs, ponds, and aquifers, can help store water either from precipitation or from glacier melting. Besides, 95% of water resources in Xinjiang are used for agricultural irrigation, with the remaining 5% going toward industrial and residential uses. Apparently, efficient water conservation in agriculture is vitally important. Extensive irrigation should be replaced with high-tech irrigation like underground pipeline irrigation, sprinkler irrigation, and drip irrigation [40].

4.3. Limitations and Future Directions

The accuracy of the proposed NSGA-II-FLUS method depends largely on whether the influencing factors involved are sufficient. In this study, we have already considered various natural factors, socio-economic factors, and regional development policies according to the actual situation of Xinjiang. Nonetheless, additional factors that have not been addressed remain, such as landscape heterogeneity [4] and the impact of construction land [19], among others. As reported in previous studies, the fragmentation of complex regional landscape patterns would negatively impact the ecosystem’s stability and biodiversity, while construction land would affect the ecosystem in terms of hydrological regulation, gas regulation, and waste treatment. Future work needs to thoroughly evaluate these influencing factors to achieve more precise optimization results.
It is crucial to recognize that land use planning is a complex system of engineering, which typically includes planning objectives and principles, status analysis and evaluation, functional zoning, use control, index control, and spatial layout, among others. The quantitative results presented in this study contribute to predicting and optimizing future land use in terms of both quantity and spatial distribution, as well as evaluating the corresponding economic and ecological benefits. They can also reflect regional differences in land use change patterns, based on which regional land use policies can be devised. However, relying solely on numerical indicators may overlook the impacts of policy, cultural, social, and other factors, thereby leading to discrepancies between the planned results and actual needs. Equally significant is the role of qualitative analysis in land use planning, which primarily draws upon expert insights, policy directives, and socio-economic development trends to address value judgment, social relationships, cultural significance, etc. Overall, the formulation of scientific, reasonable, and feasible land use planning schemes depends on the combination of qualitative and quantitative analyses. The former provides direction and framework for the latter, while the latter provides data support and verification for the former.

5. Conclusions

This study develops a novel multi-objective land use optimization framework that couples NSGA-II and FLUS to address the dual goals of maximizing ecosystem services and economic benefits. Four development scenarios (ND, ED, EP, and SD) are predefined to simulate different land use evolution possibilities in terms of both quantity and spatial distribution. Xinjiang is selected as a case study. The main conclusions are obtained as follows:
(1) Construction land and cultivated land were the two most active land use types during the past 40 years, expanding by 115.66% and 47.18%, respectively. This was an unavoidable result of rapid socio-economic development and urbanization. Grassland and forest land had high ecological significance; however, they suffered degradation of 5.48% and 4.15%, respectively. This land use transition pattern has exerted tremendous pressure on its fragile ecosystem. (2) All of the EP, ED, and SD scenarios exhibit certain superiorities over the ND scenario, further highlighting the necessity of land use optimization for Xinjiang. Among them, the SD scenario is considered more favorable due to its ability to balance ecological preservation and economic development. All the ecologically valuable lands will have certain degrees of growth, whereas the expansion scale of construction land will be effectively controlled. (3) Given Xinjiang’s arid climate and coupled oasis–mountain–desert ecosystem, the lack of high-quality land and the unpredictability of water resources will be the two major obstacles to implementing the SD scenario. To overcome them, the government should provide policy and financial support for restricting construction land expansion, exploiting unused land, and strengthening water conservation.
In summary, the proposed method provides a quantitative reference for scientific land use planning under multiple conflicting goals. It demonstrates high efficacy in predicting and optimizing future land use in terms of both quantity and spatial distribution, evaluating the corresponding economic and ecological benefits, and reflecting regional differences. However, it lacks flexibility in dealing with value judgment, social relationships, cultural significance, etc., which needs to be strengthened in future research. The framework of this study is also applicable to other regions that are struggling with conflicts between ecological preservation and economic development.

Author Contributions

Conceptualization, X.L.; methodology, Z.L.; software, Z.L.; validation, Z.L.; formal analysis, X.L.; investigation, X.L.; resources, X.L.; data curation, X.L.; writing—original draft preparation, Z.L.; writing—review and editing, X.L.; visualization, X.L.; supervision, X.L.; project administration, X.L.; funding acquisition, X.L. All authors have read and agreed to the published version of the manuscript.

Funding

This research was funded by the National Natural Science Foundation of China, grant numbers 42101173 and 42130712.

Data Availability Statement

The original contributions presented in the study are included in the article, further inquiries can be directed to the corresponding author.

Conflicts of Interest

The authors declare no conflicts of interest.

References

  1. Li, X.; Yang, Y.; Liu, Y. Research Progress in Man-Land Relationship Evolution and its Resource-Environment Base in China. J. Geogr. Sci. 2017, 27, 899–924. [Google Scholar] [CrossRef]
  2. Zhang, Z.; Shen, Z.; Liu, L.; Zhang, Y.; Yu, C.; Cui, L.; Gao, Y. Integrating Ecosystem Services Conservation into the Optimization of Urban Planning Policies in Eco-fragile Areas: A Scenario-Based Case Study. Cities 2023, 134, 104200. [Google Scholar] [CrossRef]
  3. Nedd, R.; Light, K.; Owens, M.; James, N.; Johnson, E.; Anandhi, A. A Synthesis of Land Use/Land Cover Studies: Definitions, Classification Systems, Meta-Studies, Challenges and Knowledge Gaps on a Global Landscape. Land 2021, 10, 994. [Google Scholar] [CrossRef]
  4. Duan, X.; Chen, Y.; Wang, L.; Zheng, G.; Liang, T. The Impact of Land Use and Land Cover Changes on the Landscape Pattern and Ecosystem Service Value in Sanjiangyuan Region of the Qinghai-Tibet Plateau. J. Environ. Manag. 2023, 325, 116539. [Google Scholar] [CrossRef] [PubMed]
  5. Xin, S.; Li, Z.; Chen, N.; Zhang, Z.; Zhang, X.; Chen, H.; Ma, X.; Kang, L. The Contribution of Multi-objective Land Use Optimization to Reducing Ecological Risk: A Case Study of the Lanzhou-Xining Urban Agglomeration. Ecol. Ind. 2024, 168, 112604. [Google Scholar] [CrossRef]
  6. Zong, S.; Xu, S.; Huang, J.; Ren, Y.; Song, C. Distribution Patterns and Driving Mechanisms of Land Use Spatial Conflicts: Empirical Analysis from Counties in China. Habitat Int. 2025, 156, 103268. [Google Scholar] [CrossRef]
  7. Wang, S.W.; Munkhnasan, L.; Lee, W.K. Land Use and Land Cover Change Detection and Prediction in Bhutan’s High Altitude City of Thimphu, Using Cellular Automata and Markov Chain. Environ. Chall. 2021, 2, 100017. [Google Scholar] [CrossRef]
  8. Chasia, S.; Olang, L.O.; Sitoki, L. Modelling of Land-Use/Cover Change Trajectories in a Transboundary Catchment of the Sio-Malaba-Malakisi Region in East Africa Using the CLUE-S Model. Ecol. Model. 2023, 476, 110256. [Google Scholar] [CrossRef]
  9. Luo, X.; Luo, Y.; Le, F.; Zhang, Y.; Zhang, H.; Zhai, J. Spatiotemporal Variation and Prediction Analysis of Land Use/Land Cover and Ecosystem Service Changes in Gannan, China. Sustainability 2024, 16, 1551. [Google Scholar] [CrossRef]
  10. Liu, X.; Liang, X.; Li, X.; Xu, X.; Ou, J.; Chen, Y.; Li, S.; Wang, S.; Pei, F. A Future Land Use Simulation Model (FLUS) for Simulating Multiple Land Use Scenarios by Coupling Human and Natural Effects. Landsc. Urban Plan. 2017, 168, 94–116. [Google Scholar] [CrossRef]
  11. Fu, X.; Wang, X.; Yang, Y.J. Deriving Suitability Factors for CA-Markov Land Use Simulation Model Based on Local Historical Data. J. Environ. Manag. 2018, 206, 10–19. [Google Scholar] [CrossRef]
  12. Liu, R.; Zhang, K.; Zhang, Z.; Borthwick, A. Land-Use Suitability Analysis for Urban Development in Beijing. J. Environ. Manag. 2014, 145, 170–179. [Google Scholar] [CrossRef]
  13. Mouratidis, K. Compact City, Urban Sprawl, and Subjective Well-Being. Cities 2019, 92, 261–272. [Google Scholar] [CrossRef]
  14. Li, Q.; Wang, L.; Gul, H.N.; Li, D. Simulation and Optimization of Land Use Pattern to Embed Ecological Suitability in an Oasis Region: A Case Study of Ganzhou District, Gansu Province, China. J. Environ. Manag. 2021, 287, 112321. [Google Scholar] [CrossRef] [PubMed]
  15. Zhu, Y.; Zhou, M. Optimization of Land Use Structure Integrating Ecosystem Service Function and Economic Development—A Case Study in Dongting Lake Ecological and Economic Zone, China. Environ. Sustain. Ind. 2025, 26, 100604. [Google Scholar] [CrossRef]
  16. Yang, D.; Zhang, P.; Zhang, J.; Liu, Y.; Liu, Z.; Chen, Z. Land Use Assessment under Dynamic Evolution: Multi-Objective Optimization and Multi-Scenario Simulation Analysis. J. Environ. Manag. 2025, 373, 123456. [Google Scholar] [CrossRef]
  17. Ma, S.; Wen, Z. Optimization of Land Use Structure to Balance Economic Benefits and Ecosystem Services under Uncertainties: A Case Study in Wuhan, China. J. Clean. Prod. 2021, 311, 127537. [Google Scholar] [CrossRef]
  18. Li, C.; Wu, Y.; Gao, B.; Zheng, K.; Wu, Y.; Li, C. Multi-Scenario Simulation of Ecosystem Service Value for Optimization of Land Use in the Sichuan-Yunnan Ecological Barrier, China. Ecol. Ind. 2021, 132, 108328. [Google Scholar] [CrossRef]
  19. Song, M.; An, M.; He, W.; Wu, Y. Research on Land Use Optimization Based on PSO-GA Model with the Goals of Increasing Economic Benefits and Ecosystem Services Value. Sustain. Cities Soc. 2025, 119, 106072. [Google Scholar] [CrossRef]
  20. Costanza, R.; de Groot, R.; Sutton, P.; Van der Ploeg, S.; Anderson, S.J.; Kubiszewski, I.; Farber, S.; Turner, R.K. Changes in the Global Value of Ecosystem Services. Glob. Environ. Change 2014, 26, 152–158. [Google Scholar] [CrossRef]
  21. Hasan, S.S.; Zhen, L.; Miah, M.G.; Ahamed, T.; Samie, A. Impact of Land Use Change on Ecosystem Services: A Review. Environ. Dev. 2020, 34, 100527. [Google Scholar] [CrossRef]
  22. Guo, P.; Zhang, F.; Wang, H. The Response of Ecosystem Service Value to Land Use Change in the Middle and Lower Yellow River: A Case Study of the Henan Section. Ecol. Ind. 2022, 140, 109019. [Google Scholar] [CrossRef]
  23. He, Y.; Wang, W.; Chen, Y.; Yan, H. Assessing Spatio-Temporal Patterns and Driving Force of Ecosystem Service Value in the Main Urban Area of Guangzhou. Sci. Rep. 2021, 11, 3027. [Google Scholar] [CrossRef]
  24. Xie, G.; Zhang, C.; Zhen, L.; Zhang, L. Dynamic Changes in the Value of China’s Ecosystem Services. Ecosyst. Serv. 2017, 26, 146–154. [Google Scholar] [CrossRef]
  25. Talukdar, S.; Singha, P.; Shahfahad; Mahato, S.; Praveen, B.; Rahman, A. Dynamics of Ecosystem Services (ESs) in Response to Land Use Land Cover (LU/LC) Changes in the Lower Gangetic Plain of India. Ecol. Ind. 2020, 112, 106121. [Google Scholar] [CrossRef]
  26. Kang, N.; Hou, L.; Huang, J.; Liu, H. Ecosystem Services Valuation in China: A Meta-Analysis. Sci. Total Environ. 2022, 809, 151122. [Google Scholar] [CrossRef] [PubMed]
  27. Yao, J.; Zhao, Y.; Chen, Y.; Yu, X.; Zhang, R. Multi-Scale Assessments of Droughts: A Case Study in Xinjiang, China. Sci. Total Environ. 2018, 630, 444–452. [Google Scholar] [CrossRef]
  28. Xie, L.; Wang, H.; Liu, S. The Ecosystem Service Values Simulation and Driving Force Analysis Based on Land Use/Land Cover: A Case Study in Inland Rivers in Arid Areas of the Aksu River Basin, China. Ecol. Ind. 2022, 138, 108828. [Google Scholar] [CrossRef]
  29. Liu, Y.; Tao, H.; Zhu, J.; Mondal, S.K.; Bakhtiyorov, Z. Assessment of Ecological Vulnerability in Xinjiang Uygur Autonomous Region, China. Res. Cold Arid Reg. 2025, in press. [Google Scholar] [CrossRef]
  30. Wu, G.; Wang, H.; Wu, Q. Wind Power Development in the Belt and Road Area of Xinjiang, China: Problems and Solutions. Util. Policy 2020, 64, 101024. [Google Scholar] [CrossRef]
  31. Li, X.; Dong, W.; Liu, Y.; Yang, Y. Tracking the Urban Expansion and its Driving Mechanisms Behind Xinjiang Production and Construction Corps (XPCC): Evidence from Morphology and Landscapes. Habitat Int. 2022, 126, 102599. [Google Scholar] [CrossRef]
  32. Li, X.; Wu, C. Sensitivity Assessment and Simulation of Ecosystem Services in Response to Land Use Change in Arid Regions: Empirical Evidence from Xinjiang, China. Ecol. Ind. 2025, 171, 113150. [Google Scholar] [CrossRef]
  33. Deb, K.; Pratap, A.; Agarwal, S.; Meyarivan, T. A Fast and Elitist Multiobjective Genetic Algorithm: NSGA-II. IEEE Trans. Evolut. Comput. 2002, 6, 182–197. [Google Scholar] [CrossRef]
  34. Luan, C.; Liu, R.; Zhang, Q.; Sun, J.; Liu, J. Multi-Objective Land Use Optimization Based on Integrated NSGA-II-PLUS Model: Comprehensive Consideration of Economic Development and Ecosystem Services Value Enhancement. J. Clean. Prod. 2024, 434, 140306. [Google Scholar] [CrossRef]
  35. Shi, M.; Wu, H.; Jiang, P.; Zheng, K.; Liu, Z.; Dong, T.; He, P.; Fan, X. Food-Water-Land-Ecosystem Nexus in Typical Chinese Dryland under Different Future Scenarios. Sci. Total Environ. 2023, 880, 163183. [Google Scholar] [CrossRef] [PubMed]
  36. Wei, R.; Fan, Y.; Wu, H.; Zheng, K.; Fan, J.; Liu, Z.; Xuan, J.; Zhou, J. The Value of Ecosystem Services in Arid and Semi-Arid Regions: A Multi-Scenario Analysis of Land Use Simulation in the Kashgar Region of Xinjiang. Ecol. Model. 2024, 488, 110579. [Google Scholar] [CrossRef]
  37. Liang, X.; Liu, X.; Li, X.; Chen, Y.; Tian, H.; Yao, Y. Delineating Multi-Scenario Urban Growth Boundaries with a CA-Based FLUS Model and Morphological Method. Landsc. Urban Plan. 2018, 177, 47–63. [Google Scholar] [CrossRef]
  38. Wang, Y.; Zhang, L. The Impact of Technology Innovation on Urban Land Intensive Use in China: Evidence from 284 Cities in China. Sustainability 2023, 15, 3801. [Google Scholar] [CrossRef]
  39. Naorem, A.; Jayaraman, S.; Dang, Y.P.; Dalal, R.C.; Sinha, N.K.; Rao, C.S.; Patra, A.K. Soil Constraints in an Arid Environment—Challenges, Prospects, and Implications. Agronomy 2023, 13, 220. [Google Scholar] [CrossRef]
  40. Wang, Y.; Long, A.; Xiang, L.; Deng, X.; Zhang, P.; Hai, Y.; Wang, J.; Li, Y. The Verification of Jevons’ Paradox of Agricultural Water Conservation in Tianshan District of China Based on Water Footprint. Agric. Water Manag. 2020, 239, 106163. [Google Scholar] [CrossRef]
Figure 1. The framework of the integrated NSGA-II-FLUS model.
Land 14 00920 g001
Figure 2. Map of the study area.
Land 14 00920 g002
Figure 3. Area changes and internal structures of different land use types from 1980 to 2020.
Land 14 00920 g003
Figure 4. Chord diagram of land use transition from 1980 to 2020.
Land 14 00920 g004
Figure 5. Spatial simulation results for different development scenarios (Region 1: Urumqi; Region 2: the southern Tianshan Mountains; Region 3: the southern high-altitude area).
Land 14 00920 g005
Figure 6. Enlarged view of three typical regions.
Land 14 00920 g006
Figure 7. The ESV of (a) different ecosystem service functions and (b) different land use types. (FP: food production; RMP: raw material production; WS: water supply; GR: gas regulation; CR: climate regulation; WT: waste treatment; HR: hydrological regulation; SC: soil conservation; NCM: nutrient cycle maintenance; BM: biodiversity maintenance; AL: aesthetic landscape).
Land 14 00920 g007
Table 1. Data descriptions and sources.
Primary CategorySecondary CategorySpatial ResolutionData Sources
Basic geographic dataAdministrative boundary
Land use/land cover
30 × 30 mResource and Environment Science and Data Center (https://www.resdc.cn/ (accessed on 1 January 2024))
Natural environment dataNet primary productivity
Soil conservation capacity
1000 × 1000 mNational Earth System Science Data Center (https://www.geodata.cn/main/ (accessed on 1 January 2024))
Precipitation1000 × 1000 mNational Meteorological Information Center (https://data.cma.cn/ (accessed on 1 January 2024))
Elevation
Slope
Aspect
Distance data
1000 × 1000 mNational Catalogue Service for Geographic Information (https://www.webmap.cn/main.do?method=index (accessed on 1 January 2024))
Socio-economic dataGDP
Population
Per capita food consumption expenditure
Planting areas and prices of three main grains, etc.
National Statistical Yearbook (accessed on 1 January 2024)
Compilation of National Agricultural Product Cost/Benefit Data (accessed on 1 January 2024)
Table 2. ESV equivalent coefficient table for Xinjiang (unit: USD/km2).
Primary CategorySecondary CategoryCultivated LandForest LandGrasslandWater BodyUnused Land
Provision servicesFood production36311172955144010
Raw material production17052679141165513
Water supply2885785324474,505198
Regulation servicesGas regulation2862883649412748130
Climate regulation153826,44813,066678376
Waste treatment4277665431710,388517
Hydrological regulation486566,74539,874716,4152375
Support servicesSoil conservation12,66531,05617,3688213405
Nutrient cycle maintenance5138224682185
Biodiversity maintenance555979454808877235
Cultural servicesAesthetic landscape221637,16120,91251,9581120
Table 3. Constraint conditions for the multi-objective optimization.
ItemsConstraint EquationsNotes
Total land area x 1 + x 2 + x 3 + x 4 + x 5 + x 6 = 1,630,177.82 The total land use area should be equal to the area of Xinjiang
Cultivated land x 1 ( 2020 ) < x 1 < 1.1 x 1 ( 2020 ) Cultivated land area in 2030 should exceed that in 2020 to comply with China’s cultivated land protection policy
Forest land 0.9 x 2 ( 2020 ) < x 2 < 1.1 x 2 ( 2020 ) The change rate of forest land should be within ± 10% according to historical trend
Grassland 0.9 x 3 ( 2020 ) < x 3 < 1.1 x 3 ( 2020 ) The change rate of grassland should be within ± 10% according to historical trend
Water body 0.9 x 4 ( 2020 ) < x 4 < 1.1 x 4 ( 2020 ) The change rate of water bodies should be within ± 10% according to historical trend
Construction land x 5 ( 2020 ) < x 5 < 1.5 x 5 ( 2020 ) Construction land area in 2030 should exceed that in 2020 to accommodate urban expansion and population growth
Unused land 0.9 x 6 ( 2020 ) < x 6 < 1 x 6 ( 2020 ) Unused land area in 2030 should not exceed that in 2020
Table 4. Land use transition statistics from 1980 to 2020 (unit: ×102 km2).
TypesUnchanged AreaTransfer-In AreaTransfer-Out Area
AreaChange RateRatioAreaChange RateRatio
Cultivated land547.14351.4439.11%43.32%63.3810.38%7.81%
Forest249.3625.529.28%3.15%42.5714.58%5.25%
Grassland4604.56213.164.42%26.28%421.938.39%52.01%
Water298.3147.2313.67%5.82%37.0311.04%4.56%
Construction35.1055.2061.13%6.81%6.7716.18%0.84%
Unused9756.14118.631.20%14.62%239.492.40%29.52%
Total15,490.60811.184.98%100.0%811.184.98%100.0%
Table 5. The optimization results of land use structure, economic benefits, and ecological benefits under different development scenarios (unit: km2 and ×109 USD).
2020ND-2030EP-2030ED-2030SD-2030
Cultivated land89,85798,964
(+10.13%)
92,953
(+3.45%)
95,629
(+6.42%)
92,564
(+3.01%)
Forest27,48827,158
(−1.2%)
26,983
(−1.84%)
29,655
(+7.88%)
28,311
(+2.99%)
Grassland481,771474,390
(−1.53%)
493,479
(+2.43%)
492,109
(+2.15%)
490,330
(+1.78%)
Water34,55434,869
(+0.91%)
38,009
(+10.0%)
36,398
(+5.34%)
37,813
(+9.43%)
Construction902911,689
(+29.46%)
10,839
(+20.05%)
13,544
(+50.00%)
12,335
(+36.62%)
Unused987,476983,101
(−0.44%)
967,914
(−1.98%)
962,843
(−2.49%)
968,824
(−1.89%)
Economic64.0377.99
(+21.8%)
73.11
(+14.18%)
86.14
(+34.52%)
79.94
(+24.84%)
ESV97.7397.62
(−0.11%)
101.99
(+4.36%)
101.00
(+3.35%)
101.72
(+4.08%)
Disclaimer/Publisher’s Note: The statements, opinions and data contained in all publications are solely those of the individual author(s) and contributor(s) and not of MDPI and/or the editor(s). MDPI and/or the editor(s) disclaim responsibility for any injury to people or property resulting from any ideas, methods, instructions or products referred to in the content.

