Article

Numerical Research on Energy Evolution in Granite under Different Confining Pressures Using Otsu’s Digital Image Processing and PFC2D

1
College of Mining and Safety Engineering, Shandong University of Science and Technology, Qingdao 266590, China
2
State Key Laboratory of Mining Disaster Prevention and Control Co-founded by Shandong Province and the Ministry of Science and Technology, Shandong University of Science and Technology, Qingdao266590, China
*
Author to whom correspondence should be addressed.
Symmetry 2019, 11(2), 131; https://doi.org/10.3390/sym11020131
Submission received: 5 January 2019 / Revised: 18 January 2019 / Accepted: 19 January 2019 / Published: 23 January 2019

Abstract

:
Research on energy accumulation and releasing in the rock plays a key role on revealing its failure mechanism. This paper establishes a microscopic structure model of granite using Otsu digital image processing (DIP) technology and particle flow code software (PFC2D). A series of numerical compression tests under different confining pressures were conducted to investigate the macro and micro characteristics of energy evolution in granite. The results showed that the energy evolution of granite is divided into three stages: stable accumulation, slow dissipation, and rapid release. With increasing confining pressure, the strain energy accumulation ratio decreased exponentially and the peak value of strain energy increased linearly. It was found that the energy accumulation speed in the pre-peak stage increased as a linear function, while the energy release speed in the post-peak stage decreased as an exponential function. In addition, the feldspar is the main microstructure which played a major part in accumulating energy in granite. However, the unit mineral energy of mica particles was bigger than that of feldspar and quartz. When subjected to increasing confining pressure, the feldspar’s total energy growth rate was fastest. Meanwhile, the mica’s unit energy growth rate was fastest.

1. Introduction

Understanding the energy evolution in rock is critical for rock engineering design and assessment and has been one of the key problems facing modern researchers [1,2,3,4,5]. The energy evolution in rock is determined by—and is therefore an indicator of—the deformation and failure of the rock [6,7,8,9]. In recent years, many scholars have researched the energy accumulation, dissipation, and release in the rock by way of theoretical analysis and laboratory tests. Li et al. [10] researched the energy dissipation and release in rocks during triaxial compression with different loading and unloading paths. Yang et al. [11] studied the blasting response of a jointed rock mass and found that the theoretical criterion based on the minimum strain energy density factor predicted the crack initiation behavior well. Zhang et al. [12] developed a novel analytical solution to calculate the amount of released energy in coal and studied the influence of the coal’s joint on energy release. Ning et al. [13] introduced a new energy dissipation method to identify crack initiation, and found that the variation in the pre-peak dissipation ratio was consistent with coal damage. Chen et al. [14] acquired similar results on shale samples.
The abovementioned studies mainly focus on the macro characteristics of energy evolution in rocks [15,16]. However, a rock is an aggregate of one or more minerals. The different minerals in a rock have significantly different mechanical properties. The complex microstructures thus play an important role in the macroscopic energy evolution and failure of rock. Therefore, it is significant to investigate the energy evolution of the microstructures in rock. The techniques used in existing studies on the micro-mechanical properties of rocks have mainly included the characterization of the heterogeneous distribution [17,18,19], computed tomography (CT) scanning techniques [20,21,22], and digital imaging processing (DIP) technology [23,24,25]. DIP usually adopts an image segmentation approach to acquire the image information of microstructures in rock, and the information is then inputted into numerical software to realize the reconstruction of the microstructures. This technique is expected to be widely applied in the research of rock mechanics due to its merits including distinct theory and great applicability to instruments [26].
In this paper, the image information of microstructures in granite was acquired using Otsu’s DIP technique. The corresponding microstructural model of granite was reconstructed using particle flow code software (PFC2D). A series of numerical compression tests were carried out under different confining pressures. The macro and micro characteristics of energy evolution in granite were then analyzed in detail. Additionally, the influence of confining pressure on energy accumulation and dissipation was explored.

2. Methodology

2.1. Acquisition and Characterization of Microstructures in Rock

Rocks are heterogeneous materials composed of a variety of different mineral particles. The same minerals have similar colors, and the difference in color between different minerals is very large. On this basis, color of the mineral surface of rocks is endowed with a corresponding value, and a digital image of the rock comprises pixels with different color values. The color value of each pixel is associated with mineral components. Figure 1 illustrates the change in gray values of the pixels along the measured line on the surface of granite specimen.
The gray value was set in the range of 0–255. As shown in Figure 1, the change in gray value corresponds to the mineral composition of the granite. Mica is black with the lowest gray value, feldspar is white with the highest gray value, and quartz is transparent with a medium gray value in DIP. Based on the color of the minerals, the digital image of the rock was segmented and reconstructed to get the characterization image of the microstructures in the rock.
In order to segment the minerals of rock, the gray value range of each mineral needs to be determined. It was assumed that the gray value ranges of mica, quartz, and feldspar in granite were 0–t1, t1t2, and t2–255, respectively. The parameters t1 and t2 are the segmentation thresholds of the minerals [27]. Otsu’s image segmentation method is a conventional image segmentation technique and is often considered for selecting the optimal threshold for image segmentation [28]. Otsu’s method was adopted to segment the minerals contained in the granite image. The threshold (t1, t2) which meets the maximum gray variances σ2 of all minerals is regarded as an optimal segmentation threshold. The maximum gray variance is as follows:
σ 2 ( t 1 , t 2 ) = arg   max N i ( u i u ) 2
where u is the overall gray value of the granite image, Ni is the number of pixels of the different minerals, and ui is the average gray value of the different minerals.
Using Otsu’s method, the processed image of the minerals in granite was obtained as shown in Figure 1. The distribution and shapes of minerals in the processed image were well consistent with those in the real image of the granite, and the content of feldspar, quartz and mica in this granite are 66%, 26.1% and 7.9%, respectively.

2.2. Microstructural Model Reconstruction Using PFC2D

After obtaining the processed image of microstructures in the granite, a corresponding microstructural model could be established by importing the image information into numerical simulation software. In this paper, using particle flow code software (PFC2D), the microstructural model of granite was reconstructed according to the following steps:
(1)
Exporting the coordinates and gray values of the pixels. The pixel size of an image is always different from the actual size. Before exporting, there should be a scale conversion. It is supposed that the image’s actual size is a × b, and the pixel number is M × N. Each pixel’s length l and coordinate (xi, yj) can be calculated by Equation (2):
l = s; xi = s × i; yj = s × j
where s is the scale factor and equals a/M or b/N, accordingly.
(2)
Importing data into the PFC2D. In this paper, uniaxial compression tests were carried out and the dimension of the sample model was 50 mm × 100 mm. The diameter of the sample’s particles ranged from 0.25 to 0.75 mm, and the average value was 0.5 mm which equaled the converted pixel’s length l in the processed image (Figure 1). Then, the coordinates and gray values of the pixels were imported into the particle flow model. In the PFC2D model, particles were distributed randomly. A Fish function (a built-in programming langue in PFC2D) was written to find the pixel which was closest to the particle. The particle’s color code was set equal to the pixel’s gray value. Figure 2 shows an example of incorporating a gray image into the particle flow model.
(3)
Assigning microscopic parameters to the microstructures. Because the mechanical properties of minerals in rock are different, the respective microscopic parameters should be assigned to the different minerals. Based on the aforementioned particle color codes, the different minerals could be identified and assigned the appropriate parameters.
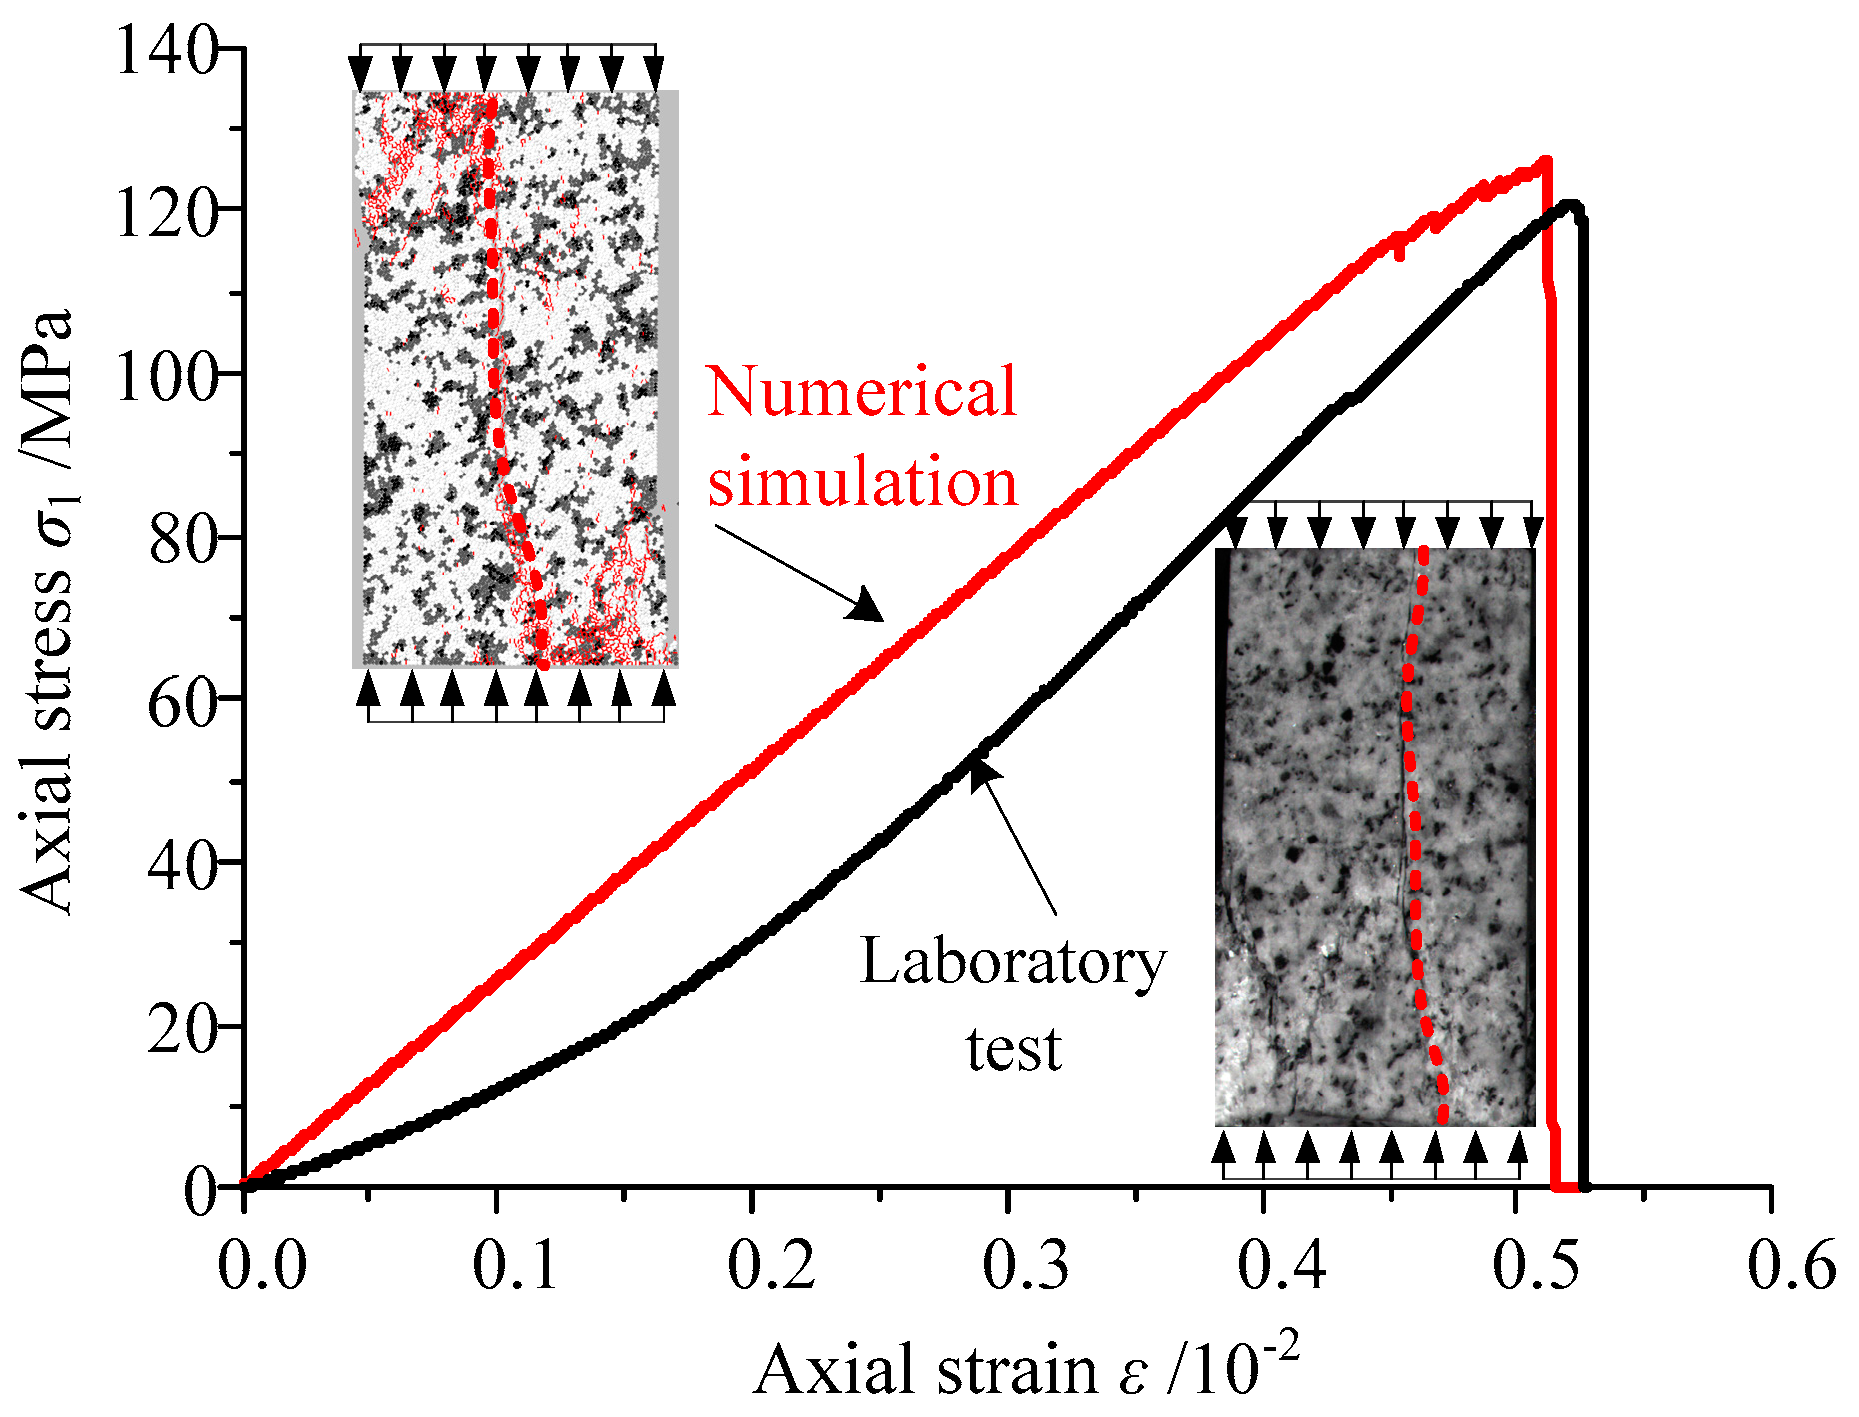
PFC2D usually utilizes a parallel bonded-particle model to simulate rocks [29,30]. The parameters, including the friction coefficient μ, contact stiffness kn and ks, parallel bonded stiffness k ¯ n and k ¯ s , parallel bonded strength σn and σs, and parallel bonded radius λ, need to be supplied as input to the PFC2D. Because these parameters cannot be obtained by laboratory tests directly, a trial-and-error method was used to calibrate the microscopic parameters [31], and the simulated results were compared with those of the laboratory test. The microscopic parameters of the granite in the simulation are displayed in Table 1. Figure 3 shows a comparison of laboratory uniaxial compression test data and results simulated using PFC2D. As shown in Figure 3, the two stress–strain curves agreed well with each other and the failure modes of granite were both split fractures, indicating that the microscopic parameters were selected properly.
After calibrating the parameters of the model, the established microstructural model of granite was used to carry out a series of compression tests under different confining pressures to further analyze the macro and micro characteristics of energy evolution in granite. In tests, the lateral and bottom loading plates were used to apply constant confining pressure on the specimens based on servo commands. The confining pressure was set to 0, 10, 20, 30, or 40 MPa. After the confining pressure reached the designated value, axial loading was applied by moving the lower loading plate until specimen failure. The loading mode was displacement control, and the loading speed was 0.01 mm/s.

2.3. The Energy Calculation Method

During the process of the deformation and failure of the granite, the work done by the external load is converted into two parts: one is the elastic strain energy accumulated in the granite, and the other is dissipation energy resulting from friction and movement between mineral grains. The energy can be written as:
Etot = Estr + Edis
where Etot is the external input energy, Estr is the strain energy, and Edis is the dissipation energy.
In the test, the external input energy was equal the work done by the loading plates’ movement on the specimen. The lateral loading plate moved in the negative direction and generated negative work which was regarded as a part of the dissipation energy. Therefore, the external input energy was only the work done by the bottom loading plate, expressed as:
E t o t = F ε Δ U ε
where Fε and ΔUε are the force and displacement increment of the bottom loading plate, respectively, when the specimen strain is ε.
In PFC2D simulation, the strain energy accumulated in the specimen includes two parts [32]. One is the contact strain energy E s t r c stored at all contacts, and the other is the parallel-bond strain energy E s t r p b stored in parallel bonds, as shown in Figure 4. The strain energy can be expressed as:
E s t r = E s t r c + E s t r p b
where
E s t r p b = 1 2 i N p b ( | F ¯ i n | 2 A i k ¯ i n + | F ¯ i s | 2 A i k ¯ i s + | M ¯ i | 2 I i k ¯ i n )   and
E s t r c = 1 2 i N c ( | F i n | 2 k i n + | F i s | 2 k i s ) .
In Equations (6) and (7), F ¯ i n , F ¯ i s , and M ¯ i s are the normal force, shear force, and the moment in the parallel bond i, respectively; F i n and F i s are the normal force and shear force in the contact i, respectively; Ai and Ii are the area and inertia moment of the bond cross section, respectively; Nc is the number of contacts; and Npb is the number of parallel bonds.
In order to clearly and reasonably describe the process of energy accumulation and release, the following parameters need to be defined as follows:
β energy accumulation ratio—equals the ratio of strain energy to total external input energy;
va energy accumulation speed—represents the increasing speed of strain energy in the pre-peak stage;
vr energy release speed—represents the decreasing speed of strain energy in the post-peak stage;
Es-t mineral energy—represents the total strain energy accumulated in one mineral;
Es-u unit mineral energy—represents Es-t divided by the number of mineral particles.

3. Macro Characteristics of Energy Evolution in Granite

3.1. Energy Accumulation and Release

Following the calculation method of energy in the granite model, the external input energy, strain energy, dissipation energy, and energy accumulation ratio β were recorded by compiling the FISH language in PFC2D. Figure 5 shows the energy evolution curves of granite under different confining pressures. As shown in Figure 5, the energy curves for granite could be divided into three stages: stable energy accumulation (Stage I), slow energy dissipation (Stage II), and rapid energy release (Stage III).
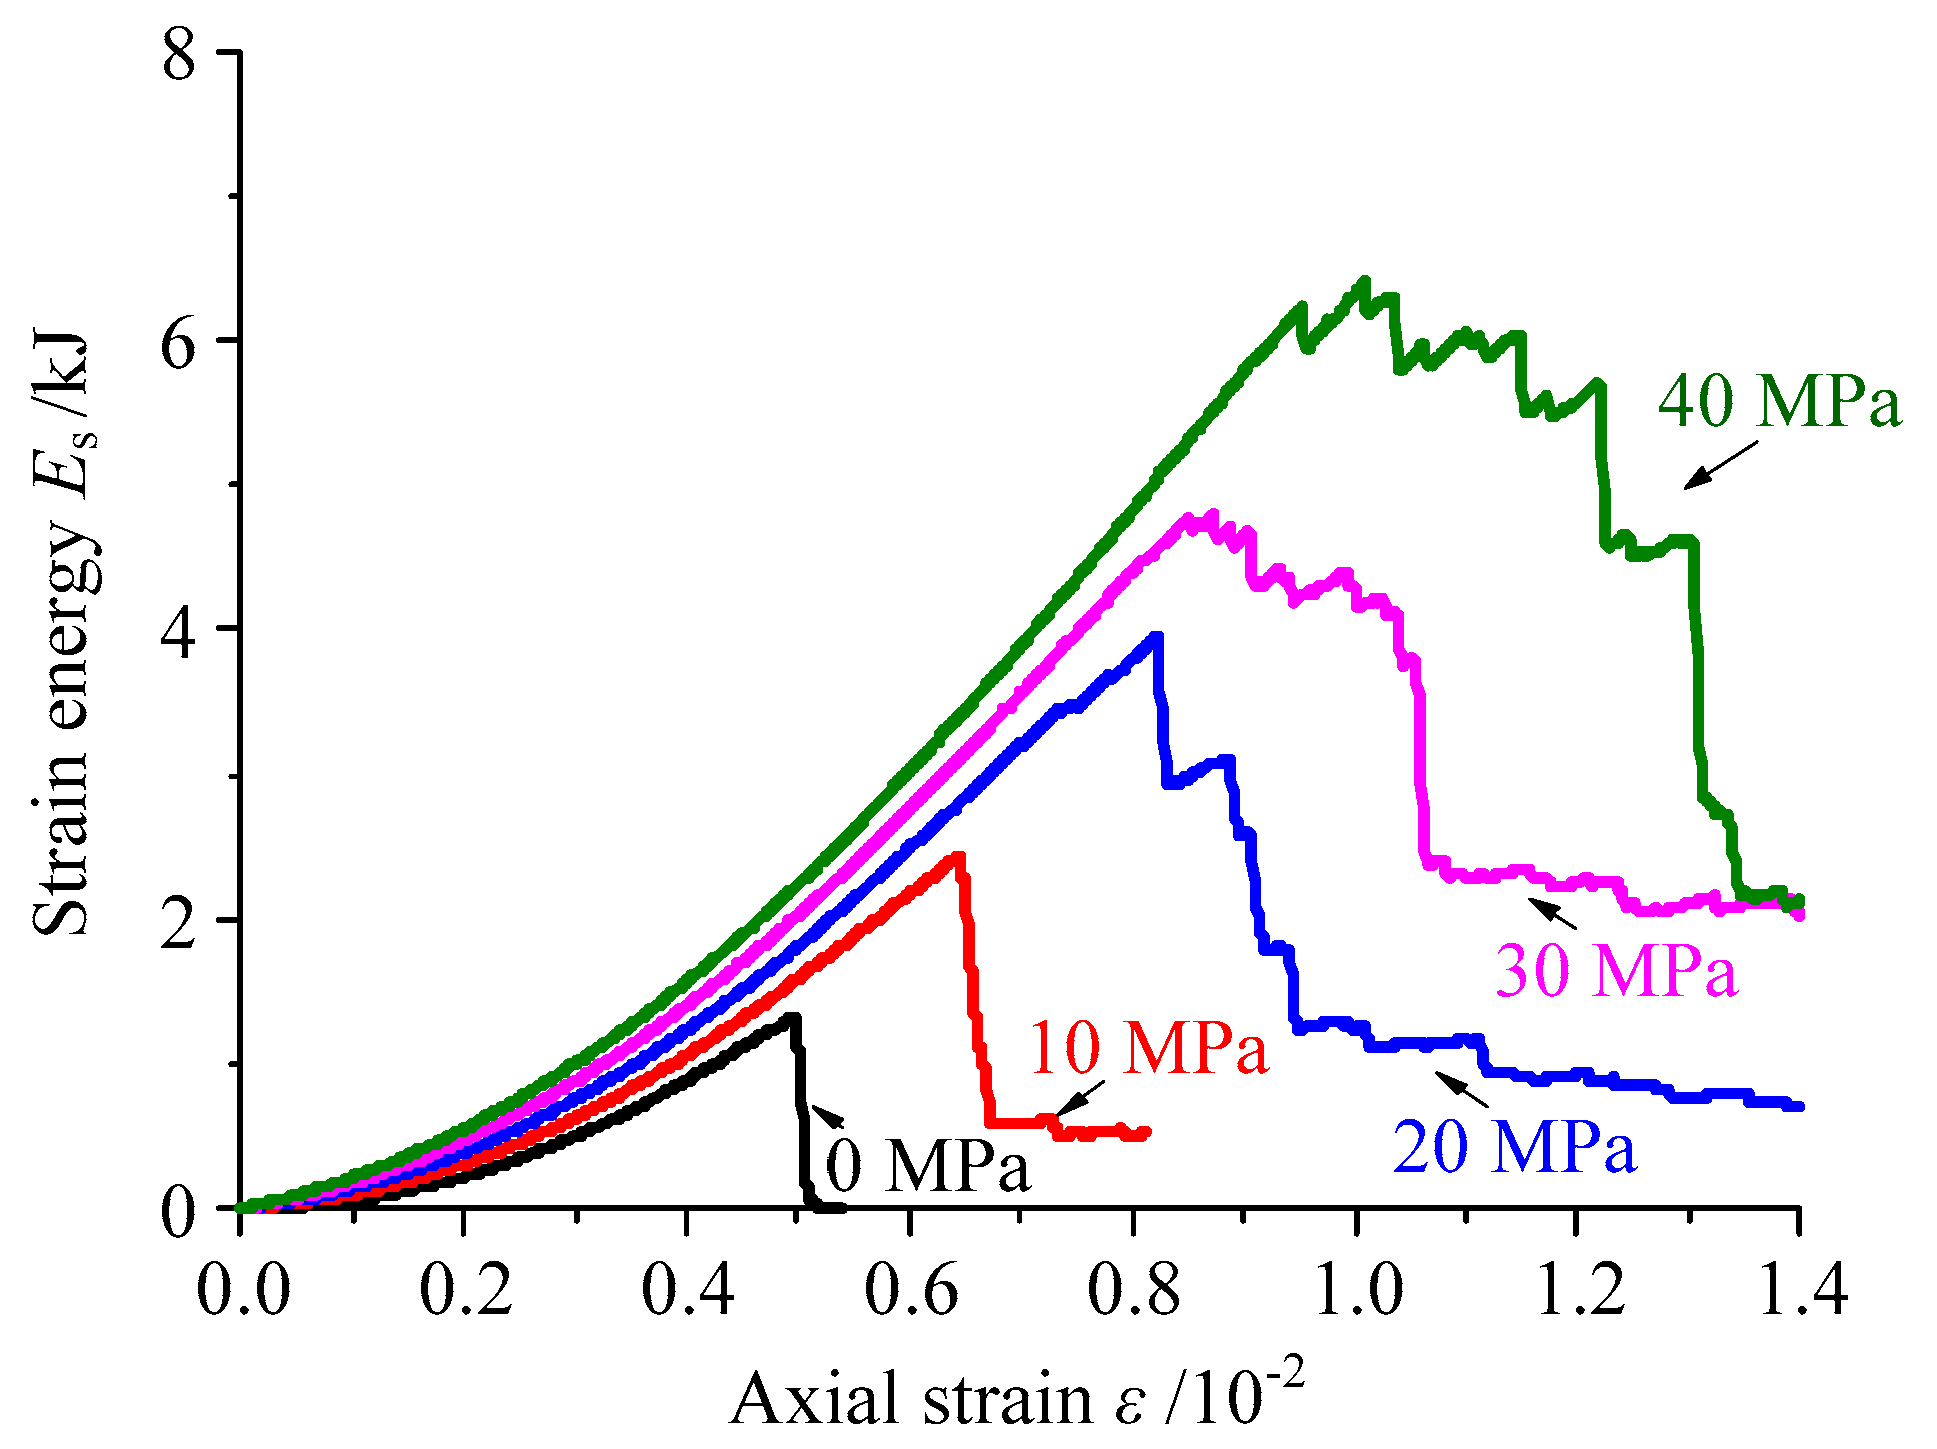
In Stage I, due to few cracks having been generated in the granite specimen, only a small amount of external input energy could be dissipated in the form of friction and dislocation movement among granite particles. Most of the external input energy was converted into strain energy stored in the specimen, and the energy accumulation ratio β reached 80% in the initial loading stage. With the continual input of external energy, the energy accumulation ratio β gradually increased and tended to be stable. In Stage II, with increasing load on the specimen, the dissipation energy increased gradually and the energy accumulation ratio β decreased distinctly. When the accumulated strain energy reaches the extreme value of energy storage, the excessive energy can accelerate the crack propagation in the specimen until it enters the rapid energy release stage. In Stage III, the accumulated strain energy was released rapidly and the energy accumulation ratio β reduced drastically as a result of many new cracks having been generated in the specimen. Finally, the specimen failed and lost its bearing capacity, but there was still a small amount of residual strain energy because of the confining pressure effect.

3.2. Effect of Confining Pressure

To accurately analyze the influence of confining pressure on the energy accumulation and release in the granite specimen, comparisons of the strain energy and accumulation ratio under different confining pressures are drawn in Figure 6 and Figure 7, respectively. With increasing confining pressure, the maximum value of the strain energy accumulation ratio β decreased gradually. Conversely, the peak value of the accumulated strain energy in the specimen increased linearly [33,34]. As demonstrated in Figure 8a, the maximum β decreased according to the exponential function β = 8.485e−0.069σ3 + 90.05, and the peak strain energy increased according to the linear function Es = 0.123σ3 + 1.318.
As shown in Figure 8b, the pre-peak energy accumulation speed in specimens increased in the form of the linear function va = 0.01σ3 + 0.314 with increasing confining pressure. In the post-peak stage, the failure status of specimens was converted from brittle failure to ductile failure with increasing confining pressure. The process of strain energy accumulation and release in the specimen occurred repeatedly under the higher confining pressure, resulting in a significant increase of residual energy (Figure 6). Consequently, the energy release speed in the post-peak stage decreased gradually with increasing confining pressure according to the exponential function vr = 73.2e−0.05σ3.

4. Energy Characteristics of Microstructures in Granite

4.1. Energy Distribution of Microscopic Minerals

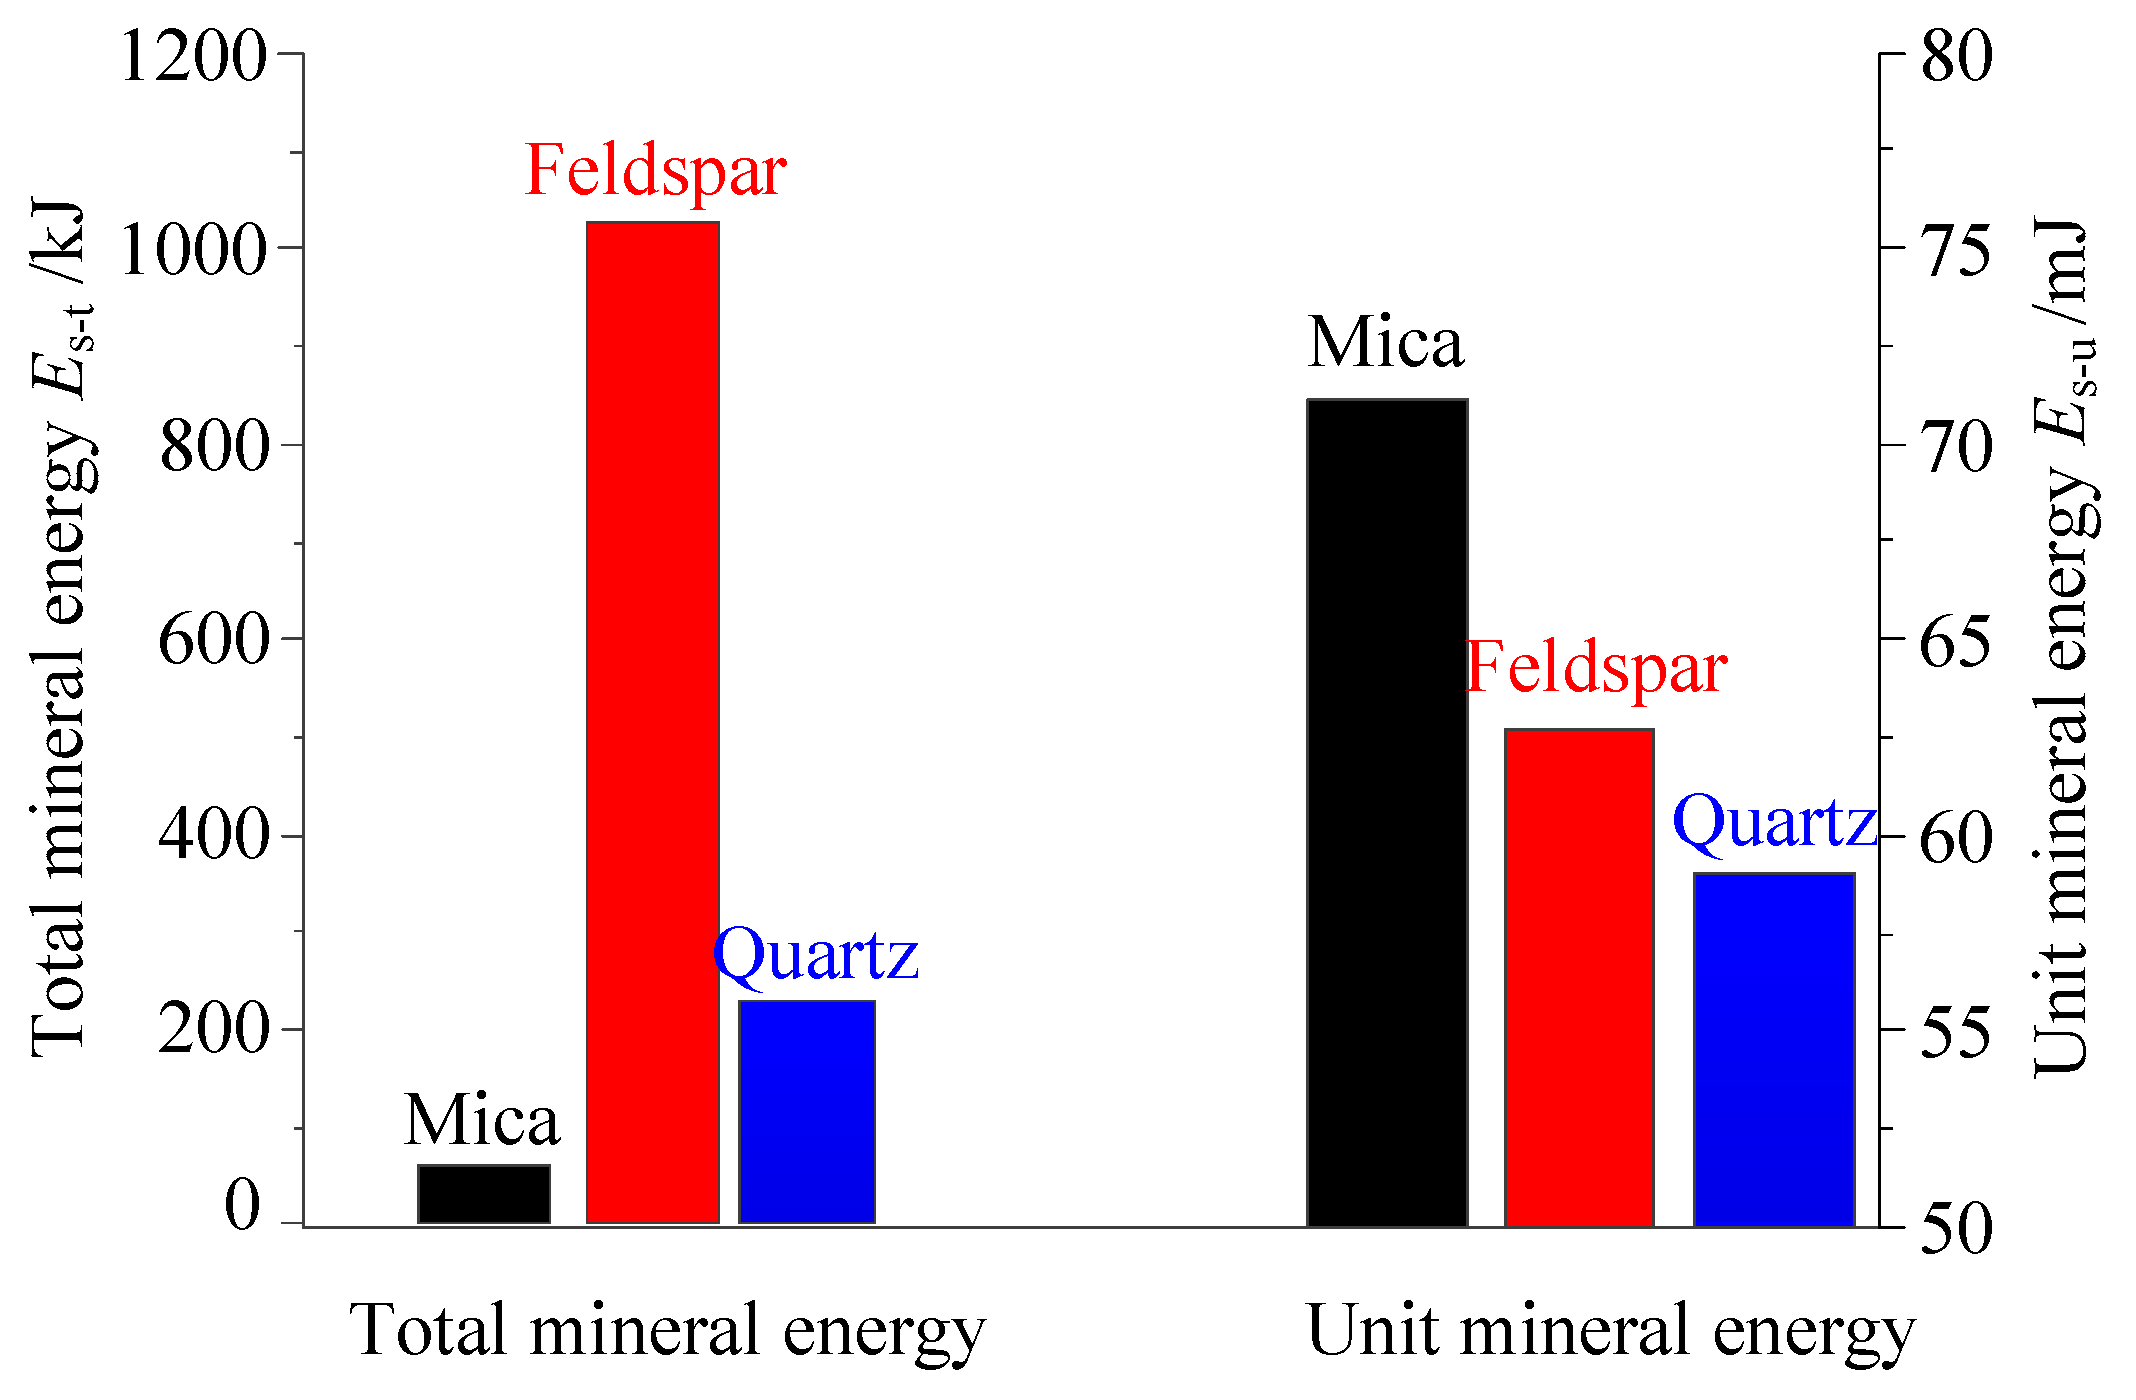
Due to the differences in the mechanical properties of the minerals in granite, the energy accumulated by different minerals is significantly different. Figure 9 shows a comparison of the total mineral energy and unit mineral energy of mica, feldspar, and quartz under uniaxial loading. In terms of the magnitude of accumulated strain energy in the minerals of granite, the greatest total energy was accumulated in feldspar, followed by quartz and mica. When the granite was subjected to loading, feldspar played a major part in energy accumulation, and the accumulated strain energy in feldspar accounted for approximately 78.5% of the total strain energy. In contrast, the energies accumulated in mica and quartz were less, only accounting for 16.6% and 4.9% of the total strain energy, respectively. Therefore, feldspar was the main microstructure for energy accumulation in the granite.
The unit mineral energy can be used to reflect the energy accumulation capacity of a particular mineral in rock. As shown in Figure 9, the unit mineral energy of mica was the largest, followed by that of feldspar, and that of quartz was the smallest. It can be seen from Equations (5)–(7) that the strain energy of the particles in the model is inversely proportional to the stiffness. Among the three minerals, the stiffness of mica was the smallest, and that of quartz was largest. In addition, mica particles did not easily cause failure because of the quartz and feldspar particles with higher strength around them. The mica particles generated a larger elastic (recoverable) deformation. Therefore, the unit mineral energy of mica particles was greater than those of both feldspar and quartz.
It should be noted that the results obtained in this section were based on the assumptions of mineral parameters. Though there were deviations between the numerical model and the actual granite at parameters of minerals, the strength and stiffness relationship among the three minerals were in accordance with the actual rock. Therefore, the results had some reference value on energy evolution research of microstructures in rocks.
Figure 10 shows the relationship between the strain energy of microscopic minerals and the confining pressure. With increasing confining pressure, the total energy of the three types of minerals in granite increased linearly at different rates. The growth rate of total energy in feldspar was the fastest, followed by that of quartz, and that of mica was the slowest. Unlike the total mineral energy, the growth rate of the unit energy of mica was the fastest, followed by that of feldspar, and that of quartz was the slowest.

4.2. Discussion

In this study, energy accumulation and dissipation in granite under different confining pressures were numerically investigated using a microstructure PFC2D model based on DIP. The evolution of input energy, strain energy and dissipation energy obtained by the simulation corresponded with those observed in laboratory tests [13,33], which indicated that the reconstruction and energy analysis methods of the actual microstructural model of rock are reasonable and effective. Due to the difficult operation on cyclic loading and unloading in the post-peak failure stage of rocks, energy evolution in post-peak stage is hard to get by laboratory tests, while the simulation in this paper can get the whole evolution process. Simulation results are supplement and promotion to laboratory test results.
Furtherly, the energy accumulation of different minerals in the granite was researched, and the main microstructures for energy accumulation were found. However, the results cannot be compared with laboratory tests because there is no effective test method to analyze the energy in minerals. The microstructure model in this paper shows great superiority in analyzing the micro-mechanism of energy evolution in rocks.
Although there are many great advantages in actual microstructure reconstruction using the method presented in this paper, there are still some difficulties in the assignment of the micro parameters of different minerals. In the typical homogeneous or heterogeneous model, the set of micro parameters of rock is easily adjusted to provide a good fit to laboratory test data. However, in the actual microstructure model, there are four sets of parameters for different structures which need to be calibrated, which presents a great difficulty [31]. Therefore, how to determine suitable micro parameters is a key problem in the application of this microstructure model based on DIP.

5. Conclusions

This study proposed a method to reconstruct the microstructural model of granite using Otsu’s digital image processing technology and PFC2D. A series of compression tests were carried out to investigate the macro and micro characteristics of energy evolution of the granite specimens. The macro-characteristics of energy evolution in other types of granites or other rocks show the similar law. However, the quantificational function relationship of energy in other rocks will be researched in the future work. And the laboratory test methods on measuring energy in minerals need to be further developed. The following conclusions have been drawn from this study.
(1)
The macro characteristics of energy evolution in granite can be divided into three stages: stable energy accumulation (Stage I), slow energy dissipation (Stage II), and rapid energy release (Stage III).
(2)
With increasing confining pressure, the strain energy accumulation ratio decreased exponentially and the peak values of accumulated strain energy increased linearly. The energy accumulation speed increased in the form of a linear function in the pre-peak stage. In addition, the energy release speed decreased in the form of an exponential function in the post-peak stage.
(3)
The feldspar was the main microstructure which played a major part in accumulating energy in granite. However, the unit mineral energy of mica particles was bigger than those of feldspar and quartz. Subjected to the influence of confining pressure, the growth rate of the total energy in feldspar was the fastest. However, the growth rate of the unit mineral energy of mica was the fastest.

Author Contributions

Writing—original draft preparation, Y.Z. and Y.Y; methodology, T.Z. and Y.T; formal analysis, Y.Z. and Y.Y; software, Y.Y and Y.Q.; writing—review and editing, Y.Z and T.Z.; funding acquisition, Y.T. and Y.Q.

Funding

This research was funded by National Key R&D Program of China (2018YFC0604703), National Natural Science Foundation of China (51604165, 51809160), Tai’shan Scholar Engineering Construction Fund of Shandong Province of China (ts201511026), and Shandong Provincial Natural Science Foundation (ZR201702160366).

Conflicts of Interest

The authors declare no conflict of interest.

References

  1. Peng, R.D.; Ju, Y.; Wang, J.G.; Xie, H.P.; Gao, F.; Mao, L.T. Energy dissipation and release during coal failure under conventional triaxial compression. Rock Mech. Rock Eng. 2015, 48, 509–526. [Google Scholar] [CrossRef]
  2. Zhao, G.Y.; Dai, B.; Dong, L.J.; Yang, C. Energy conversion of rocks in process of unloading confining pressure under different unloading paths. Trans. Nonferr. Met. Soc. 2015, 25, 1626–1632. [Google Scholar] [CrossRef]
  3. Li, X.B.; Li, C.J.; Cao, W.Z.; Tao, M. Dynamic stress concentration and energy evolution of deep-buried tunnels under blasting loads. Int. J. Rock Mech. Min. Sci. 2018, 104, 131–146. [Google Scholar] [CrossRef]
  4. Su, G.S.; Hu, L.H.; Feng, X.T.; Yan, L.B.; Zhang, G.L.; Yan, S.Z.; Zhao, B.; Yan, Z.F. True triaxial experimental study of rockbursts induced by ramp and cyclic dynamic disturbances. Rock Mech. Rock Eng. 2018, 51, 1027–1045. [Google Scholar] [CrossRef]
  5. Tan, Y.L.; Yu, F.H.; Ning, J.G.; Zhao, T.B. Design and construction of entry retaining wall along a gob side under hard roof stratum. Int. J. Rock Mech. Min. Sci. 2015, 77, 115–121. [Google Scholar] [CrossRef]
  6. Munoz, H.; Taheri, A.; Chanda, E. Fracture energy-based brittleness index development and brittleness quantification by pre-peak strength parameters in rock uniaxial compression. Rock Mech. Rock Eng. 2016, 49, 1–20. [Google Scholar] [CrossRef]
  7. Munoz, H.; Taheri, A.; Chanda, E. Rock Drilling Performance Evaluation by an Energy Dissipation Based Rock Brittleness Index. Rock Mech. Rock Eng. 2016, 49, 3343–3355. [Google Scholar] [CrossRef]
  8. Weng, L.; Huang, L.; Taheri, A.; Li, X. Rockburst characteristics and numerical simulation based on a strain energy density index: A case study of a roadway in Linglong gold mine, China. Tunn. Undergr. Space Tech. 2017, 69, 223–232. [Google Scholar] [CrossRef]
  9. Zhao, T.B.; Guo, W.Y.; Tan, Y.L.; Lu, C.P.; Wang, C.W. Case histories of rock bursts under complicated geological conditions. Bull. Eng. Geol. Environ. 2018, 77, 1529–1545. [Google Scholar] [CrossRef]
  10. Li, D.Y.; Sun, Z.; Xie, T.; Li, X.B.; Ranjith, P.G. Energy evolution characteristics of hard rock during triaxial failure with different loading and unloading paths. Eng. Geol. 2017, 228, 270–281. [Google Scholar] [CrossRef]
  11. Yang, R.S.; Ding, C.X.; Yang, L.Y.; Chen, C. Model experiment on dynamic behavior of jointed rock mass under blasting at high-stress conditions. Tunn. Undergr. Space Tech. 2018, 74, 145–152. [Google Scholar] [CrossRef]
  12. Zhang, C.G.; Tahmasebinia, F.; Canbulat, I.; Vardar, O.; Saydam, S. Analytical Determination of Energy Release in a Coal Mass. Energies 2018, 11, 285. [Google Scholar] [CrossRef]
  13. Ning, J.G.; Wang, J.; Jiang, J.Q.; Hu, S.C.; Jiang, L.S.; Liu, X.S. Estimation of crack initiation and propagation threshold of confined brittle coal specimens based on energy dissipation theory. Rock Mech. Rock Eng. 2018, 51, 119–134. [Google Scholar] [CrossRef]
  14. Chen, C.; Li, X. Cyclic experimental studies on damage evolution behaviors of shale dependent on structural orientations and confining pressures. Energies 2018, 11, 160. [Google Scholar] [CrossRef]
  15. Liu, X.S.; Tan, Y.L.; Ning, J.G.; Lu, Y.W.; Gu, Q.H. Mechanical properties and damage constitutive model of coal in coal-rock combined body. Int. J. Rock Mech. Min. Sci. 2018, 110, 140–150. [Google Scholar] [CrossRef]
  16. Guo, W.Y.; Tan, Y.L.; Yu, F.H.; Zhao, T.B.; Hu, S.C.; Huang, D.M.; Qin, Z. Mechanical behavior of rock-coal-rock specimens with different coal thickness. Geomech. Eng. 2018, 15, 1017–1027. [Google Scholar] [CrossRef]
  17. Wang, Q.S.; Ma, G.W.; Wang, X.J. Numerical simulation on tensile failure of rock-like heterogeneous material using a modified SPH method. Int. J. Comput. Methods 2015, 12. [Google Scholar] [CrossRef]
  18. Wang, J.C.; Wang, Z.H.; Yang, S.Q. A coupled macro- and meso-mechanical model for heterogeneous coal. Int. J. Rock Mech. Min. Sci. 2017, 94, 64–81. [Google Scholar] [CrossRef]
  19. Pan, X.H.; Xiong, Q.Q.; Wu, Z.J. New method for obtaining the homogeneity index m of Weibull distribution using peak and crack damage strains. Int. J. Geomech. 2018, 18. [Google Scholar] [CrossRef]
  20. Wang, G.; Chu, X.Y.; Yang, X.X. Numerical simulation of gas flow in artificial fracture coal by three-dimensional reconstruction based on computed tomography. J. Nat. Gas Sci. Eng. 2016, 34, 828–831. [Google Scholar] [CrossRef]
  21. Liu, X.F.; Wang, J.F.; Ge, L.; Hu, F.L.; Li, C.L.; Li, X.; Yu, J.; Xu, H.J.; Lu, S.F.; Xue, Q.Z. Pore-scale characterization of tight sandstone in Yancheng Formation Ordos Basin China using micro-CT and SEM imaging from nm- to cm-scale. Fuel 2017, 209, 254–264. [Google Scholar] [CrossRef]
  22. Munawar, M.J.; Lin, C.; Cnudde, V.; Bultreys, T.; Dong, C.M.; Zhang, X.G.; De, W.; Zahid, M.A.; Wu, Y.Q. Petrographic characterization to build an accurate rock model using micro-CT: Case study on low-permeable to tight turbidite sandstone from Eocene Shahejie Formation. Micron 2018, 109, 22–33. [Google Scholar] [CrossRef] [PubMed]
  23. Li, A.; Shao, G.J.; Du, P.R.; Ding, S.Y.; Su, J.B. Numerical studies on stratified rock failure based on digital image processing technique at mesoscale. Comput. Mater. Contin. 2015, 45, 17–38. [Google Scholar] [CrossRef]
  24. Munoz, H.; Taheri, A.; Chanda, E. Pre-peak and post-peak rock strain characteristics during uniaxial compression by 3D digital image correlation. Rock Mech. Rock Eng. 2016, 49, 2541–2554. [Google Scholar] [CrossRef]
  25. Islam, A.; Chevalier, S.; Sassi, M. Structural characterization and numerical simulations of standard and reservoir carbonate rocks using micro-tomography. Comput. Geosci. 2018, 113, 14–22. [Google Scholar] [CrossRef]
  26. Molladavoodi, H.; RahimiRezaei, Y. Heterogeneous rock simulation using DIP-micromechanics-statistical methods. Adv. Civ. Eng. 2018. [Google Scholar] [CrossRef]
  27. Chen, S.; Yue, Z.Q.; Tham, L.G. Digital image-based numerical modeling method for prediction of inhomogeneous rock failure. Int. J. Rock Mech. Min. Sci. 2004, 41, 939–957. [Google Scholar] [CrossRef]
  28. Yin, Y.C.; Zhao, T.B.; Tan, Y.L.; Yu, F.H. Reconstruction and numerical test of the mesoscopic model of rock based on Otsu digital image processing. Rock Soil Mech. 2015, 36, 2532–2540. [Google Scholar] [CrossRef]
  29. Potyondy, D.O.; Cundall, P.A. A bonded-particle model for rock. Int. J. Rock Mech. Min. Sci. 2004, 41, 1329–1364. [Google Scholar] [CrossRef]
  30. Tian, W.L.; Yang, S.Q.; Huang, Y.H. Macro and micro mechanics behavior of granite after heat treatment by cluster model in particle flow code. Acta Mech. Sin. 2018, 34, 175–186. [Google Scholar] [CrossRef]
  31. Peng, J.; Wong, L.N.Y.; Teh, C.l.; Li, Z. Modeling micro-cracking behavior of Bukit Timah granite using grain-based model. Rock Mech. Rock Eng. 2018, 51, 135–154. [Google Scholar] [CrossRef]
  32. Cundall, P.; Strack, O. Particle Flow Code in 2 Dimensions; Itasca Consulting Group, Inc.: Minneapolis, MN, USA, 1999. [Google Scholar]
  33. Zhang, Z.Z.; Gao, F. Confining pressure effect on rock energy. Chin. J. Rock Mech. Eng. 2015, 34, 1–11. (In Chinese) [Google Scholar]
  34. Wang, S.R.; Hagan, P.; Zhao, Y.H.; Chang, X.; Song, K.; Zou, Z.S. The effect of confining pressure and water content on energy evolution characteristics of sandstone under stepwise loading and unloading. Adv. Civ. Eng. 2018. [Google Scholar] [CrossRef]
Figure 1. Digital image processing (DIP) schematic diagram of granite.
Symmetry 11 00131 g001
Figure 2. An example of incorporating a gray image into the particle flow code (PFC) model.
Symmetry 11 00131 g002
Figure 3. Comparison between numerical simulation and test data.
Symmetry 11 00131 g003
Figure 4. The calculation model of strain energy in particle flow code software (PFC2D).
Symmetry 11 00131 g004
Figure 5. Energy evolution curves of granite with different confining pressures: (a) 0 MPa, (b) 10 MPa, (c) 20 MPa, (d) 30 MPa, and (e) 40 MPa.
Symmetry 11 00131 g005aSymmetry 11 00131 g005b
Figure 6. Curves of strain energy under different confining pressures.
Symmetry 11 00131 g006
Figure 7. Curves of the energy accumulation ratio under different confining pressures.
Symmetry 11 00131 g007
Figure 8. Correlation curves of (a) energy parameters at the peak stress point and (b) energy velocities with different confining pressures.
Symmetry 11 00131 g008
Figure 9. Comparison of strain energy accumulated in the different minerals of granite.
Symmetry 11 00131 g009
Figure 10. Energy curves of different minerals with increasing confining pressure: (a) total mineral energy and (b) unit mineral energy.
Symmetry 11 00131 g010aSymmetry 11 00131 g010b
Table 1. Parameters of the microstructures in the granite model.
Parametersρ/kg·m−3kn/GPaks/GPa k ¯ n /GPa k ¯ s /GPaσn/MPaσs/MPaλμ
Mica2800208401611511510.5
Feldspar27002811.25622.413013010.5
Quartz26503614.47228.817517510.5