Abstract
In this work we present a detailed study showing the importance of the Kubelka-Munk (KM) correction in the analysis of diffuse reflectivity measurements to characterize spin crossover compounds. Combined reflectance and magnetic susceptibility measurements are carried out as a function of temperature or time to highlight the conditions under which this correction becomes critical. In particular, we investigate the influence of the color contrast between the two spin states on the reflectance measurements. Interestingly, the samples’ contrast seems to play an important role on the spin-like domain structure as suggested by the symmetry of the FORC diagrams. These latest results are discussed within the framework of Classical Preisach model (CPM).
1. Introduction
Spin crossover (SCO) materials represents a special class of molecular materials with very interesting properties that could be used in a new generation of nanoelectronic devices with tunable properties [1,2,3]. These materials exhibit a spin transition between a low-spin (LS) and a high-spin (HS) state which can be induced by an external stimulus such as temperature, pressure, magnetic and electric field or by light [4,5,6]. During the spin transition, the SCO complexes undergo drastic changes of their physical properties, allowing for the design of smart devices with tunable magnetic, electrical, dielectric, optical or vibrational response. Due to the color change that usually accompanies the spin transition (e.g., from colorless at room temperature to dark purple at low temperature for some Fe(II) SCO complexes), the fraction of complexes in the high-spin state has frequently been monitored by optical measurements using diffuse reflectivity (reflectance) as many of these compounds are obtained in the form of powders. [7,8,9,10,11,12,13,14,15,16]. Reflectivity is particularly suited to the characterization of photoexcited states in the case of highly absorbing compounds, in order to have a good matching between the thickness probed and the layer that gets photo-converted. In addition, techniques based on the use of optical fibers have been shown to provide a robust and inexpensive alternative to integrating spheres for measuring diffuse reflectance [17,18] under different sample environments (temperature, pressure, solvent vapors, etc.). In the field of spin transition solids, the first reflectance studies assumed a linear dependence of the remittance with the fraction of complexes in a given spin state. However, very often the reflectance measurements did not fully reproduce the data obtained from alternative techniques, for example magnetic susceptibility data. In early literature, these differences were omitted or attributed to the fact that the reflectance data are collected from the surface of the sample while the magnetic measurements gives access to the volumetric behavior of the sample. If in some cases, for example in the analysis of the major hysteresis loop, these differences between optical and magnetic data do not change the interpretation of the physical phenomenon, it is no longer the case of the more intimate properties, such as relaxation behavior or inter-domain interactions of the spin-like domains, where the raw reflectance data can lead to wrong conclusions. In order to overcome this, we propose a correction method based on Kubelka-Munk theory for monitoring the spin-crossover properties using the diffused reflectivity [19].
2. Kubelka-Munk Model for Spin Crossover Compounds
Originally, the Kubelka-Munk model was developed to analyze materials such as paint films, papers and powders in their neat state [19]. When a material is illuminated, part of the impinging radiation penetrates the sample and part is reflected from the surface. For an inhomogeneous material, the fraction that penetrates the sample is either absorbed or scattered at a large number of points on its path and the resulting radiation that comes back out of the sample is the diffusely reflected component (see Figure 1). This component is theoretically described by the widely used Kubelka-Munk (KM) theory. In this theory, one considers two light beams propagating in opposite directions inside a coating of thickness X on a substrate, semi-infinite in order to neglect the boundaries’ influence.
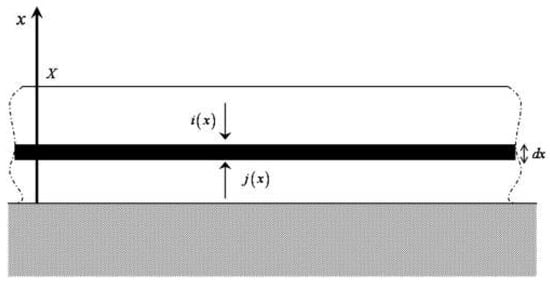
Figure 1.
A diffusing medium of thickness X and reflectance R on a sample holder. At a distance x from the bottom surface of the sample, there is a thin lamina of thickness dx and the incident light that is scattered is traveling through it both upwards and downwards with intensities and respectively.
Let’s consider as the light beam going downwards and the ascending light beam at depth x. If denotes the fraction of the light beam which is absorbed (absorption coefficient per unit thickness) and the fraction of the beam which is diffused (diffusion coefficient), by counterbalancing the crossing light beam passing through an infinitesimal thick layer at the altitude , a linear differential equations system with constant coefficients can be derived. The crossing of the infinitesimal layer at x is accompanied for the flux by a reduction given by through absorption and through diffusion and by an increase given by (see Figure 1). The same applies to the flux in the opposite direction, which leads to the following system:
The mathematical solution of this system can be found, for example, in Ref. [19]. If the thickness of the sample is considered infinite, one obtains the Kubelka-Munk function expressed as:
where: is the Kubelka-Munk function,
is the reflectance ( is reflected beam intensity and is the incident beam intensity).
K–is the absorption coefficient.
S–is the scattering coefficient.
–is the absorbance.
c–is the optical centers concentration (herein the concentration of the absorbing SCO molecules).
From Equation (2), one sees well that the Kubelka-Munk function gives a relation between the volume concentration of the optical centers and the reflectance which is obtained starting from a measurement at the surface. In addition, for the optical centers concentration the following expression can be obtained:
When reflectance measurements are carried out at a wavelength characteristic of the absorption of the LS species, the concentration of the optical centers is equal to the low spin fraction. The high-spin fraction is then easily derived from:
If we assume that the ratio remains constant during the spin transition, it can be assimilated to:
where represents the reflectance of the materials measured in the LS state.
Thus, the high-spin fraction writes as:
where can be expressed according to the following: where C is defined as a contrast parameter depending on the spin state. This assumes that the light is absorbed only by the low spin centers, i.e., .
3. Experimental Part
The [Fe1-xZnx(btr)2(NCS)2]·H2O (btr= 4,4′-bi-1,2,4-triazole, x = 0.0; 0.5) powder samples analyzed in the present paper were synthesized following the procedure detailed in Ref. [20]. The Fe(II) ion is located in a distorted FeN6 centrosymmetric octahedral surrounding of two NCS and four btr ligands. The latter act as bidentate ligands, giving rise to a two-dimensional layer structure. These 2D layers are connected to each other by van der Waals interactions and weak hydrogen bonds through the non-coordinating water molecule and the N(22) atom, yielding high cooperative interactions. The spin transition is closely related to a structural phase transition without symmetry change, characterized by a large anisotropic cell parameters contraction. In order to obtain reproducible hysteresis loops for the thermal spin transition, the samples were cycled several times from room temperature to 77 K prior to measurements. This procedure is supposed to induce some cracks within the crystallites due to the large volume change that accompanies the spin conversion (up to for x = 0.0 [21]), and modify the final grain morphology.
To measure the reflectivity, this original set-up described in Ref. [7] was modified to perform combined and quasi-simultaneous magnetization and reflectivity measurements using a commercial SQUID magnetometer (Quantum Design MPMS-5). To briefly recall the basic set-up, a multi-branch Y-shaped multimoded silica fiber is used to both illuminate the sample (using a Quartz Tungsten Halogen lamp powered with a stabilized current source) and collect the reflected radiation. The Y-shaped multimoded silica fiber is then terminated by a cm-length silica rod onto which a thick layer of powder is attached with double-adhesive tape. A second silica rod is used to provide a symmetric extraction signal from the pick-up coils (second-order gradiometer geometry).
The incident and reflected beam intensities are separately monitored by two photodiodes to correct the remittance, R, from fluctuations of the light source. Both signals are corrected from the contributions of the gain and of the offset from the zero of the amplification system. The offset value was fixed in such a way that the response of the amplifier is linear. A non-reflecting black baking sample holder is used to avoid that any transmitted flux is backscattered and propagate again through the layered sample. Since the size of the particles is of the order of the wavelength, a rough interface is expected, so that the major component of the reflected radiation is due to multiple or diffuse scattering. In addition, particles are randomly oriented and much smaller than the thickness of the layer itself. The reflectance of the background holder is thus usually neglected in the data treatment. The typical absorption spectra of Fe(II) complexes show well-separated bands, centered at 550 nm in the LS state (spin-allowed 1A1→1T1 transition) and 800 nm in the HS state (5T2→5E transition) [10]. For the reflectivity measurements, an interference filter with 50 nm bandwidth was used to provide a monochromatic beam of 550 nm mean wavelength, with an incident power density ranging between 0.3 and 3 mW·cm−2. This parameter is particularly important in the low temperature regime where LS→HS photoexcitation effectively competes with thermally activated relaxation. To limit such photoexcitation, the incident power density was reduced, and the light was chopped (5 mHz, 6 s illumination time). This procedure also helps avoiding considerable heating of the sample.
Because the scattered light flux is measured over a finite solid angle much less than 2π sterad, the remittance has to be defined relative to a signal recorded in the same conditions for a non-absorbing standard: . In this way, data are also corrected from the contribution of an eventual cap placed in between the sample and the optical fibre in conventional reflectivity set-ups. As a calibrant, we used BaSO4 powder (Aldrich, 99%) with a morphology comparable to that of the samples under study. It is worth noting that deviations from Equation (3) may arise from the use of relative values instead of absolute values R∞ of the remittance [22]. In addition, the very small absorption of the standard cannot be neglected, and this is particularly true at low sample absorption. Therefore, here we are taking 0.98 for the remittance of our standard. The optical measurements of the minor cycles have been recorded by using a homemade plateform described in Ref. [7] in the same conditions as we described above.
4. Results and Discussion
Reflectance measurements have been widely used in the past to characterize the switching properties of SCO compounds, assuming a linear relationship between the remittance, R and the fraction of SCO complexes in a given spin state. Equation (6) suggests a different dependence, but the associated shift of the critical temperatures for the thermal hysteresis loop is not significant after Kubelka-Munk correction or is lower than the possible kinetic effects). However, this correction becomes very important in the case of more complex studies, like First Order Reversal Curves (FORC), higher order hysteresis curves (MORC, minor cycles), or relaxation process, significantly modifying the interpretation of the measured data. Below, some experimental results are presented in order to highlight the importance of the KM correction.
4.1. Selected Results
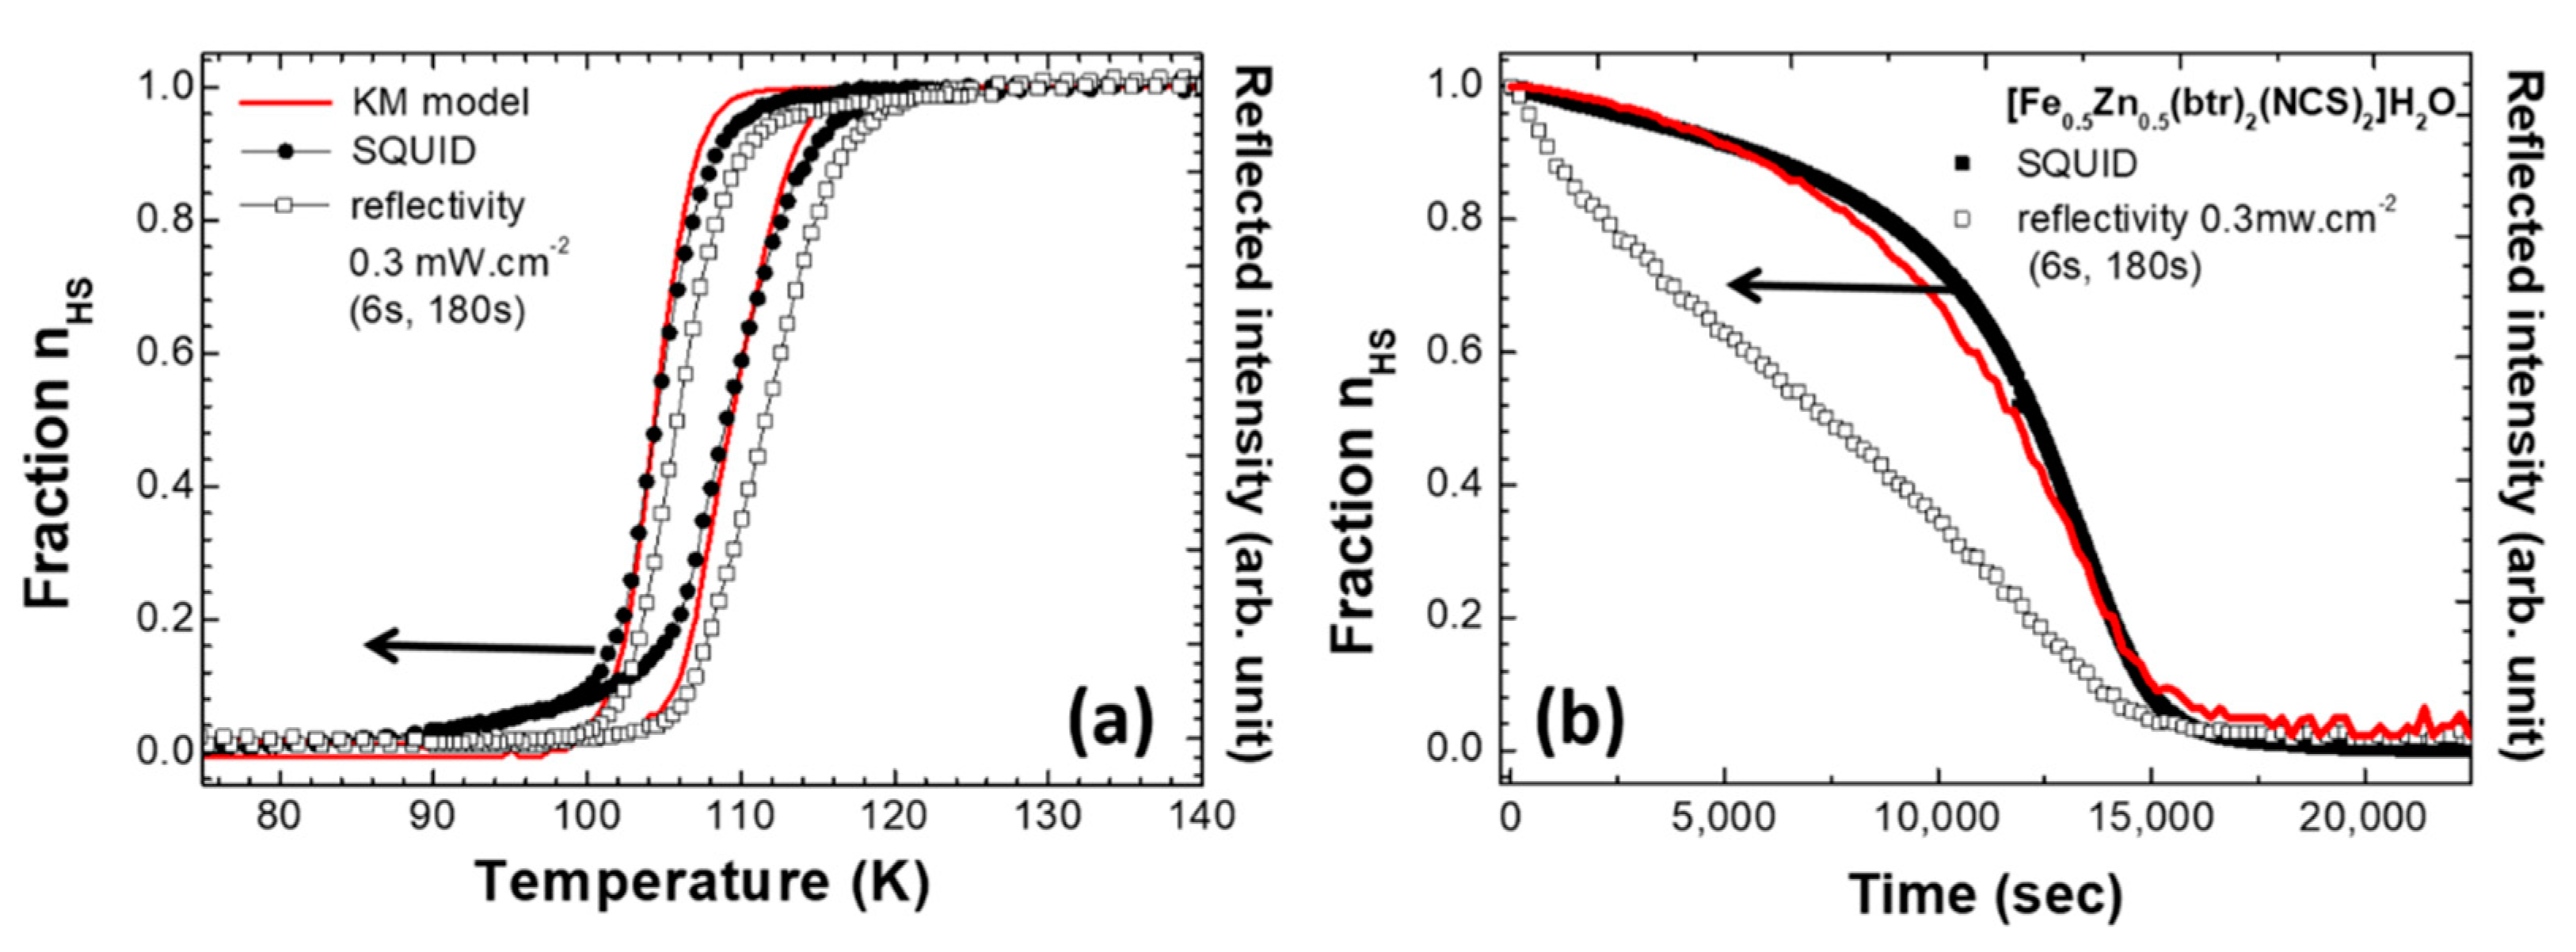
As a first example, Figure 2 illustrates the impact of this correction in the case of a thermal transition (a) and an isothermal relaxation after photoexcitation (b) for the compound. The HS-LS conversions were simultaneously recorded from magnetic susceptibility and reflectance measurements. The curves were renormalized between 0 and 1, by assuming proportionality between the magnetic susceptibility, or the reflectance, and the fraction of high-spin SCO complexes. In addition to an upward shift of the thermal conversion, the relaxation curve directly derived from the reflectivity measurements displays a rather exponential shape, whereas the high-spin fraction, nHS, obtained from magnetic susceptibility exhibits a sigmoidal shape. It worth noting herein that the exponential shape of the relaxation curves is associated with the relaxation process of spin crossover system with weak intra-molecular interactions, while the sigmoidal shape is obtained in strongly interacting molecular systems. In contrast, when nHS is calculated from the remittance, within the Kubelka-Munk approximation, both the temperature at mid transitions and the sigmoidal shape of the relaxation curves get closer to what is expected from the magnetic measurements.
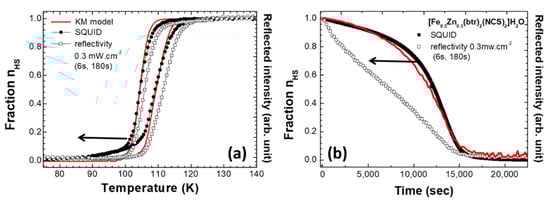
Figure 2.
(a) Major hysteresis loop obtained from simultaneous reflectance and magnetic susceptibility measurements for the [Fe0.5Zn0.5(btr)2(NCS)2]·H2O compound (H = 2000 Oe, continuous illumination, 0.3 mW·cm−2 incident power density); (b) Relaxation curve recorded at 48 K after a preliminary photoexcitation at 10 K using a HeNe laser (532 nm, ~20 mW·cm−2). The isothermal relaxation was measured with a chopped light (5 mHz, 6 sec illumination, 0.3 mW·cm−2 incident power). The high spin fraction was estimated from magnetic susceptibility or reflectance measurements assuming proportionality, or alternatively using the Kubelka-Munk formalism.
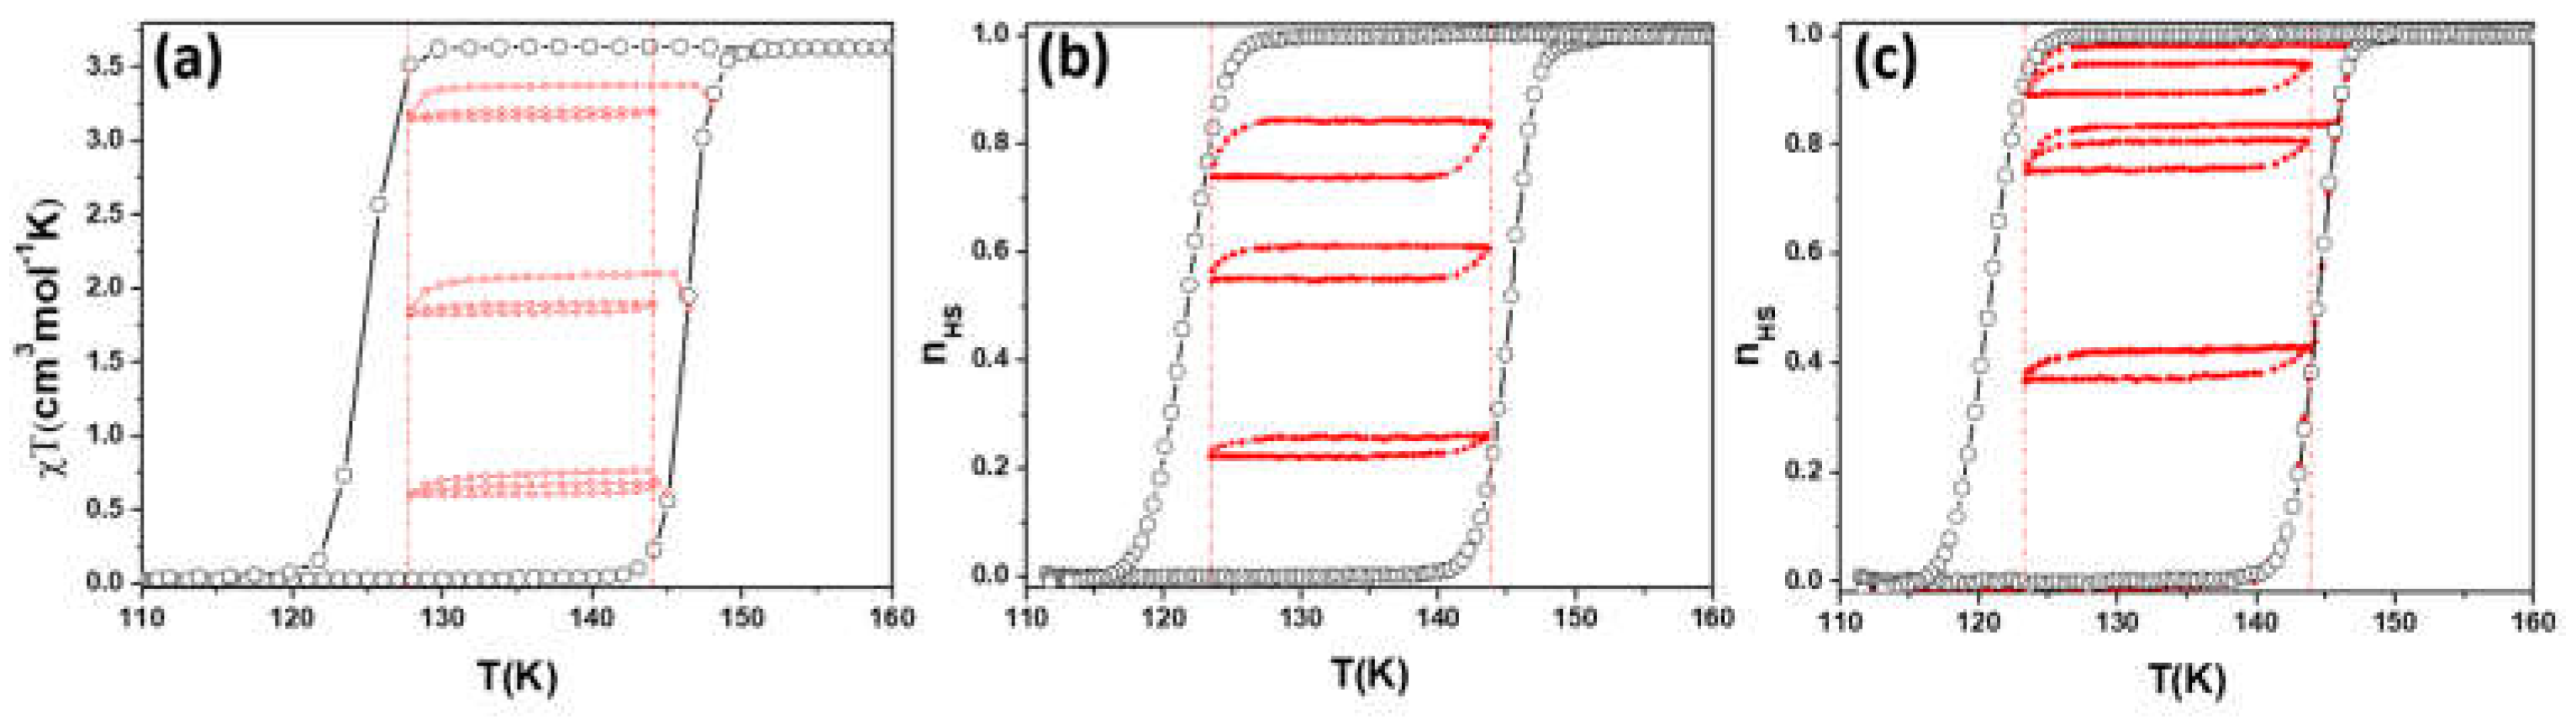
A second example that emphasizes the importance of the Kubelka-Munk correction relates to measurements of the minor cycles between two fixed temperatures which provide important physical information concerning the intensity of interactions between spin-like domains. For example, if the minor loops measured between the same temperature limits are congruent (known also as congruency property), then this may indicate the existence of virtually no inter-domain interactions. This analysis has been made on [Fe(btr)2(NCS)2]·H2O complex. We have recorded minor cycles between two fixed temperatures by both reflectance and magnetic measurements. The two sets of measurements are presented in Figure 3a,b. As in the case of the relaxation process significant discrepancies are observed. In the magnetic measurements, the congruence property is virtually respected (the variation of surface area with being lower than 4%) while in reflectance measurements the surface of the minor cycles varies significantly with the high spin fraction. As shown in Figure 3c, after KM correction one obtains a behavior much closer to that observed by magnetic measurements.
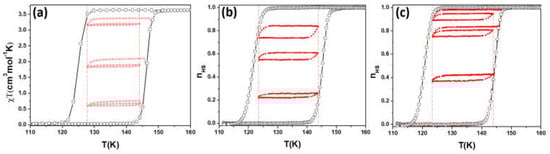
Figure 3.
Major and minor cycles obtained from: (a) magnetic susceptibility measurements; (b) reflectance measurements after normalization and (c) KM - corrected reflectance measurements, respectively recorded on [Fe(btr)2(NCS)2]·H2O, with a temperature rate of 0.5 Kmin−1.
The examples presented above show that after KM correction, the reflectance measurements are in much better agreement with the quantification of the high-spin fraction provided by the magnetic measurements. In order to have further insights on the importance of this correction, we have also studied its impact on FORC diagrams. The results are discussed within the framework of Classical Preisach model (CPM).
4.2. Theoretical Approach
The goal of this section is to understand the effect of KM correction on various samples, with different values of the spin dependent parameter C, hereafter termed contrast, to see in which studies the correction changes significantly the interpretation of the measurements and when this correction is negligible.
The Preisach model adapted to spin domains was presented in Ref. [23]. In the present study, we use a Gaussian distribution of temperatures representative of the transition of the different domains without any supplementary supposition.
From Equation (6) the reflectance can be defined according to the high-spin fraction as:
where: ,
.
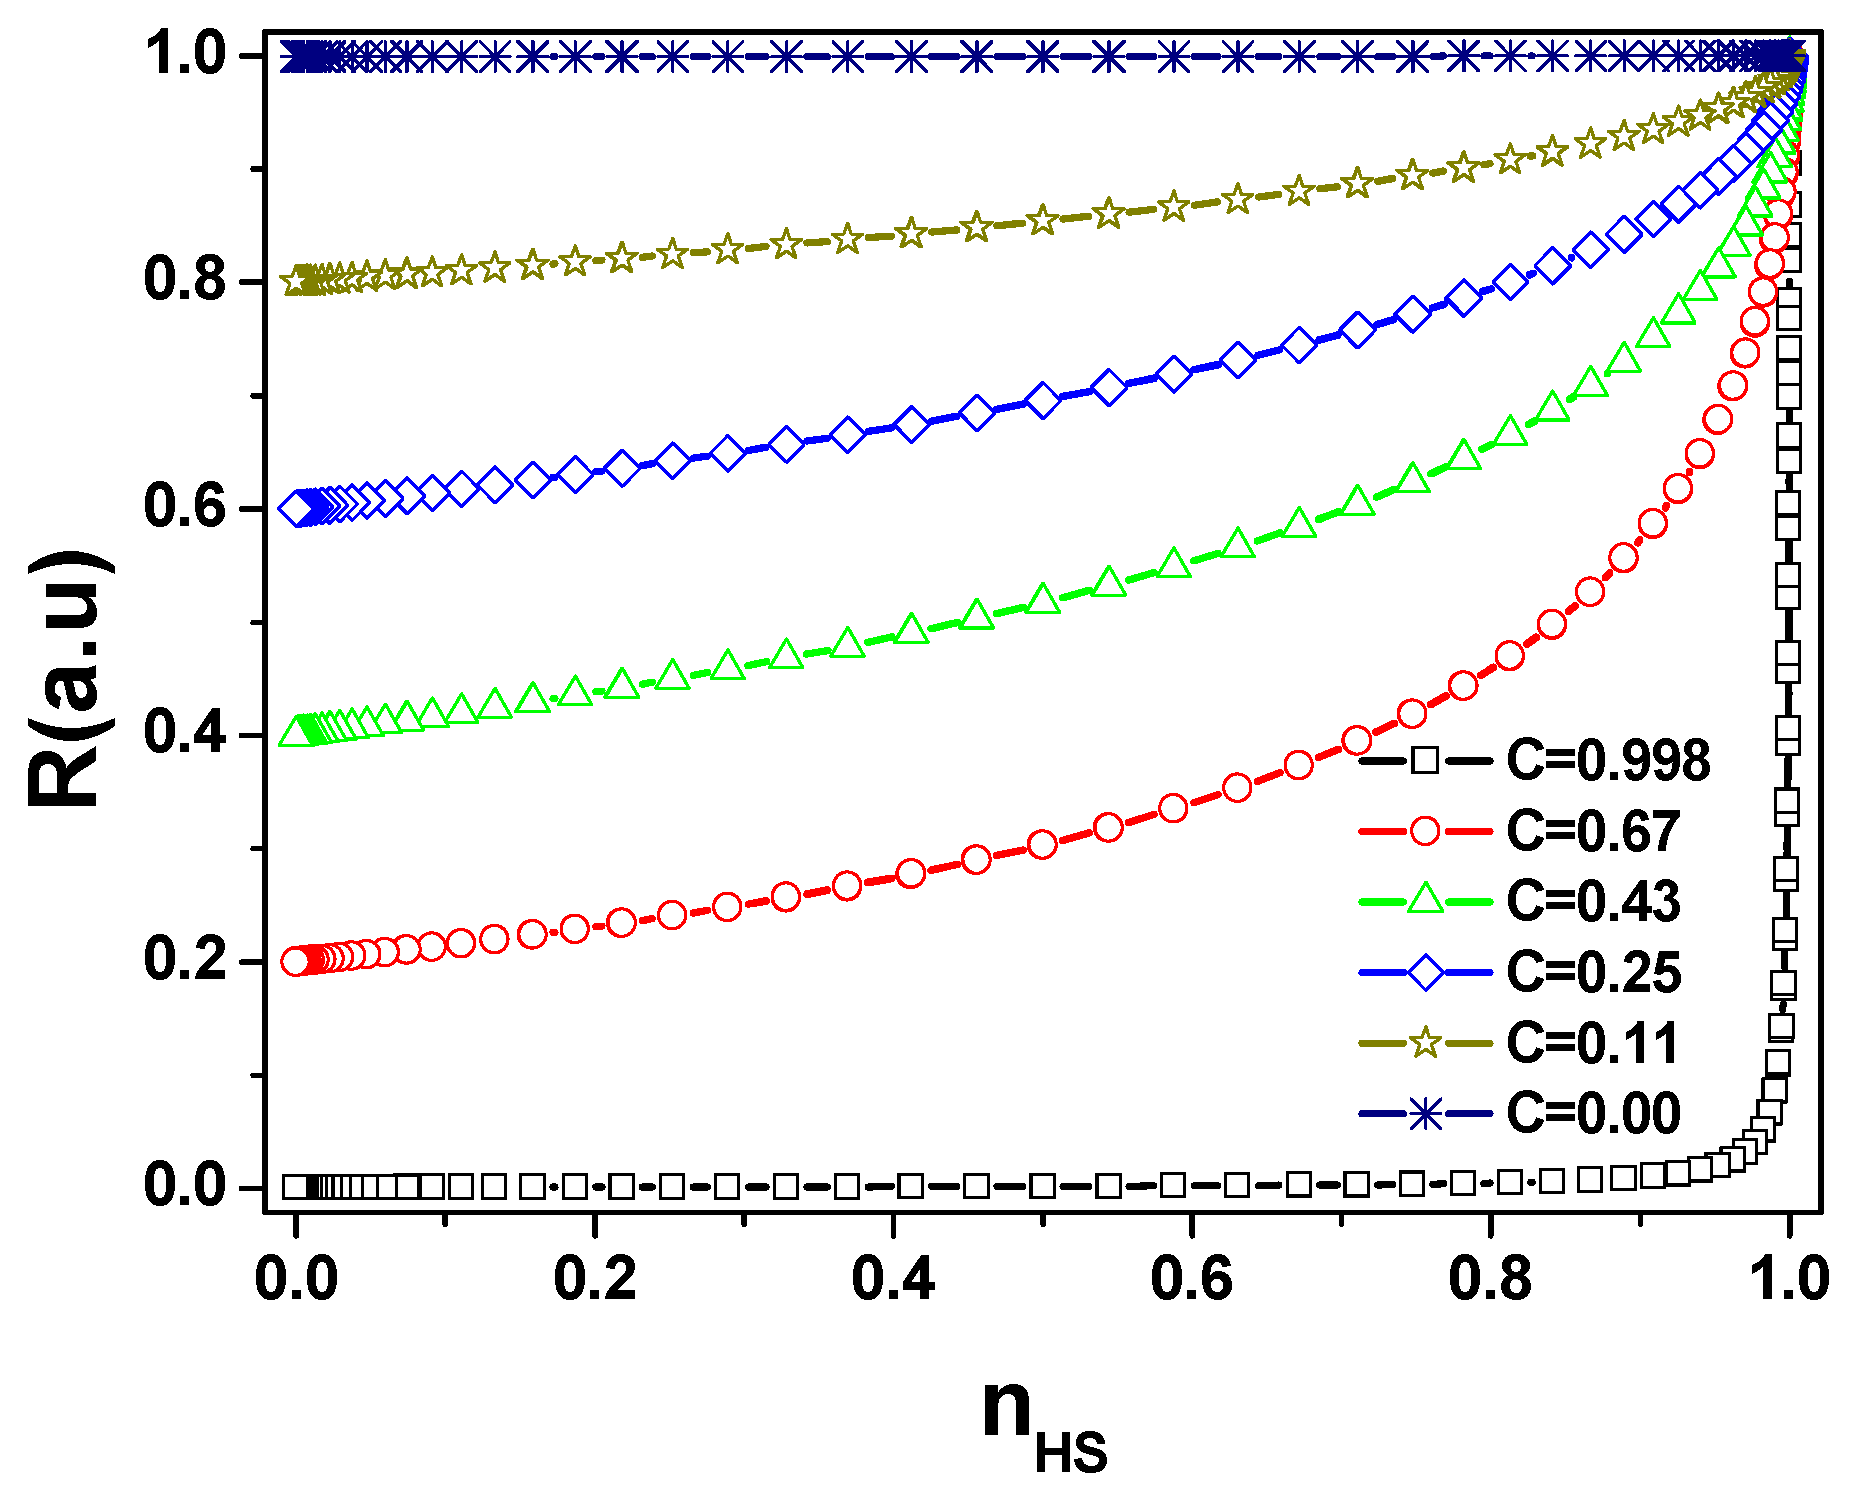
Only the first solution, has physical significance and will be considered in the following. Figure 4 shows the dependence of the reflectance as a function of the high-spin fraction for various values of the contrast C.
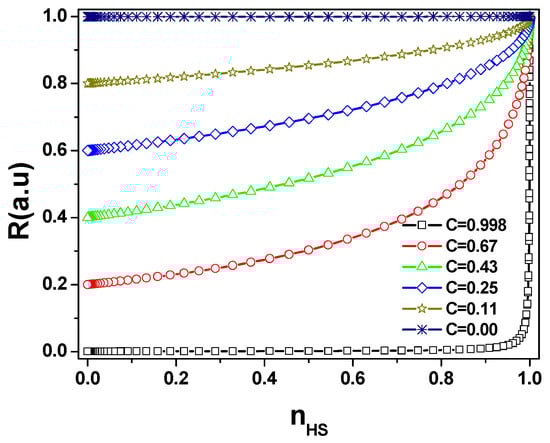
Figure 4.
Dependence of the reflectance on the high-spin fraction for various contrasts between the high-spin and the low-spin states.
Starting from the high-spin fraction obtained from the Classical Preisach model CPM we simulated the major hysteresis loop (MHL), the FORC diagrams and the minor cycles, in coordinates R = f(T), with T: temperature, for various values of C.
4.2.1. KM Correction on the MHL
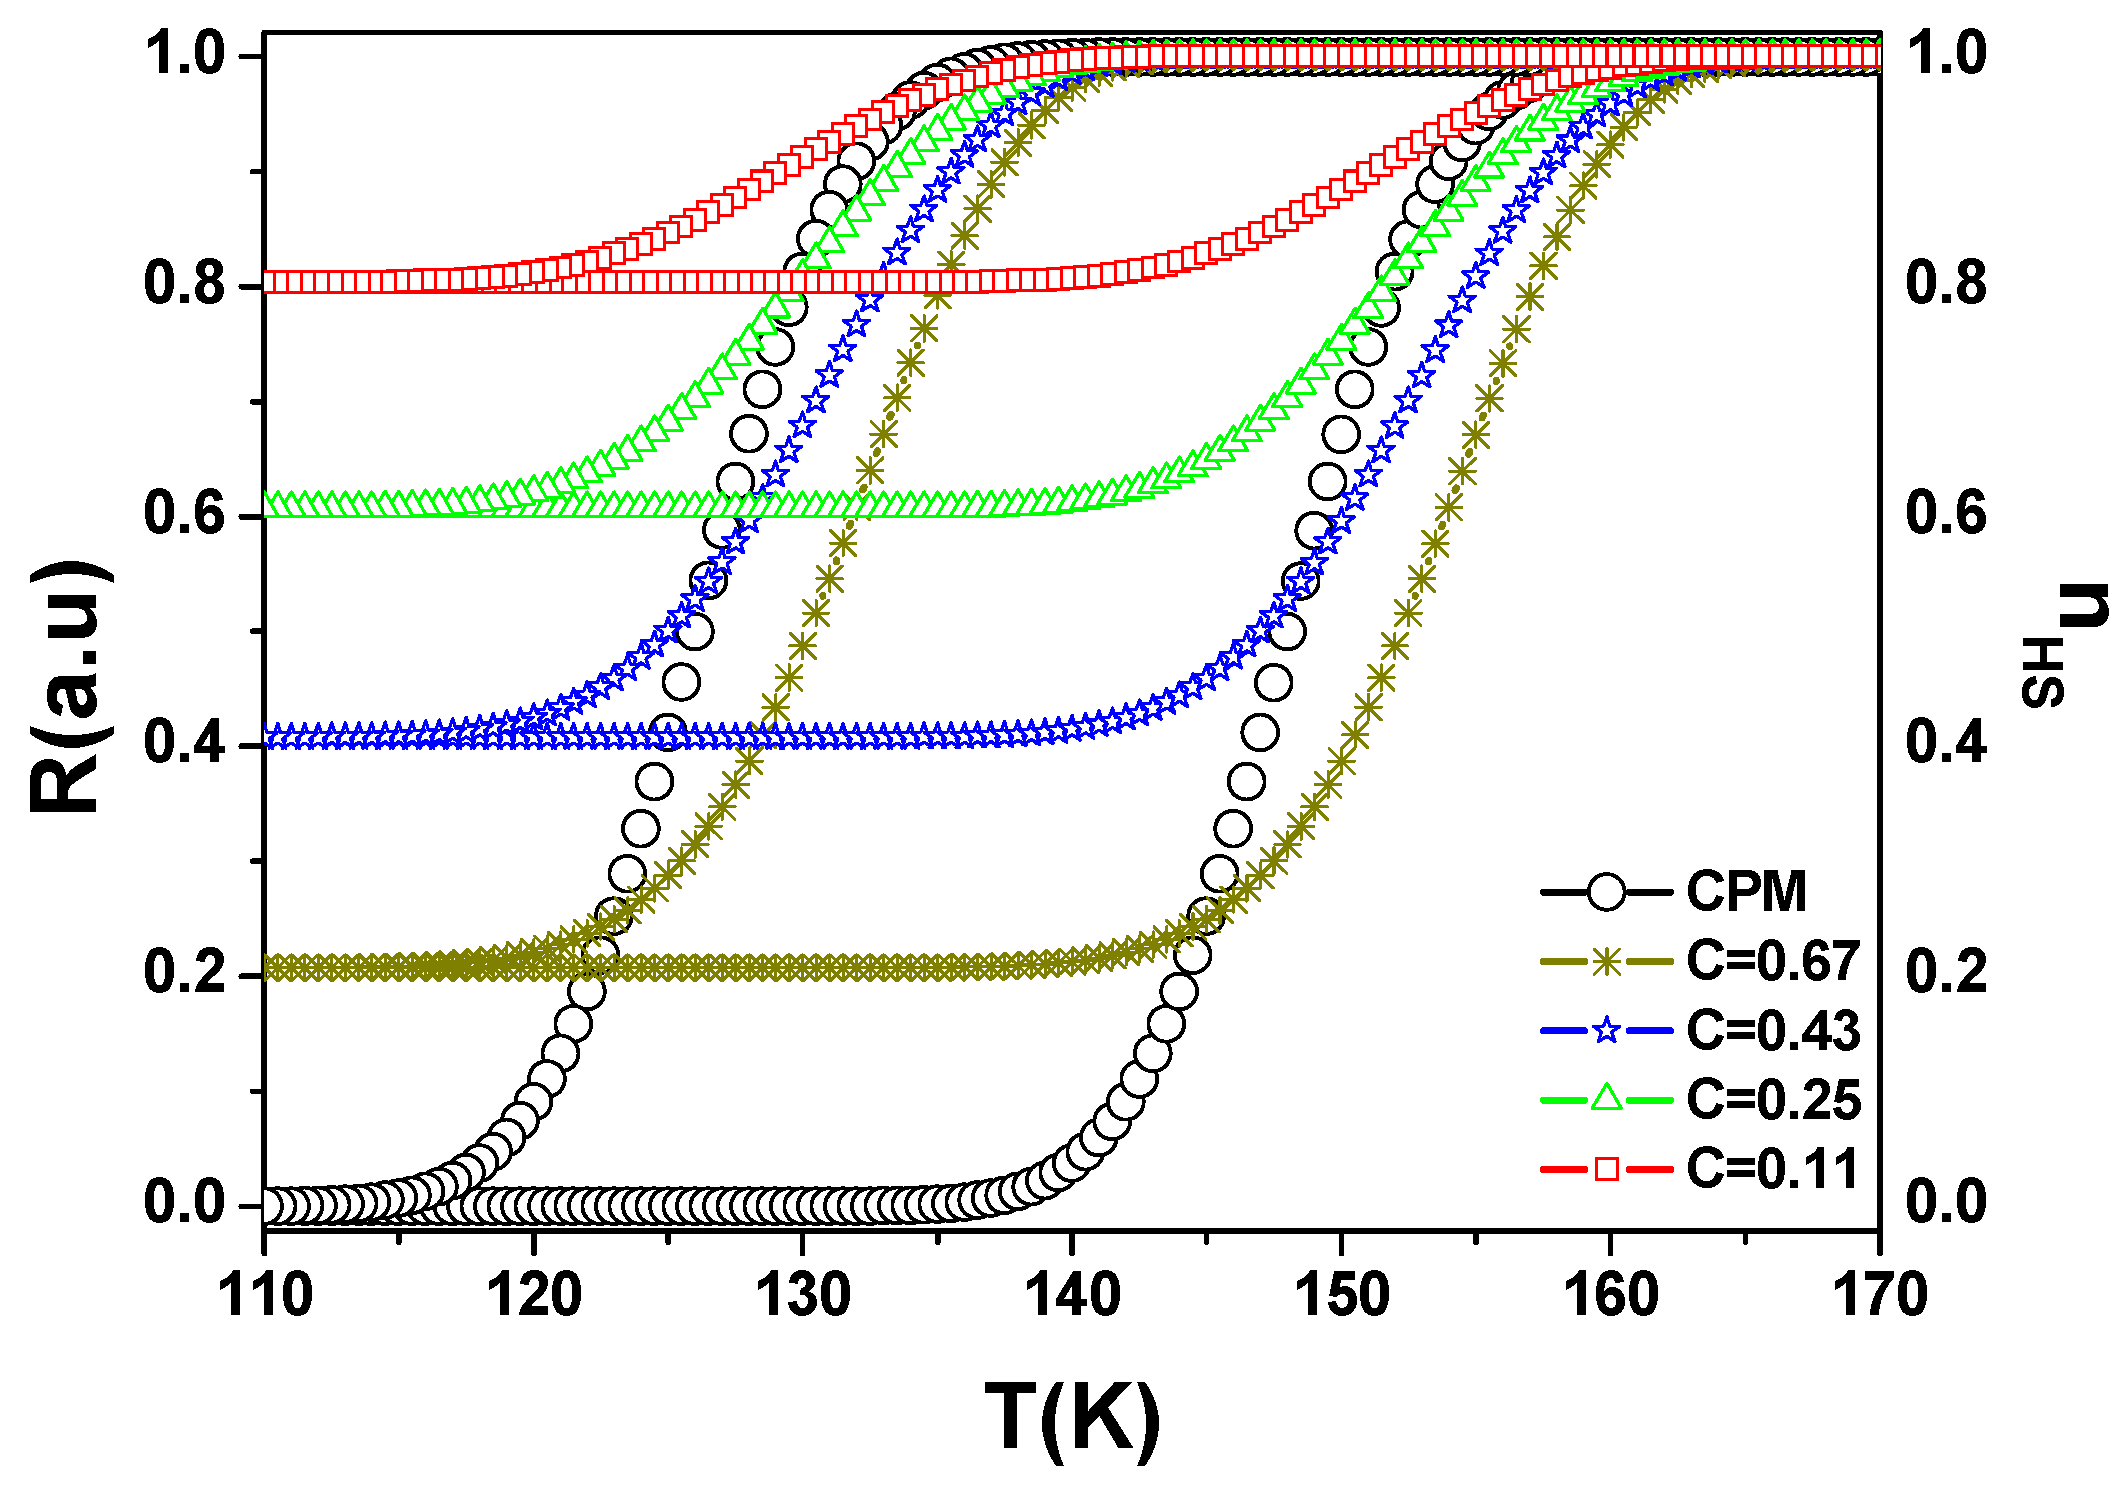
In Figure 5 we have represented the major hysteresis loop obtained in the Classical Preisach model (CPM) and the major hysteresis loops corrected in the KM approximation for 4 different values of the sample contrast parameter (C = 0.67, 0.43, 0.25, 0.11).
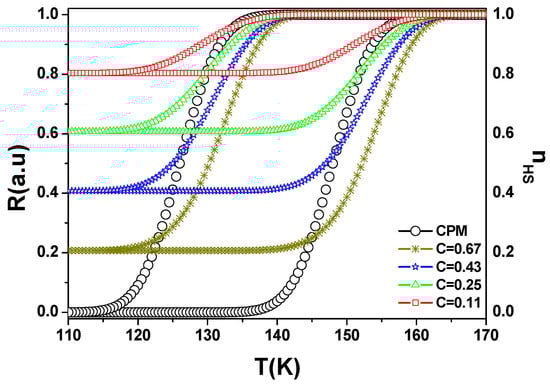
Figure 5.
Thermal hysteresis loops simulated for various color contrast values.
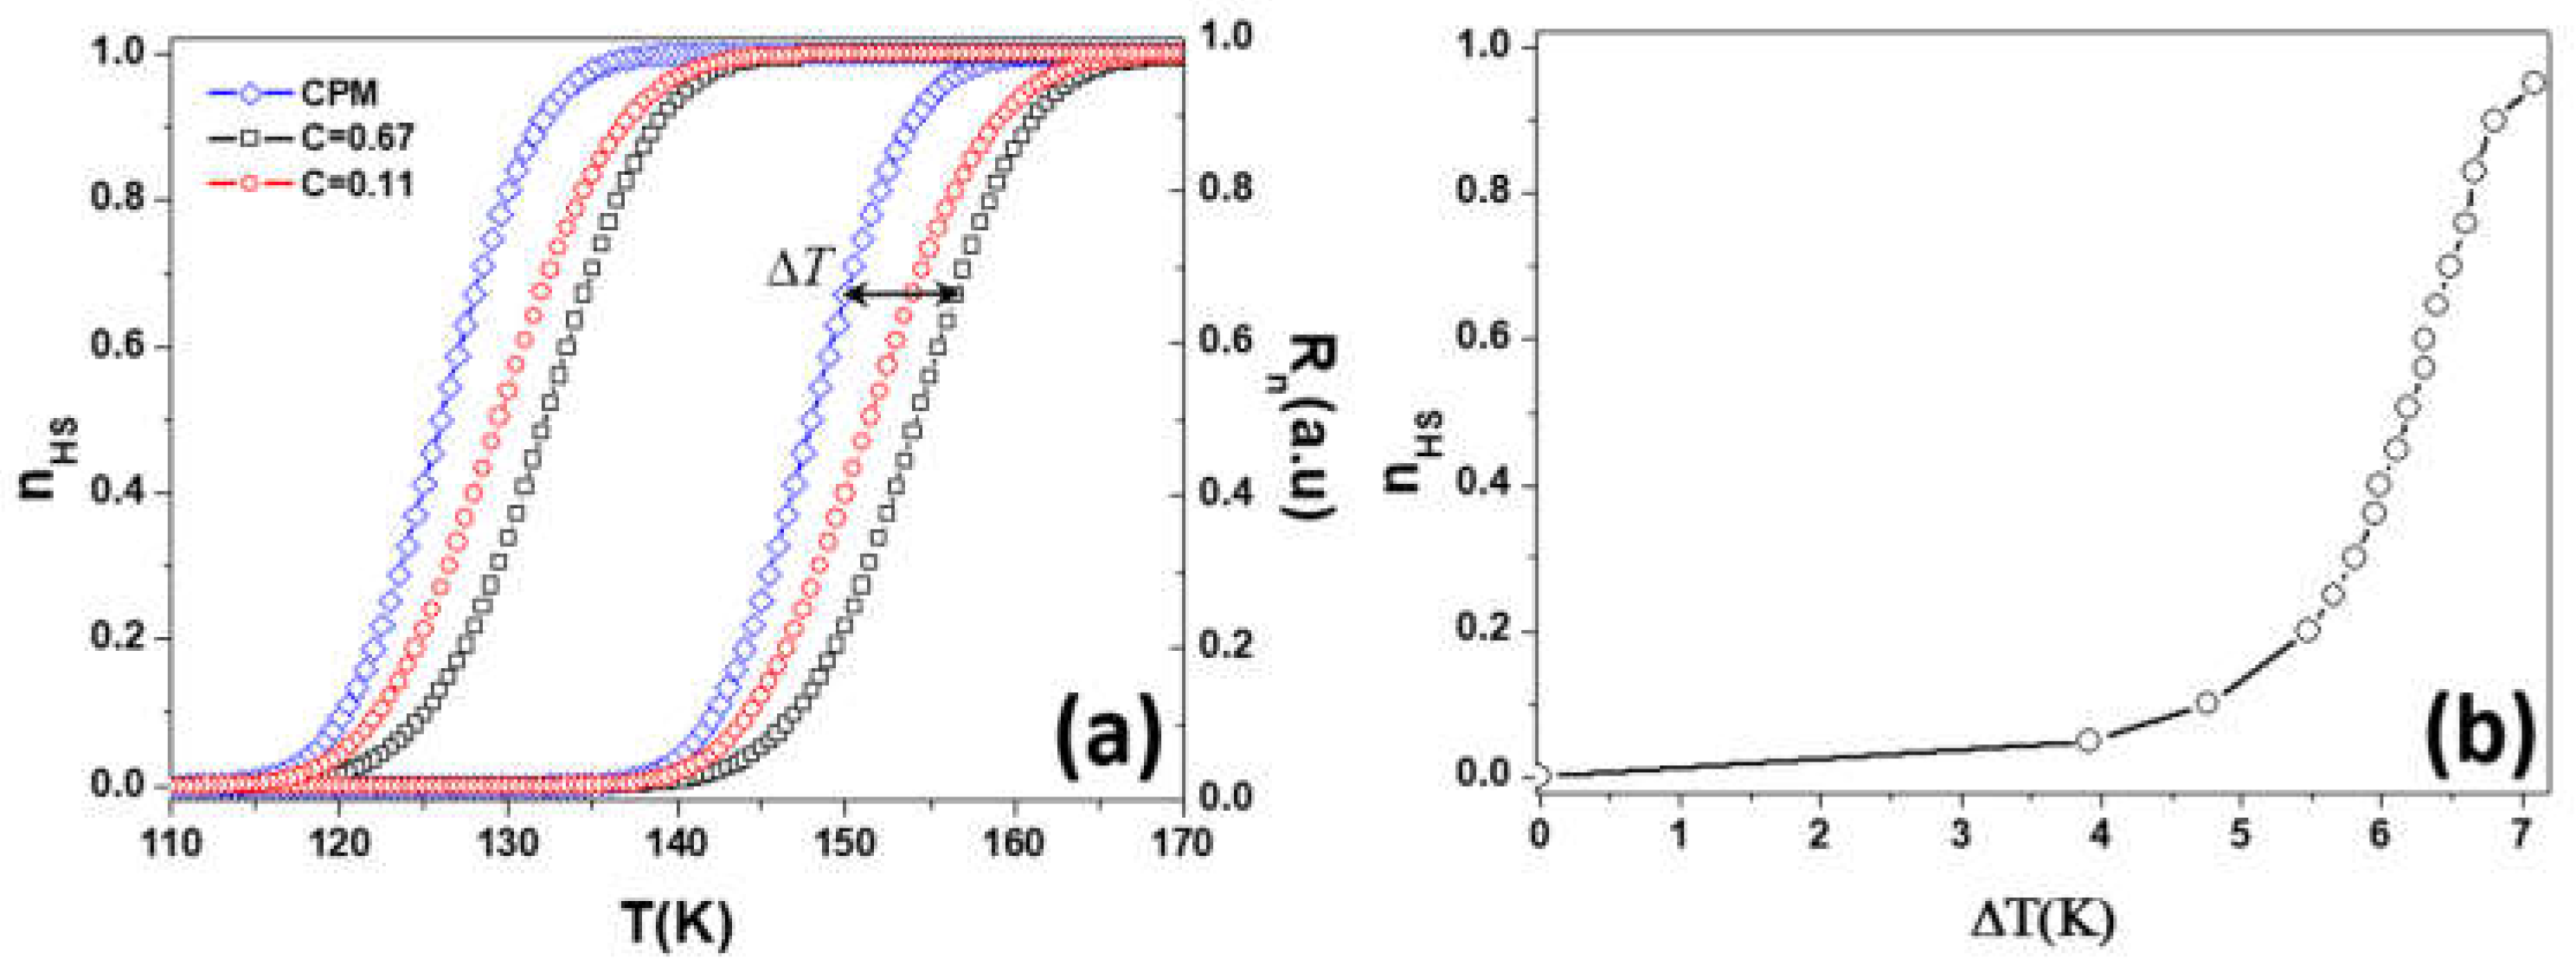
To be able to make a comparison between these different MHLs, we normalize the values of the reflectance, so that R varies between zero and 1 (see Figure 6a), by applying the formula:

Figure 6.
Influence of the Kubelka-Munk correction on the thermal hysteresis loop (a) and the switching temperature shift, , with the high-spin fraction for C = 0.67 with respect to CPM (b).
Figure 6b shows the variation of the temperature correction with the high-spin fraction for the major hysteresis loop. As a partial conclusion one can say that the absence of KM correction artificially shifts the transitions to high temperature, in good agreement with the experimental observations of Figure 2a. In addition, the abruptness of the branches is modified as illustrated by Figure 6b, which leads to the loose of the congruence property. The same study was conducted by using the FORC diagram method.
4.2.2. KM Correction on the FORC Diagram
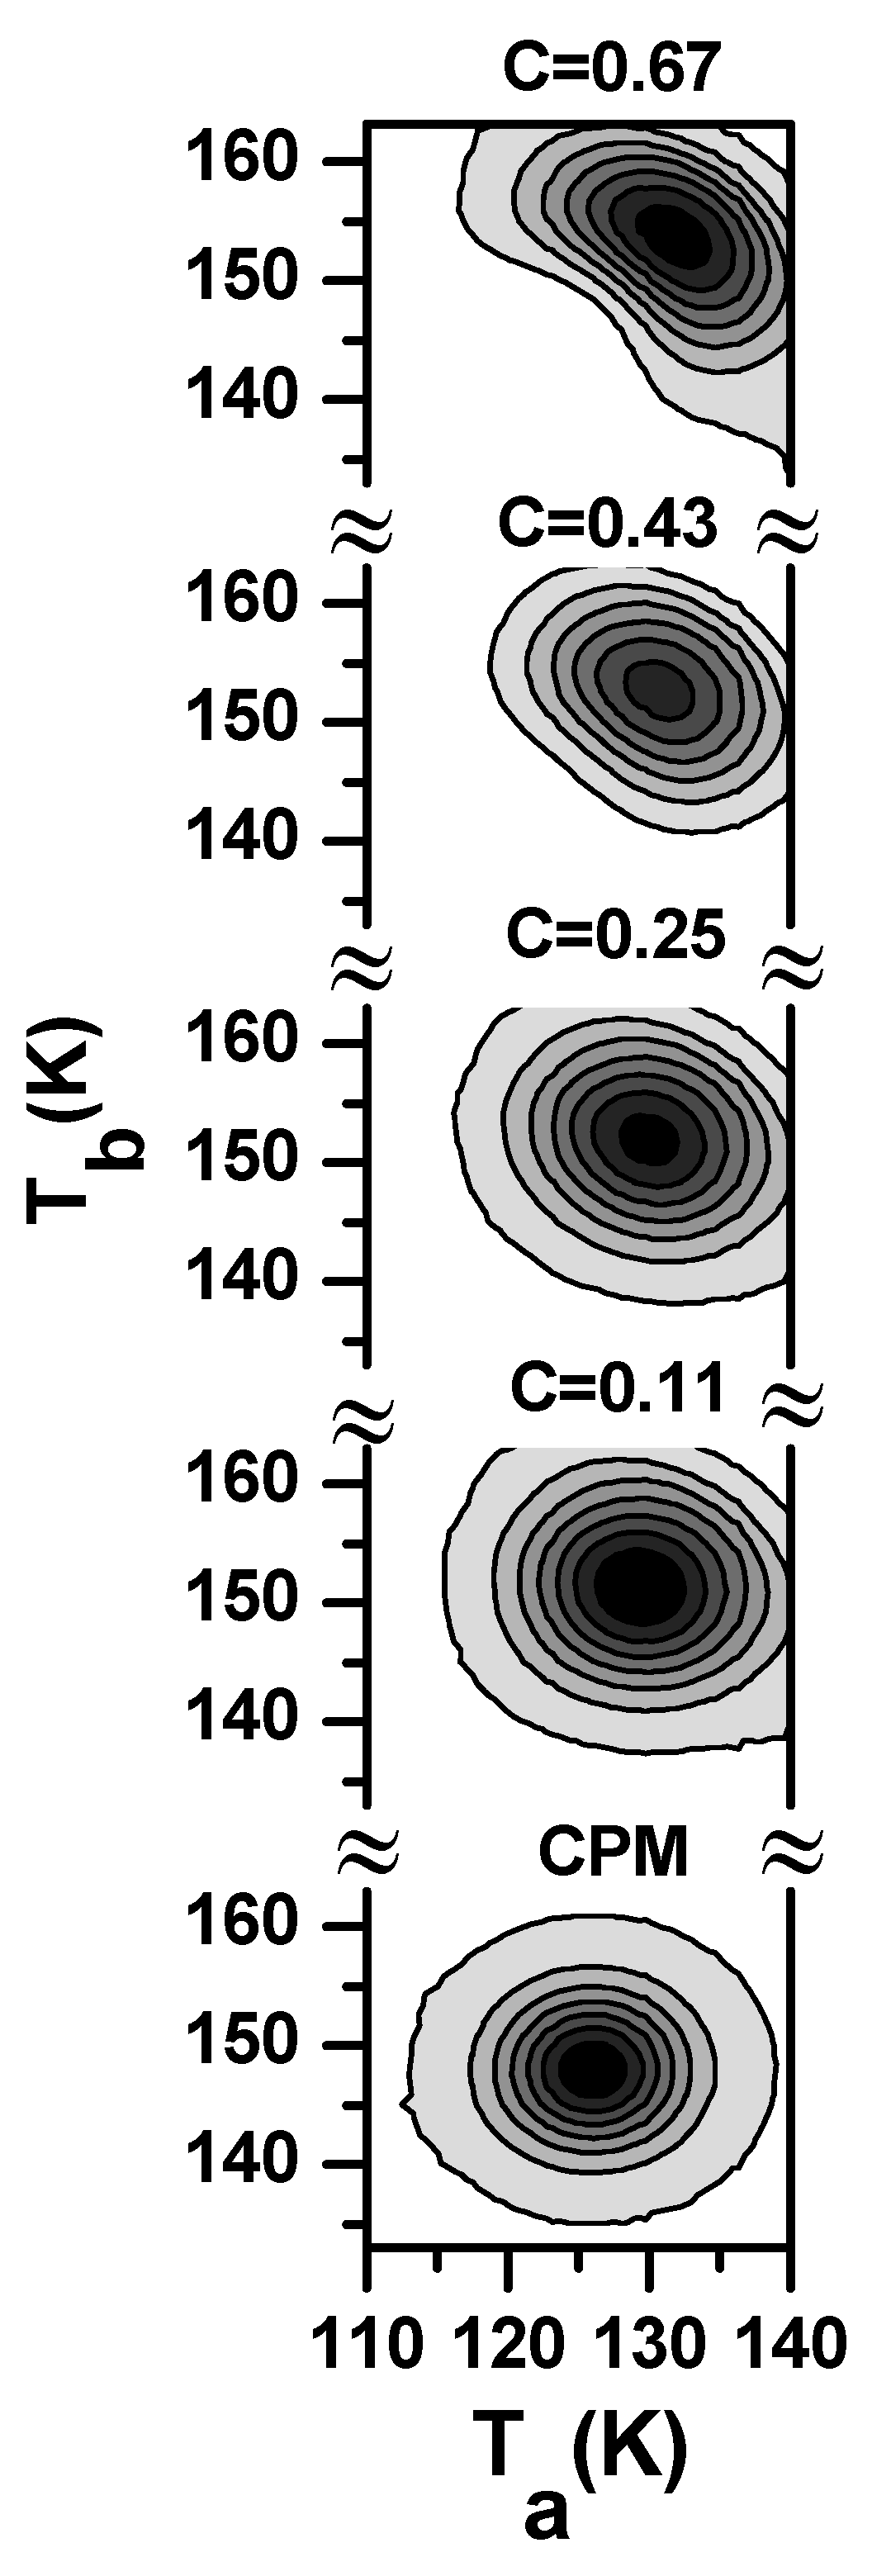
The FORC diagram method has been proved a very sensitive tool for the characterization of the hysteretic properties of spin transition materials as it gives more information about the spin-domain structure which influences the material’s behavior inside the hysteresis loop [24,25]. Figure 7 shows the FORC diagrams obtained within the framework of the CPM where the contour plot has a circular shape and for four other values of the sample contrast parameter C, expressed in reversal-measurement temperature coordinates. In the Preisach model, the FORC distribution is identified as the relative population of domains having Ta, Tb as switching temperatures.

Figure 7.
FORC diagrams obtained for different contrast values.
From this study one can note that FORC diagrams calculated from uncorrected remittance do not change significantly for weak contrasts. However, for samples showing a high contrast, the shape of the FORC diagram is strongly distorted which leads to an unrealistic interpretation of the experimental data. These differences can be better seen from the statistical analysis of the FORC diagrams presented in Table 1. The joint probability distributions have been analyzed in terms of standard deviation σ, mean values of the switching temperatures and the dimensionless correlation parameter r defined as .

Table 1.
Statistical analysis of the diagrams from Figure 7.
The statistical analysis confirms that by increasing the samples’ contrast, an upward shift of the switching temperatures is expected, but more importantly, the increase of the contrast induces a correlation between the joint distributions as an artefact.
4.2.3. KM Correction on the Minor Cycles
The Classical Preisach Model considers a distribution of independent domains, which implies that the congruence propriety is respected (see Figure 8) [26,27].
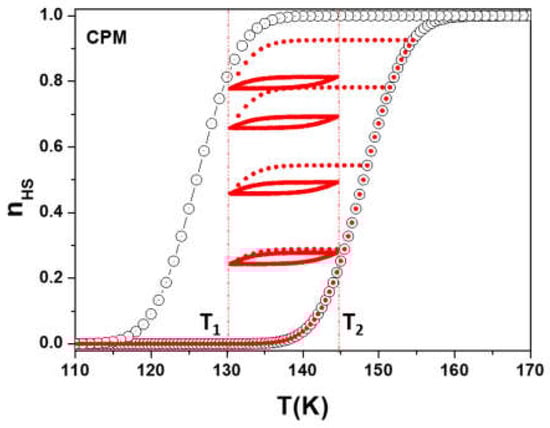
Figure 8.
Minor cycles obtained between two different temperatures (), simulated in the framework of CPM model.
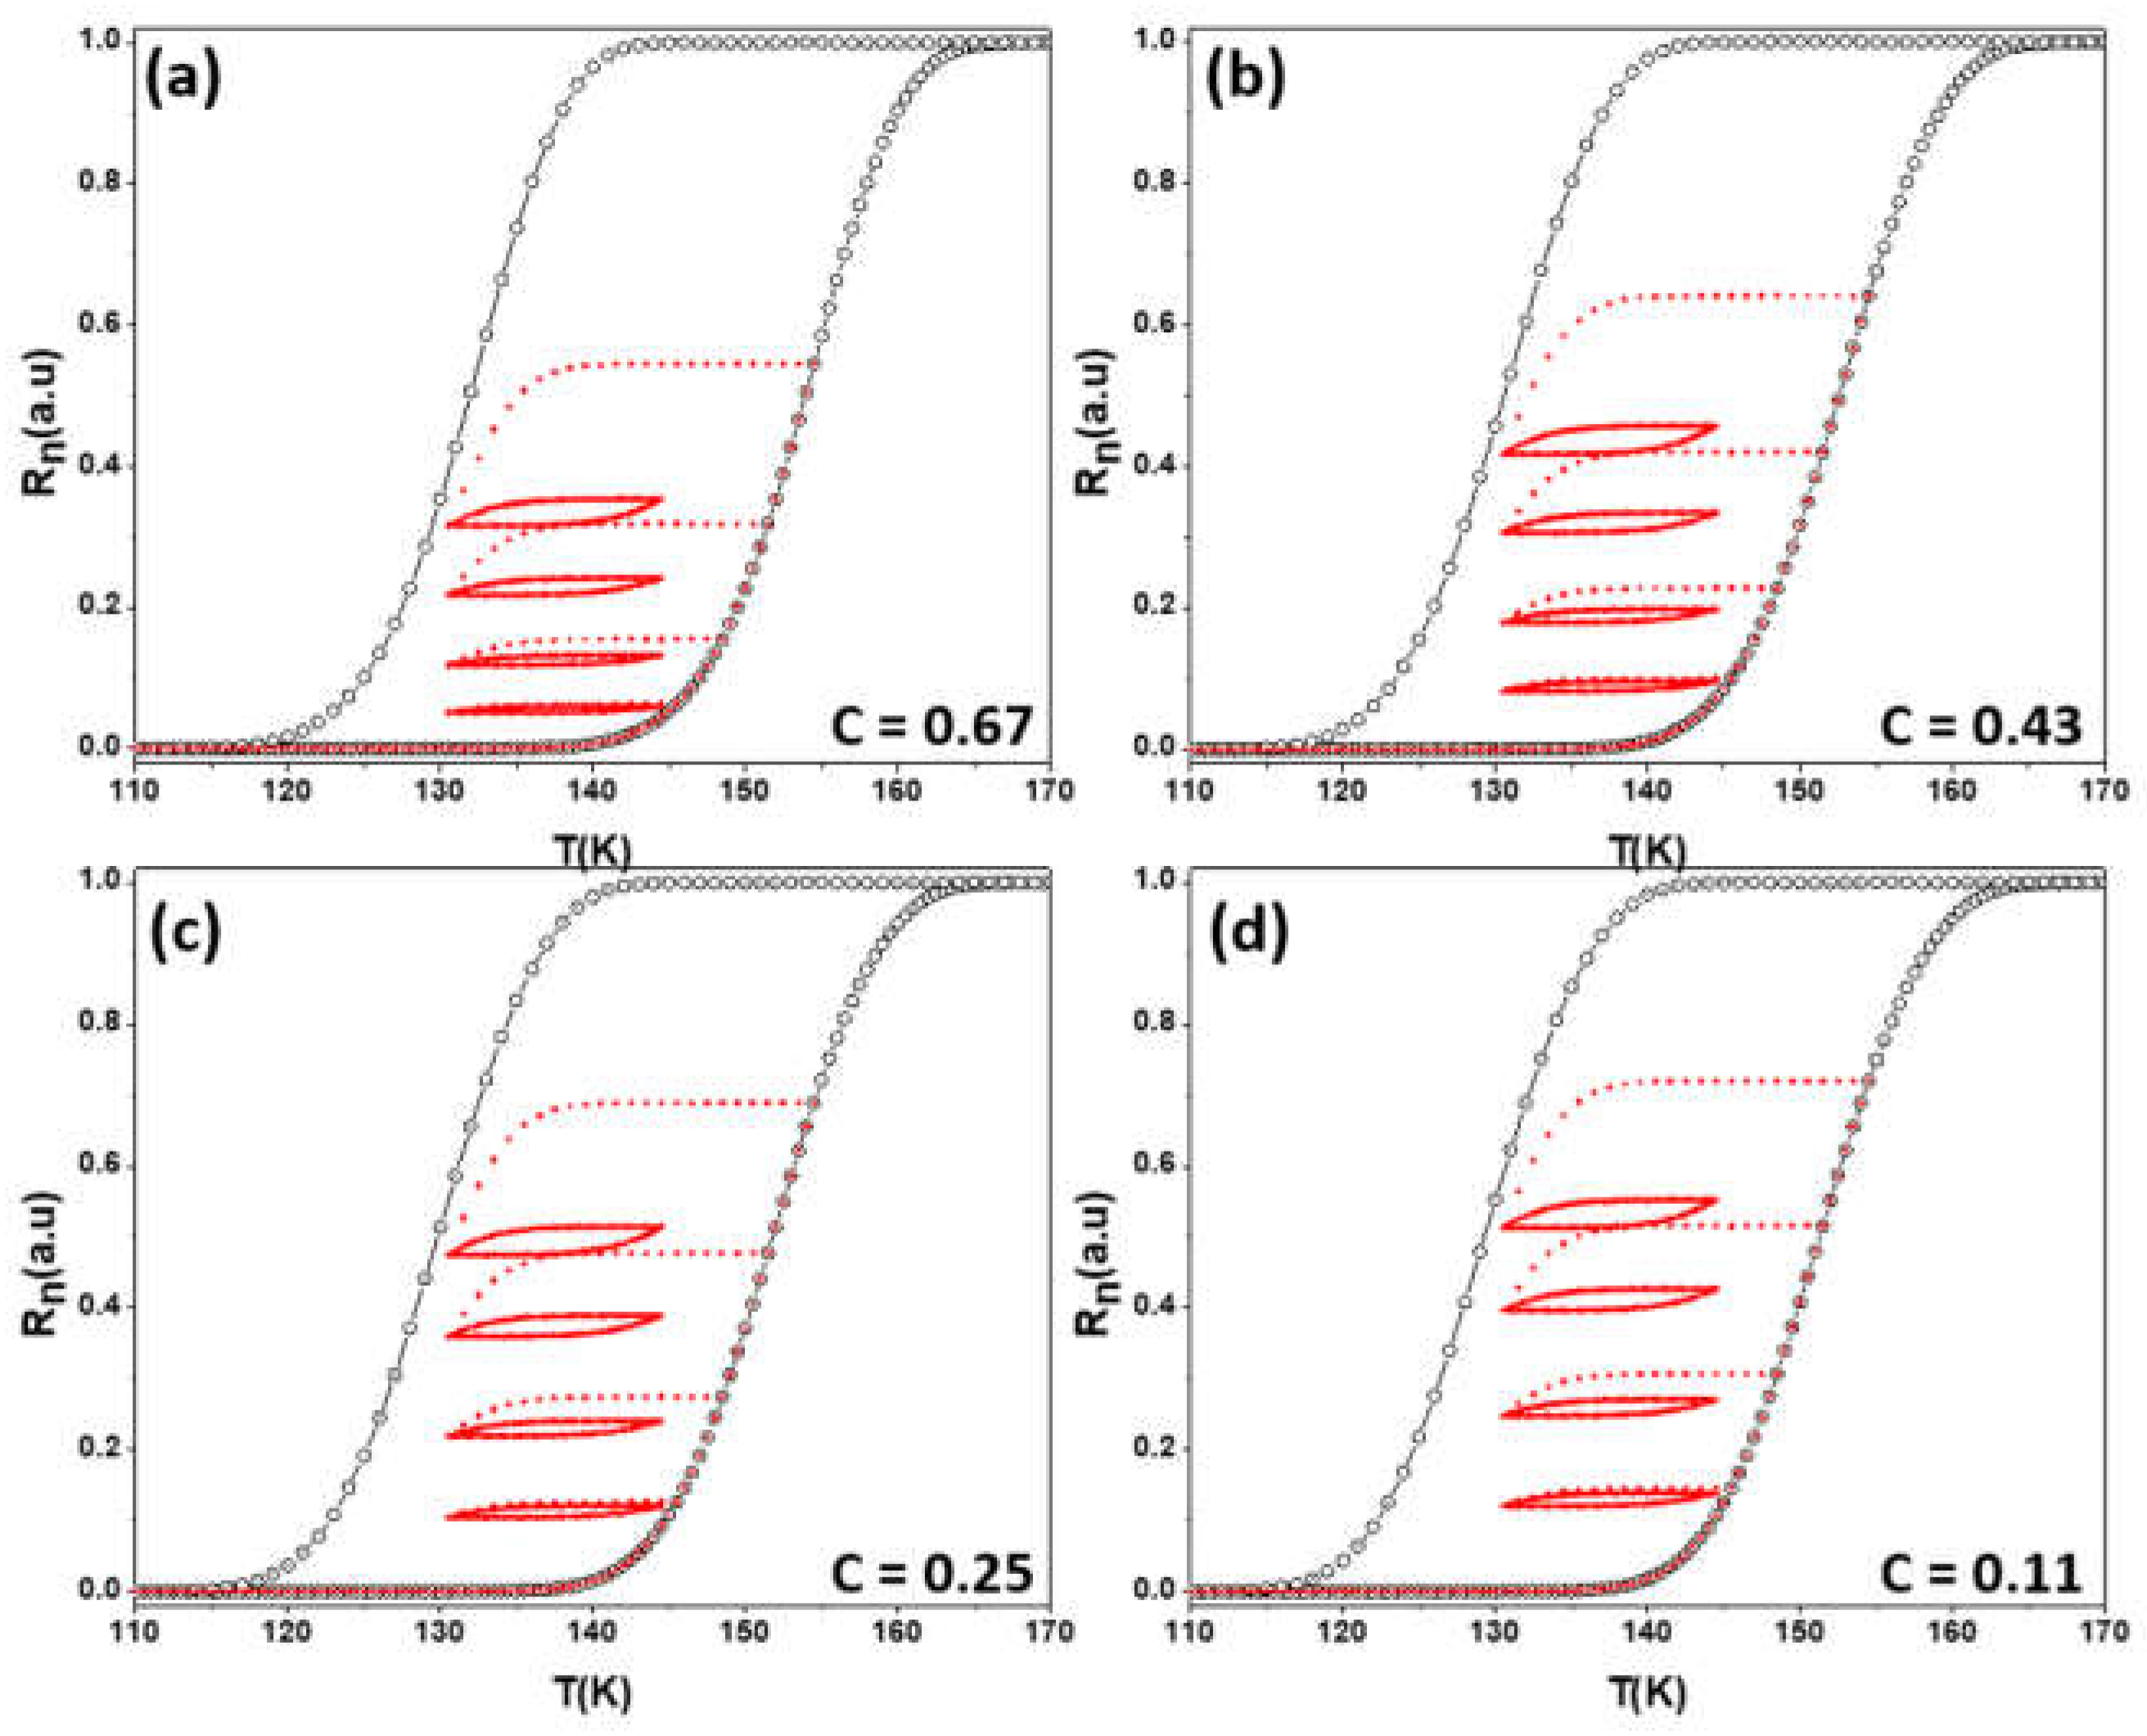
When we move to reflectance-temperature coordinates, the calculations yield the same behavior than the one observed experimentally, i.e., congruence property artificially disappears, as presented in the first section (see Figure 3 and Figure 9).
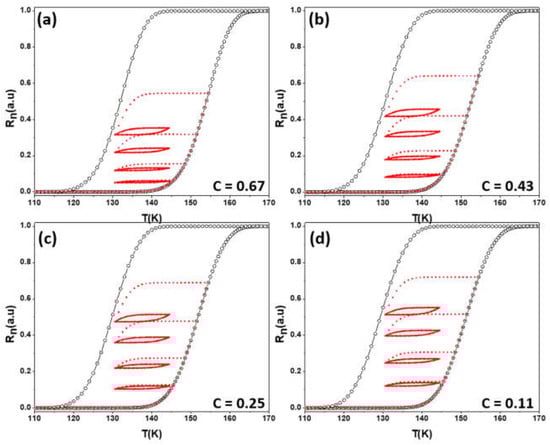
Figure 9.
Sets of minor cycles simulated in reflectance-temperature coordinates for various values of the contrast parameter: (a) C = 0.67; (b) C = 0.43; (c) C = 0.25 and (d) C = 0.11.
If the KM correction on the major hysteresis loop and on the FORC diagram for weak contrasts might be considered as negligible, this correction leads to considerable changes in the interpretation of the reflectance measurements in the case of minor cycles obtained between two fixed temperatures as it introduces an inter-domain coupling which is not real.
5. Conclusions
Diffuse reflectivity measurements proved to be an efficient tool for the characterization of spin transitions associated with an absorption contrast between the high-spin and the low-spin states, especially in bulky environments including pressure cells or confined space through the use of optical fibers. It also benefits from time resolution with respect to magnetization probes using aperiodic flux extraction methods such as SQUID magnetometry or quantification of the fraction of transformed molecules from diffraction studies using laboratory x-ray sources coupled to 0D/1D detectors. Even though the reflectivity method has been successfully applied to the investigation of thermal and pressure-induced hysteresis loops, the technique shows its limits in the case of more complex analyses related to the inter-molecular interactions such as relaxation process or higher order reversal curves,. In this work we showed the applicability of the Kubelka-Munk correction for a correct description of the reflectance measurements in the characterization of the molecular spin crossover materials which can be extended to other thermo- and piezo-chromic materials.
Author Contributions
Conceptualization, methodology and supervision, I.M., J.L. and A.R.; simulations, G.-M.R. and A.R.; experiments: I.M., E.C. and A.R. validation and formal analysis: P.-R.D., I.M. and A.R.; writing—original draft preparation: G.-M.R. and A.R.; writing—review and editing I.M., J.L., P.-R.D. and A.R. All authors have read and agreed to the published version of the manuscript.
Funding
This work was partially funded by UEFISCDI, project number PN-III-P1-1.1-TE-2019-2194 (Contract No: TE 123/2020), CNFIS, project number CNFIS-FDI-2021-0357 and European Union Network of Excellence MAGMANet (Contract No. NMP3-CT-2005-515767-2).
Institutional Review Board Statement
Not applicable.
Informed Consent Statement
Not applicable.
Data Availability Statement
Data are available from the authors on reasonable request.
Conflicts of Interest
The authors declare no conflict of interest.
References
- Kahn, O. Molecular Magnetism; VCH Publishers: Hoboken, NJ, USA, 1993. [Google Scholar]
- Gütlich, P.; Goodwin, H.A. Spin Crossover in Transition Metal Compounds; (Vols. I, II, III); Springer: Berlin/Heidelberg, Germany, 2004. [Google Scholar]
- Rubio-Giménez, V.; Tatay, S.; Martí-Gastaldo, C. Electrical conductivity and magnetic bistability in metal–organic frameworks and coordination polymers: Charge transport and spin crossover at the nanoscale. Chem. Soc. Rev. 2020, 49, 5601–5638. [Google Scholar] [CrossRef] [PubMed]
- Gaspar, A.B.; Seredyuk, M.; Gütlich, P. Spin crossover in iron(II) complexes: Recent advances. J. Mol. Struct. 2009, 924–926, 9–19. [Google Scholar] [CrossRef]
- Gütlich, P. Spin Crossover—Quo Vadis? Eur. J. Inorg. Chem. 2013, 2013, 581–591. [Google Scholar] [CrossRef]
- Lefter, C.; Tan, R.; Dugay, J.; Tricard, S.; Molnár, G.; Salmon, L.; Carrey, J.; Nicolazzi, W.; Rotaru, A.; Bousseksou, A. Unidirectional electric field-induced spin-state switching in spin crossover based microelectronic devices. Chem. Phys. Lett. 2016, 644, 138–141. [Google Scholar] [CrossRef]
- Morscheidt, W.; Jeftic, J.; Codjovi, E.; Linares, J.; Bousseksou, A.; Constant-Machado, H.; Varret, F. Optical detection of the spin transition by reflectivity: Application to [FexCo1-x(btr)(2)(NCS)(2)]center dot H2O. Measur. Sci. Tech. 1998, 9, 1311–1315. [Google Scholar] [CrossRef]
- Jeftic, J.; Menéndez, N.; Andréwack; Codjovi, E.; Linarès, J.; Goujon, A.; Hamel, G.; Klotz, S.; Syfosse, G.; Varret, F. A helium-gas-pressure apparatus with optical-reflectivity detection tested with a spin-transition solid. Meas. Sci. Technol. 1999, 10, 1059–1064. [Google Scholar] [CrossRef]
- Codjovi, E.; Morscheidt, W.; Jeftic, J.; Linares, J.; Nogues, M.; Goujon, A.; Roubeau, O.; Constant-Machado, H.; Desaix, A.; Bousseksou, A.; et al. Simultaneous Reflectivity and Magnetic Measurements on Photomagnetic Solids: Spin-Crossover Solids and a Prussian Blue Analogue. Mol. Cryst. Liq. Cryst. Sci. Technol. Sect. A. Mol. Cryst. Liq. Cryst. 1999, 335, 583–592. [Google Scholar] [CrossRef]
- Legrand, V.; Pillet, S.; Carbonera, C.; Souhassou, M.; Letard, J.F.; Guionneau, P.; Lecomte, C. Optical, magnetic and structural properties of the spin-crossover complex [Fe(btr)(2)(NCS)(2)]center dot H2O in the light-induced and thermally quenched metastable states. Eur. J. Inorg. Chem. 2007, 2007, 5693–5706. [Google Scholar] [CrossRef] [Green Version]
- Balde, C.; Bauer, W.; Kaps, E.; Neville, S.; Desplanches, C.; Chastanet, G.; Weber, B.; Letard, J.F. Light-Induced Excited Spin-State Properties in 1D Iron(II) Chain Compounds. Eur. J. Inorg. Chem. 2013, 2013, 2744–2750. [Google Scholar] [CrossRef]
- Jureschi, C.-M.; Rusu, I.; Codjovi, E.; Linares, J.; Garcia, Y.; Rotaru, A. Thermo- and piezochromic properties of [Fe(hyptrz)]A2·H2O spin crossover 1D coordination polymer: Towards spin crossover based temperature and pressure sensors. Phys. B Condens. Matter 2014, 449, 47–51. [Google Scholar] [CrossRef]
- Jureschi, C.M.; Linares, J.; Rotaru, A.; Ritti, M.H.; Parlier, M.; Dîrtu, M.M.; Wolff, M.; Garcia, Y. Pressure Sensor via Optical Detection Based on a 1D Spin Transition Coordination Polymer. Sensors 2015, 15, 2388–2398. [Google Scholar] [CrossRef]
- Gütlich, P.; Hauser, A.; Spiering, H. Thermal and Optical Switching of Iron(II) Complexes. Angew. Chem. Int. Ed. 1994, 33, 2024–2054. [Google Scholar] [CrossRef]
- Levchenko, G.G.; Bukin, G.V.; Fylymonov, H.; Li, Q.; Gaspar, A.B.; Real, J.A. Electrical Voltage Control of the Pressure-Induced Spin Transition at Room Temperature in the Microporous 3D Polymer [Fe(pz)Pt(CN)4]. J. Phys. Chem. C 2019, 123, 5642–5646. [Google Scholar] [CrossRef]
- Ridier, K.; Bas, A.-C.; Zhang, Y.; Routaboul, L.; Salmon, L.; Molnár, G.; Bergaud, C.; Bousseksou, A. Unprecedented switching endurance affords for high-resolution surface temperature mapping using a spin-crossover film. Nat. Commun. 2020, 11, 3611. [Google Scholar] [CrossRef] [PubMed]
- Meeten, G.H.; Wood, P. Optical fibre methods for measuring the diffuse reflectance of fluids. Meas. Sci. Technol. 1993, 4, 643–648. [Google Scholar] [CrossRef]
- Džimbeg-Malčić, V.; Barbarić-Mikočević, Ž.; Itrić, K. Kubelka-Munk theory in describing optical properties of paper (I). Tehnički Vjesnik 2011, 18, 117–124. [Google Scholar]
- Kubelka, P.; Munk, F. An Article on Optics of Paint Layers, Zeitschrift fur technische. Physik 1931, 12, 593. [Google Scholar]
- Martin, J.P.; Zarembowitch, J.; Dworkin, A.; Haasnoot, J.G.; Codjovi, E. Solid-state effects in spin transitions—Role of Iron (II) dilution in the magnetic and calorimetric properties of the series [FexNi1-x(4,4’-bis(1,2,4-triazole))2(NCS)2].H2O. Inorg. Chem. 1994, 33, 2617–2623. [Google Scholar] [CrossRef]
- Pillet, S.; Hubsch, J.; LeComte, C. Single crystal diffraction analysis of the thermal spin conversion of [ Fe(btr)2(NCS)2] (H2O): Evidence of spin-like domains formation. Eur. Phys. J. B 2006, 49, 265. [Google Scholar] [CrossRef]
- Kortum, G. Reflectance Spectroscopy; Springer: Berlin, Germany, 1969. [Google Scholar]
- Constant-Machado, H.; Stancu, A.; Liñares, J.; Varret, F. Thermal hysteresis loops in spin-crossover compounds analyzed in terms of classical Preisach model. IEEE Trans. Magn. 1998, 34, 2213–2219. [Google Scholar] [CrossRef]
- Rotaru, A.; Linares, J.; Varret, F.; Codjovi, E.; Slimani, A.; Tanasa, R.; Enachescu, C.; Stancu, A.; Haasnoot, J. Pressure effect investigated with first-order reversal-curve method on the spin-transition compounds FexZn1-x(btr)(2)(NCS)(2) center dot H2O (x=0.6,1). Phys. Rev. B 2011, 83, 224107. [Google Scholar] [CrossRef]
- Rusu, I.; Manolache-Rusu, I.C.; Diaconu, A.; Palamarciuc, O.; Gural’Skiy, I.A.; Molnar, G.; Rotaru, A. Pressure gradient effect on spin-crossover materials: Experiment vs theory. J. Appl. Phys. 2021, 129, 064501. [Google Scholar] [CrossRef]
- Mayergoyz, I.; Friedman, G. Generalized Preisach model of hysteresis. IEEE Trans. Magn. 1988, 24, 212–217. [Google Scholar] [CrossRef]
- Konig, E.; Kanellakopulos, B.; Powietzka, B.; Nelson, J. Hysteresis models and their application to the spin-state transition in dithiocyanatobis(2,2’-bi-2-thiazoline)Iron(II). J. Chem. Phys. 1993, 99, 9195–9201. [Google Scholar] [CrossRef]


Publisher’s Note: MDPI stays neutral with regard to jurisdictional claims in published maps and institutional affiliations. |
© 2021 by the authors. Licensee MDPI, Basel, Switzerland. This article is an open access article distributed under the terms and conditions of the Creative Commons Attribution (CC BY) license (https://creativecommons.org/licenses/by/4.0/).