A New Statistical Technique to Enhance MCGINAR(1) Process Estimates under Symmetric and Asymmetric Data: Fuzzy Time Series Markov Chain and Its Characteristics
Abstract
:1. Introduction
2. Fuzzy Time Series Markov Chain: A New Statistical Approach and Its Methodology
- Determine the universe set [], where and are, respectively, the smallest and largest values of the generated realizations from the MCGINAR(1) model, respectively.
- The universe set is partitioned into a number of identically sized intervals. The Sturges formula, log(N) + 1, can be used to determine how many intervals are required, and, to define the length of each interval l, formula is used.
- Generate fuzzy sets on and fuzzify the realizations produced by the MCGINAR(1) model.
- Based on the generated realizations from the MCGINAR(1) model, determine the fuzzy logic relationship.
- Establish fuzzy logic relation groups by creating groups from the fuzzy logic relations.
- As described in the previous stage, determine the transition probability matrix p based on the fuzzy logic relation group. The dimension of the Markov transition probability matrix is p by p, where p is the total number of fuzzy sets. The state transition probability is expressed as , where = transition probability from state to , number of transitions from state to , and = number of data included in state .
- Calculate the prediction value for the fuzzy observation.
- Rule 1: When data from the (t − 1) interval are included in and there are fuzzy sets, such as , which do not have fuzzy logic relations, the prediction value Ft is , which is the median of the interval on the fuzzy logic relation group that was developed in the (t − 1) data.
- Rule 2: If fuzzy logic relation group has a one-to-one relation (for example, , where and ), where the collected data are in (t − 1) time included in state , then the prediction value of is , where is the median of in the fuzzy logic relation group that formed on the (t − 1) data.
- Rule 3: If fuzzy logic relation group has a one-to-many relation (for example, , ), where the collected data are in (t − 1) time included in state , then the prediction value of is .
- Apply the result for the payment of the forecasting value.
- Rule 1: The adjustment value of is defined as , where l is the length of the interval if state is related to , starting from state at time as , and making an ascending transition to state at time t, where .
- Rule 2: The adjustment value of is defined as , where l if state is related to , starting from state at time as , and making a downward transition to state at time t, where .
- Rule 3: The trend adjustment value of is defined as , with s being the number of leaps ahead if the transition starts from state at time as , and jumps forward to state at time t where ().
- Rule 4: The trend adjustment value of is defined as , with being a lot of backward jumps if the transition starts from state at time as , and jumps back to state at time t where ().
- Adjust the predictive value of forecasting to ascertain the outcomes. If the fuzzy logic relation group is one-to-many and state can be retrieved from , where state is related to , the forecasting result is .
3. The MCGINAR(1) Process
4. Higher-Order Joint Moments, Central Moments, and Spectral Density Functions
5. Estimation of Spectral Density Functions
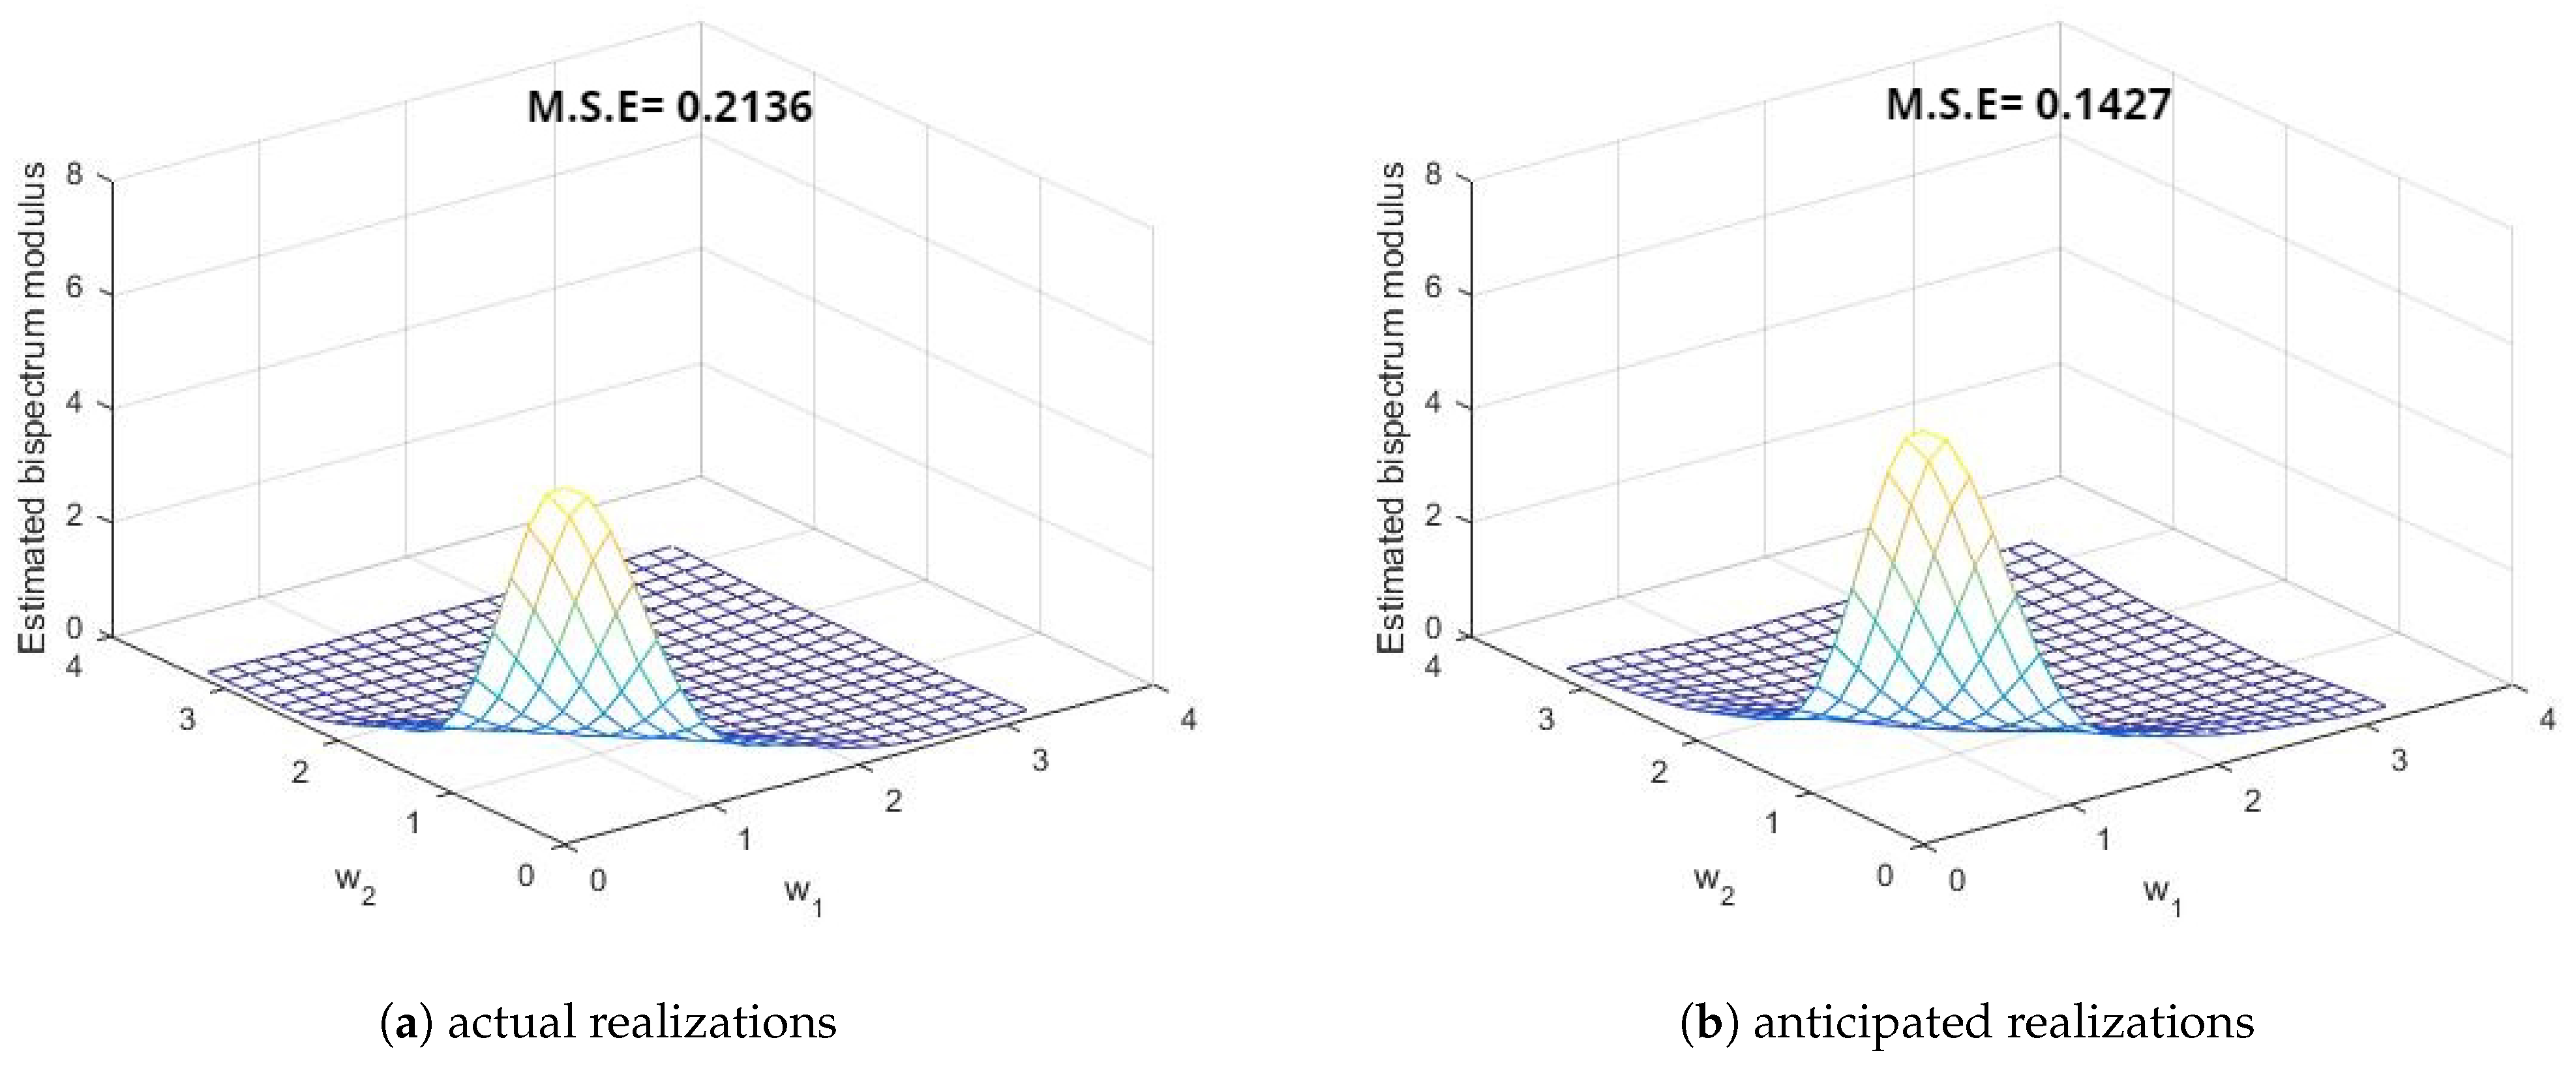
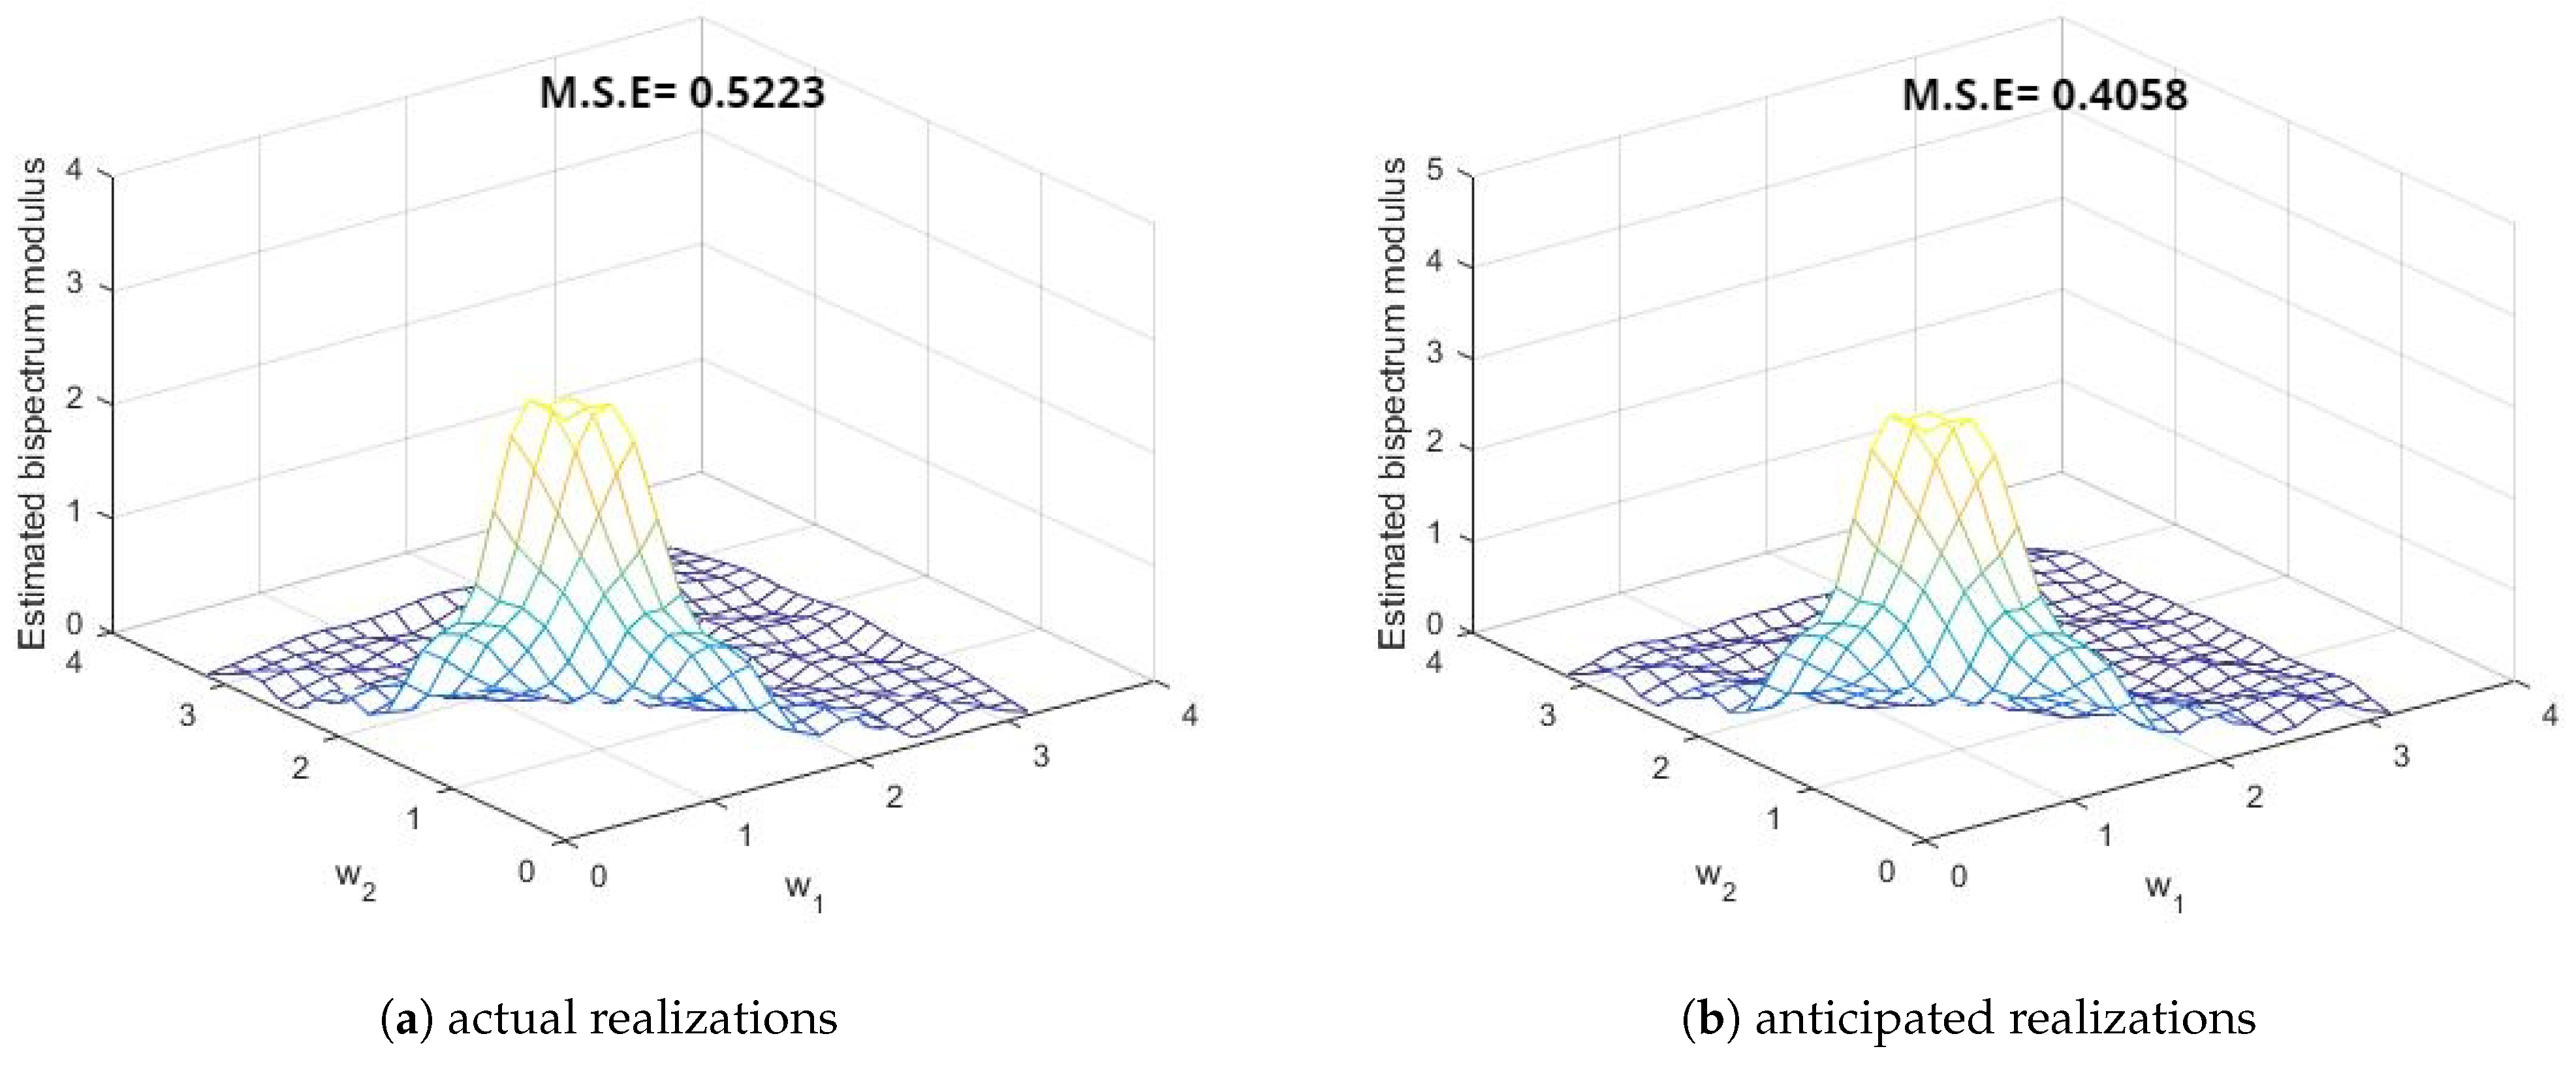
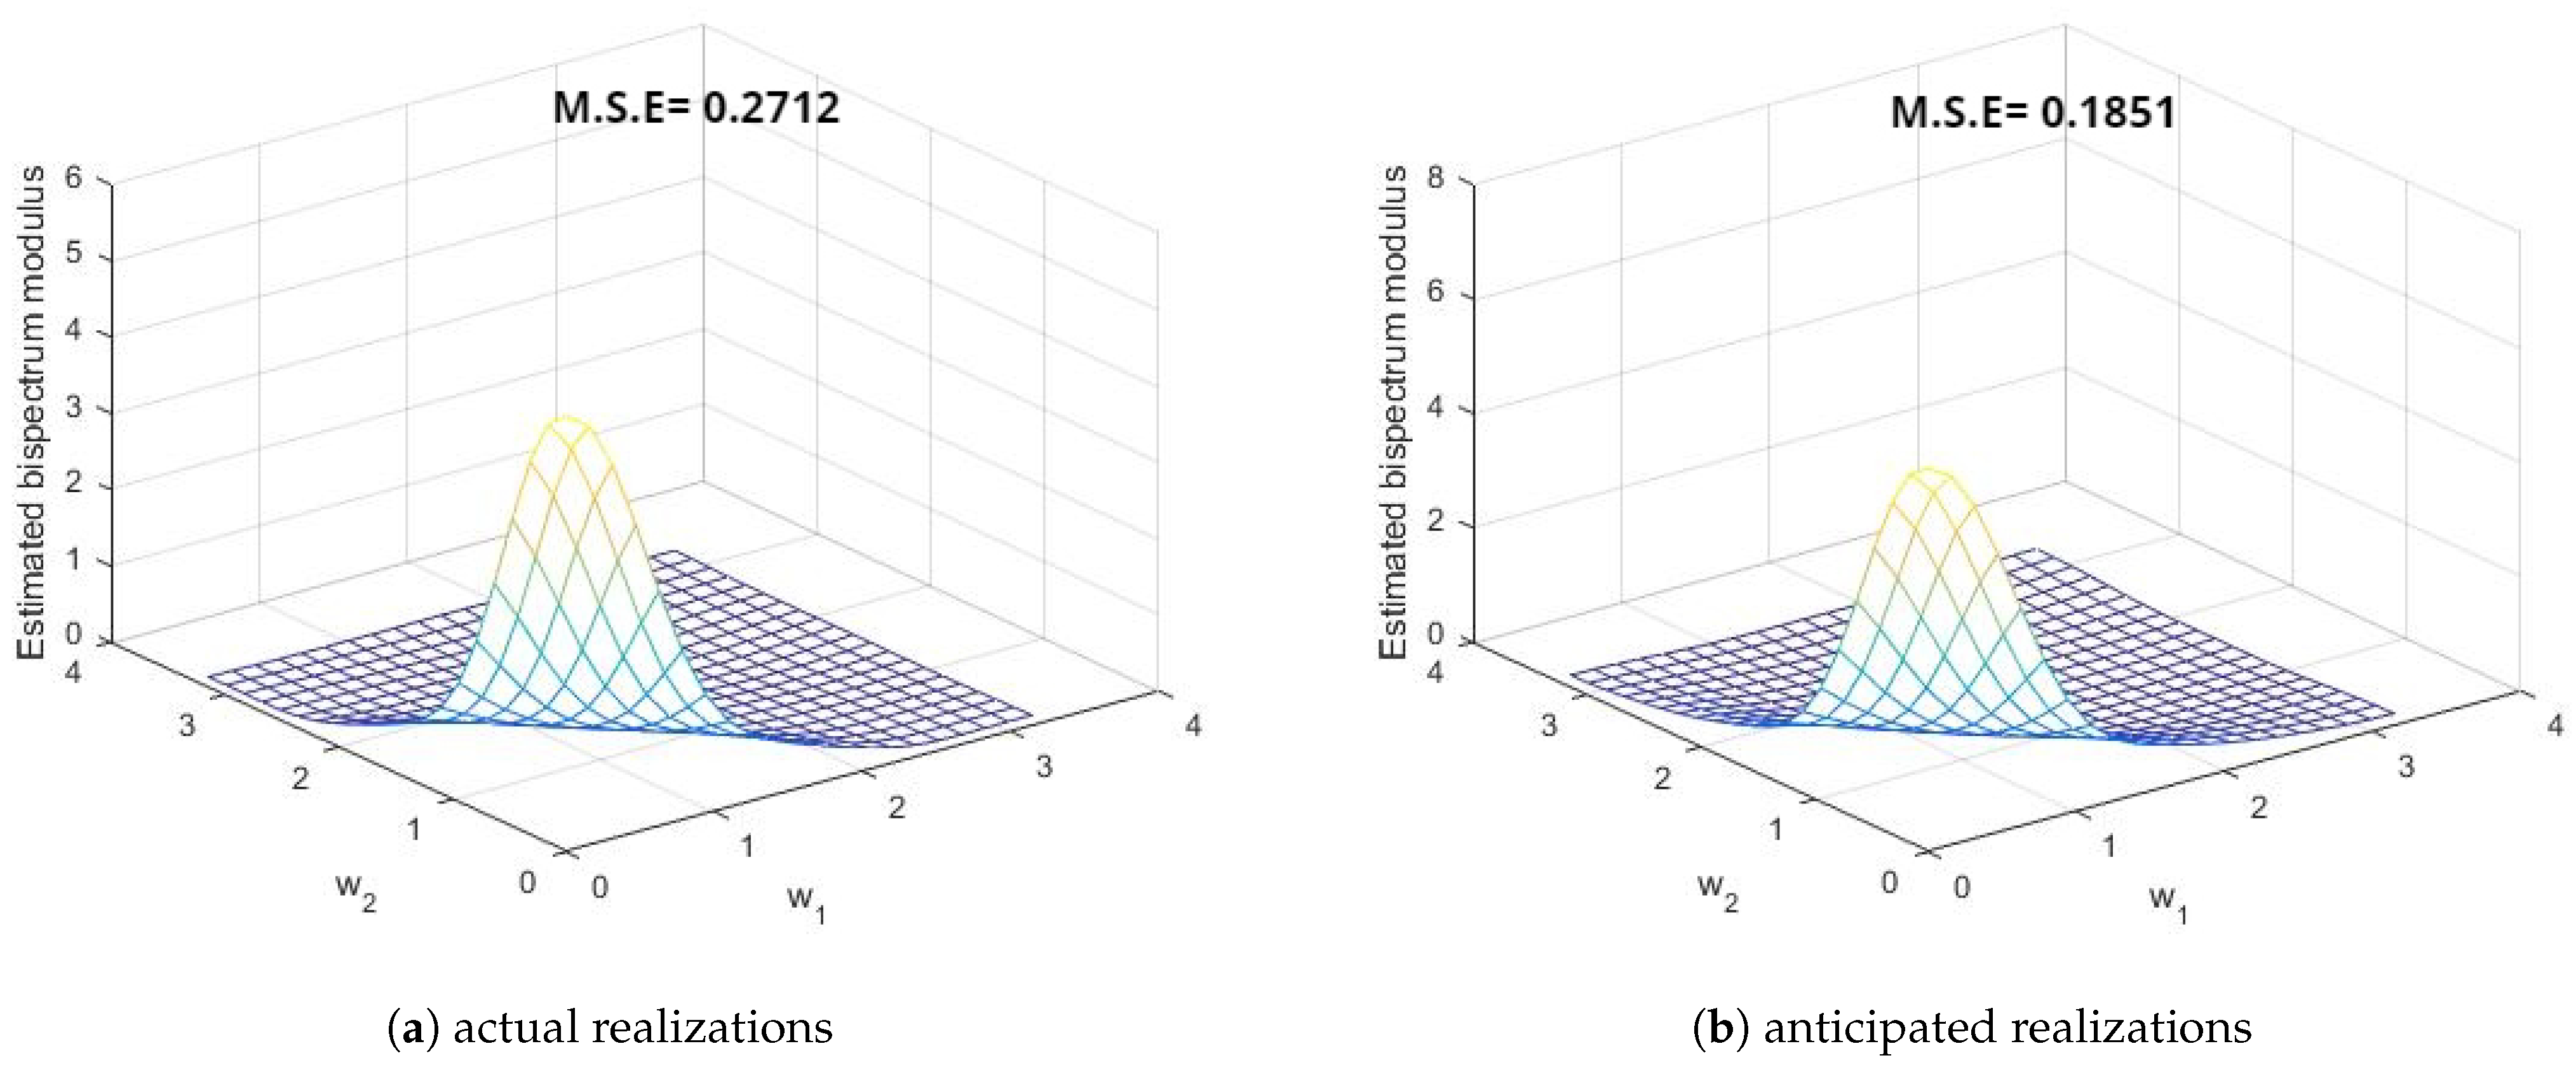
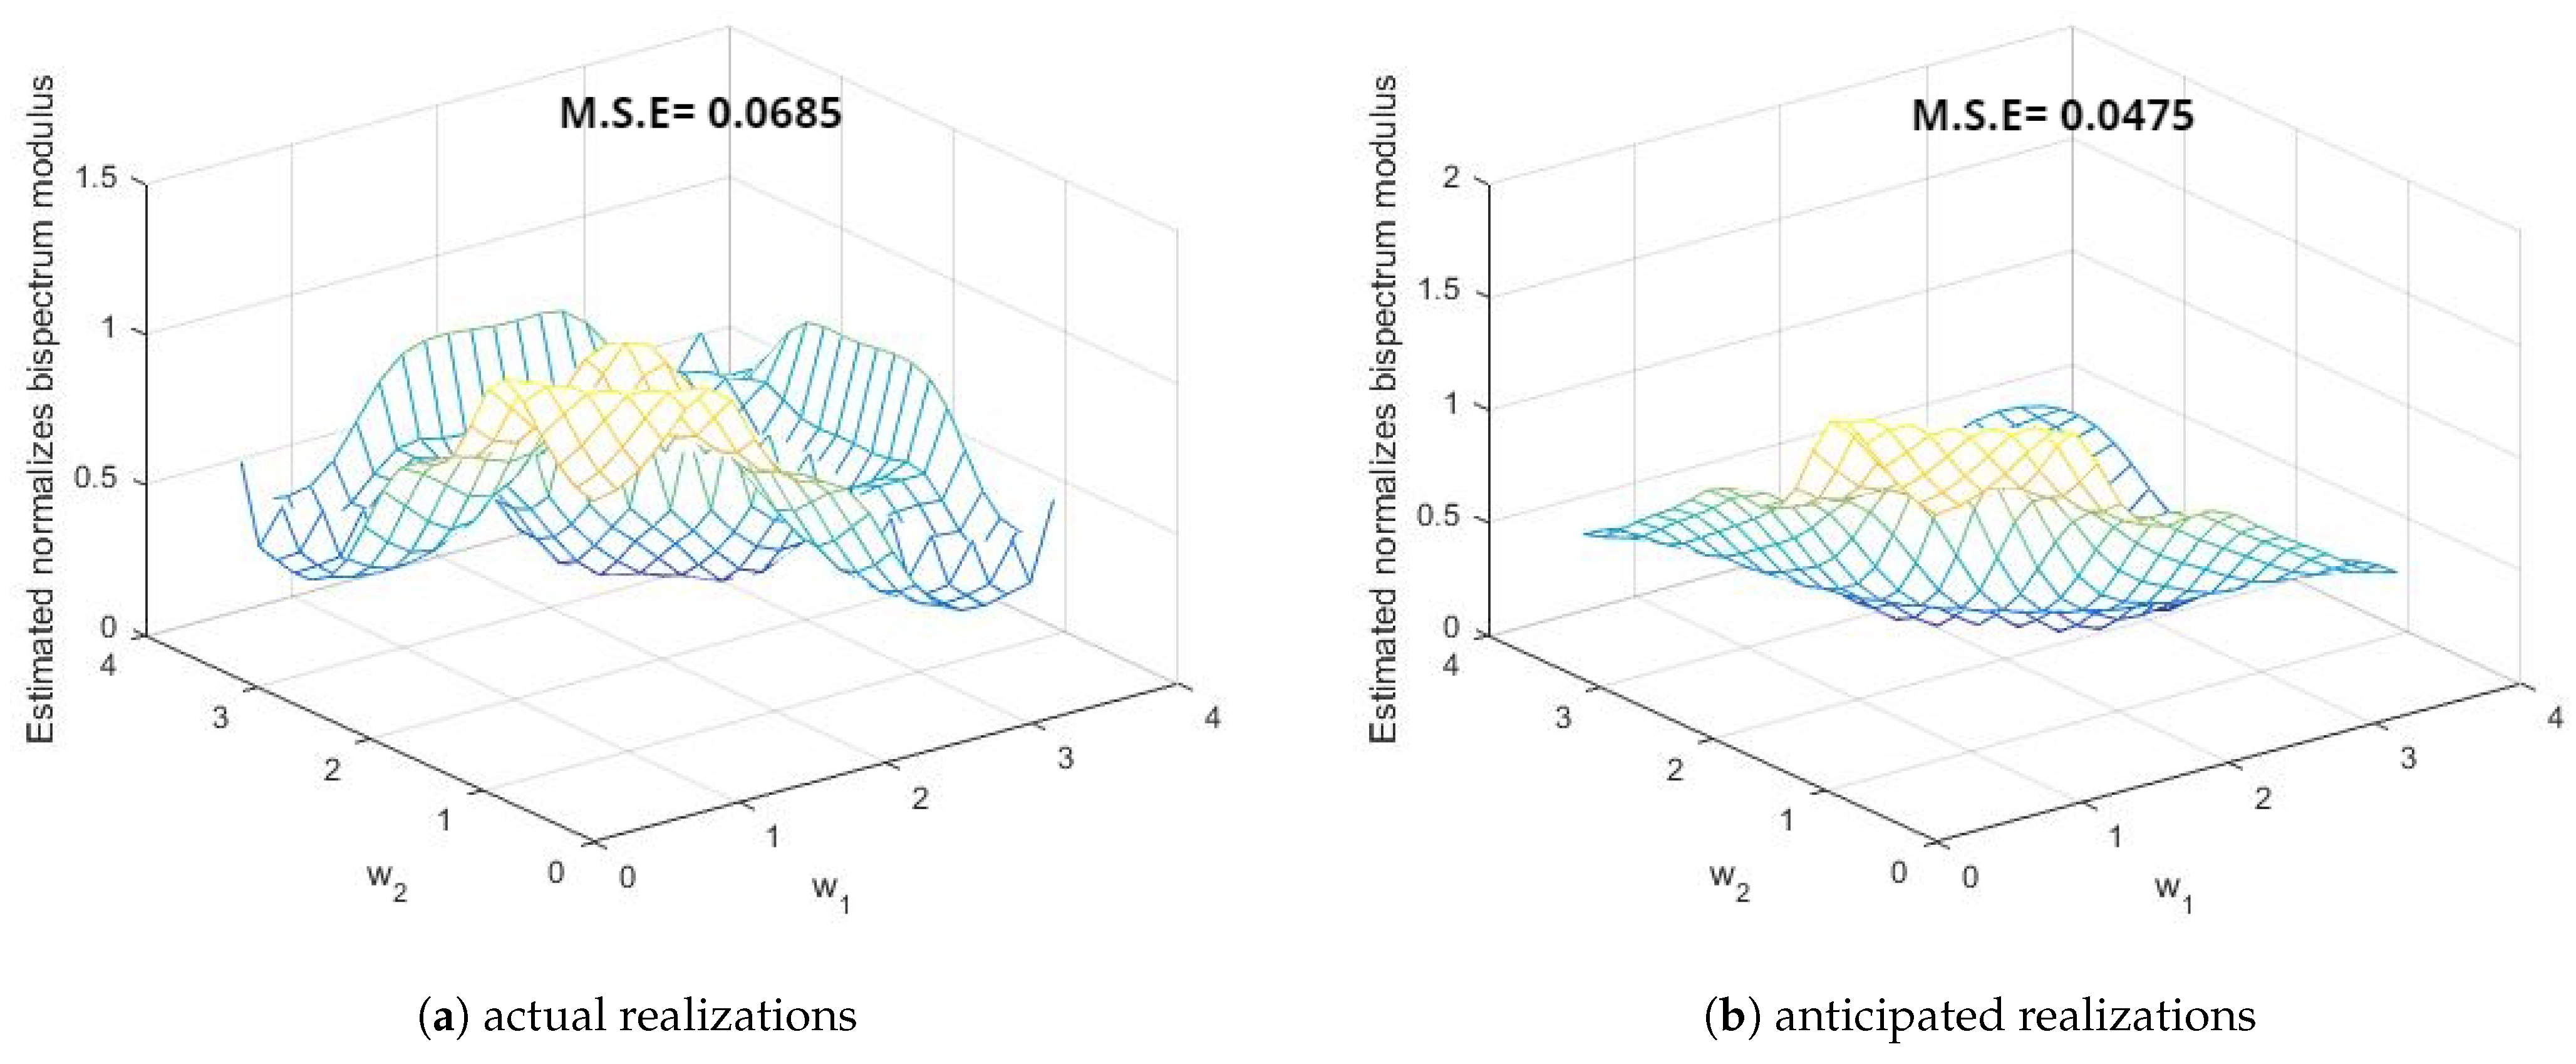
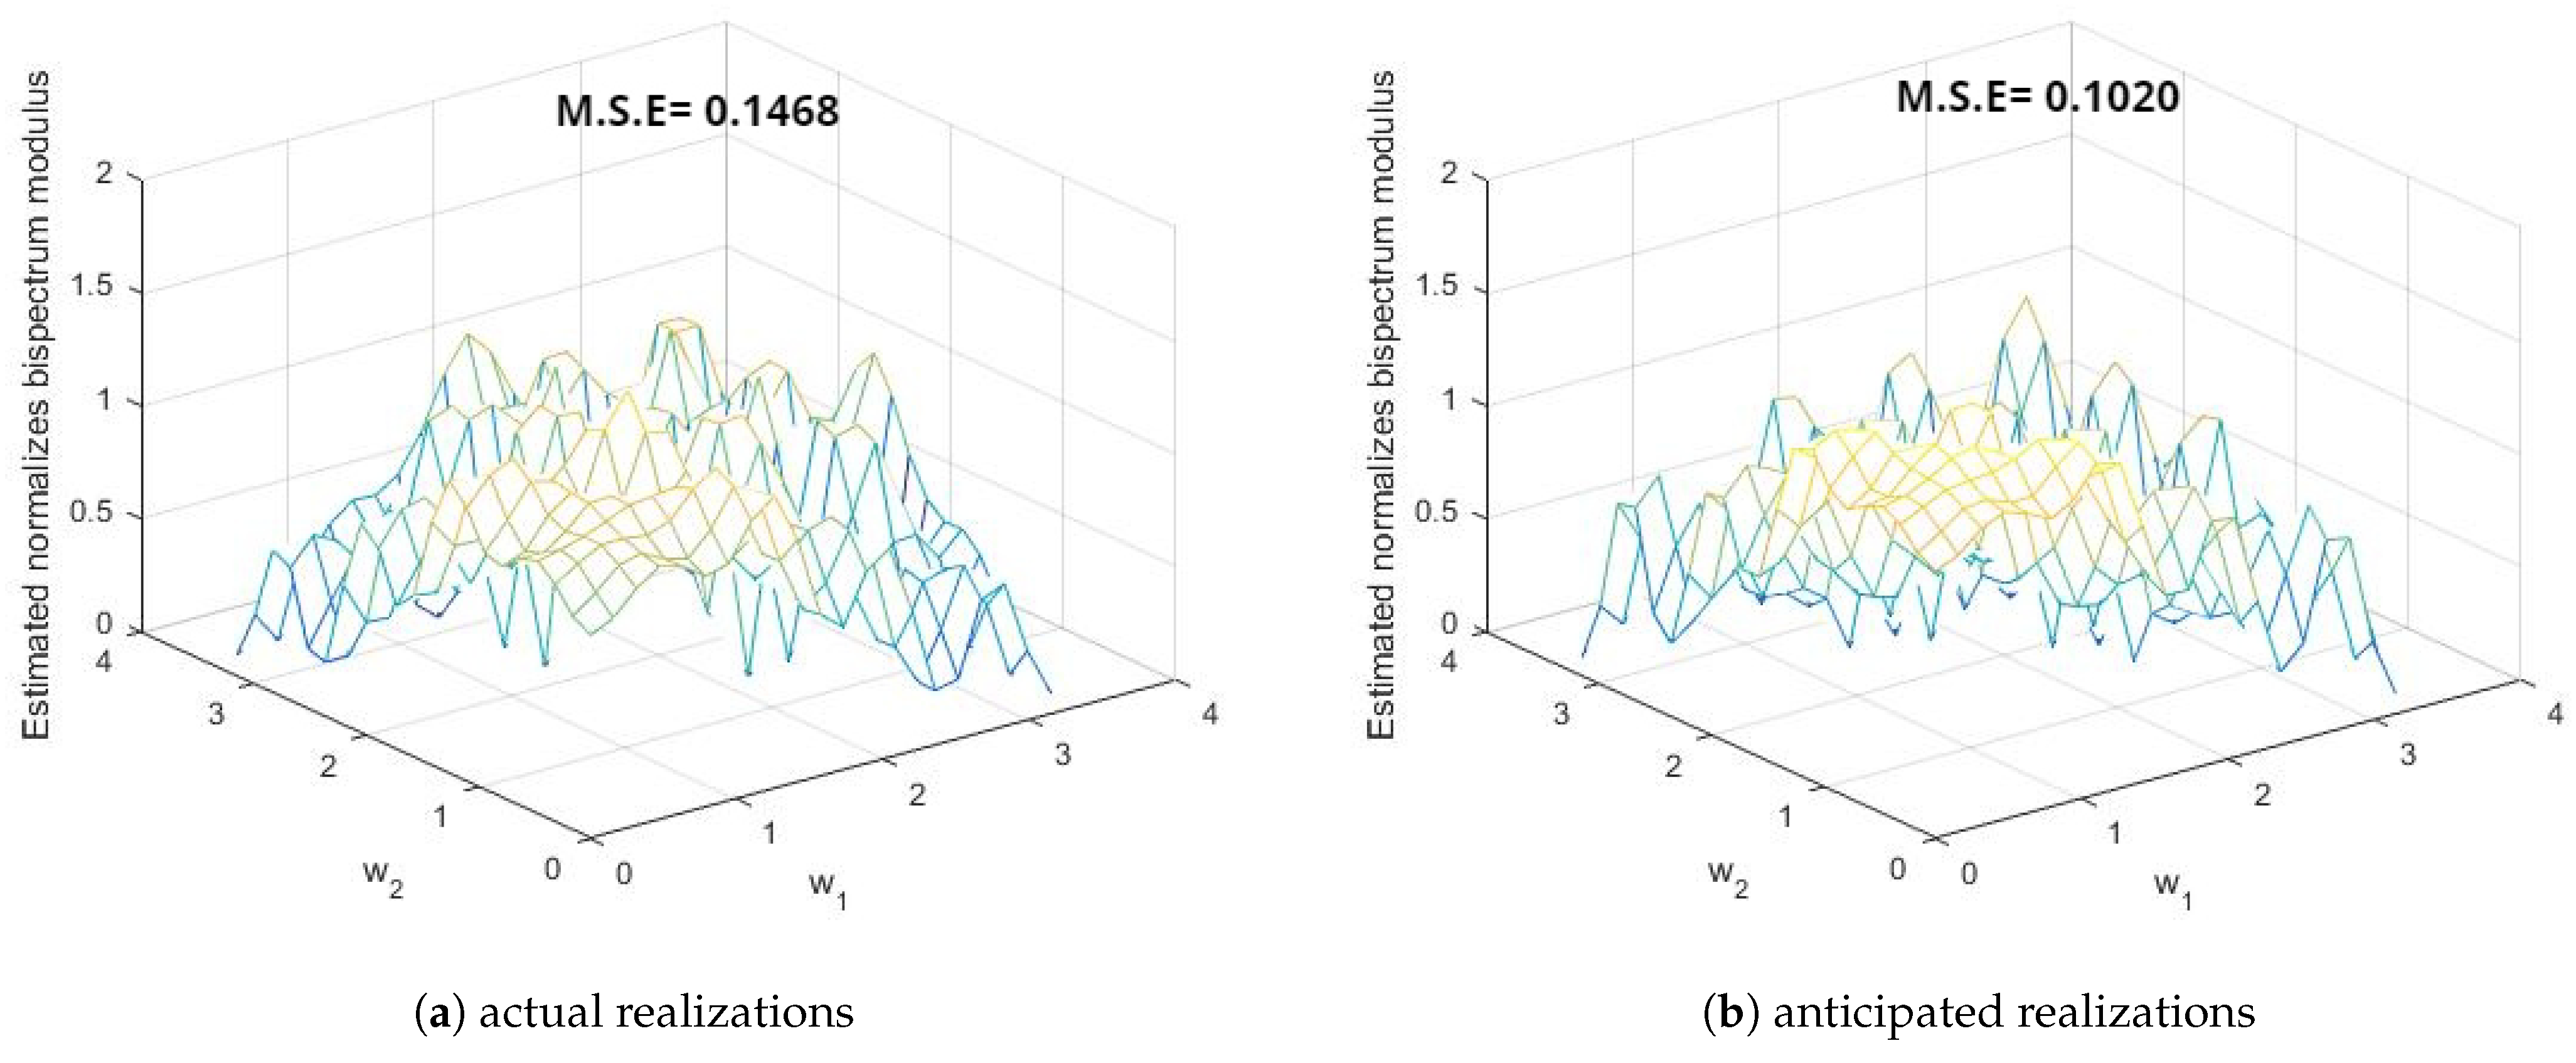
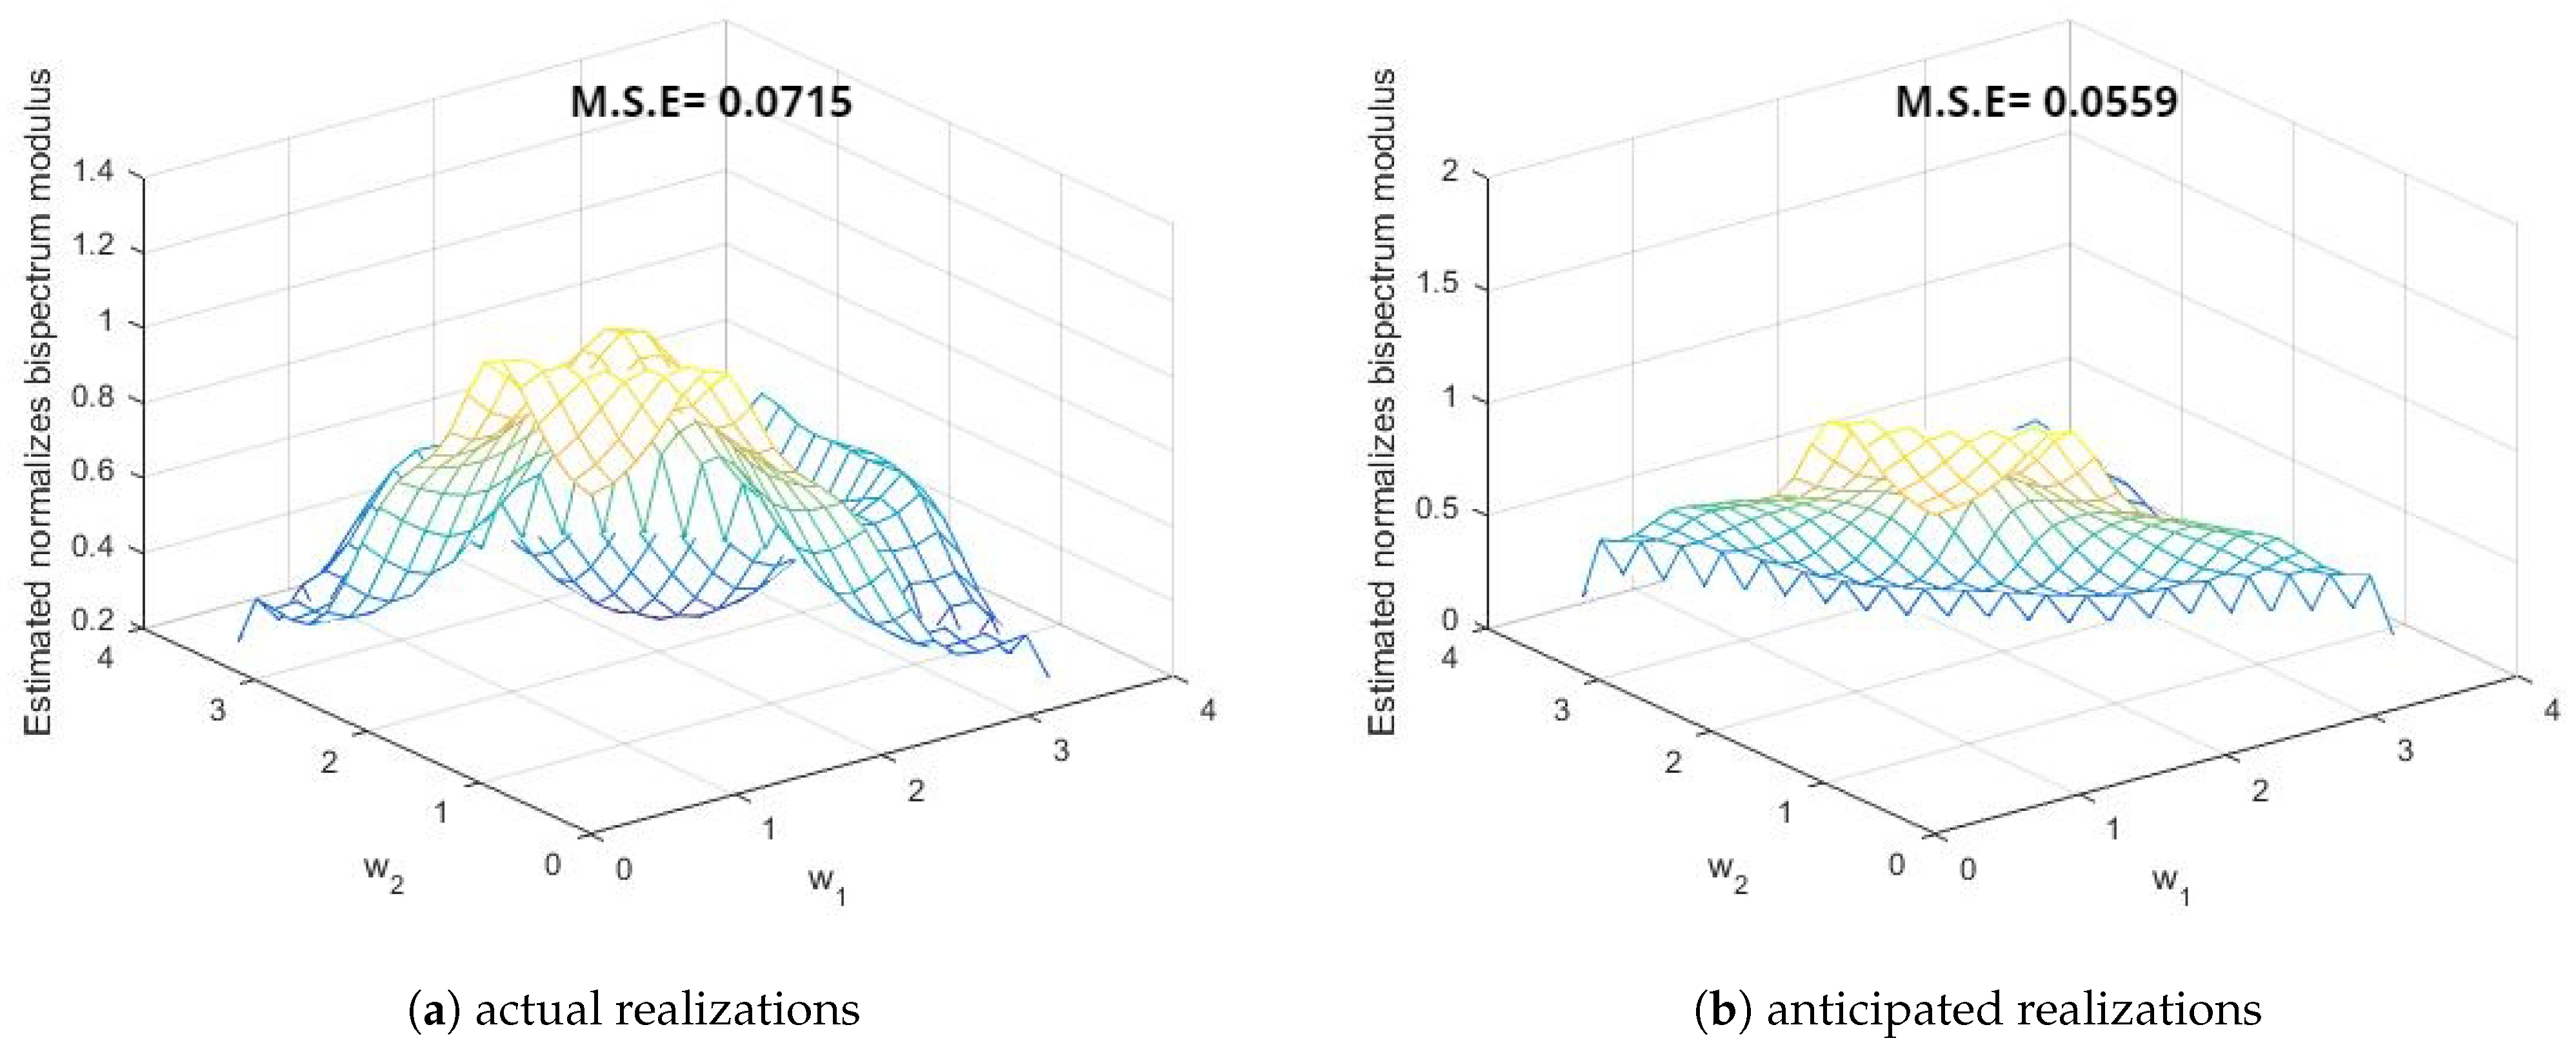
- These three points demonstrate the improvement in the smoothed estimates of the spectral density functions by the different windows in favor of anticipated realizations using FTSMC, as opposed to the realizations generated directly from the first-order MCGINAR process. This implies that FTSMC makes a positive contribution to smoothing estimation.
6. Conclusions
Author Contributions
Funding
Data Availability Statement
Acknowledgments
Conflicts of Interest
References
- Song, Q.; Chissom, B.S. Fuzzy time series and its models. Fuzzy Sets Syst. 1993, 54, 269–277. [Google Scholar] [CrossRef]
- Alyousifi, Y.; Othman, M.; Almohammedi, A.A. A novel stochastic fuzzy time series forecasting model based on a new partition method. IEEE Access 2021, 9, 80236–80252. [Google Scholar] [CrossRef]
- Alyousifi, Y.; Othman, M.; Sokkalingam, R.; Faye, I.; Silva, P.C. Predicting daily air pollution index based on fuzzy time series markov chain model. Symmetry 2020, 12, 293. [Google Scholar] [CrossRef] [Green Version]
- Hariyanto, S.; Udjiani, T. Fuzzy time series Markov Chain and Fuzzy time series Chen & Hsu for forecasting. J. Phys. Conf. Ser. 2021, 1943, 012128. [Google Scholar]
- Salawudeen, A.T.; Mu’azu, M.B.; Adedokun, E.A.; Baba, B.A. Optimal determination of hidden Markov model parameters for fuzzy time series forecasting. Sci. Afr. 2022, 16, e01174. [Google Scholar] [CrossRef]
- McKenzie, E. Autoregressive moving-average processes with negative-binomial and geometric marginal distributions. Adv. Appl. Probab. 1986, 18, 679–705. [Google Scholar] [CrossRef]
- Al-Osh, M.A.; Aly, E.A.A. First order autoregressive time series with negative binomial and geometric marginals. Commun. Stat.-Theory Methods 1992, 21, 2483–2492. [Google Scholar] [CrossRef]
- Alzaid, A.; Al-Osh, M. First-order integer-valued autoregressive (INAR(1)) process: Distributional and regression properties. Stat. Neerl. 1988, 42, 53–61. [Google Scholar] [CrossRef]
- Bakouch, H.S.; Ristić, M.M. Zero truncated Poisson integer-valued AR(1) model. Metrika 2010, 72, 265–280. [Google Scholar] [CrossRef]
- Alzaid, A.A.; Al-Osh, M.A. Some autoregressive moving average processes with generalized Poisson marginal distributions. Ann. Inst. Stat. Math. 1993, 45, 223–232. [Google Scholar] [CrossRef]
- Jin-Guan, D.; Yuan, L. The integer-valued autoregressive (INAR(p)) model. J. Time Ser. Anal. 1991, 12, 129–142. [Google Scholar] [CrossRef]
- Aly, E.A.A.; Bouzar, N. Explicit stationary distributions for some Galton-Watson processes with immigration. Stoch. Models 1994, 10, 499–517. [Google Scholar] [CrossRef]
- Latour, A. Existence and stochastic structure of a non-negative integer-valued autoregressive process. J. Time Ser. Anal. 1998, 19, 439–455. [Google Scholar] [CrossRef]
- Ristić, M.M.; Bakouch, H.S.; Nastić, A.S. A new geometric first-order integer-valued autoregressive (NGINAR(1)) process. J. Stat. Plan. Inference 2009, 139, 2218–2226. [Google Scholar] [CrossRef]
- Ristić, M.M.; Nastić, A.S.; Bakouch, H.S. Estimation in an integer-valued autoregressive process with negative binomial marginals (NBINAR(1)). Commun.-Stat. Theory Methods 2012, 41, 606–618. [Google Scholar] [CrossRef]
- Ristić, M.M.; Nastić, A.S.; Jayakumar, K.; Bakouch, H.S. A bivariate INAR(1) time series model with geometric marginals. Appl. Math. Lett. 2012, 25, 481–485. [Google Scholar] [CrossRef] [Green Version]
- Nastić, A.S.; Ristić, M.M. Some geometric mixed integer-valued autoregressive (INAR) models. Stat. Probab. Lett. 2012, 82, 805–811. [Google Scholar] [CrossRef]
- Nastić, A.S.; Ristić, M.M.; Bakouch, H.S. A combined geometric INAR(p) model based on negative binomial thinning. Math. Comput. Model. 2012, 55, 1665–1672. [Google Scholar] [CrossRef]
- Zheng, H.; Basawa, I.V.; Datta, S. First-order random coefficient integer-valued autoregressive processes. J. Stat. Plan. Inference 2007, 137, 212–229. [Google Scholar] [CrossRef]
- Gomes, D.; Castro, L.C. Generalized integer-valued random coefficient for a first order structure autoregressive (RCINAR) process. J. Stat. Plan. Inference 2009, 139, 4088–4097. [Google Scholar] [CrossRef]
- Wang, D.; Zhang, H. Generalized RCINAR(p) process with signed thinning operator. Commun. Stat. Comput. 2010, 40, 13–44. [Google Scholar] [CrossRef]
- Ristić, M.M.; Nastić, A.S.; Miletić, A.V. A geometric time series model with dependent Bernoulli counting series. J. Time Ser. Anal. 2013, 34, 466–476. [Google Scholar] [CrossRef]
- Gabr, M.M.; El-Desouky, B.S.; Shiha, F.A.; El-Hadidy, S.M. Higher Order Moments, Spectral and Bispectral Density Functions for INAR(1). Int. J. Comput. Appl. 2018, 182, 0975–8887. [Google Scholar]
- Miletić, A.V.; Ristić, M.M.; Nastić, A.S.; Bakouch, H.S. An INAR(1) model based on a mixed dependent and independent counting series. J. Stat. Comput. Simul. 2018, 88, 290–304. [Google Scholar] [CrossRef]
- Teamah, A.A.M.; Faied, H.M.; El-Menshawy, M.H. Effect of Fuzzy Time Series Technique on Estimators of Spectral Analysis. In Recent Advances in Mathematical Research and Computer Science; B P International: London, UK, 2022; Volume 6, pp. 29–38. [Google Scholar]
- El-menshawy, M.H.; Teamah, A.A.M.; Abu-Youssef, S.E.; Faied, H.M. Higher Order Moments, Cumulants, Spectral and Bispectral Density Functions of the ZTPINAR(1) Process. Appl. Math 2022, 16, 213–225. [Google Scholar]
- El-Morshedy, M.; El-Menshawy, M.H.; Almazah, M.M.A.; El-Sagheer, R.M.; Eliwa, M.S. Effect of fuzzy time series on smoothing estimation of the INAR(1) process. Axioms 2022, 11, 423. [Google Scholar] [CrossRef]
- Afnisah, N.; Marpaung, F. A Comparison of the Fuzzy Time Series Methods of Chen, Cheng and Markov Chain in Predicting Rainfall in Medan. J. Phys. Conf. Ser. 2020, 1462, 012044. [Google Scholar]
- Rukhansah, N.; Muslim, M.A.; Arifudin, R. Peramalan Harga Emas Menggunakan Fuzzy Time Series Markov Chain Model. Komputaki 2016, 2. [Google Scholar]
- Safitri, Y.; Wahyuningsih, S.; Goejantoro, R. Peramalan Dengan Metode Fuzzy Time Series Markov Chain. Eksponensial 2018, 9, 51–58. [Google Scholar]
- Steutel, F.W.; van Harn, K. Discrete analogues of self-decomposability and stability. In The Annals of Probability; Institute of Mathematical Statistics: Beachwood, OH, USA, 1979; pp. 893–899. [Google Scholar]
- Rao, T.S.; Gabr, M.M. An Introduction to Bispectral Analysis and Bilinear Time Series Models; Springer Science & Business Media: Berlin, Germany, 1984; Volume 24. [Google Scholar]
- Daniell, P.J. Discussion on symposium on autocorrelation in time series. J. R. Stat. Soc. 1946, 8, 88–90. [Google Scholar]
- Blackman, R.B.; Tukey, J.W. Particular pairs of windows. In The Measurement of Power Spectra, from the Point of View of Communications Engineering; Nokia Bell Labs: Murray Hill, NJ, USA, 1959; pp. 98–99. [Google Scholar]
- Parzen, E. Mathematical considerations in the estimation of spectra. Technometrics 1961, 3, 167–190. [Google Scholar] [CrossRef]

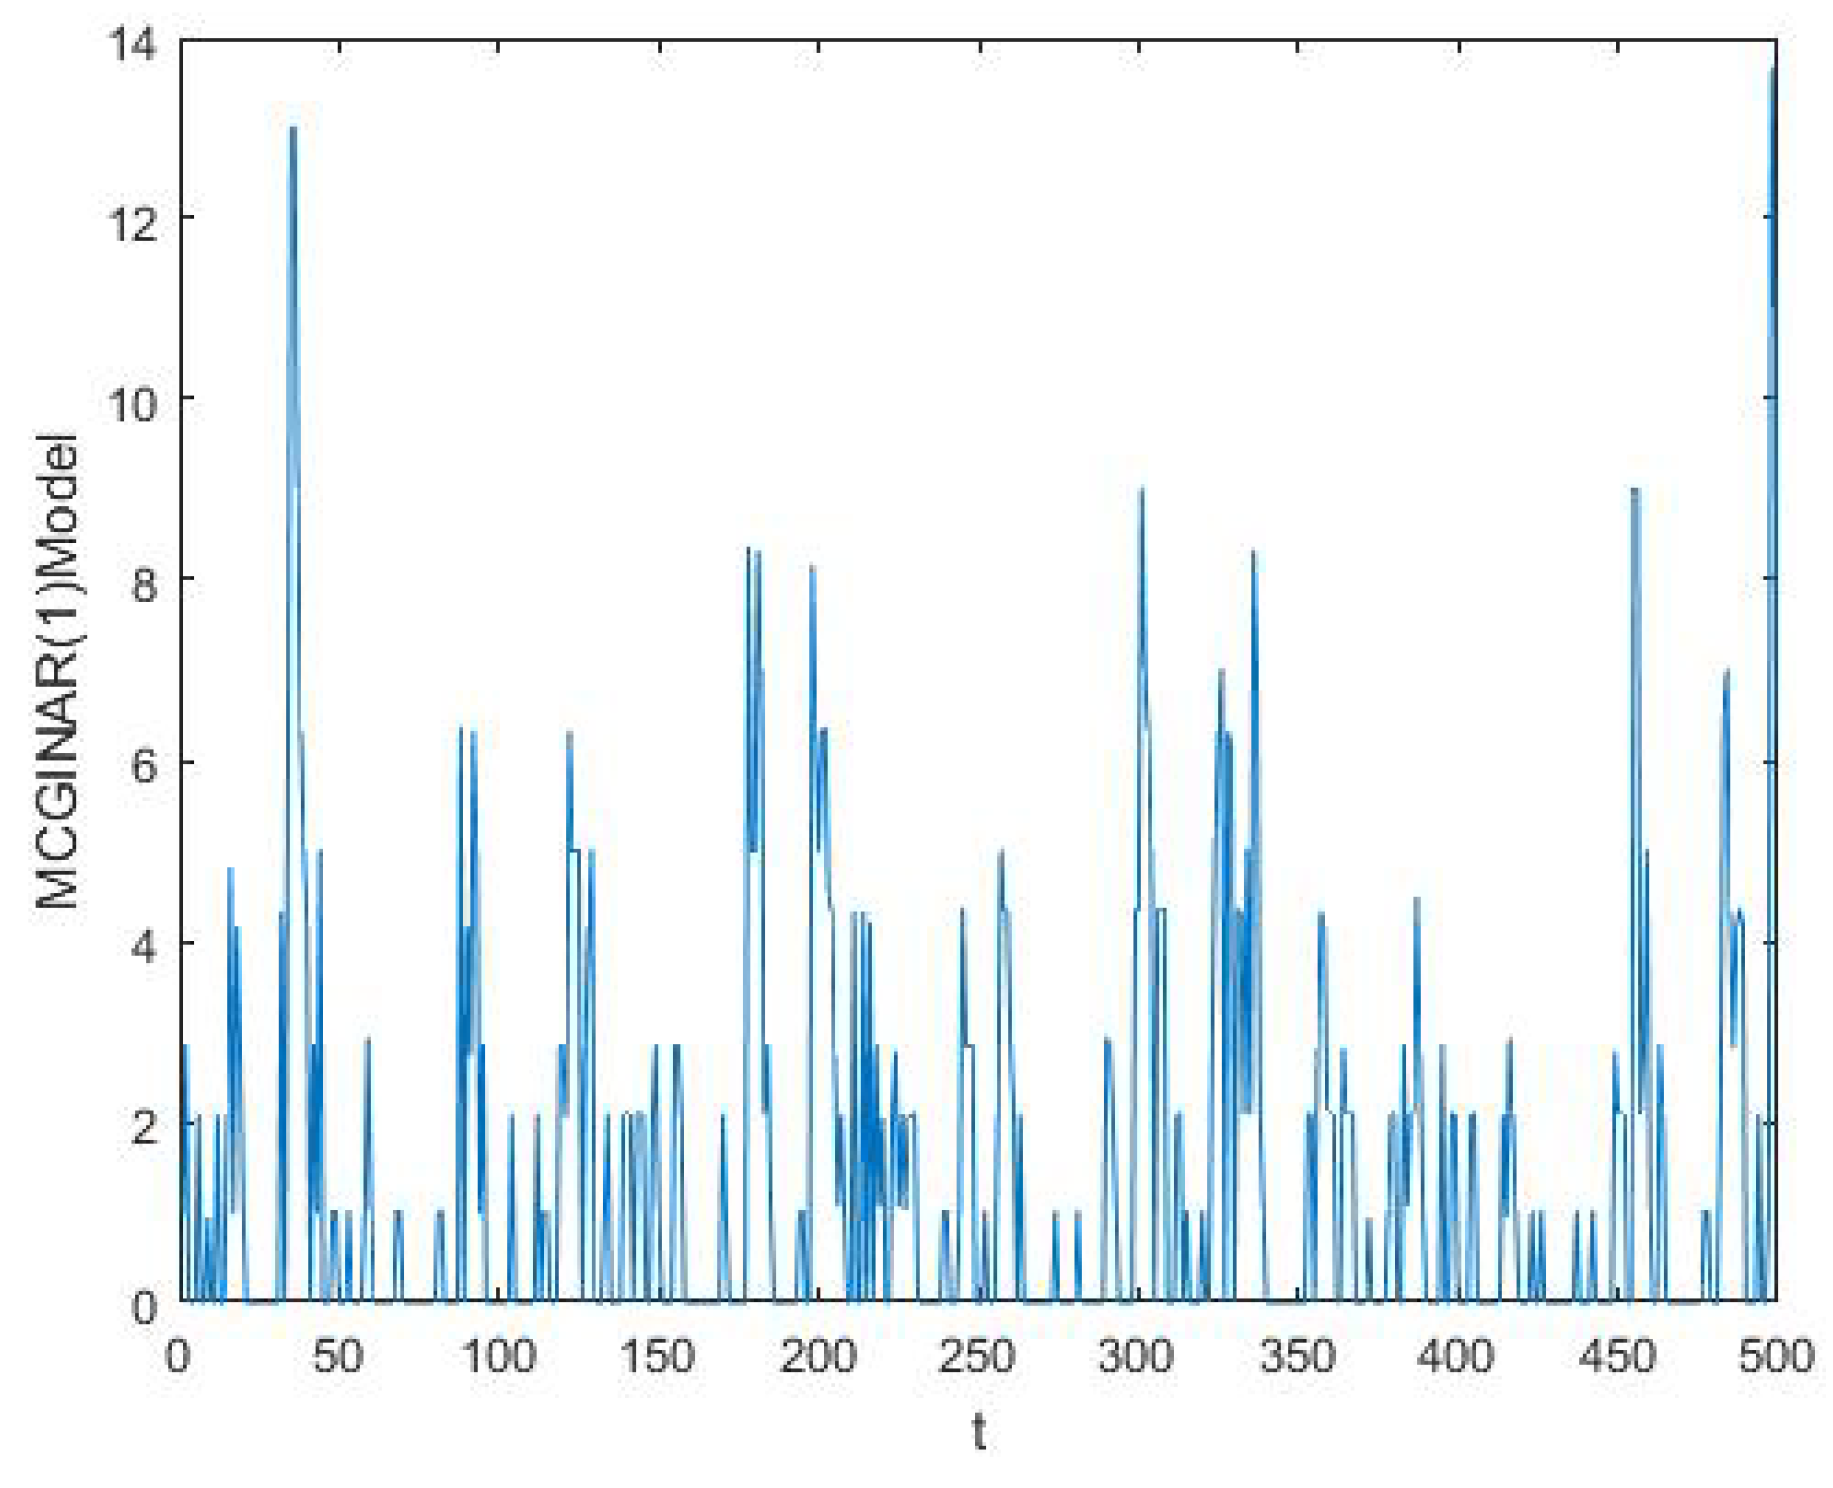
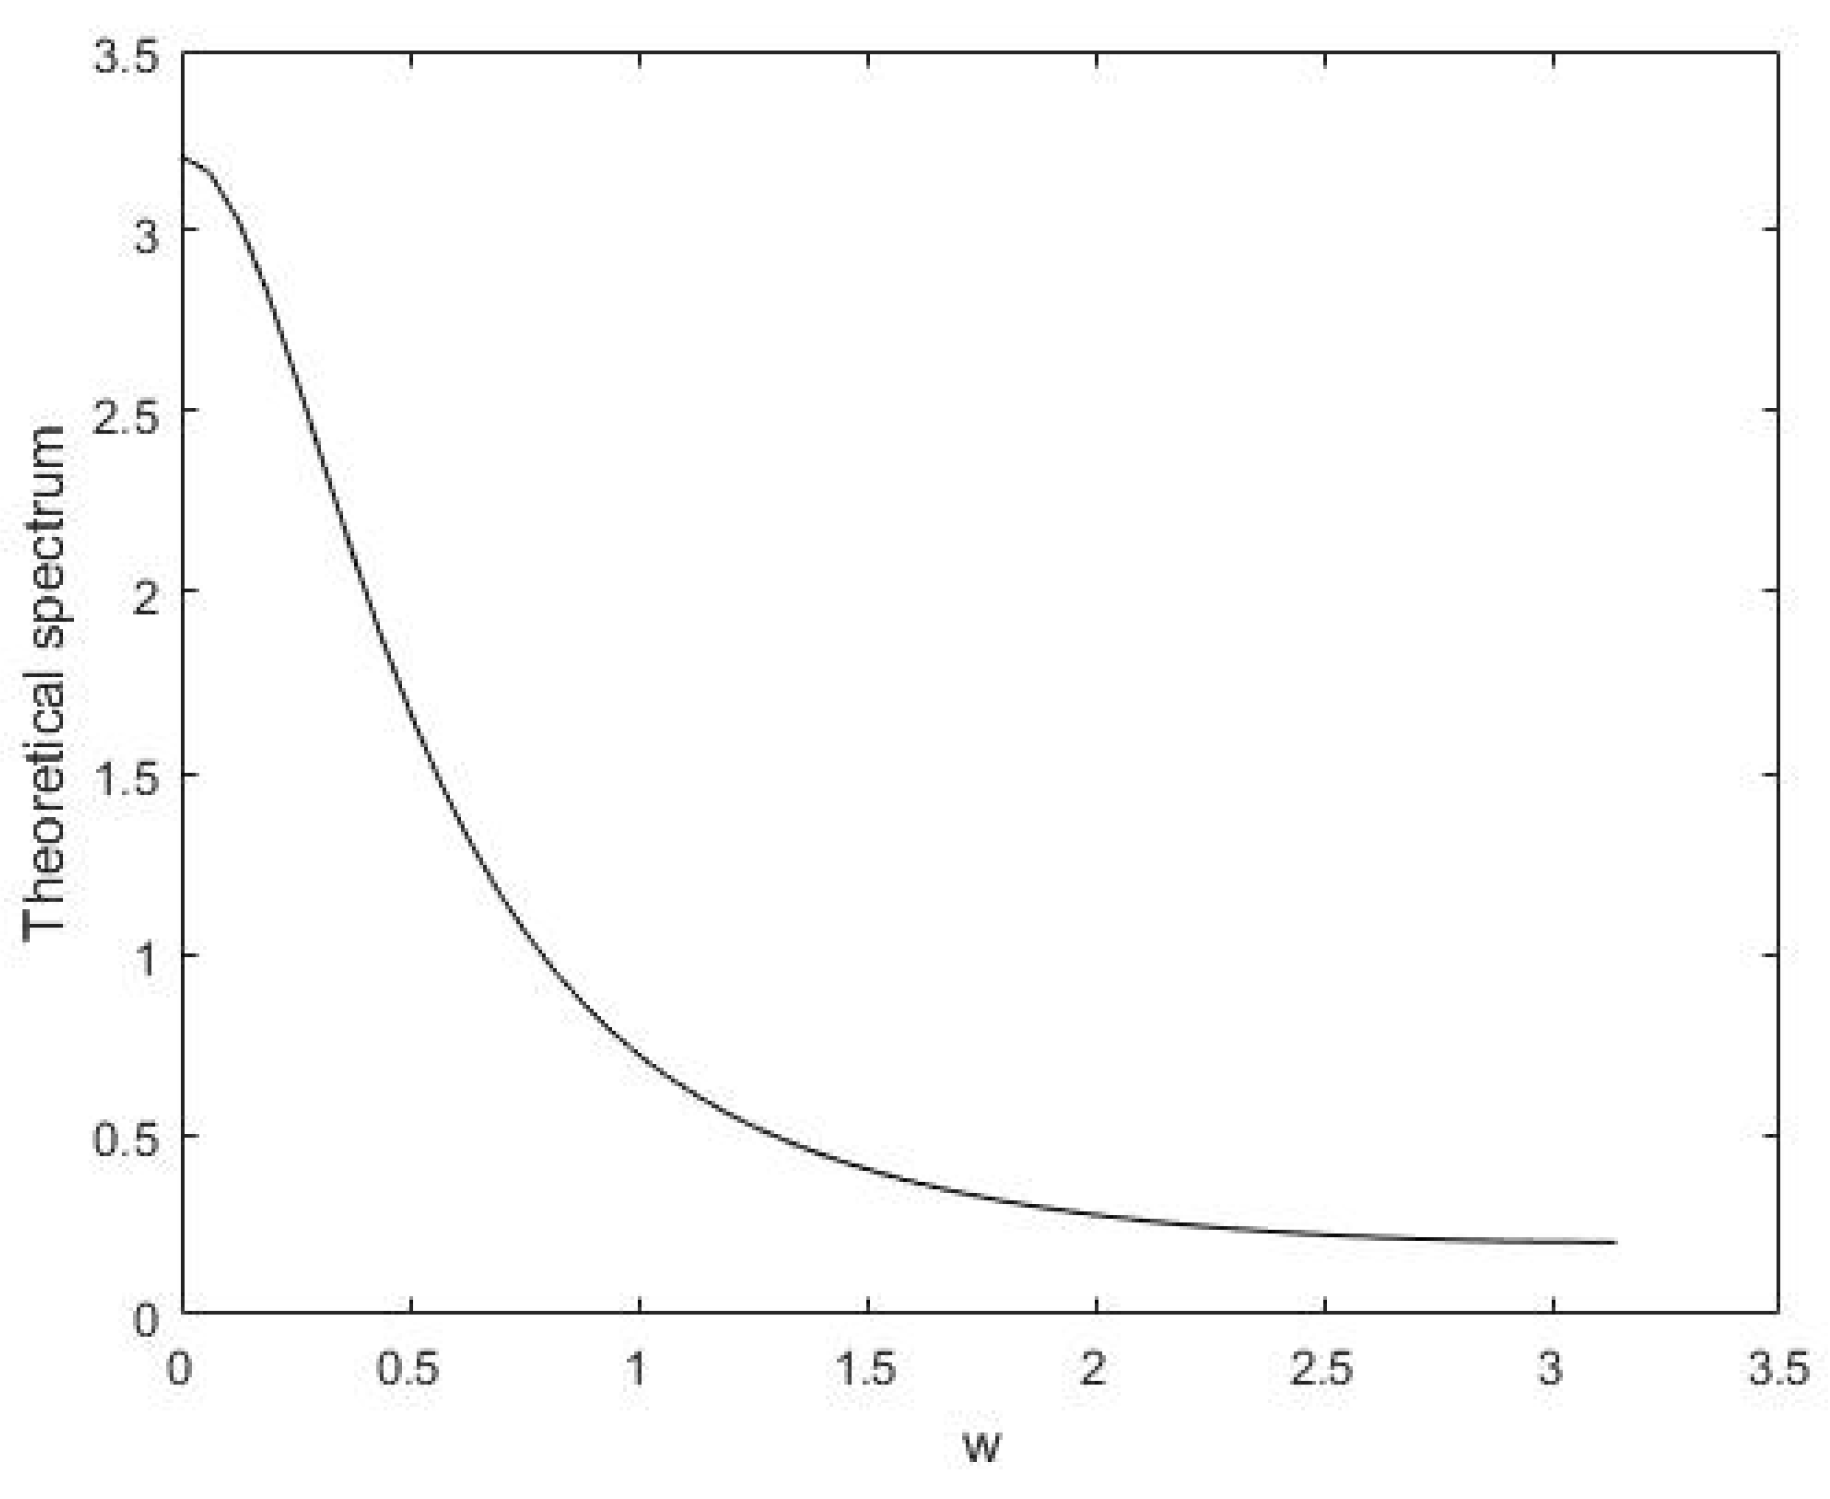


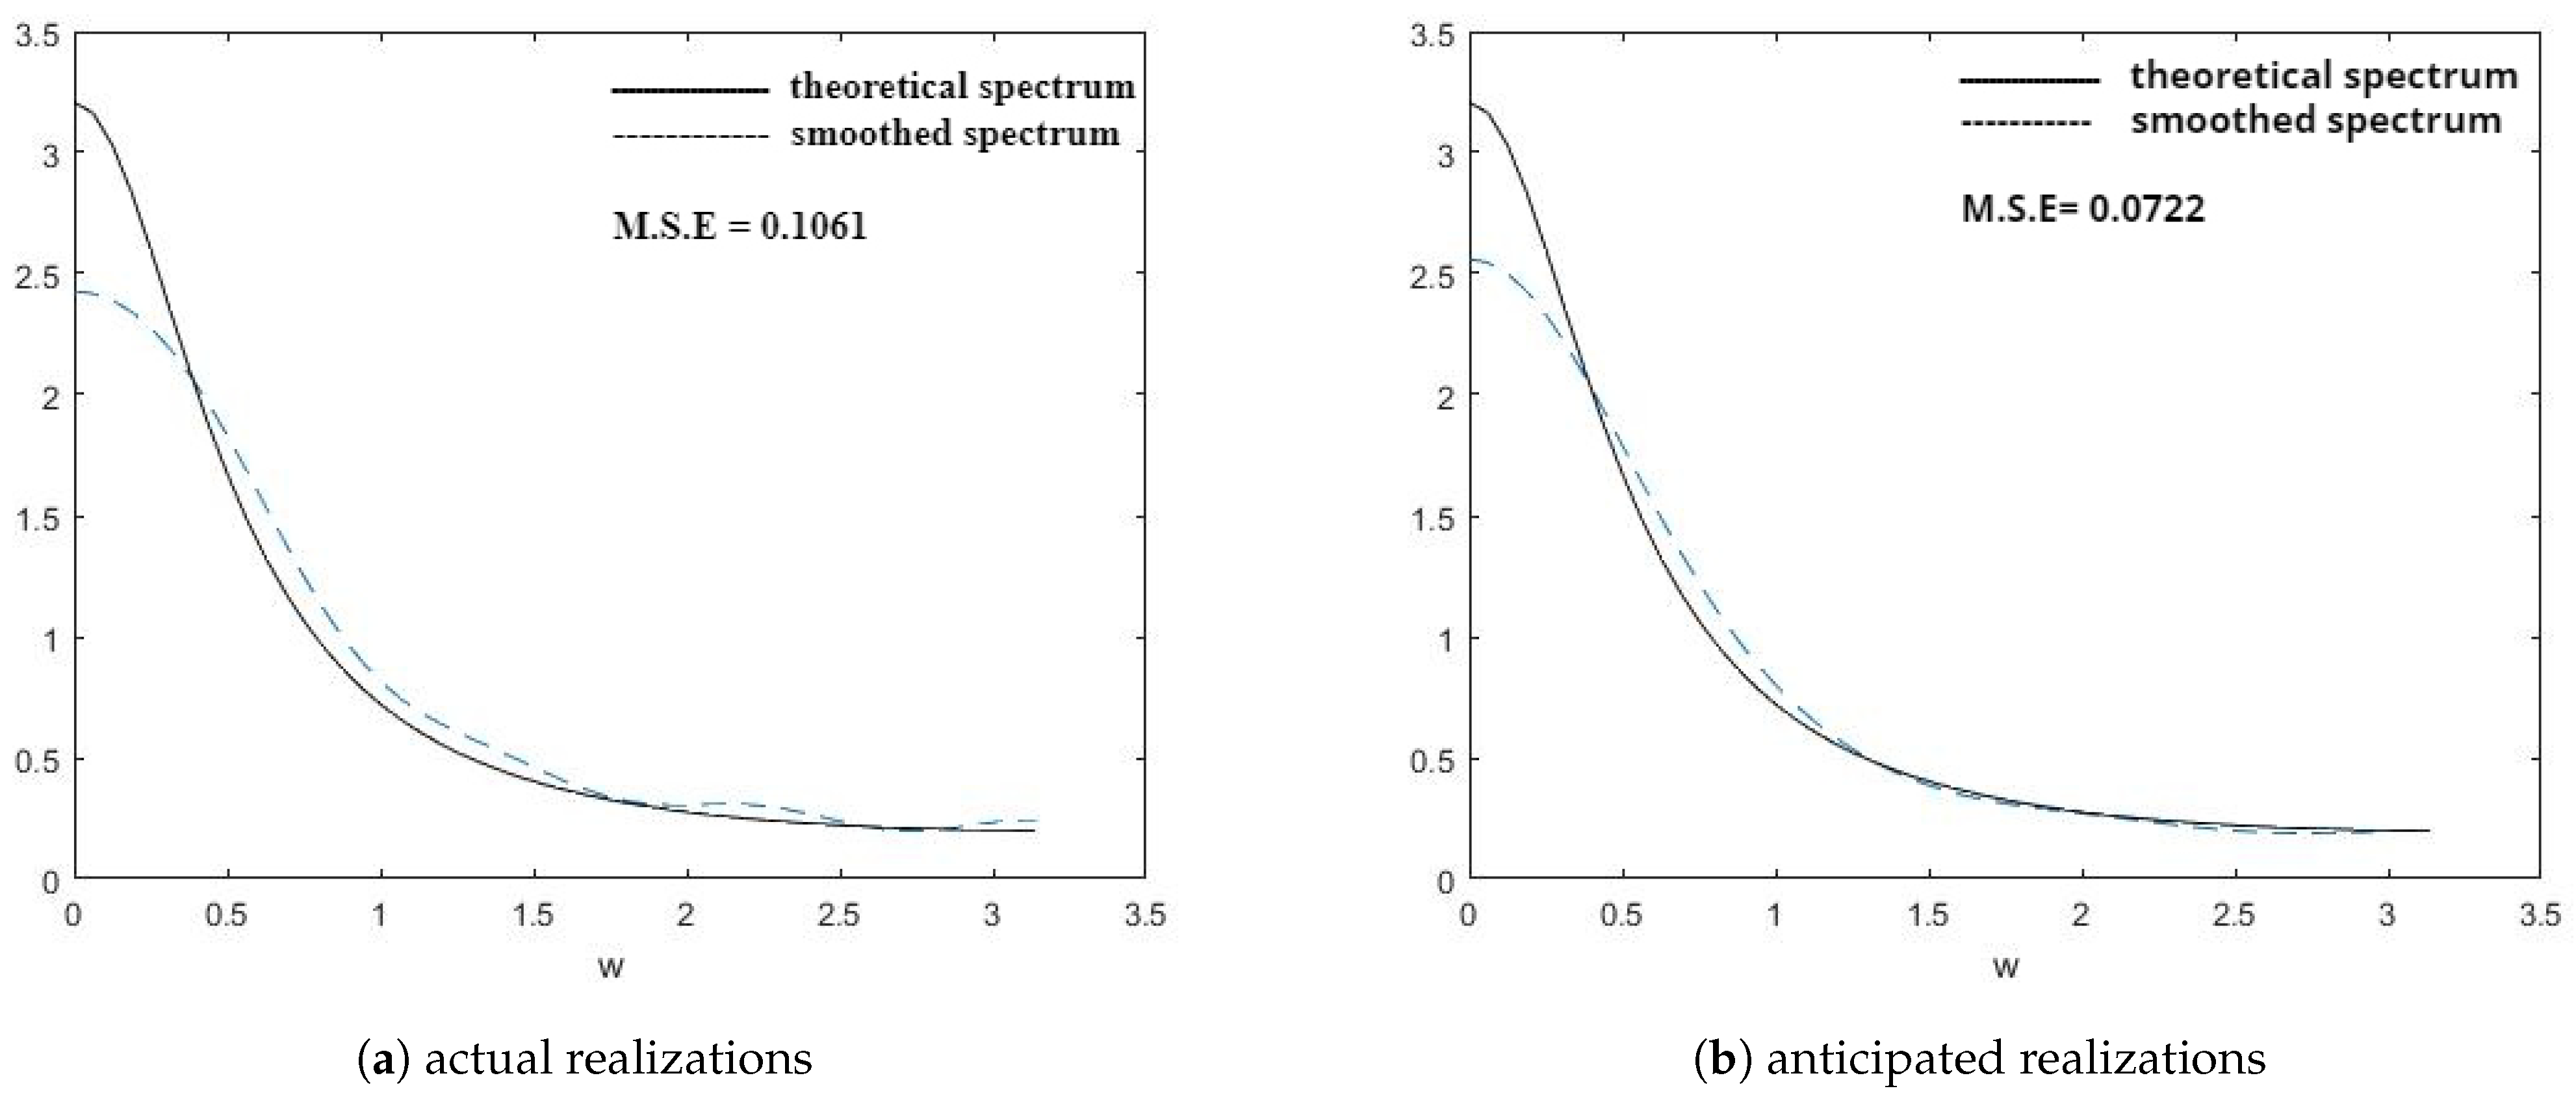
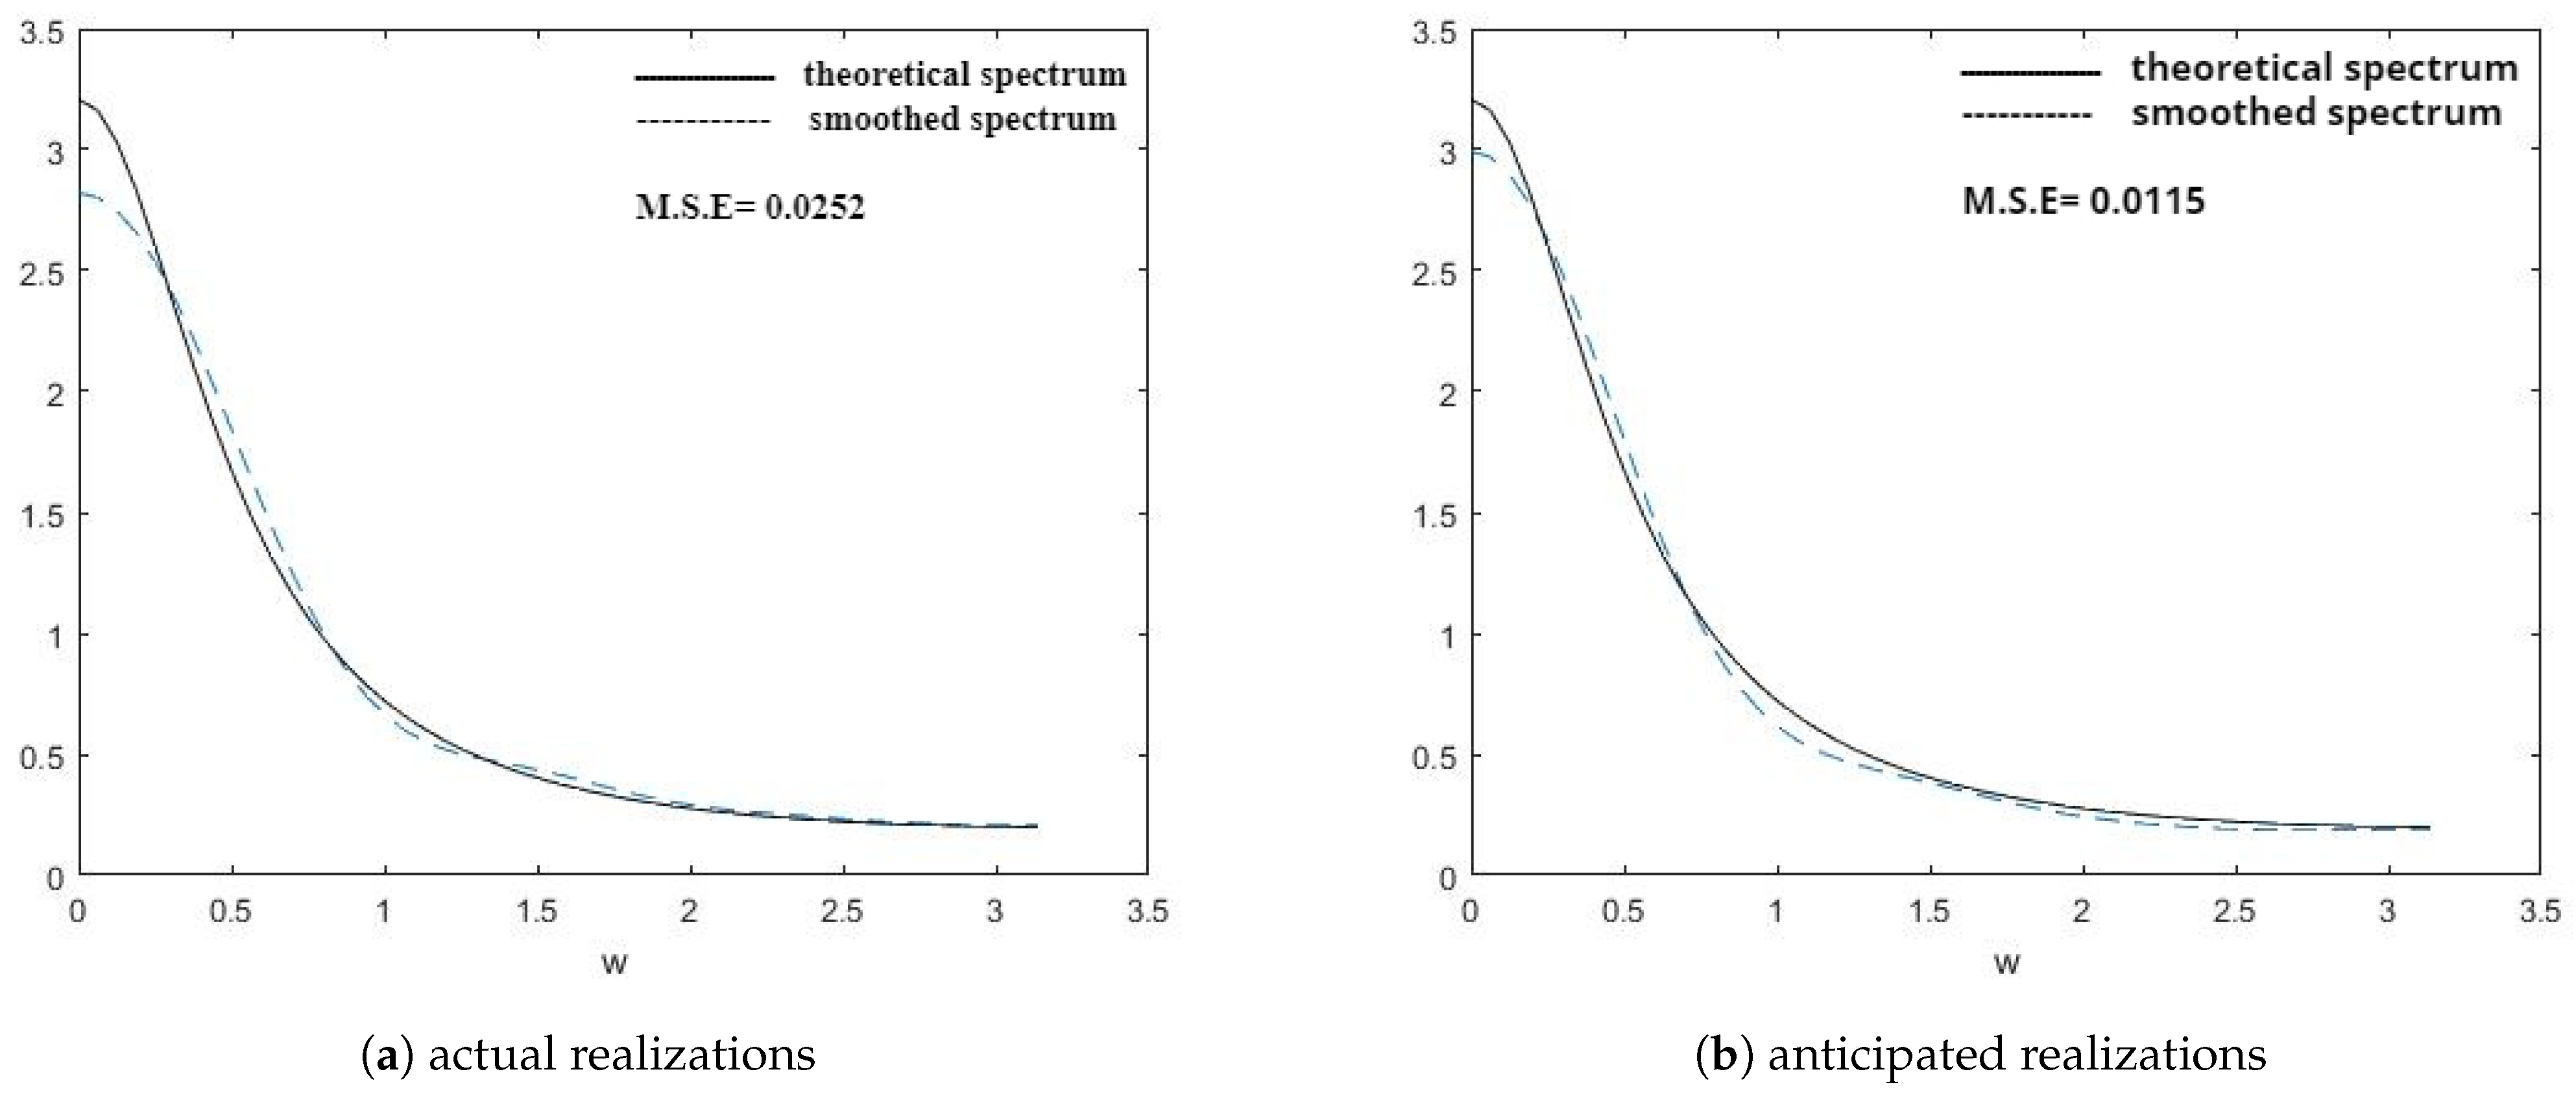
| 0.00 | 0.05 | 0.10 | 0.15 | 0.20 | 0.25 | 0.30 | 0.35 | 0.40 | 0.45 | 0.50 | 0.55 | 0.60 | 0.65 | 0.70 | 0.75 | 0.80 | 0.85 | 0.90 | 0.95 | |||
|---|---|---|---|---|---|---|---|---|---|---|---|---|---|---|---|---|---|---|---|---|---|---|
| 0.00 | 11.937 | 10.436 | 7.4683 | 4.9546 | 3.3081 | 2.2974 | 1.6713 | 1.2702 | 1.0033 | 0.8192 | 0.6882 | 0.5927 | 0.5216 | 0.4681 | 0.4275 | 0.3967 | 0.3737 | 0.3570 | 0.3457 | 0.3391 | 0.3370 | |
| 0.05 | 10.436 | 8.2535 | 5.6847 | 3.7802 | 2.5711 | 1.8253 | 1.3556 | 1.0492 | 0.8417 | 0.6966 | 0.5921 | 0.5152 | 0.4576 | 0.4141 | 0.3811 | 0.3562 | 0.3379 | 0.3249 | 0.3167 | 0.3126 | 0.3126 | |
| 0.10 | 7.4683 | 5.6847 | 3.9216 | 2.6524 | 1.8404 | 1.3310 | 1.0046 | 0.7884 | 0.6401 | 0.5352 | 0.4591 | 0.4028 | 0.3605 | 0.3286 | 0.3044 | 0.2864 | 0.2734 | 0.2645 | 0.2594 | 0.2577 | 0.2594 | |
| 0.15 | 4.9546 | 3.7802 | 2.6524 | 1.8287 | 1.2912 | 0.9477 | 0.7243 | 0.5744 | 0.4707 | 0.3969 | 0.3430 | 0.3030 | 0.2730 | 0.2504 | 0.2334 | 0.2209 | 0.2121 | 0.2065 | 0.2038 | 0.2038 | 0.2065 | |
| 0.20 | 3.3081 | 2.5711 | 1.8404 | 1.2912 | 0.9248 | 0.6868 | 0.5301 | 0.4240 | 0.3501 | 0.2972 | 0.2585 | 0.2298 | 0.2083 | 0.1921 | 0.1801 | 0.1715 | 0.1657 | 0.1623 | 0.1612 | 0.1623 | 0.1657 | |
| 0.25 | 2.2974 | 1.8253 | 1.3310 | 0.9477 | 0.6868 | 0.5150 | 0.4007 | 0.3229 | 0.2683 | 0.2292 | 0.2005 | 0.1792 | 0.1634 | 0.1515 | 0.1429 | 0.1369 | 0.1330 | 0.1312 | 0.1312 | 0.1330 | 0.1369 | |
| 0.30 | 1.6713 | 1.3556 | 1.0046 | 0.7243 | 0.5301 | 0.4007 | 0.3140 | 0.2546 | 0.2128 | 0.1828 | 0.1608 | 0.1446 | 0.1325 | 0.1236 | 0.1172 | 0.1130 | 0.1105 | 0.1097 | 0.1105 | 0.1130 | 0.1172 | |
| 0.35 | 1.2702 | 1.0492 | 0.7884 | 0.5744 | 0.4240 | 0.3229 | 0.2546 | 0.2076 | 0.1745 | 0.1507 | 0.1333 | 0.1205 | 0.1110 | 0.1042 | 0.0994 | 0.0964 | 0.0950 | 0.0950 | 0.0964 | 0.0994 | 0.1042 | |
| 0.40 | 1.0033 | 0.8417 | 0.6401 | 0.4707 | 0.3501 | 0.2683 | 0.2128 | 0.1745 | 0.1475 | 0.1281 | 0.1139 | 0.1035 | 0.0959 | 0.0906 | 0.0870 | 0.0849 | 0.0842 | 0.0849 | 0.0870 | 0.0906 | 0.0959 | |
| 0.45 | 0.8192 | 0.6966 | 0.5352 | 0.3969 | 0.2972 | 0.2292 | 0.1828 | 0.1507 | 0.1281 | 0.1118 | 0.1000 | 0.0914 | 0.0852 | 0.0809 | 0.0783 | 0.0770 | 0.0770 | 0.0783 | 0.0809 | 0.0852 | 0.0914 | |
| 0.50 | 0.6882 | 0.5921 | 0.4591 | 0.3430 | 0.2585 | 0.2005 | 0.1608 | 0.1333 | 0.1139 | 0.1000 | 0.0899 | 0.0827 | 0.0776 | 0.0742 | 0.0723 | 0.0716 | 0.0723 | 0.0742 | 0.0776 | 0.0827 | 0.0899 | |
| 0.55 | 0.5927 | 0.5152 | 0.4028 | 0.3030 | 0.2298 | 0.1792 | 0.1446 | 0.1205 | 0.1035 | 0.0914 | 0.0827 | 0.0765 | 0.0723 | 0.0696 | 0.0684 | 0.0684 | 0.0696 | 0.0723 | 0.0765 | 0.0827 | 0.0914 | |
| 0.60 | 0.5216 | 0.4576 | 0.3605 | 0.2730 | 0.2083 | 0.1634 | 0.1325 | 0.1110 | 0.0959 | 0.0852 | 0.0776 | 0.0723 | 0.0688 | 0.0668 | 0.0662 | 0.0668 | 0.0688 | 0.0723 | 0.0776 | 0.0852 | 0.0959 | |
| 0.65 | 0.4681 | 0.4141 | 0.3286 | 0.2504 | 0.1921 | 0.1515 | 0.1236 | 0.1042 | 0.0906 | 0.0809 | 0.0742 | 0.0696 | 0.0668 | 0.0654 | 0.0654 | 0.0668 | 0.0696 | 0.0742 | 0.0809 | 0.0906 | 0.1042 | |
| 0.70 | 0.4275 | 0.3811 | 0.3044 | 0.2334 | 0.1801 | 0.1429 | 0.1172 | 0.0994 | 0.0870 | 0.0783 | 0.0723 | 0.0684 | 0.0662 | 0.0654 | 0.0662 | 0.0684 | 0.0723 | 0.0783 | 0.0870 | 0.0994 | 0.1172 | |
| 0.75 | 0.3967 | 0.3562 | 0.2864 | 0.2209 | 0.1715 | 0.1369 | 0.1130 | 0.0964 | 0.0849 | 0.0770 | 0.0716 | 0.0684 | 0.0668 | 0.0668 | 0.0684 | 0.0716 | 0.0770 | 0.0849 | 0.0964 | 0.1130 | 0.1369 | |
| 0.80 | 0.3737 | 0.3379 | 0.2734 | 0.2121 | 0.1657 | 0.1330 | 0.1105 | 0.0950 | 0.0842 | 0.0770 | 0.0723 | 0.0696 | 0.0688 | 0.0696 | 0.0723 | 0.0770 | 0.0842 | 0.0950 | 0.1105 | 0.1330 | 0.1657 | |
| 0.85 | 0.3570 | 0.3249 | 0.2645 | 0.2065 | 0.1623 | 0.1312 | 0.1097 | 0.0950 | 0.0849 | 0.0783 | 0.0742 | 0.0723 | 0.0723 | 0.0742 | 0.0783 | 0.0849 | 0.0950 | 0.1097 | 0.1312 | 0.1623 | 0.2065 | |
| 0.90 | 0.3457 | 0.3167 | 0.2594 | 0.2038 | 0.1612 | 0.1312 | 0.1105 | 0.0964 | 0.0870 | 0.0809 | 0.0776 | 0.0765 | 0.0776 | 0.0809 | 0.0870 | 0.0964 | 0.1105 | 0.1312 | 0.1612 | 0.2038 | 0.2594 | |
| 0.95 | 0.3391 | 0.3126 | 0.2577 | 0.2038 | 0.1623 | 0.1330 | 0.1130 | 0.0994 | 0.0906 | 0.0852 | 0.0827 | 0.0827 | 0.0852 | 0.0906 | 0.0994 | 0.1130 | 0.1330 | 0.1623 | 0.2038 | 0.2577 | 0.3126 | |
| 0.3370 | 0.3126 | 0.2594 | 0.2065 | 0.1657 | 0.1369 | 0.1172 | 0.1042 | 0.0959 | 0.0914 | 0.0899 | 0.0914 | 0.0959 | 0.1042 | 0.1172 | 0.1369 | 0.1657 | 0.2065 | 0.2594 | 0.3126 | 0.3370 |
| 0.00 | 0.05 | 0.10 | 0.15 | 0.20 | 0.25 | 0.30 | 0.35 | 0.40 | 0.45 | 0.50 | 0.55 | 0.60 | 0.65 | 0.70 | 0.75 | 0.80 | 0.85 | 0.90 | 0.95 | |||
|---|---|---|---|---|---|---|---|---|---|---|---|---|---|---|---|---|---|---|---|---|---|---|
| 0.00 | 2.0770 | 1.9834 | 1.7764 | 1.5668 | 1.4001 | 1.2778 | 1.1898 | 1.1261 | 1.0792 | 1.0443 | 1.0178 | 0.9975 | 0.9818 | 0.9696 | 0.9601 | 0.9527 | 0.9471 | 0.9430 | 0.9402 | 0.9386 | 0.9380 | |
| 0.05 | 1.9834 | 1.8341 | 1.6295 | 1.4453 | 1.3038 | 1.2004 | 1.1255 | 1.0708 | 1.0302 | 0.9997 | 0.9764 | 0.9584 | 0.9444 | 0.9336 | 0.9251 | 0.9186 | 0.9138 | 0.9103 | 0.9081 | 0.9070 | 0.9070 | |
| 0.10 | 1.7764 | 1.6295 | 1.4548 | 1.3006 | 1.1812 | 1.0928 | 1.0279 | 0.9799 | 0.9439 | 0.9166 | 0.8956 | 0.8794 | 0.8668 | 0.8569 | 0.8493 | 0.8435 | 0.8393 | 0.8364 | 0.8347 | 0.8341 | 0.8347 | |
| 0.15 | 1.5668 | 1.4453 | 1.3006 | 1.1698 | 1.0662 | 0.9882 | 0.9302 | 0.8867 | 0.8539 | 0.8288 | 0.8094 | 0.7943 | 0.7826 | 0.7734 | 0.7665 | 0.7612 | 0.7575 | 0.7551 | 0.7539 | 0.7539 | 0.7551 | |
| 0.20 | 1.4001 | 1.3038 | 1.1812 | 1.0662 | 0.9731 | 0.9020 | 0.8483 | 0.8078 | 0.7769 | 0.7532 | 0.7349 | 0.7206 | 0.7095 | 0.7009 | 0.6944 | 0.6896 | 0.6864 | 0.6845 | 0.6839 | 0.6845 | 0.6864 | |
| 0.25 | 1.2778 | 1.2004 | 1.0928 | 0.9882 | 0.9020 | 0.8351 | 0.7843 | 0.7457 | 0.7161 | 0.6933 | 0.6757 | 0.6619 | 0.6513 | 0.6432 | 0.6371 | 0.6328 | 0.6300 | 0.6286 | 0.6286 | 0.6300 | 0.6328 | |
| 0.30 | 1.1898 | 1.1255 | 1.0279 | 0.9302 | 0.8483 | 0.7843 | 0.7353 | 0.6979 | 0.6692 | 0.6471 | 0.6299 | 0.6166 | 0.6064 | 0.5986 | 0.5930 | 0.5891 | 0.5869 | 0.5861 | 0.5869 | 0.5891 | 0.5930 | |
| 0.35 | 1.1261 | 1.0708 | 0.9799 | 0.8867 | 0.8078 | 0.7457 | 0.6979 | 0.6613 | 0.6332 | 0.6116 | 0.5948 | 0.5819 | 0.5721 | 0.5648 | 0.5596 | 0.5562 | 0.5546 | 0.5546 | 0.5562 | 0.5596 | 0.5648 | |
| 0.40 | 1.0792 | 1.0302 | 0.9439 | 0.8539 | 0.7769 | 0.7161 | 0.6692 | 0.6332 | 0.6056 | 0.5844 | 0.5680 | 0.5555 | 0.5460 | 0.5391 | 0.5345 | 0.5318 | 0.5309 | 0.5318 | 0.5345 | 0.5391 | 0.5460 | |
| 0.45 | 1.0443 | 0.9997 | 0.9166 | 0.8288 | 0.7532 | 0.6933 | 0.6471 | 0.6116 | 0.5844 | 0.5635 | 0.5475 | 0.5353 | 0.5264 | 0.5200 | 0.5159 | 0.5140 | 0.5140 | 0.5159 | 0.5200 | 0.5264 | 0.5353 | |
| 0.50 | 1.0178 | 0.9764 | 0.8956 | 0.8094 | 0.7349 | 0.6757 | 0.6299 | 0.5948 | 0.5680 | 0.5475 | 0.5319 | 0.5202 | 0.5117 | 0.5060 | 0.5027 | 0.5016 | 0.5027 | 0.5060 | 0.5117 | 0.5202 | 0.5319 | |
| 0.55 | 0.9975 | 0.9584 | 0.8794 | 0.7943 | 0.7206 | 0.6619 | 0.6166 | 0.5819 | 0.5555 | 0.5353 | 0.5202 | 0.5090 | 0.5012 | 0.4962 | 0.4938 | 0.4938 | 0.4962 | 0.5012 | 0.5090 | 0.5202 | 0.5353 | |
| 0.60 | 0.9818 | 0.9444 | 0.8668 | 0.7826 | 0.7095 | 0.6513 | 0.6064 | 0.5721 | 0.5460 | 0.5264 | 0.5117 | 0.5012 | 0.4941 | 0.4900 | 0.4887 | 0.4900 | 0.4941 | 0.5012 | 0.5117 | 0.5264 | 0.5460 | |
| 0.65 | 0.9696 | 0.9336 | 0.8569 | 0.7734 | 0.7009 | 0.6432 | 0.5986 | 0.5648 | 0.5391 | 0.5200 | 0.5060 | 0.4962 | 0.4900 | 0.4870 | 0.4870 | 0.4900 | 0.4962 | 0.5060 | 0.5200 | 0.5391 | 0.5648 | |
| 0.70 | 0.9601 | 0.9251 | 0.8493 | 0.7665 | 0.6944 | 0.6371 | 0.5930 | 0.5596 | 0.5345 | 0.5159 | 0.5027 | 0.4938 | 0.4887 | 0.4870 | 0.4887 | 0.4938 | 0.5027 | 0.5159 | 0.5345 | 0.5596 | 0.5930 | |
| 0.75 | 0.9527 | 0.9186 | 0.8435 | 0.7612 | 0.6896 | 0.6328 | 0.5891 | 0.5562 | 0.5318 | 0.5140 | 0.5016 | 0.4938 | 0.4900 | 0.4900 | 0.4938 | 0.5016 | 0.5140 | 0.5318 | 0.5562 | 0.5891 | 0.6328 | |
| 0.80 | 0.9471 | 0.9138 | 0.8393 | 0.7575 | 0.6864 | 0.6300 | 0.5869 | 0.5546 | 0.5309 | 0.5140 | 0.5027 | 0.4962 | 0.4941 | 0.4962 | 0.5027 | 0.5140 | 0.5309 | 0.5546 | 0.5869 | 0.6300 | 0.6864 | |
| 0.85 | 0.9430 | 0.9103 | 0.8364 | 0.7551 | 0.6845 | 0.6286 | 0.5861 | 0.5546 | 0.5318 | 0.5159 | 0.5060 | 0.5012 | 0.5012 | 0.5060 | 0.5159 | 0.5318 | 0.5546 | 0.5861 | 0.6286 | 0.6845 | 0.7551 | |
| 0.90 | 0.9402 | 0.9081 | 0.8347 | 0.7539 | 0.6839 | 0.6286 | 0.5869 | 0.5562 | 0.5345 | 0.5200 | 0.5117 | 0.5090 | 0.5117 | 0.5200 | 0.5345 | 0.5562 | 0.5869 | 0.6286 | 0.6839 | 0.7539 | 0.8347 | |
| 0.95 | 0.9386 | 0.9070 | 0.8341 | 0.7539 | 0.6845 | 0.6300 | 0.5891 | 0.5596 | 0.5391 | 0.5264 | 0.5202 | 0.5202 | 0.5264 | 0.5391 | 0.5596 | 0.5891 | 0.6300 | 0.6845 | 0.7539 | 0.8341 | 0.9070 | |
| 0.9380 | 0.9070 | 0.8347 | 0.7551 | 0.6864 | 0.6328 | 0.5930 | 0.5648 | 0.5460 | 0.5353 | 0.5319 | 0.5353 | 0.5460 | 0.5648 | 0.5930 | 0.6328 | 0.6864 | 0.7551 | 0.8347 | 0.9070 | 0.9380 |
| 0.00 | 0.05 | 0.10 | 0.15 | 0.20 | 0.25 | 0.30 | 0.35 | 0.40 | 0.45 | 0.50 | 0.55 | 0.60 | 0.65 | 0.70 | 0.75 | 0.80 | 0.85 | 0.90 | 0.95 | |||
|---|---|---|---|---|---|---|---|---|---|---|---|---|---|---|---|---|---|---|---|---|---|---|
| 0.00 | 6.2811 | 6.0178 | 5.2894 | 4.2634 | 3.1625 | 2.1953 | 1.4909 | 1.0680 | 0.8533 | 0.7378 | 0.6361 | 0.5164 | 0.3906 | 0.2837 | 0.2098 | 0.1671 | 0.1472 | 0.1429 | 0.1488 | 0.1578 | 0.1619 | |
| 0.05 | 6.0178 | 5.5224 | 4.6485 | 3.5937 | 2.5750 | 1.7602 | 1.2203 | 0.9237 | 0.7751 | 0.6751 | 0.5663 | 0.4425 | 0.3258 | 0.2369 | 0.1810 | 0.1515 | 0.1400 | 0.1409 | 0.1485 | 0.1554 | 0.1554 | |
| 0.10 | 5.2894 | 4.6485 | 3.7528 | 2.7993 | 1.9649 | 1.3559 | 0.9858 | 0.7926 | 0.6836 | 0.5860 | 0.4733 | 0.3572 | 0.2598 | 0.1930 | 0.1548 | 0.1364 | 0.1306 | 0.1334 | 0.1397 | 0.1429 | 0.1397 | |
| 0.15 | 4.2634 | 3.5937 | 2.7993 | 2.0420 | 1.4374 | 1.0304 | 0.7970 | 0.6697 | 0.5776 | 0.4800 | 0.3742 | 0.2774 | 0.2048 | 0.1598 | 0.1362 | 0.1248 | 0.1213 | 0.1236 | 0.1273 | 0.1273 | 0.1236 | |
| 0.20 | 3.1625 | 2.5750 | 1.9649 | 1.4374 | 1.0468 | 0.7963 | 0.6494 | 0.5536 | 0.4674 | 0.3768 | 0.2894 | 0.2179 | 0.1692 | 0.1413 | 0.1259 | 0.1170 | 0.1139 | 0.1152 | 0.1165 | 0.1152 | 0.1139 | |
| 0.25 | 2.1953 | 1.7602 | 1.3559 | 1.0304 | 0.7963 | 0.6401 | 0.5339 | 0.4492 | 0.3702 | 0.2958 | 0.2320 | 0.1838 | 0.1524 | 0.1327 | 0.1188 | 0.1100 | 0.1073 | 0.1080 | 0.1080 | 0.1073 | 0.1100 | |
| 0.30 | 1.4909 | 1.2203 | 0.9858 | 0.7970 | 0.6494 | 0.5339 | 0.4408 | 0.3634 | 0.2984 | 0.2444 | 0.2011 | 0.1683 | 0.1437 | 0.1239 | 0.1088 | 0.1006 | 0.0985 | 0.0986 | 0.0985 | 0.1006 | 0.1088 | |
| 0.35 | 1.0680 | 0.9237 | 0.7926 | 0.6697 | 0.5536 | 0.4492 | 0.3634 | 0.2989 | 0.2518 | 0.2155 | 0.1848 | 0.1568 | 0.1309 | 0.1091 | 0.0940 | 0.0868 | 0.0851 | 0.0851 | 0.0868 | 0.0940 | 0.1091 | |
| 0.40 | 0.8533 | 0.7751 | 0.6836 | 0.5776 | 0.4674 | 0.3702 | 0.2984 | 0.2518 | 0.2212 | 0.1955 | 0.1679 | 0.1383 | 0.1108 | 0.0895 | 0.0758 | 0.0695 | 0.0680 | 0.0695 | 0.0758 | 0.0895 | 0.1108 | |
| 0.45 | 0.7378 | 0.6751 | 0.5860 | 0.4800 | 0.3768 | 0.2958 | 0.2444 | 0.2155 | 0.1955 | 0.1724 | 0.1431 | 0.1131 | 0.0883 | 0.0698 | 0.0573 | 0.0513 | 0.0513 | 0.0573 | 0.0698 | 0.0883 | 0.1131 | |
| 0.50 | 0.6361 | 0.5663 | 0.4733 | 0.3742 | 0.2894 | 0.2320 | 0.2011 | 0.1848 | 0.1679 | 0.1431 | 0.1142 | 0.0890 | 0.0695 | 0.0535 | 0.0415 | 0.0370 | 0.0415 | 0.0535 | 0.0695 | 0.0890 | 0.1142 | |
| 0.55 | 0.5164 | 0.4425 | 0.3572 | 0.2774 | 0.2179 | 0.1838 | 0.1683 | 0.1568 | 0.1383 | 0.1131 | 0.0890 | 0.0705 | 0.0550 | 0.0407 | 0.0313 | 0.0313 | 0.0407 | 0.0550 | 0.0705 | 0.0890 | 0.1131 | |
| 0.60 | 0.3906 | 0.3258 | 0.2598 | 0.2048 | 0.1692 | 0.1524 | 0.1437 | 0.1309 | 0.1108 | 0.0883 | 0.0695 | 0.0550 | 0.0420 | 0.0316 | 0.0276 | 0.0316 | 0.0420 | 0.0550 | 0.0695 | 0.0883 | 0.1108 | |
| 0.65 | 0.2837 | 0.2369 | 0.1930 | 0.1598 | 0.1413 | 0.1327 | 0.1239 | 0.1091 | 0.0895 | 0.0698 | 0.0535 | 0.0407 | 0.0316 | 0.0272 | 0.0272 | 0.0316 | 0.0407 | 0.0535 | 0.0698 | 0.0895 | 0.1091 | |
| 0.70 | 0.2098 | 0.1810 | 0.1548 | 0.1362 | 0.1259 | 0.1188 | 0.1088 | 0.0940 | 0.0758 | 0.0573 | 0.0415 | 0.0313 | 0.0276 | 0.0272 | 0.0276 | 0.0313 | 0.0415 | 0.0573 | 0.0758 | 0.0940 | 0.1088 | |
| 0.75 | 0.1671 | 0.1515 | 0.1364 | 0.1248 | 0.1170 | 0.1100 | 0.1006 | 0.0868 | 0.0695 | 0.0513 | 0.0370 | 0.0313 | 0.0316 | 0.0316 | 0.0313 | 0.0370 | 0.0513 | 0.0695 | 0.0868 | 0.1006 | 0.1100 | |
| 0.80 | 0.1472 | 0.1400 | 0.1306 | 0.1213 | 0.1139 | 0.1073 | 0.0985 | 0.0851 | 0.0680 | 0.0513 | 0.0415 | 0.0407 | 0.0420 | 0.0407 | 0.0415 | 0.0513 | 0.0680 | 0.0851 | 0.0985 | 0.1073 | 0.1139 | |
| 0.85 | 0.1429 | 0.1409 | 0.1334 | 0.1236 | 0.1152 | 0.1080 | 0.0986 | 0.0851 | 0.0695 | 0.0573 | 0.0535 | 0.0550 | 0.0550 | 0.0535 | 0.0573 | 0.0695 | 0.0851 | 0.0986 | 0.1080 | 0.1152 | 0.1236 | |
| 0.90 | 0.1488 | 0.1485 | 0.1397 | 0.1273 | 0.1165 | 0.1080 | 0.0985 | 0.0868 | 0.0758 | 0.0698 | 0.0695 | 0.0705 | 0.0695 | 0.0698 | 0.0758 | 0.0868 | 0.0985 | 0.1080 | 0.1165 | 0.1273 | 0.1397 | |
| 0.95 | 0.1578 | 0.1554 | 0.1429 | 0.1273 | 0.1152 | 0.1073 | 0.1006 | 0.0940 | 0.0895 | 0.0883 | 0.0890 | 0.0890 | 0.0883 | 0.0895 | 0.0940 | 0.1006 | 0.1073 | 0.1152 | 0.1273 | 0.1429 | 0.1554 | |
| 0.1619 | 0.1554 | 0.1397 | 0.1236 | 0.1139 | 0.1100 | 0.1088 | 0.1091 | 0.1108 | 0.1131 | 0.1142 | 0.1131 | 0.1108 | 0.1091 | 0.1088 | 0.1100 | 0.1139 | 0.1236 | 0.1397 | 0.1554 | 0.1619 |
| 0.00 | 0.05 | 0.10 | 0.15 | 0.20 | 0.25 | 0.30 | 0.35 | 0.40 | 0.45 | 0.50 | 0.55 | 0.60 | 0.65 | 0.70 | 0.75 | 0.80 | 0.85 | 0.90 | 0.95 | |||
|---|---|---|---|---|---|---|---|---|---|---|---|---|---|---|---|---|---|---|---|---|---|---|
| 0.00 | 7.2751 | 7.0052 | 6.2479 | 5.1510 | 3.9273 | 2.7976 | 1.9240 | 1.3622 | 1.0610 | 0.9118 | 0.8128 | 0.7120 | 0.6067 | 0.5145 | 0.4451 | 0.3931 | 0.3476 | 0.3041 | 0.2662 | 0.2405 | 0.2315 | |
| 0.05 | 7.0052 | 6.4921 | 5.5681 | 4.4160 | 3.2535 | 2.2711 | 1.5751 | 1.1641 | 0.9544 | 0.8384 | 0.7401 | 0.6355 | 0.5357 | 0.4560 | 0.3978 | 0.3517 | 0.3092 | 0.2702 | 0.2402 | 0.2240 | 0.2240 | |
| 0.10 | 6.2479 | 5.5681 | 4.5956 | 3.5226 | 2.5369 | 1.7703 | 1.2666 | 0.9835 | 0.8314 | 0.7258 | 0.6231 | 0.5210 | 0.4338 | 0.3692 | 0.3221 | 0.2834 | 0.2489 | 0.2208 | 0.2031 | 0.1972 | 0.2031 | |
| 0.15 | 5.1510 | 4.4160 | 3.5226 | 2.6376 | 1.8908 | 1.3491 | 1.0090 | 0.8133 | 0.6890 | 0.5839 | 0.4818 | 0.3907 | 0.3206 | 0.2717 | 0.2364 | 0.2084 | 0.1866 | 0.1730 | 0.1673 | 0.1673 | 0.1730 | |
| 0.20 | 3.9273 | 3.2535 | 2.5369 | 1.8908 | 1.3815 | 1.0261 | 0.7997 | 0.6528 | 0.5394 | 0.4360 | 0.3431 | 0.2694 | 0.2182 | 0.1847 | 0.1622 | 0.1472 | 0.1396 | 0.1382 | 0.1386 | 0.1382 | 0.1396 | |
| 0.25 | 2.7976 | 2.2711 | 1.7703 | 1.3491 | 1.0261 | 0.7951 | 0.6324 | 0.5080 | 0.4007 | 0.3058 | 0.2296 | 0.1764 | 0.1435 | 0.1242 | 0.1133 | 0.1091 | 0.1107 | 0.1139 | 0.1139 | 0.1107 | 0.1091 | |
| 0.30 | 1.9240 | 1.5751 | 1.2666 | 1.0090 | 0.7997 | 0.6324 | 0.4973 | 0.3834 | 0.2856 | 0.2073 | 0.1526 | 0.1199 | 0.1021 | 0.0922 | 0.0869 | 0.0864 | 0.0892 | 0.0910 | 0.0892 | 0.0864 | 0.0869 | |
| 0.35 | 1.3622 | 1.1641 | 0.9835 | 0.8133 | 0.6528 | 0.5080 | 0.3834 | 0.2799 | 0.1990 | 0.1433 | 0.1109 | 0.0942 | 0.0842 | 0.0757 | 0.0688 | 0.0663 | 0.0672 | 0.0672 | 0.0663 | 0.0688 | 0.0757 | |
| 0.40 | 1.0610 | 0.9544 | 0.8314 | 0.6890 | 0.5394 | 0.4007 | 0.2856 | 0.1990 | 0.1413 | 0.1092 | 0.0942 | 0.0854 | 0.0750 | 0.0616 | 0.0506 | 0.0481 | 0.0491 | 0.0481 | 0.0506 | 0.0616 | 0.0750 | |
| 0.45 | 0.9118 | 0.8384 | 0.7258 | 0.5839 | 0.4360 | 0.3058 | 0.2073 | 0.1433 | 0.1092 | 0.0952 | 0.0890 | 0.0802 | 0.0644 | 0.0456 | 0.0371 | 0.0409 | 0.0409 | 0.0371 | 0.0456 | 0.0644 | 0.0802 | |
| 0.50 | 0.8128 | 0.7401 | 0.6231 | 0.4818 | 0.3431 | 0.2296 | 0.1526 | 0.1109 | 0.0942 | 0.0890 | 0.0833 | 0.0698 | 0.0491 | 0.0338 | 0.0384 | 0.0441 | 0.0384 | 0.0338 | 0.0491 | 0.0698 | 0.0833 | |
| 0.55 | 0.7120 | 0.6355 | 0.5210 | 0.3907 | 0.2694 | 0.1764 | 0.1199 | 0.0942 | 0.0854 | 0.0802 | 0.0698 | 0.0520 | 0.0354 | 0.0378 | 0.0482 | 0.0482 | 0.0378 | 0.0354 | 0.0520 | 0.0698 | 0.0802 | |
| 0.60 | 0.6067 | 0.5357 | 0.4338 | 0.3206 | 0.2182 | 0.1435 | 0.1021 | 0.0842 | 0.0750 | 0.0644 | 0.0491 | 0.0354 | 0.0381 | 0.0505 | 0.0564 | 0.0505 | 0.0381 | 0.0354 | 0.0491 | 0.0644 | 0.0750 | |
| 0.65 | 0.5145 | 0.4560 | 0.3692 | 0.2717 | 0.1847 | 0.1242 | 0.0922 | 0.0757 | 0.0616 | 0.0456 | 0.0338 | 0.0378 | 0.0505 | 0.0595 | 0.0595 | 0.0505 | 0.0378 | 0.0338 | 0.0456 | 0.0616 | 0.0757 | |
| 0.70 | 0.4451 | 0.3978 | 0.3221 | 0.2364 | 0.1622 | 0.1133 | 0.0869 | 0.0688 | 0.0506 | 0.0371 | 0.0384 | 0.0482 | 0.0564 | 0.0595 | 0.0564 | 0.0482 | 0.0384 | 0.0371 | 0.0506 | 0.0688 | 0.0869 | |
| 0.75 | 0.3931 | 0.3517 | 0.2834 | 0.2084 | 0.1472 | 0.1091 | 0.0864 | 0.0663 | 0.0481 | 0.0409 | 0.0441 | 0.0482 | 0.0505 | 0.0505 | 0.0482 | 0.0441 | 0.0409 | 0.0481 | 0.0663 | 0.0864 | 0.1091 | |
| 0.80 | 0.3476 | 0.3092 | 0.2489 | 0.1866 | 0.1396 | 0.1107 | 0.0892 | 0.0672 | 0.0491 | 0.0409 | 0.0384 | 0.0378 | 0.0381 | 0.0378 | 0.0384 | 0.0409 | 0.0491 | 0.0672 | 0.0892 | 0.1107 | 0.1396 | |
| 0.85 | 0.3041 | 0.2702 | 0.2208 | 0.1730 | 0.1382 | 0.1139 | 0.0910 | 0.0672 | 0.0481 | 0.0371 | 0.0338 | 0.0354 | 0.0354 | 0.0338 | 0.0371 | 0.0481 | 0.0672 | 0.0910 | 0.1139 | 0.1382 | 0.1730 | |
| 0.90 | 0.2662 | 0.2402 | 0.2031 | 0.1673 | 0.1386 | 0.1139 | 0.0892 | 0.0663 | 0.0506 | 0.0456 | 0.0491 | 0.0520 | 0.0491 | 0.0456 | 0.0506 | 0.0663 | 0.0892 | 0.1139 | 0.1386 | 0.1673 | 0.2031 | |
| 0.95 | 0.2405 | 0.2240 | 0.1972 | 0.1673 | 0.1382 | 0.1107 | 0.0864 | 0.0688 | 0.0616 | 0.0644 | 0.0698 | 0.0698 | 0.0644 | 0.0616 | 0.0688 | 0.0864 | 0.1107 | 0.1382 | 0.1673 | 0.1972 | 0.2240 | |
| 0.2315 | 0.2240 | 0.2031 | 0.1730 | 0.1396 | 0.1091 | 0.0869 | 0.0757 | 0.0750 | 0.0802 | 0.0833 | 0.0802 | 0.0750 | 0.0757 | 0.0869 | 0.1091 | 0.1396 | 0.1730 | 0.2031 | 0.2240 | 0.2315 |
| 0.00 | 0.05 | 0.10 | 0.15 | 0.20 | 0.25 | 0.30 | 0.35 | 0.40 | 0.45 | 0.50 | 0.55 | 0.60 | 0.65 | 0.70 | 0.75 | 0.80 | 0.85 | 0.90 | 0.95 | |||
|---|---|---|---|---|---|---|---|---|---|---|---|---|---|---|---|---|---|---|---|---|---|---|
| 0.00 | 3.6955 | 3.7475 | 3.7242 | 3.3375 | 2.6065 | 1.8893 | 1.4845 | 1.3180 | 1.1031 | 0.7373 | 0.4115 | 0.3208 | 0.3922 | 0.3916 | 0.2369 | 0.0834 | 0.0843 | 0.1780 | 0.1923 | 0.0956 | 0.0313 | |
| 0.05 | 3.7475 | 3.7654 | 3.5645 | 2.9891 | 2.2462 | 1.6882 | 1.4204 | 1.2543 | 0.9559 | 0.5814 | 0.3719 | 0.3761 | 0.4317 | 0.3387 | 0.1525 | 0.0794 | 0.1357 | 0.2097 | 0.1510 | 0.0516 | 0.0516 | |
| 0.10 | 3.7242 | 3.5645 | 3.1669 | 2.5556 | 1.9788 | 1.5756 | 1.3348 | 1.1040 | 0.7684 | 0.5145 | 0.4189 | 0.4249 | 0.3992 | 0.2327 | 0.1363 | 0.1160 | 0.1788 | 0.1871 | 0.0800 | 0.0815 | 0.0800 | |
| 0.15 | 3.3375 | 2.9891 | 2.5556 | 2.1222 | 1.7260 | 1.3544 | 1.0771 | 0.8184 | 0.6098 | 0.5142 | 0.4139 | 0.3664 | 0.2636 | 0.1729 | 0.1725 | 0.1298 | 0.1721 | 0.1072 | 0.0982 | 0.0982 | 0.1072 | |
| 0.20 | 2.6065 | 2.2462 | 1.9788 | 1.7260 | 1.3691 | 0.9940 | 0.7356 | 0.5862 | 0.5430 | 0.4511 | 0.3238 | 0.2446 | 0.1707 | 0.1929 | 0.1548 | 0.1376 | 0.1322 | 0.0839 | 0.1219 | 0.0839 | 0.1322 | |
| 0.25 | 1.8893 | 1.6882 | 1.5756 | 1.3544 | 0.9940 | 0.6762 | 0.5309 | 0.5237 | 0.4931 | 0.3594 | 0.2361 | 0.1781 | 0.1993 | 0.2065 | 0.1530 | 0.1359 | 0.1113 | 0.1366 | 0.1366 | 0.1113 | 0.1359 | |
| 0.30 | 1.4845 | 1.4204 | 1.3348 | 1.0771 | 0.7356 | 0.5309 | 0.5256 | 0.5543 | 0.4565 | 0.2778 | 0.1782 | 0.2132 | 0.2643 | 0.2140 | 0.1232 | 0.0946 | 0.1440 | 0.1911 | 0.1440 | 0.0946 | 0.1232 | |
| 0.35 | 1.3180 | 1.2543 | 1.1040 | 0.8184 | 0.5862 | 0.5237 | 0.5543 | 0.5130 | 0.3328 | 0.1789 | 0.1825 | 0.2590 | 0.2524 | 0.1258 | 0.0272 | 0.0712 | 0.1733 | 0.1733 | 0.0712 | 0.0272 | 0.1258 | |
| 0.40 | 1.1031 | 0.9559 | 0.7684 | 0.6098 | 0.5430 | 0.4931 | 0.4565 | 0.3328 | 0.1904 | 0.1739 | 0.1962 | 0.2302 | 0.1434 | 0.0117 | 0.0322 | 0.0879 | 0.1585 | 0.0879 | 0.0322 | 0.0117 | 0.1434 | |
| 0.45 | 0.7373 | 0.5814 | 0.5145 | 0.5142 | 0.4511 | 0.3594 | 0.2778 | 0.1789 | 0.1739 | 0.1674 | 0.1873 | 0.1698 | 0.0543 | 0.0335 | 0.0350 | 0.1331 | 0.1331 | 0.0350 | 0.0335 | 0.0543 | 0.1698 | |
| 0.50 | 0.4115 | 0.3719 | 0.4189 | 0.4139 | 0.3238 | 0.2361 | 0.1782 | 0.1825 | 0.1962 | 0.1873 | 0.1853 | 0.1293 | 0.0759 | 0.0785 | 0.1180 | 0.1572 | 0.1180 | 0.0785 | 0.0759 | 0.1293 | 0.1853 | |
| 0.55 | 0.3208 | 0.3761 | 0.4249 | 0.3664 | 0.2446 | 0.1781 | 0.2132 | 0.2590 | 0.2302 | 0.1698 | 0.1293 | 0.1280 | 0.1517 | 0.1268 | 0.1123 | 0.1123 | 0.1268 | 0.1517 | 0.1280 | 0.1293 | 0.1698 | |
| 0.60 | 0.3922 | 0.4317 | 0.3992 | 0.2636 | 0.1707 | 0.1993 | 0.2643 | 0.2524 | 0.1434 | 0.0543 | 0.0759 | 0.1517 | 0.1432 | 0.0530 | 0.0398 | 0.0530 | 0.1432 | 0.1517 | 0.0759 | 0.0543 | 0.1434 | |
| 0.65 | 0.3916 | 0.3387 | 0.2327 | 0.1729 | 0.1929 | 0.2065 | 0.2140 | 0.1258 | 0.0117 | 0.0335 | 0.0785 | 0.1268 | 0.0530 | 0.0655 | 0.0655 | 0.0530 | 0.1268 | 0.0785 | 0.0335 | 0.0117 | 0.1258 | |
| 0.70 | 0.2369 | 0.1525 | 0.1363 | 0.1725 | 0.1548 | 0.1530 | 0.1232 | 0.0272 | 0.0322 | 0.0350 | 0.1180 | 0.1123 | 0.0398 | 0.0655 | 0.0398 | 0.1123 | 0.1180 | 0.0350 | 0.0322 | 0.0272 | 0.1232 | |
| 0.75 | 0.0834 | 0.0794 | 0.1160 | 0.1298 | 0.1376 | 0.1359 | 0.0946 | 0.0712 | 0.0879 | 0.1331 | 0.1572 | 0.1123 | 0.0530 | 0.0530 | 0.1123 | 0.1572 | 0.1331 | 0.0879 | 0.0712 | 0.0946 | 0.1359 | |
| 0.80 | 0.0843 | 0.1357 | 0.1788 | 0.1721 | 0.1322 | 0.1113 | 0.1440 | 0.1733 | 0.1585 | 0.1331 | 0.1180 | 0.1268 | 0.1432 | 0.1268 | 0.1180 | 0.1331 | 0.1585 | 0.1733 | 0.1440 | 0.1113 | 0.1322 | |
| 0.85 | 0.1780 | 0.2097 | 0.1871 | 0.1072 | 0.0839 | 0.1366 | 0.1911 | 0.1733 | 0.0879 | 0.0350 | 0.0785 | 0.1517 | 0.1517 | 0.0785 | 0.0350 | 0.0879 | 0.1733 | 0.1911 | 0.1366 | 0.0839 | 0.1072 | |
| 0.90 | 0.1923 | 0.1510 | 0.0800 | 0.0982 | 0.1219 | 0.1366 | 0.1440 | 0.0712 | 0.0322 | 0.0335 | 0.0759 | 0.1280 | 0.0759 | 0.0335 | 0.0322 | 0.0712 | 0.1440 | 0.1366 | 0.1219 | 0.0982 | 0.0800 | |
| 0.95 | 0.0956 | 0.0516 | 0.0815 | 0.0982 | 0.0839 | 0.1113 | 0.0946 | 0.0272 | 0.0117 | 0.0543 | 0.1293 | 0.1293 | 0.0543 | 0.0117 | 0.0272 | 0.0946 | 0.1113 | 0.0839 | 0.0982 | 0.0815 | 0.0516 | |
| 0.0313 | 0.0516 | 0.0800 | 0.1072 | 0.1322 | 0.1359 | 0.1232 | 0.1258 | 0.1434 | 0.1698 | 0.1853 | 0.1698 | 0.1434 | 0.1258 | 0.1232 | 0.1359 | 0.1322 | 0.1072 | 0.0800 | 0.0516 | 0.0313 |
| 0.00 | 0.05 | 0.10 | 0.15 | 0.20 | 0.25 | 0.30 | 0.35 | 0.40 | 0.45 | 0.50 | 0.55 | 0.60 | 0.65 | 0.70 | 0.75 | 0.80 | 0.85 | 0.90 | 0.95 | |||
|---|---|---|---|---|---|---|---|---|---|---|---|---|---|---|---|---|---|---|---|---|---|---|
| 0.00 | 4.4795 | 4.5332 | 4.4906 | 4.0266 | 3.1702 | 2.3340 | 1.8538 | 1.6362 | 1.3547 | 0.9068 | 0.5249 | 0.4285 | 0.5160 | 0.5075 | 0.3180 | 0.1420 | 0.1554 | 0.2679 | 0.2661 | 0.1242 | 0.0350 | |
| 0.05 | 4.5332 | 4.5419 | 4.2940 | 3.6252 | 2.7681 | 2.1131 | 1.7767 | 1.5430 | 1.1704 | 0.7348 | 0.4954 | 0.5049 | 0.5632 | 0.4509 | 0.2407 | 0.1582 | 0.2317 | 0.3022 | 0.2169 | 0.0872 | 0.0872 | |
| 0.10 | 4.4906 | 4.2940 | 3.8391 | 3.1574 | 2.4899 | 1.9927 | 1.6605 | 1.3497 | 0.9690 | 0.6803 | 0.5593 | 0.5588 | 0.5226 | 0.3567 | 0.2459 | 0.2259 | 0.2758 | 0.2677 | 0.1656 | 0.1444 | 0.1656 | |
| 0.15 | 4.0266 | 3.6252 | 3.1574 | 2.6758 | 2.1861 | 1.7004 | 1.3202 | 1.0149 | 0.7901 | 0.6529 | 0.5189 | 0.4498 | 0.3566 | 0.2918 | 0.2740 | 0.2123 | 0.2148 | 0.1684 | 0.1806 | 0.1806 | 0.1684 | |
| 0.20 | 3.1702 | 2.7681 | 2.4899 | 2.1861 | 1.7145 | 1.2121 | 0.8855 | 0.7296 | 0.6677 | 0.5248 | 0.3472 | 0.2608 | 0.2308 | 0.2768 | 0.2083 | 0.1323 | 0.1236 | 0.1282 | 0.1894 | 0.1282 | 0.1236 | |
| 0.25 | 2.3340 | 2.1131 | 1.9927 | 1.7004 | 1.2121 | 0.7995 | 0.6362 | 0.6340 | 0.5721 | 0.3697 | 0.2137 | 0.1702 | 0.2385 | 0.2451 | 0.1347 | 0.1160 | 0.0962 | 0.1689 | 0.1689 | 0.0962 | 0.1160 | |
| 0.30 | 1.8538 | 1.7767 | 1.6605 | 1.3202 | 0.8855 | 0.6362 | 0.6323 | 0.6537 | 0.5055 | 0.2720 | 0.1623 | 0.2237 | 0.2984 | 0.2236 | 0.1021 | 0.0801 | 0.1538 | 0.2244 | 0.1538 | 0.0801 | 0.1021 | |
| 0.35 | 1.6362 | 1.5430 | 1.3497 | 1.0149 | 0.7296 | 0.6340 | 0.6537 | 0.5863 | 0.3705 | 0.1906 | 0.1920 | 0.2820 | 0.2756 | 0.1364 | 0.0346 | 0.0849 | 0.1958 | 0.1958 | 0.0849 | 0.0346 | 0.1364 | |
| 0.40 | 1.3547 | 1.1704 | 0.9690 | 0.7901 | 0.6677 | 0.5721 | 0.5055 | 0.3705 | 0.2263 | 0.1897 | 0.1948 | 0.2214 | 0.1420 | 0.0638 | 0.0713 | 0.0866 | 0.1444 | 0.0866 | 0.0713 | 0.0638 | 0.1420 | |
| 0.45 | 0.9068 | 0.7348 | 0.6803 | 0.6529 | 0.5248 | 0.3697 | 0.2720 | 0.1906 | 0.1897 | 0.1505 | 0.1452 | 0.1350 | 0.0385 | 0.0732 | 0.0260 | 0.1047 | 0.1047 | 0.0260 | 0.0732 | 0.0385 | 0.1350 | |
| 0.50 | 0.5249 | 0.4954 | 0.5593 | 0.5189 | 0.3472 | 0.2137 | 0.1623 | 0.1920 | 0.1948 | 0.1452 | 0.1573 | 0.1027 | 0.0760 | 0.0775 | 0.0976 | 0.1549 | 0.0976 | 0.0775 | 0.0760 | 0.1027 | 0.1573 | |
| 0.55 | 0.4285 | 0.5049 | 0.5588 | 0.4498 | 0.2608 | 0.1702 | 0.2237 | 0.2820 | 0.2214 | 0.1350 | 0.1027 | 0.1178 | 0.1672 | 0.1200 | 0.1079 | 0.1079 | 0.1200 | 0.1672 | 0.1178 | 0.1027 | 0.1350 | |
| 0.60 | 0.5160 | 0.5632 | 0.5226 | 0.3566 | 0.2308 | 0.2385 | 0.2984 | 0.2756 | 0.1420 | 0.0385 | 0.0760 | 0.1672 | 0.1616 | 0.0546 | 0.0297 | 0.0546 | 0.1616 | 0.1672 | 0.0760 | 0.0385 | 0.1420 | |
| 0.65 | 0.5075 | 0.4509 | 0.3567 | 0.2918 | 0.2768 | 0.2451 | 0.2236 | 0.1364 | 0.0638 | 0.0732 | 0.0775 | 0.1200 | 0.0546 | 0.0492 | 0.0492 | 0.0546 | 0.1200 | 0.0775 | 0.0732 | 0.0638 | 0.1364 | |
| 0.70 | 0.3180 | 0.2407 | 0.2459 | 0.2740 | 0.2083 | 0.1347 | 0.1021 | 0.0346 | 0.0713 | 0.0260 | 0.0976 | 0.1079 | 0.0297 | 0.0492 | 0.0297 | 0.1079 | 0.0976 | 0.0260 | 0.0713 | 0.0346 | 0.1021 | |
| 0.75 | 0.1420 | 0.1582 | 0.2259 | 0.2123 | 0.1323 | 0.1160 | 0.0801 | 0.0849 | 0.0866 | 0.1047 | 0.1549 | 0.1079 | 0.0546 | 0.0546 | 0.1079 | 0.1549 | 0.1047 | 0.0866 | 0.0849 | 0.0801 | 0.1160 | |
| 0.80 | 0.1554 | 0.2317 | 0.2758 | 0.2148 | 0.1236 | 0.0962 | 0.1538 | 0.1958 | 0.1444 | 0.1047 | 0.0976 | 0.1200 | 0.1616 | 0.1200 | 0.0976 | 0.1047 | 0.1444 | 0.1958 | 0.1538 | 0.0962 | 0.1236 | |
| 0.85 | 0.2679 | 0.3022 | 0.2677 | 0.1684 | 0.1282 | 0.1689 | 0.2244 | 0.1958 | 0.0866 | 0.0260 | 0.0775 | 0.1672 | 0.1672 | 0.0775 | 0.0260 | 0.0866 | 0.1958 | 0.2244 | 0.1689 | 0.1282 | 0.1684 | |
| 0.90 | 0.2661 | 0.2169 | 0.1656 | 0.1806 | 0.1894 | 0.1689 | 0.1538 | 0.0849 | 0.0713 | 0.0732 | 0.0760 | 0.1178 | 0.0760 | 0.0732 | 0.0713 | 0.0849 | 0.1538 | 0.1689 | 0.1894 | 0.1806 | 0.1656 | |
| 0.95 | 0.1242 | 0.0872 | 0.1444 | 0.1806 | 0.1282 | 0.0962 | 0.0801 | 0.0346 | 0.0638 | 0.0385 | 0.1027 | 0.1027 | 0.0385 | 0.0638 | 0.0346 | 0.0801 | 0.0962 | 0.1282 | 0.1806 | 0.1444 | 0.0872 | |
| 0.0350 | 0.0872 | 0.1656 | 0.1684 | 0.1236 | 0.1160 | 0.1021 | 0.1364 | 0.1420 | 0.1350 | 0.1573 | 0.1350 | 0.1420 | 0.1364 | 0.1021 | 0.1160 | 0.1236 | 0.1684 | 0.1656 | 0.0872 | 0.0350 |
| 0.00 | 0.05 | 0.10 | 0.15 | 0.20 | 0.25 | 0.30 | 0.35 | 0.40 | 0.45 | 0.50 | 0.55 | 0.60 | 0.65 | 0.70 | 0.75 | 0.80 | 0.85 | 0.90 | 0.95 | |||
|---|---|---|---|---|---|---|---|---|---|---|---|---|---|---|---|---|---|---|---|---|---|---|
| 0.00 | 5.7134 | 5.4997 | 4.9012 | 4.0391 | 3.0884 | 2.2251 | 1.5656 | 1.1330 | 0.8751 | 0.7145 | 0.5925 | 0.4825 | 0.3789 | 0.2852 | 0.2093 | 0.1591 | 0.1362 | 0.1323 | 0.1348 | 0.1362 | 0.1363 | |
| 0.05 | 5.4997 | 5.0938 | 4.3649 | 3.4631 | 2.5661 | 1.8210 | 1.2955 | 0.9698 | 0.7746 | 0.6407 | 0.5279 | 0.4225 | 0.3249 | 0.2407 | 0.1782 | 0.1428 | 0.1309 | 0.1310 | 0.1327 | 0.1328 | 0.1328 | |
| 0.10 | 4.9012 | 4.3649 | 3.5997 | 2.7630 | 2.0076 | 1.4310 | 1.0507 | 0.8198 | 0.6712 | 0.5558 | 0.4518 | 0.3549 | 0.2682 | 0.1983 | 0.1522 | 0.1307 | 0.1256 | 0.1256 | 0.1249 | 0.1242 | 0.1249 | |
| 0.15 | 4.0391 | 3.4631 | 2.7630 | 2.0763 | 1.5091 | 1.1062 | 0.8493 | 0.6861 | 0.5674 | 0.4661 | 0.3734 | 0.2893 | 0.2178 | 0.1652 | 0.1349 | 0.1232 | 0.1201 | 0.1179 | 0.1156 | 0.1156 | 0.1179 | |
| 0.20 | 3.0884 | 2.5661 | 2.0076 | 1.5091 | 1.1261 | 0.8636 | 0.6905 | 0.5677 | 0.4686 | 0.3815 | 0.3034 | 0.2352 | 0.1809 | 0.1445 | 0.1260 | 0.1187 | 0.1146 | 0.1106 | 0.1088 | 0.1106 | 0.1146 | |
| 0.25 | 2.2251 | 1.8210 | 1.4310 | 1.1062 | 0.8636 | 0.6910 | 0.5648 | 0.4655 | 0.3827 | 0.3114 | 0.2494 | 0.1974 | 0.1581 | 0.1332 | 0.1203 | 0.1133 | 0.1078 | 0.1041 | 0.1041 | 0.1078 | 0.1133 | |
| 0.30 | 1.5656 | 1.2955 | 1.0507 | 0.8493 | 0.6905 | 0.5648 | 0.4636 | 0.3817 | 0.3151 | 0.2595 | 0.2124 | 0.1733 | 0.1437 | 0.1240 | 0.1119 | 0.1038 | 0.0983 | 0.0962 | 0.0983 | 0.1038 | 0.1119 | |
| 0.35 | 1.1330 | 0.9698 | 0.8198 | 0.6861 | 0.5677 | 0.4655 | 0.3817 | 0.3161 | 0.2648 | 0.2230 | 0.1868 | 0.1553 | 0.1298 | 0.1113 | 0.0985 | 0.0900 | 0.0857 | 0.0857 | 0.0900 | 0.0985 | 0.1113 | |
| 0.40 | 0.8751 | 0.7746 | 0.6712 | 0.5674 | 0.4686 | 0.3827 | 0.3151 | 0.2648 | 0.2268 | 0.1949 | 0.1648 | 0.1365 | 0.1126 | 0.0944 | 0.0816 | 0.0739 | 0.0714 | 0.0739 | 0.0816 | 0.0944 | 0.1126 | |
| 0.45 | 0.7145 | 0.6407 | 0.5558 | 0.4661 | 0.3815 | 0.3114 | 0.2595 | 0.2230 | 0.1949 | 0.1685 | 0.1411 | 0.1150 | 0.0931 | 0.0762 | 0.0642 | 0.0580 | 0.0580 | 0.0642 | 0.0762 | 0.0931 | 0.1150 | |
| 0.50 | 0.5925 | 0.5279 | 0.4518 | 0.3734 | 0.3034 | 0.2494 | 0.2124 | 0.1868 | 0.1648 | 0.1411 | 0.1163 | 0.0934 | 0.0743 | 0.0591 | 0.0487 | 0.0449 | 0.0487 | 0.0591 | 0.0743 | 0.0934 | 0.1163 | |
| 0.55 | 0.4825 | 0.4225 | 0.3549 | 0.2893 | 0.2352 | 0.1974 | 0.1733 | 0.1553 | 0.1365 | 0.1150 | 0.0934 | 0.0740 | 0.0575 | 0.0445 | 0.0370 | 0.0370 | 0.0445 | 0.0575 | 0.0740 | 0.0934 | 0.1150 | |
| 0.60 | 0.3789 | 0.3249 | 0.2682 | 0.2178 | 0.1809 | 0.1581 | 0.1437 | 0.1298 | 0.1126 | 0.0931 | 0.0743 | 0.0575 | 0.0436 | 0.0341 | 0.0308 | 0.0341 | 0.0436 | 0.0575 | 0.0743 | 0.0931 | 0.1126 | |
| 0.65 | 0.2852 | 0.2407 | 0.1983 | 0.1652 | 0.1445 | 0.1332 | 0.1240 | 0.1113 | 0.0944 | 0.0762 | 0.0591 | 0.0445 | 0.0341 | 0.0293 | 0.0293 | 0.0341 | 0.0445 | 0.0591 | 0.0762 | 0.0944 | 0.1113 | |
| 0.70 | 0.2093 | 0.1782 | 0.1522 | 0.1349 | 0.1260 | 0.1203 | 0.1119 | 0.0985 | 0.0816 | 0.0642 | 0.0487 | 0.0370 | 0.0308 | 0.0293 | 0.0308 | 0.0370 | 0.0487 | 0.0642 | 0.0816 | 0.0985 | 0.1119 | |
| 0.75 | 0.1591 | 0.1428 | 0.1307 | 0.1232 | 0.1187 | 0.1133 | 0.1038 | 0.0900 | 0.0739 | 0.0580 | 0.0449 | 0.0370 | 0.0341 | 0.0341 | 0.0370 | 0.0449 | 0.0580 | 0.0739 | 0.0900 | 0.1038 | 0.1133 | |
| 0.80 | 0.1362 | 0.1309 | 0.1256 | 0.1201 | 0.1146 | 0.1078 | 0.0983 | 0.0857 | 0.0714 | 0.0580 | 0.0487 | 0.0445 | 0.0436 | 0.0445 | 0.0487 | 0.0580 | 0.0714 | 0.0857 | 0.0983 | 0.1078 | 0.1146 | |
| 0.85 | 0.1323 | 0.1310 | 0.1256 | 0.1179 | 0.1106 | 0.1041 | 0.0962 | 0.0857 | 0.0739 | 0.0642 | 0.0591 | 0.0575 | 0.0575 | 0.0591 | 0.0642 | 0.0739 | 0.0857 | 0.0962 | 0.1041 | 0.1106 | 0.1179 | |
| 0.90 | 0.1348 | 0.1327 | 0.1249 | 0.1156 | 0.1088 | 0.1041 | 0.0983 | 0.0900 | 0.0816 | 0.0762 | 0.0743 | 0.0740 | 0.0743 | 0.0762 | 0.0816 | 0.0900 | 0.0983 | 0.1041 | 0.1088 | 0.1156 | 0.1249 | |
| 0.95 | 0.1362 | 0.1328 | 0.1242 | 0.1156 | 0.1106 | 0.1078 | 0.1038 | 0.0985 | 0.0944 | 0.0931 | 0.0934 | 0.0934 | 0.0931 | 0.0944 | 0.0985 | 0.1038 | 0.1078 | 0.1106 | 0.1156 | 0.1242 | 0.1328 | |
| 0.1363 | 0.1328 | 0.1249 | 0.1179 | 0.1146 | 0.1133 | 0.1119 | 0.1113 | 0.1126 | 0.1150 | 0.1163 | 0.1150 | 0.1126 | 0.1113 | 0.1119 | 0.1133 | 0.1146 | 0.1179 | 0.1249 | 0.1328 | 0.1363 |
| 0.00 | 0.05 | 0.10 | 0.15 | 0.20 | 0.25 | 0.30 | 0.35 | 0.40 | 0.45 | 0.50 | 0.55 | 0.60 | 0.65 | 0.70 | 0.75 | 0.80 | 0.85 | 0.90 | 0.95 | |||
|---|---|---|---|---|---|---|---|---|---|---|---|---|---|---|---|---|---|---|---|---|---|---|
| 0.00 | 6.6935 | 6.4649 | 5.8204 | 4.8787 | 3.8135 | 2.8089 | 2.0016 | 1.4428 | 1.1004 | 0.8989 | 0.7664 | 0.6600 | 0.5655 | 0.4828 | 0.4138 | 0.3578 | 0.3118 | 0.2732 | 0.2414 | 0.2194 | 0.2114 | |
| 0.05 | 6.4649 | 6.0287 | 5.2377 | 4.2400 | 3.2157 | 2.3250 | 1.6601 | 1.2270 | 0.9685 | 0.8093 | 0.6930 | 0.5934 | 0.5053 | 0.4304 | 0.3693 | 0.3201 | 0.2796 | 0.2459 | 0.2201 | 0.2056 | 0.2056 | |
| 0.10 | 5.8204 | 5.2377 | 4.3955 | 3.4515 | 2.5641 | 1.8474 | 1.3433 | 1.0251 | 0.8299 | 0.6973 | 0.5913 | 0.4991 | 0.4200 | 0.3552 | 0.3041 | 0.2639 | 0.2317 | 0.2065 | 0.1895 | 0.1834 | 0.1895 | |
| 0.15 | 4.8787 | 4.2400 | 3.4515 | 2.6532 | 1.9587 | 1.4305 | 1.0711 | 0.8406 | 0.6866 | 0.5704 | 0.4733 | 0.3908 | 0.3233 | 0.2711 | 0.2321 | 0.2031 | 0.1817 | 0.1665 | 0.1583 | 0.1583 | 0.1665 | |
| 0.20 | 3.8135 | 3.2157 | 2.5641 | 1.9587 | 1.4634 | 1.0989 | 0.8483 | 0.6754 | 0.5464 | 0.4422 | 0.3556 | 0.2857 | 0.2325 | 0.1946 | 0.1687 | 0.1518 | 0.1408 | 0.1339 | 0.1313 | 0.1339 | 0.1408 | |
| 0.25 | 2.8089 | 2.3250 | 1.8474 | 1.4305 | 1.0989 | 0.8517 | 0.6701 | 0.5309 | 0.4187 | 0.3270 | 0.2543 | 0.1999 | 0.1621 | 0.1381 | 0.1239 | 0.1161 | 0.1112 | 0.1083 | 0.1083 | 0.1112 | 0.1161 | |
| 0.30 | 2.0016 | 1.6601 | 1.3433 | 1.0711 | 0.8483 | 0.6701 | 0.5261 | 0.4077 | 0.3110 | 0.2354 | 0.1798 | 0.1418 | 0.1179 | 0.1040 | 0.0962 | 0.0912 | 0.0873 | 0.0857 | 0.0873 | 0.0912 | 0.0962 | |
| 0.35 | 1.4428 | 1.2270 | 1.0251 | 0.8406 | 0.6754 | 0.5309 | 0.4077 | 0.3063 | 0.2279 | 0.1715 | 0.1336 | 0.1094 | 0.0942 | 0.0839 | 0.0760 | 0.0695 | 0.0655 | 0.0655 | 0.0695 | 0.0760 | 0.0839 | |
| 0.40 | 1.1004 | 0.9685 | 0.8299 | 0.6866 | 0.5464 | 0.4187 | 0.3110 | 0.2279 | 0.1696 | 0.1320 | 0.1084 | 0.0926 | 0.0799 | 0.0679 | 0.0577 | 0.0512 | 0.0492 | 0.0512 | 0.0577 | 0.0679 | 0.0799 | |
| 0.45 | 0.8989 | 0.8093 | 0.6973 | 0.5704 | 0.4422 | 0.3270 | 0.2354 | 0.1715 | 0.1320 | 0.1089 | 0.0940 | 0.0809 | 0.0667 | 0.0527 | 0.0439 | 0.0419 | 0.0419 | 0.0439 | 0.0527 | 0.0667 | 0.0809 | |
| 0.50 | 0.7664 | 0.6930 | 0.5913 | 0.4733 | 0.3556 | 0.2543 | 0.1798 | 0.1336 | 0.1084 | 0.0940 | 0.0821 | 0.0683 | 0.0528 | 0.0416 | 0.0403 | 0.0419 | 0.0403 | 0.0416 | 0.0528 | 0.0683 | 0.0821 | |
| 0.55 | 0.6600 | 0.5934 | 0.4991 | 0.3908 | 0.2857 | 0.1999 | 0.1418 | 0.1094 | 0.0926 | 0.0809 | 0.0683 | 0.0536 | 0.0418 | 0.0403 | 0.0447 | 0.0447 | 0.0403 | 0.0418 | 0.0536 | 0.0683 | 0.0809 | |
| 0.60 | 0.5655 | 0.5053 | 0.4200 | 0.3233 | 0.2325 | 0.1621 | 0.1179 | 0.0942 | 0.0799 | 0.0667 | 0.0528 | 0.0418 | 0.0404 | 0.0464 | 0.0498 | 0.0464 | 0.0404 | 0.0418 | 0.0528 | 0.0667 | 0.0799 | |
| 0.65 | 0.4828 | 0.4304 | 0.3552 | 0.2711 | 0.1946 | 0.1381 | 0.1040 | 0.0839 | 0.0679 | 0.0527 | 0.0416 | 0.0403 | 0.0464 | 0.0519 | 0.0519 | 0.0464 | 0.0403 | 0.0416 | 0.0527 | 0.0679 | 0.0839 | |
| 0.70 | 0.4138 | 0.3693 | 0.3041 | 0.2321 | 0.1687 | 0.1239 | 0.0962 | 0.0760 | 0.0577 | 0.0439 | 0.0403 | 0.0447 | 0.0498 | 0.0519 | 0.0498 | 0.0447 | 0.0403 | 0.0439 | 0.0577 | 0.0760 | 0.0962 | |
| 0.75 | 0.3578 | 0.3201 | 0.2639 | 0.2031 | 0.1518 | 0.1161 | 0.0912 | 0.0695 | 0.0512 | 0.0419 | 0.0419 | 0.0447 | 0.0464 | 0.0464 | 0.0447 | 0.0419 | 0.0419 | 0.0512 | 0.0695 | 0.0912 | 0.1161 | |
| 0.80 | 0.3118 | 0.2796 | 0.2317 | 0.1817 | 0.1408 | 0.1112 | 0.0873 | 0.0655 | 0.0492 | 0.0419 | 0.0403 | 0.0403 | 0.0404 | 0.0403 | 0.0403 | 0.0419 | 0.0492 | 0.0655 | 0.0873 | 0.1112 | 0.1408 | |
| 0.85 | 0.2732 | 0.2459 | 0.2065 | 0.1665 | 0.1339 | 0.1083 | 0.0857 | 0.0655 | 0.0512 | 0.0439 | 0.0416 | 0.0418 | 0.0418 | 0.0416 | 0.0439 | 0.0512 | 0.0655 | 0.0857 | 0.1083 | 0.1339 | 0.1665 | |
| 0.90 | 0.2414 | 0.2201 | 0.1895 | 0.1583 | 0.1313 | 0.1083 | 0.0873 | 0.0695 | 0.0577 | 0.0527 | 0.0528 | 0.0536 | 0.0528 | 0.0527 | 0.0577 | 0.0695 | 0.0873 | 0.1083 | 0.1313 | 0.1583 | 0.1895 | |
| 0.95 | 0.2194 | 0.2056 | 0.1834 | 0.1583 | 0.1339 | 0.1112 | 0.0912 | 0.0760 | 0.0679 | 0.0667 | 0.0683 | 0.0683 | 0.0667 | 0.0679 | 0.0760 | 0.0912 | 0.1112 | 0.1339 | 0.1583 | 0.1834 | 0.2056 | |
| 0.2114 | 0.2056 | 0.1895 | 0.1665 | 0.1408 | 0.1161 | 0.0962 | 0.0839 | 0.0799 | 0.0809 | 0.0821 | 0.0809 | 0.0799 | 0.0839 | 0.0962 | 0.1161 | 0.1408 | 0.1665 | 0.1895 | 0.2056 | 0.2114 |
Disclaimer/Publisher’s Note: The statements, opinions and data contained in all publications are solely those of the individual author(s) and contributor(s) and not of MDPI and/or the editor(s). MDPI and/or the editor(s) disclaim responsibility for any injury to people or property resulting from any ideas, methods, instructions or products referred to in the content. |
© 2023 by the authors. Licensee MDPI, Basel, Switzerland. This article is an open access article distributed under the terms and conditions of the Creative Commons Attribution (CC BY) license (https://creativecommons.org/licenses/by/4.0/).
Share and Cite
El-Menshawy, M.H.; Teamah, A.E.-M.A.M.; Eliwa, M.S.; Al-Essa, L.A.; El-Morshedy, M.; EL-Sagheer, R.M. A New Statistical Technique to Enhance MCGINAR(1) Process Estimates under Symmetric and Asymmetric Data: Fuzzy Time Series Markov Chain and Its Characteristics. Symmetry 2023, 15, 1577. https://doi.org/10.3390/sym15081577
El-Menshawy MH, Teamah AE-MAM, Eliwa MS, Al-Essa LA, El-Morshedy M, EL-Sagheer RM. A New Statistical Technique to Enhance MCGINAR(1) Process Estimates under Symmetric and Asymmetric Data: Fuzzy Time Series Markov Chain and Its Characteristics. Symmetry. 2023; 15(8):1577. https://doi.org/10.3390/sym15081577
Chicago/Turabian StyleEl-Menshawy, Mohammed H., Abd El-Moneim A. M. Teamah, Mohamed S. Eliwa, Laila A. Al-Essa, Mahmoud El-Morshedy, and Rashad M. EL-Sagheer. 2023. "A New Statistical Technique to Enhance MCGINAR(1) Process Estimates under Symmetric and Asymmetric Data: Fuzzy Time Series Markov Chain and Its Characteristics" Symmetry 15, no. 8: 1577. https://doi.org/10.3390/sym15081577


