1. Introduction
Currently, economic development faces resource and environmental constraints, urgently requiring a transformation to green and low-carbon development modes. This transformation greatly depends on green innovation support. As important market-oriented green innovation participants, new energy companies have significantly contributed to promoting renewable energy development and applications, achieving sustainable development and addressing climate change. However, the inception of China’s new energy companies is relatively late, with core green technologies still suffering from “hollowness”. Moreover, there is a shortage of funds and high transition costs, posing challenges for green innovation [
1,
2]. Therefore, evaluating green innovation efficiency and optimizing green innovation resource allocation have become problems worthy of in-depth exploration in the new energy industry.
In practice, different units use different types and quantities of input resources in the production process and produce different types and quantities of output products or services. This diversity leads to asymmetry in data. Companies in different industries may face completely different market conditions, technologies, and production constraints. Even in the same industry, there are differences in technical levels and management levels between companies, which will lead to asymmetric characteristics of input and output data. This makes it necessary to take asymmetry into account when accurately evaluating the relative efficiency levels of decision-making units. The strength of the DEA model lies in its ability to operate without presupposing the form of the production function, thus rendering it applicable to various types of production systems and asymmetric data. The DEA model is applicable in asymmetric data scenarios as it represents a non-parametric method for evaluating efficiency, thereby obviating the need to assume specific data distribution forms. This characteristic enables DEA to flexibly handle diverse data types, including asymmetric datasets. In situations involving asymmetric data, traditional parametric methods may encounter limitations as they typically require data to adhere to specific distribution assumptions, such as normal distribution. However, real-world data often exhibit complex distributional features and do not always conform to these assumptions. Given that DEA does not necessitate assumptions regarding data distribution, it can better accommodate such circumstances. Furthermore, DEA also effectively handles cases with multiple inputs and outputs, providing an advantage when assessing the efficiency of various organizational entities. Hence, in situations characterized by asymmetric and multiple data, the non-parametric nature and flexibility of DEA render it a suitable choice.
Data Envelopment Analysis (DEA) is a non-parametric linear programming method used to evaluate the relative efficiency levels of decision-making units (DMUs) with multi-inputs and multi-outputs. Two DEA models commonly used include the CCR model and the BCC model. The CCR model was first introduced under the assumption of constant returns to scale by researchers Charnes, Cooper, and Rhodes [
3]. Subsequently, Banker, Charnes, and Cooper [
4] modified the assumption to allow for variable returns to scale, presenting the BCC model. However, these DEA models struggle to handle undesirable outputs like environmental pollution emissions. To remedy this deficiency, Tone [
5] proposed the SBM model, considering slack variables and incorporating undesirable output indicators.
In existing studies, the evaluation of green innovation performance is mainly considered from a financial perspective along with influencing factors, and rarely from an input–output perspective, without considering the influence of asymmetric data. In addition, there is relatively limited literature focusing on the micro-enterprise level, with more emphasis placed on regional and industrial levels. Studies on new energy companies lack exploration from the perspective of green innovation, ignore environmental pollution in the process of green innovation, and fail to consider undesirable outputs. In this context, this paper constructs an improved SBM model analytical framework, removing the influence of environmental factors and random factors on green innovation efficiency, and considering environmental pollution emissions in the innovation process as an undesirable output. This helps to accurately evaluate green innovation efficiency based on asymmetric input and output data. Evaluating green innovation efficiency can help companies optimize resource allocation, promote development in a more environmentally friendly and sustainable direction, and make a positive contribution to the realization of the dual goals of high-quality economic development and environmentally sustainable development.
The main contributions of this paper are as follows: (1) providing a reliable evaluation of green innovation efficiency under asymmetric input and output data; (2) determining effective improvement actions based on the slack analysis of environmental variables and random variables that lead to improved process performance; and (3) making fuzzy innovation performance efficient to facilitate understanding and managing innovation resource allocation quality.
The remaining sections of this paper are organized as follows:
Section 2 provides an overview of existing studies on green innovation efficiency.
Section 3 details the research methodology, presenting the specific formulas for the improved SBM model and the entropy method used in this paper.
Section 4 investigates green innovation efficiency based on the improved SBM model and discusses green innovation patterns.
Section 5 summarizes the research findings, highlights the limitations of the paper, and outlines future prospects.
2. Literature Review
Green innovation refers to the process of producing green products, as well as reducing environmental pollution, raw material use, and energy consumption through technology [
6,
7]. Green innovation efficiency is a critical indicator for measuring the level of green innovation, reflecting the optimized allocation of green innovation resources. As green innovation becomes an increasingly hot research topic, the evaluation of green innovation efficiency has also become an important concern for scholars [
8,
9,
10]. At present, studies on green innovation efficiency are primarily conducted at the regional level [
11,
12,
13] and industry level [
14,
15,
16,
17,
18,
19]. However, at the enterprise level, there is a relative lack of research on green innovation efficiency [
20,
21,
22]. The input–output variables of green innovation efficiency are summarized in
Table 1.
An increasing number of studies on evaluating green innovation efficiency are based on the input–output perspective of the DEA model. In the evaluation of green innovation efficiency, various DEA models have been widely applied. Some studies have used a two-stage DEA model to evaluate R&D and achievement transformation efficiency in the innovation process [
28,
29]. The SBM model is used to consider undesirable outputs [
27]. The super-efficient SBM model provides the possibility for the comparison and ranking of efficient DMUs [
30,
31,
32]. The EBM model can not only consider the radial proportion of target value and actual value, but also deal with radial and non-radial relaxation changes, so as to measure efficiency more comprehensively and accurately [
33,
34]. A comparative analysis of the pros and cons of different DEA models is shown in
Table 2.
The innovation process is full of risks and uncertainties. The new energy industry is in a rapidly changing technological environment and is highly sensitive to environmental changes [
37]. The external environment has great influence on the green innovation efficiency of new energy companies. Environmental regulation [
38,
39], industrial agglomeration [
40,
41], foreign investment [
42,
43], and other external environmental factors affect green innovation efficiency to varying degrees. While the DEA model has been widely used for efficiency evaluation, traditional DEA models overlook the influence of the external uncertain environment on green innovation. Meanwhile, studies on the innovation efficiency of new energy companies have been continuously carried out [
44,
45,
46,
47], but have not been further explored from the perspective of green innovation [
48], ignoring the influence of resource waste and environmental pollution on new energy companies.
In this context, this paper has established an improved SBM model that eliminates environmental factors and random factors to effectively measure green innovation efficiency under uncertain environments. Under the background of achieving the “double carbon” goal, greenhouse gas emissions are regarded as an undesirable output in the DEA model. Considering the advantage of the entropy method in objective weighting [
49], this paper chooses an entropy method to assign weight to green innovation input variables and then acquire the green innovation comprehensive input. Moreover, based on the green innovation comprehensive input and green innovation efficiency, the green innovation modes are divided into four categories. The improved SBM model and entropy method are combined to help new energy companies achieve high performance from the perspective of green innovation efficiency.
3. Research Methodology
3.1. The Improved SBM Model
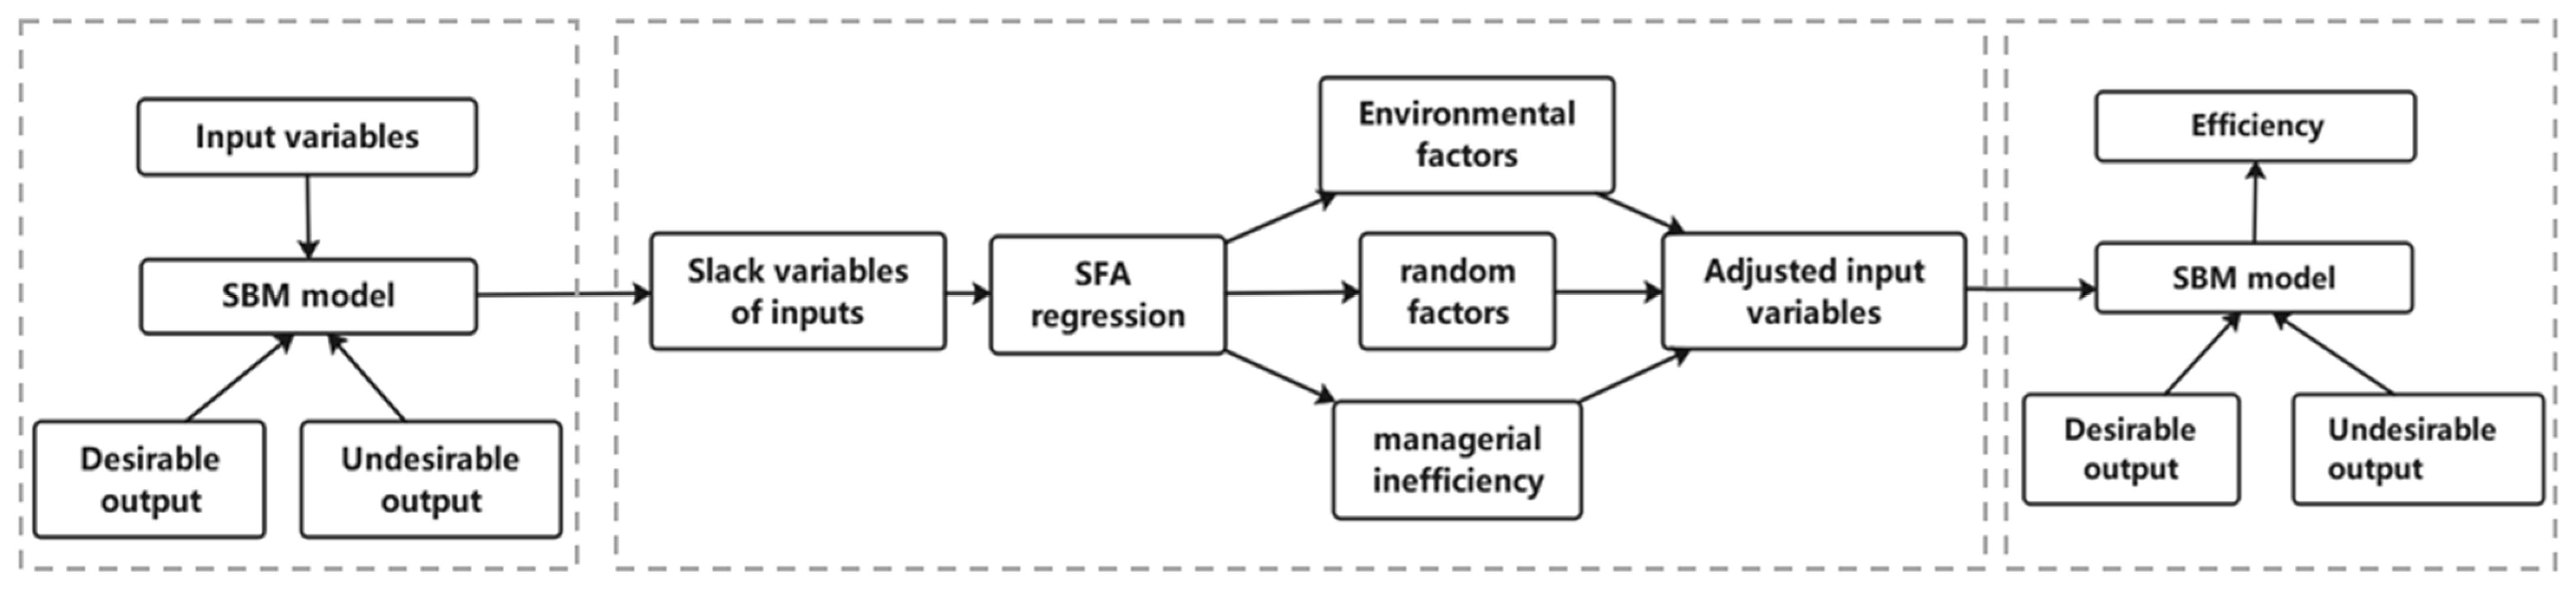
The framework of the improved SBM model for green innovation efficiency analysis using asymmetric data is shown in
Figure 1.
3.1.1. The Initial Stage: SBM Model
In this paper, a non-oriented SBM model is utilized to evaluate efficiency from both input and output perspectives. The formula for the SBM model is as follows:
where vectors
and
represent the slack variables for inputs and non-desirable outputs;
stands for the residual variable for desirable outputs;
, and
denote the numbers of input, desirable output, and non-desirable output variables, respectively;
represents the vector values of the
k-th decision-making unit’s inputs, desirable outputs, and non-desirable outputs; and
represents the vector values of all decision-making units’ inputs, desirable outputs, and non-desirable outputs. Assuming there are
decision-making units,
signifies the weights of the decision-making units.
3.1.2. The Adjustment Stage: SFA Model
Decompose the input slack variables into a function that includes environmental factors, random factors, and managerial inefficiency; then, exclude the environmental factors and random factors to obtain the input redundancy of the decision-making units caused solely by managerial inefficiency. The expression is as follows:
where
represents the slack variable of the
k-th decision-making unit on the
n-th input;
denotes the influence of environmental factors, usually taken as
;
stands for the observed environmental variables;
represents the parameter vector corresponding to the environmental variables;
denotes the mixed error term where
reflects random factors following a normal distribution,
; and
reflects managerial inefficiency following a truncated normal distribution,
.
By performing SFA regression analysis using Frontier 4.1 software, estimated values for
,
, and parameter
can be obtained. Subsequently, based on the following formulas,
and
are derived.
where
represents the proportion of variance in managerial inefficiency to total variance. When the value of
approaches 1, the influence of managerial inefficiency dominates; when the value of
approaches 0, the influence of random factors dominates.
Separate out the managerial inefficiency term according to the following formula:
where
, the mixed error term
,
and
represent the probability density function and distribution function of the standard normal distribution, respectively.
Once the managerial inefficiency term
is separated, the random factor term
can be obtained using the following formula:
Subsequently, adjust the input variables using the SFA model to obtain new input values:
where
represents the adjusted input,
stands for the original input,
signifies the adjustment for environmental factors’ influence, and
indicates the adjustment for random factors’ influence, ensuring all decision-making units are under equivalent conditions.
3.1.3. The Final Stage: The SBM Model after Adjusting the Input Variables
The input variables obtained during the adjustment stage, along with the original output variables, are reintroduced into the SBM model for efficiency evaluation. The efficiency value at this point eliminates the influence of environmental factors and random factors, thus reflecting a more realistic green innovation efficiency scenario.
3.2. Entropy Method
The entropy method uses information entropy to measure the degree of correlation between indicators, enabling the consideration of the interrelationships and correlations among different indicators. By calculating the information entropy of indicators, weight allocation is determined. This method helps avoid subjective influence on weight, thereby enhancing the objectivity and fairness of the assessment results. The setup of the entropy method is as follows:
- (1)
Utilize the extreme value method to standardize each indicator, with the formula as follows:
Positive index standardization formula: .
Negative index standardization formula: .
Assume the data comprise companies and indicators, where represents the observed value of the j-th indicator for the i-th company and denotes the standardized values of the respective indicators.
For meaningful data computation, it is necessary to eliminate zero and negative values. Hence, the standardized data should undergo an overall shift, that is . In order to preserve the intrinsic patterns of the original data to the greatest extent, the value of must be as small as possible, therefore taking .
- (2)
Calculate the weight of the j-th indicator for the i-th company:
- (3)
Calculate the entropy value of the j-th indicator, , where and , satisfying .
- (4)
Calculate the redundancy of information entropy: .
- (5)
Calculate the entropy weight of the j-th indicator: .
- (6)
Calculate the comprehensive score: .
4. Research Results
4.1. Variable Selection and Data Sources
Input variables are selected from three perspectives: labor input, capital input, and energy input. For labor input, the company’s human capital investment is reflected by the number of employees. The number of R&D personnel is chosen as the labor input variable. For capital input, R&D expenditure is selected. For energy input, comprehensive energy consumption is chosen.
The output variables are divided into desirable and undesirable outputs. The desirable output variables are selected from both technological and economic aspects. In terms of technological output, the number of green patent applications is chosen as the variable. These patents typically involve new technologies, products, or solutions with environmentally friendly characteristics, reflecting a company’s technological innovation capability in environmental protection and sustainable development. In terms of economic output, the main business income is selected as the economic output variable, representing the sales revenue obtained by the company through its main business operations. The selection of the undesirable output variable is greenhouse gas emissions. New energy companies promote the transition to a low-carbon economy by providing clean energy solutions. The choice of greenhouse gas emissions reflects how well a company has achieved this goal.
Five variables, namely environmental regulation intensity, technological market environment, educational environment, economic development level, and regional openness, were selected as environmental factors for the improved SBM model.
The input variables, output variables, environmental factors, and data sources are described in
Table 3.
Data source description: This paper selects A-share listed companies in the new energy sector as the research sample. The sample selection principles are as follows: first, exclude ST and *ST companies; secondly, exclude companies that have not disclosed ESG reports or social responsibility reports, as well as companies with missing indicators. Finally, 40 new energy listed companies are selected as the sample for this paper, including photovoltaic companies, wind power companies, new energy vehicle companies, and electric power equipment manufacturing companies, among others. The year 2021 is chosen as the research period. Data are sourced from the annual reports of listed companies, ESG reports, social responsibility reports, and the CNRDS database, as well as statistical yearbooks.
4.2. Analysis of Green Innovation Efficiency Based on Improved SBM Model
4.2.1. The Initial Stage of Green Innovation Efficiency Analysis
Utilizing MaxDEA Ultra 9.1 software and based on the SBM model, the original green innovation efficiency of 40 new energy companies in 2021 was calculated without excluding environmental factors and random factors, as shown in
Table 4.
According to
Table 4, the mean technical efficiency of 40 new energy companies is 0.241, indicating a relatively low level, with 7 companies achieving DEA effectiveness. Pure technical efficiency primarily reflects the level of technological innovation, management, and resource utilization in the production process. The mean pure technical efficiency is 0.466, also at a relatively low level, suggesting that the sample companies have lower levels of technology and management. Scale efficiency represents the rationality of company size and mainly reflects the influence of scale on efficiency. From the perspective of scale efficiency, the mean scale efficiency is 0.558. Of these 40 companies, 7 companies operate at constant returns to scale, 22 companies experience decreasing returns to scale, and 11 companies exhibit increasing returns to scale. Therefore, it is evident that a majority of the companies among the 40 new energy companies face issues related to excessive scale, making it difficult for resources to be effectively coordinated from various aspects. An evaluation of the efficiency for each company reveals significant differences in the green innovation efficiency among these companies.
By projecting onto the efficient frontier, it is possible to identify which indicators need adjustment in order to achieve higher efficiency. Based on the SBM model, the slack variables of inputs and outputs for 40 new energy companies are measured, and the results are shown in
Table 5.
From
Table 5, it is noticeable that in terms of inputs, the improvement values are negative across all three input variables. This indicates an excessive input situation, signaling that these companies have used resources beyond the required level to achieve corresponding outputs. Labor and capital inputs require significant improvement, indicating redundancy in both manpower and financial inputs for R&D. An improved allocation of manpower and funds is necessary to reduce redundancy and ensure more effective resource utilization. The need for improvement in energy input is relatively minor.
In terms of outputs, economic output is relatively close to the target value, suggesting that most companies prioritize economic benefits. However, there is a considerable gap between the target values and the actual levels for both technical output and environmental pollution emissions. Enhancing a company’s innovation capability is critical to increasing technical output and achieving the desired results.
Through the analysis of input redundancy and output insufficiency, a company’s resource utilization efficiency can be evaluated and improved directions for the redundancies and deficiencies of inputs and outputs are able to be provided. These analytical results can offer decision-making suggestions for managers to achieve rational resource allocation, enhance green innovation efficiency, and promote sustainable development.
4.2.2. The Adjustment Stage of SFA Regression Analysis
The slack variables of the inputs measured by the first-stage SBM model are taken as the dependent variables, while environmental regulation intensity, technological market environment, educational environment, economic development level, and regional openness are used as independent variables. SFA regression is conducted using Frontier 4.1, and the results are presented in
Table 6.
From
Table 6, it is evident that the LR test of the one-sided error is significant at the 1% level, indicating the rejection of the hypothesis that managerial inefficiency does not exist. This suggests that managerial inefficiency has an influence on the slack variable of three inputs. Moreover, the gamma value is 1, indicating that the dominant effect is due to managerial inefficiency, while the influence of random factors on the green innovation efficiency of companies is limited. Therefore, the selection of the SFA model is deemed reasonable.
The environmental regulation intensity shows a positive correlation with the slack variable of R&D expenditure at a significant level of 1%, indicating that an increase in environmental regulation intensity leads to redundant increase in R&D expenditure. With the strengthening of environmental regulations, companies may need to adopt cleaner, low-carbon, or environmentally friendly technologies to comply with new environmental standards, involving costs related to the reconfiguration of production facilities, equipment, and infrastructure. These adjustment costs may augment a company’s R&D expenditure.
At the 1% significance level, the technological market environment exhibits a negative correlation with the slack variable of R&D expenditure. The improvement in the technological market environment enables companies to be more targeted in conducting R&D projects, better plan and manage R&D activities, and reduce unnecessary redundancy in R&D expenditure.
At the 1% significance level, the education environment exhibits a positive correlation with the slack variables of the number of R&D personnel, R&D expenditure, and comprehensive energy consumption. An increase in local education expenditure may lead to an oversupply of talent, resulting in redundancy among R&D personnel within companies. As the local education level improves, companies may face technological innovation competition from peers. To maintain market competitiveness, companies may increase R&D expenditure to drive technological innovation.
The economic development level shows a positive correlation at a 5% significance level with the slack variable of the number of R&D personnel, a 1% significance level with the slack variable of R&D expenditure, and a 10% significance level with the slack variable of comprehensive energy consumption. With regional economic development, more investment opportunities and innovative projects emerge, leading to an increase in a company’s R&D personnel, financial input, and energy consumption.
At the 1% significance level, regional openness exhibits a negative correlation with the slack variables of number of R&D personnel, R&D expenditure, and comprehensive energy consumption. Regions with high openness often create a favorable innovation ecosystem where external cooperation can bring advanced technology, innovative management experience, and R&D resources to companies. This facilitates more effective R&D personnel, funds, and energy utilization, reducing redundancy.
4.2.3. The Final Stage of Green Innovation Efficiency Analysis
Substituting the adjusted input variables for the original input variables while keeping the output variables unchanged, the green innovation efficiency of new energy companies is re-evaluated using the SBM model. This allows for the determination of efficiency after eliminating the influence of environmental factors and random factors, as illustrated in
Table 7.
In the final stage, the number of companies achieving DEA effectiveness increased from seven to eight. Among these, five companies (Sungrow Power Supply, State Grid Yingda, Ningbo Joyson Electronic, China Suntien Green Energy, and CMOC) maintain positions on the efficiency frontier both before and after adjustments, indicating that the green innovation efficiency of these companies is not influenced by environmental factors or random factors. However, two companies, State Grid Information&Communication and Datang International Power Generation, that achieve DEA effectiveness in the initial stage do not reach the efficiency frontier in the final stage, with decreased efficiency values, suggesting that initially high efficiency is related to favorable environmental conditions, and the actual level of green innovation efficiency is not as high. Meanwhile, Shenzhen Expressway, Shanghai Electric, and XTC New Energy Materials reach the efficiency frontier after eliminating environmental factors and random factors, indicating that the green innovation efficiency of these companies in the initial stage is influenced by adverse environmental conditions, and the actual level of green innovation efficiency exceeds that calculated previously.
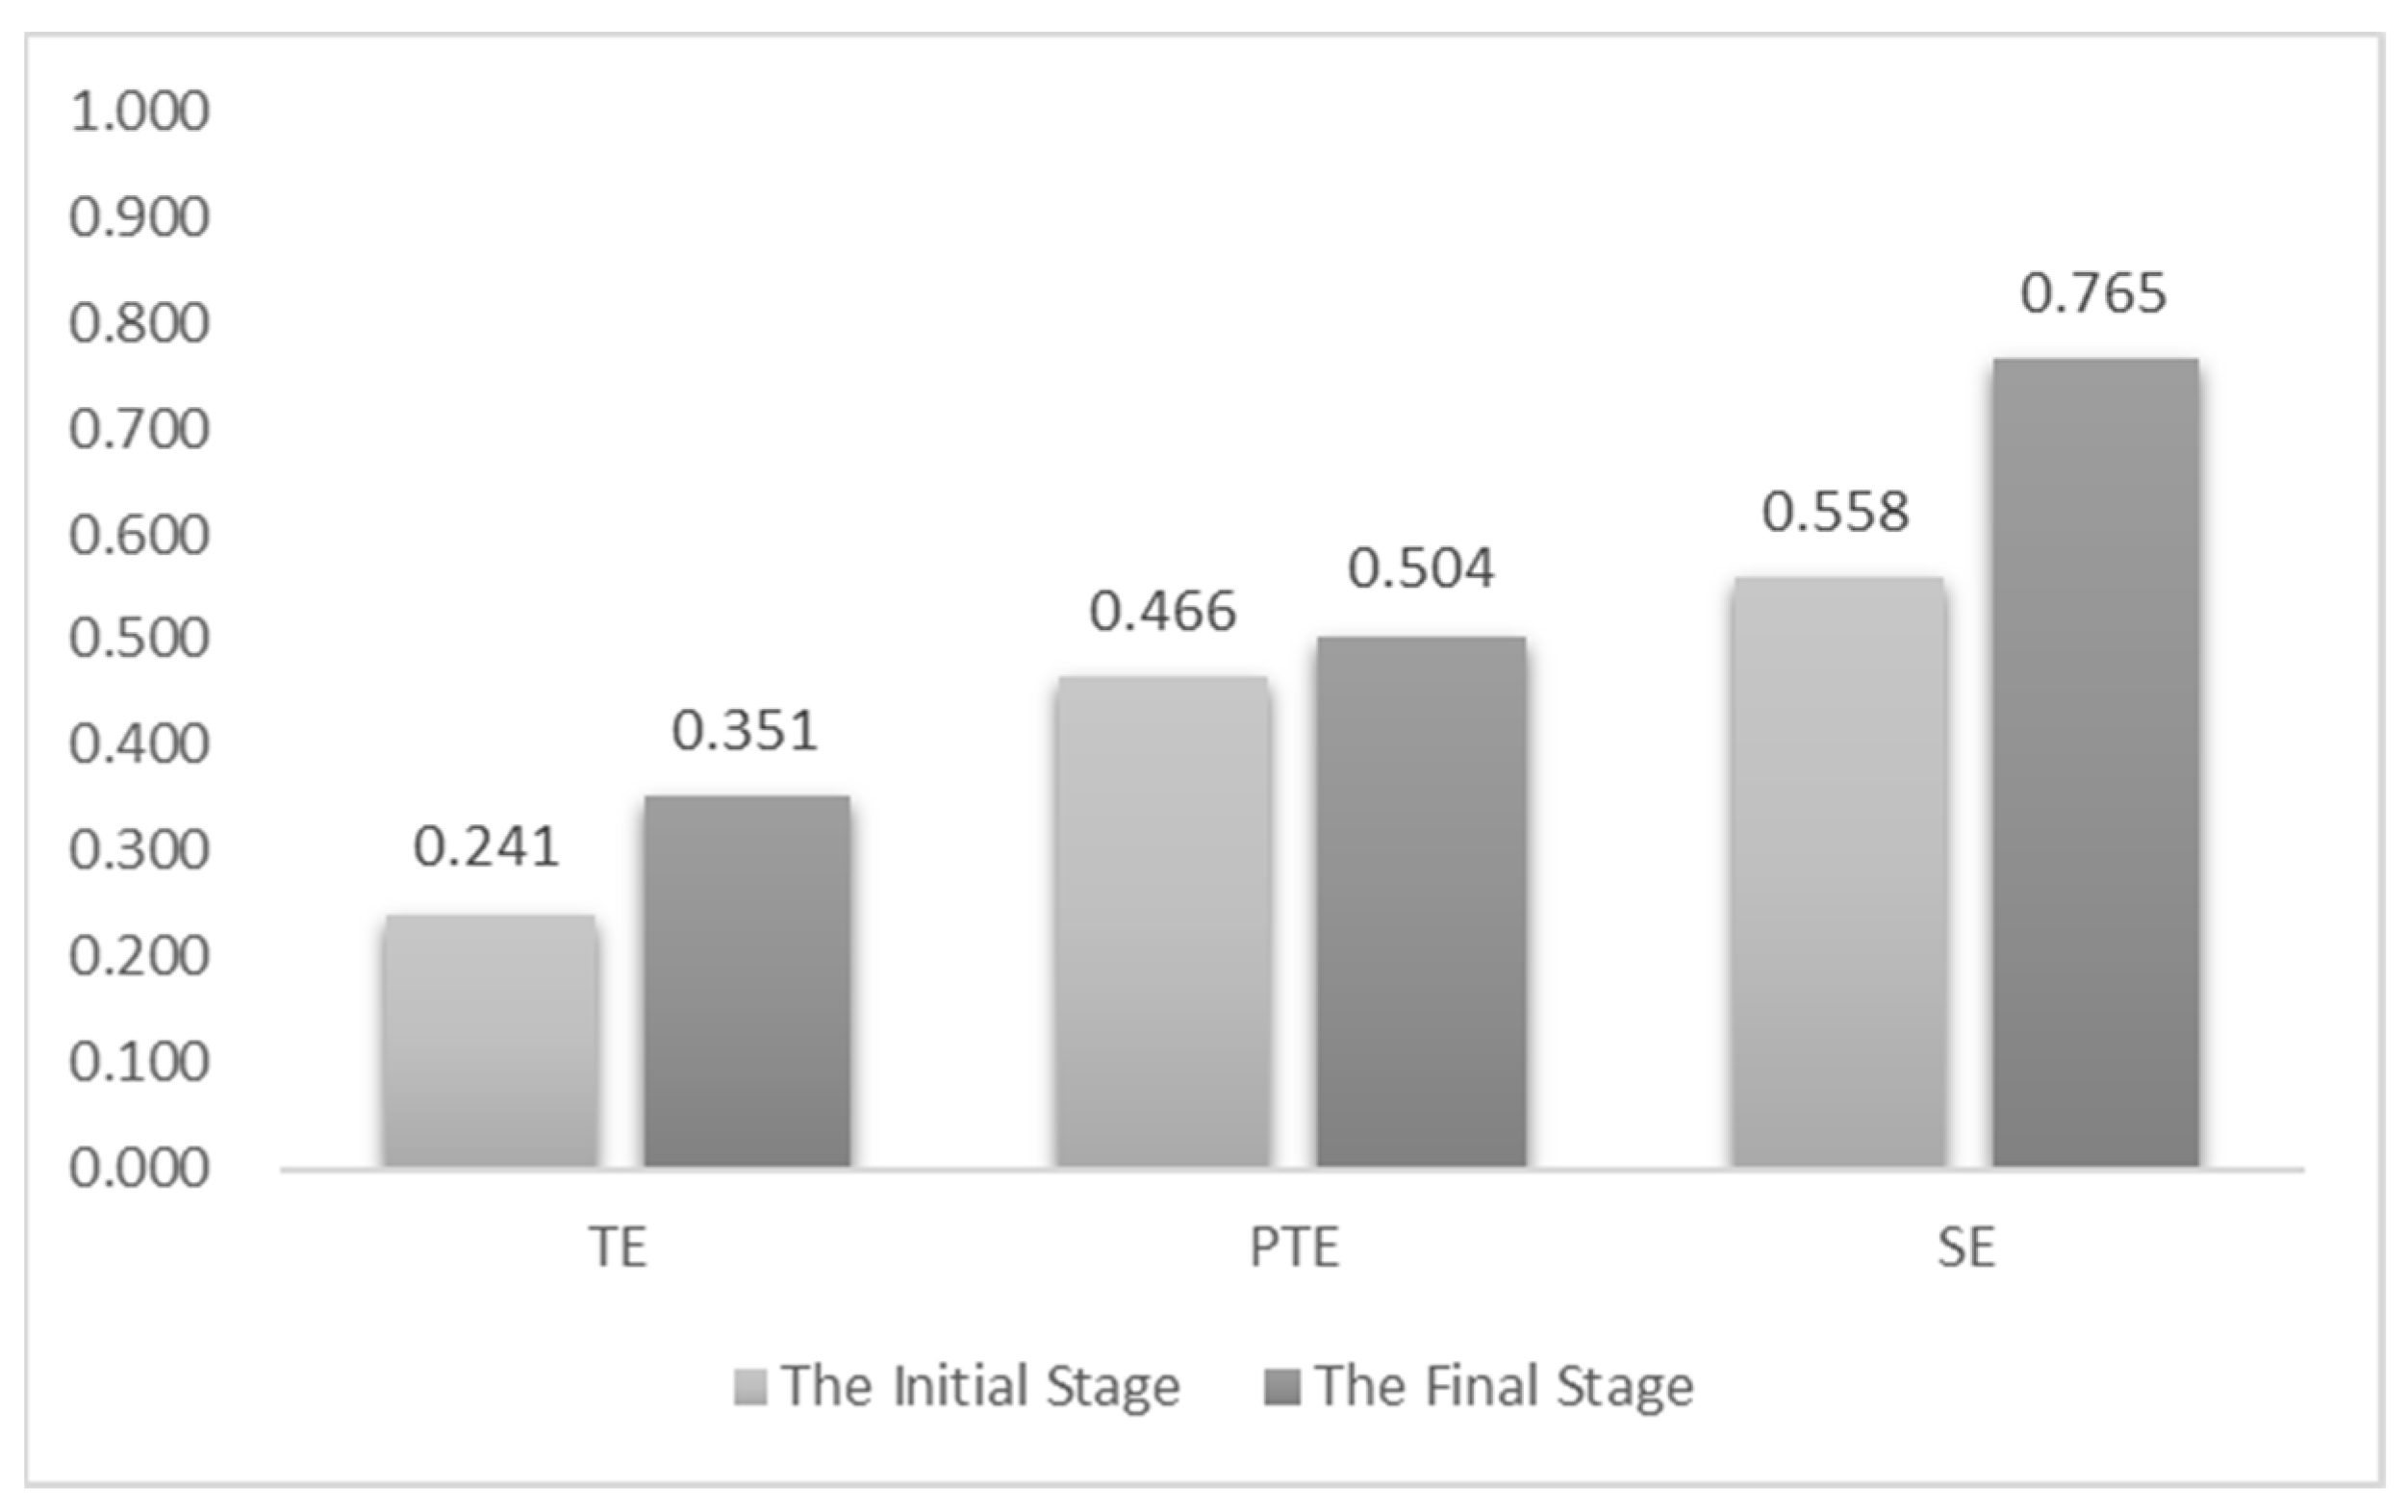
By comparing the green innovation efficiency between the initial stage and the final stage in
Figure 2, it can be found that after eliminating environmental factors and random factors, the mean technical efficiency increased from 0.241 to 0.351, mean pure technical efficiency rose from 0.466 to 0.504, and mean scale efficiency increased from 0.558 to 0.765. In the final stage, these three types of efficiency values showed improvement compared to the initial stage, indicating that the overall green innovation efficiency before adjustment is underestimated due to environmental influence, suggesting certain limitations of external environment on green innovation in new energy companies. Although green innovation efficiency was improved after adjustment, there is still much room for improvement.
From the perspective of returns to scale in
Table 8, after adjusting inputs, the number of companies operating at constant returns to scale increased from 7 to 8, those exhibiting increasing returns to scale rose from 11 to 25, and those exhibiting decreasing returns to scale decreased from 22 to 7. It can be observed that the number of companies operating at increasing returns to scale significantly rose, while the number of companies at decreasing returns to scale notably decreased. This suggests that after eliminating the influence of environmental factors and random factors, the majority of new energy companies expanding their scale of green innovation can yield higher returns.
4.3. Analysis of Green Innovation Pattern
To better reflect the effectiveness of sample companies in green innovation, based on the green innovation comprehensive input and green innovation efficiency of companies, the green innovation patterns of companies are categorized into four types: high input–high efficiency, high input–low efficiency, low input–high efficiency, and low input–low efficiency. For each type, a thorough analysis of underlying reasons is conducted, followed by tailored solutions for each type.
4.3.1. Green Innovation Comprehensive Input Based on Entropy Method
For the determination of green innovation comprehensive input for companies, a comprehensive objective evaluation method (entropy method) is employed. Based on the variability of each variable, the weights for labor input, capital input, and energy input are calculated, thereby deriving the green innovation comprehensive input for each new energy company. The application of the entropy method yields the weights for green innovation input for new energy companies, as shown in
Table 9.
The results of applying the entropy method to obtain the green innovation comprehensive input for new energy companies are shown in
Table 10.
4.3.2. Analysis of Green Innovation Patterns
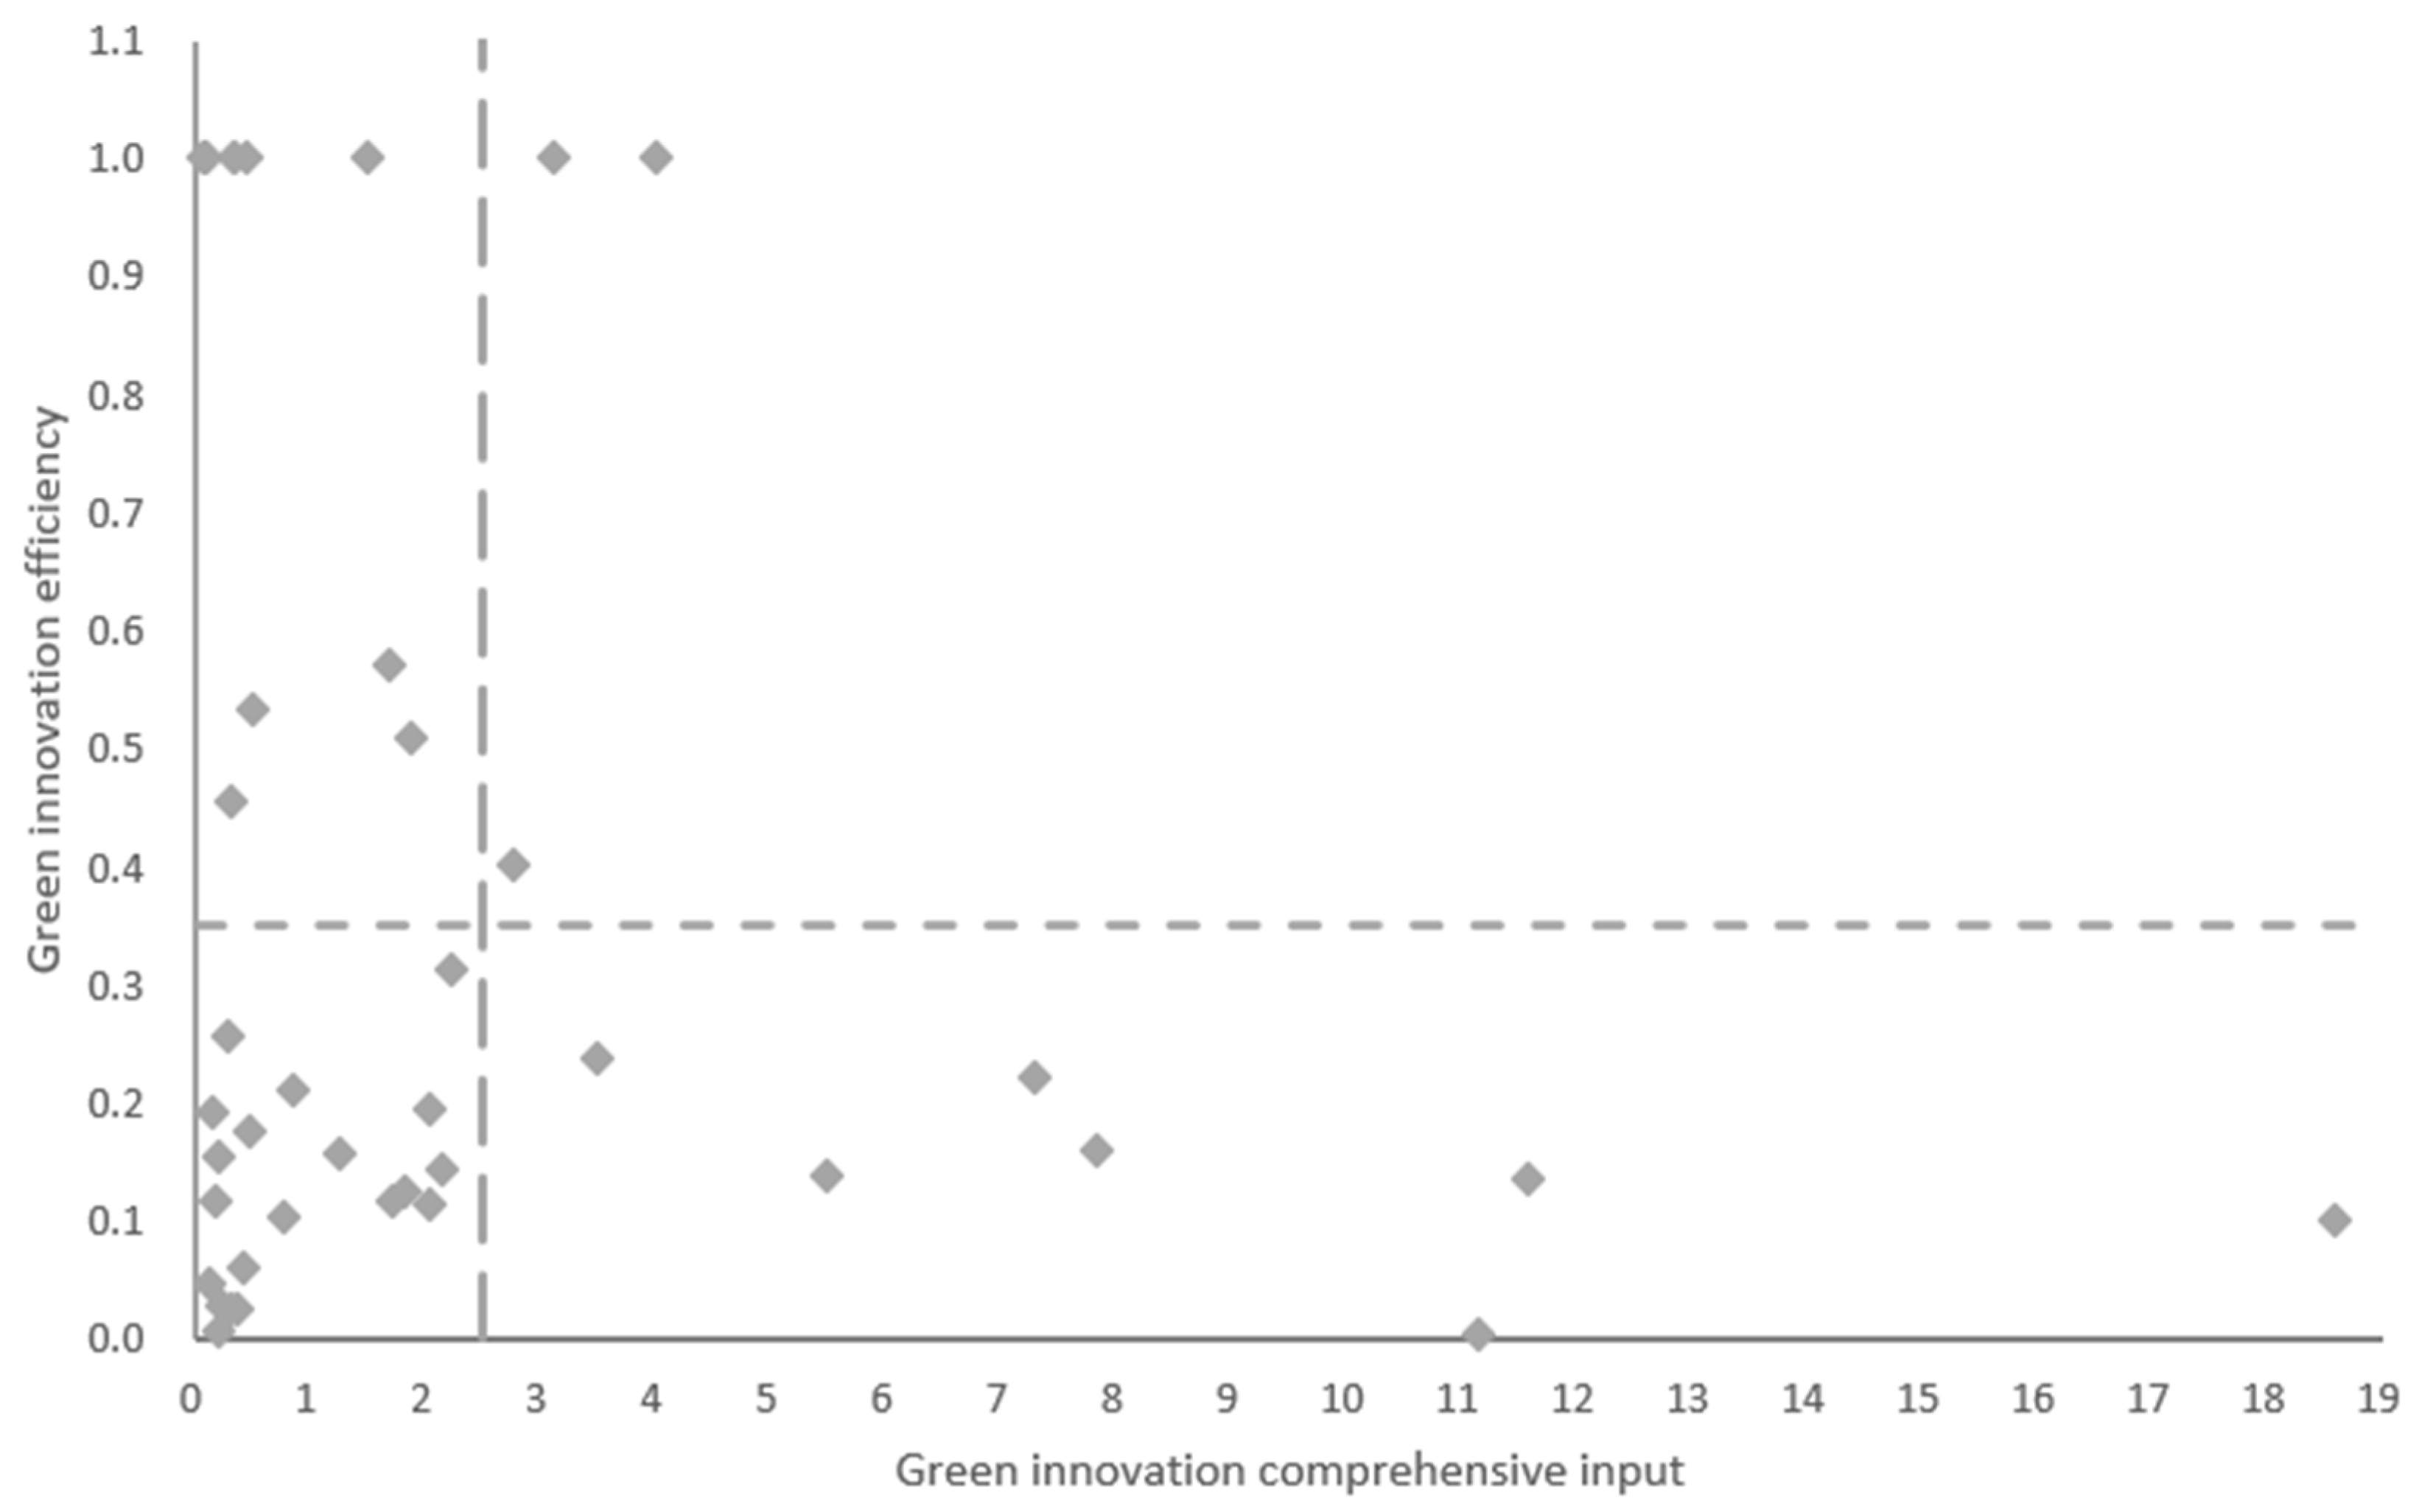
Using green innovation comprehensive input as the horizontal axis and green innovation efficiency as the vertical axis, a scatter plot for 40 new energy companies in 2021 is constructed. The sample is divided into four quadrants based on the mean of the sample (2.500, 0.351). The dashed line on the horizontal axis represents the green innovation comprehensive input = 2.500, and the dashed line on the vertical axis represents the green innovation efficiency = 0.351, as illustrated in
Figure 3.
The companies located in the first quadrant are characterized by the “high input–high efficiency” green innovation pattern, including Shanghai Electric, Ningbo Joyson Electronic, and Dongfang Electric. These three companies demonstrate a high level of green innovation resource allocation, effectively translating green innovation inputs into technological advancements and economic returns. For future development, it is essential to maintain sensitivity to market trends and competitive environments, and to flexibly adjust strategies to seize new opportunities.
The companies located in the second quadrant are characterized by the “low input–high efficiency” green innovation pattern, including 10 companies such as Sungrow Power Supply, China Suntien Green Energy, and Zijin Mining. Although these companies have relatively modest green innovation inputs, their management capabilities are at a high level, allowing for the full utilization of green innovation resources. In the future, a further exploration of green innovation potential is possible.
The companies located in the third quadrant are characterized by the “low input–low efficiency” green innovation pattern, including 20 companies such as Hainan Jinpan Smart Technology, Daqo New Energy, and Baolong Automotive. The largest number of companies being in this quadrant indicates that the green innovation situation for the majority of new energy companies is currently less than ideal. These companies exhibit insufficient green innovation input and require improved resource utilization efficiency.
The companies located in the fourth quadrant are characterized by the “high input–low efficiency” green innovation pattern, including seven companies such as BYD, Great Wall Motor, and China Energy Engineering. These companies demonstrate substantial green innovation resource inputs. However, at the current level of input, these companies have not achieved the expected output, indicating an inefficient transformation of green innovation achievements and a lower efficiency in resource allocation. Therefore, these companies need to enhance their technological, managerial, and resource utilization capabilities.
5. Conclusions and Discussion
5.1. Conclusions
The evaluation results of the improved SBM model indicate that, after eliminating environmental factors and random factors, the technical efficiency, pure technical efficiency, and scale efficiency of companies have all improved to some extent, but there is still significant room for further improvement. This suggests that the external environment exerts a certain constraint on the green innovation efficiency of new energy companies. After adjustments, scale efficiency remains higher than pure technical efficiency. Therefore, the focus for enhancing green innovation efficiency should prioritize boosting pure technical efficiency to improve the technological and managerial levels of companies. The number of companies operating at increasing returns to scale noticeably increased after adjustment, indicating that continued increases in green innovation efficiency input can effectively enhance scale benefits.
Based on green innovation comprehensive input and green innovation efficiency, this paper categorizes green innovation patterns into four types. Among these, the highest number of companies fall into the “low input–low efficiency” pattern, indicating that the current green innovation situation for the majority of new energy companies is less than ideal, with potential for improvement in both the level of green innovation input and resource utilization.
5.2. Discussion
Since China pledged to the international community in September 2020 to “strive to peak carbon dioxide emissions before 2030 and achieve carbon neutrality before 2060”, green innovation has received unprecedented attention. The “dual-carbon” goals are an essential and core part of China’s overall ecological civilization construction layout, and the realization of this major strategic objective is inseparable from green innovation. As the carriers for strategic implementation, new energy companies should enhance internal operations and management levels. This includes seeking lower-cost and more feasible green technologies and innovative solutions to improve the economic and social benefits of green innovation. Simultaneously, new energy companies should strengthen technological innovation capabilities to reduce the costs and risks of researching and implementing green innovation projects. New energy companies should be guided by a green ecological approach, integrating green innovation into long-term development strategies and prioritizing the long-term benefits of sustainable development.
This paper establishes an improved SBM model analysis framework that effectively evaluates the efficiency of asymmetric input–output data. It provides researchers with a more comprehensive and flexible tool for assessing green innovation efficiency. By evaluating the green innovation efficiency of new energy companies, it assists decision makers in better understanding the allocation of green innovation resources, thereby promoting companies towards more environmentally friendly and efficient development. This aligns with the dual objectives of high-quality economic development and environmental sustainability. Furthermore, this paper categorizes green innovation patterns into four types and proposes corresponding solutions, contributing to providing a basis for relevant policy formulation and guiding companies towards more environmentally friendly and sustainable development.
However, this paper also has some limitations. Firstly, the research only selected 40 new energy companies as research subjects, a relatively small sample size. Secondly, the paper only analyzed the green innovation efficiency for 2021 and lacked a dynamic assessment. Future research could use a larger sample and integrate other methods and models to explore resource optimization and efficiency, obtaining more comprehensive results. Different industries may have unique characteristics and factors. Subsequent research could focus on other industries to explore differences in green innovation efficiency and its influencing factors. By integrating these findings with actual management and policymaking, targeted recommendations and guidance can be provided to decision makers.


