Article

A Coordinated Control Strategy of Multi-Type Flexible Resources and Under-Frequency Load Shedding for Active Power Balance

1
Key Laboratory of Power System Intelligent Dispatch and Control of the Ministry of Education, Shandong University, Jinan 250061, China
2
State Grid Zhejiang Marketing Service Center, Hangzhou 310007, China
3
Academy of Intelligent Innovation, Shandong University, Jinan 250101, China
*
Author to whom correspondence should be addressed.
Symmetry 2024, 16(4), 479; https://doi.org/10.3390/sym16040479
Submission received: 9 March 2024 / Revised: 28 March 2024 / Accepted: 6 April 2024 / Published: 15 April 2024
(This article belongs to the Special Issue Symmetry/Asymmetry Studies in Modern Power Systems)

Abstract

:
With the increasing expansion of power systems, there is a growing trend towards active distribution networks for decentralized power generation and energy management. However, the instability of distributed renewable energy introduces complexity to power system operation. The active symmetry and balance of power systems are becoming increasingly important. This paper focuses on the characteristics of distributed resources and under-frequency load shedding, and a coordinated operation and control strategy based on the rapid adjustment of energy storage power is proposed. The characteristics of various controllable resources are analyzed to explore the rapid response capabilities of energy storage. The energy storage types are categorized based on the support time, and the final decision is achieved with power allocation and adjustment control of the energy storage system. Additionally, a comprehensive control strategy for under-frequency load shedding and hierarchical systems is provided for scenarios with insufficient active support. The feasibility of the proposed model and methods is verified via a multi-energy system case.

1. Introduction

Active symmetry and balance refer to the active power balance of a power system between the supply and demand sides [1]. With the rapid development of distributed renewable energy, active distribution networks have become a trend in the evolution of power systems [2]. However, the uncertainty and volatility of distributed renewable energy make the operation of power systems more complex and unstable [3,4]. Concurrently, with the integration of clean energy and distributed controllable loads, the inertia resources and regulation capabilities in the power system are weakened, resulting in a decrease in the system’s frequency response capability and an increased risk of frequency decline [5,6]. Hierarchical coordinated control of controllable resources is crucial for achieving the stable operation and decarbonization of high-penetration renewable energy grids [7]. Research on decentralized resource active support and automatic load-shedding coordination control methods in response to the risk of frequency decline holds significant importance [8,9].
Distributed generation, energy storage systems, controllable loads, and other decentralized resources have distinct characteristics and control capabilities [10,11]. They provide frequency support measures to the power system, effectively reducing the risk of frequency decline and enhancing the stability and reliability of the power system [12,13]. Meanwhile, different types of controllable resources exhibit varying response speeds and control capabilities. The energy storage system has the advantage of flexible output control [14,15]. It is both a key part of the energy Internet and a key support for dealing with large-scale renewable energy grid integration problems and increasing the economy and reliability of the power grid [16,17]. Based on this, the study investigates a hierarchical coordinated control approach for controllable resources in the context of active distribution networks [18,19]. It fully utilizes controllable resources to enhance the flexibility and response speed of the power system [20,21].
Coordination control primarily involves the coordinated control of distributed energy resources, energy storage, loads, and under-frequency load shedding within microgrids. Its essence lies in considering the output characteristics of different types of resources, coordinating output control to achieve power balance. Ref. [22] proposes the use of constant power and constant voltage–frequency control strategies. Ref. [23] achieves coordinated control of the microgrid by monitoring the operating state of the microgrid side and the main power grid through upper-level central control. Ref. [24] sets distributed energy source units in maximum power tracking mode, engages energy storage units in peak shaving during load peaks, and charges them at a constant power to the upper limit of the state of charge during non-peak periods. While various energy source units are coordinated to fully leverage their respective advantages, they can also flexibly coordinate with under-frequency load shedding. Ref. [25] optimizes the allocation of automatic generation control (AGC) commands based on the prediction of perturbation signals as well as information about the state of charge (SOC) of energy storage in combination with a grid adaptive search algorithm on the basis of subdividing the continuous control period. Ref. [26] takes flywheel energy storage as the research object and ensures that the remaining capacity is always in the optimal output state while considering its SOC recovery. Ref. [27] proposes control strategies for two cases of adaptive frequency regulation and self-restoration of charge state for energy storage to realize the coordination between battery storage and thermal power units under the premise of energy storage battery charge state management.
There are many studies on load-shedding emergency control systems. However, separate emergency control tends to over-cut or under-cut phenomena triggering negative effects. Additionally, the current coordination control framework often directs energy storage systems to maintain maximum power output during emergency situations. If the storage SOC is insufficient, it would be difficult for its output power to reach the desired value. This is equivalent to a new power deficit under an emergency situation. At this time, it is difficult to maintain the stability of the system with the coordination system of energy storage and load shedding. Therefore, this paper proposes a coordinated control strategy based on the flexible output of energy storage. Based on the flexible output characteristics of the energy storage unit, the fluctuation of renewable energy is suppressed, and the means of low-frequency load shedding is combined to accomplish the coordinated control of the system as a whole. The main contribution of this paper has three main aspects. Firstly, an energy storage output control measure based on different SOC states is designed to provide leaner control of energy storage in the face of different demands. Secondly, a mathematical model of load slicing based on differential evolutionary algorithm is proposed to compress the amount of load slicing under the premise of satisfying the power balance. Thirdly, a complete coordinated control framework is proposed, which takes into account the characteristics of multiple flexible resources, achieves the minimum fluctuation curve in the steady state, and cooperates with the load shedding to complete the emergency control in the emergency state.
The rest of this paper is organized as follows. Section 2.1 considers the characteristics of the different types of controllable resources involved in the frequency response. Additionally, the energy storage control strategies with emergency load-shedding optimization models for different SOC states are presented in Section 2.2. Section 2.3 presents the hierarchical coordinated control approach for systems containing multiple types of controllable resources. The case study is carried out in Section 3. Finally, conclusions and discussion are drawn in Section 4.

2. Materials and Methods

2.1. Controllable Resources Participating in Frequency Response

2.1.1. Inertia Analysis

First, the difference between the synchronous generator in traditional thermal power unit and frequency regulation capabilities of energy storage was analyzed. The total inertia of the generator and prime mover in traditional thermal power units accelerates through the imbalance of applied torque, and the motion equation and inertia expression are expressed by (1) and (2):
J d ω d t = T m T c
J = r 2 d m
where J is the moment of inertia, ω is the rotor angular velocity, r is the rotational radius, and m is the mass of the rigid body.
The inertia time constant of the synchronous machine is defined as the ratio of the rotor kinetic energy to the rated capacity under the unit’s rated speed operation, which is expressed by (3).
H = E K S B = J ω n 2 2 S B
From Equations (1)–(3), it can be observed that the synchronous machine inertia J is related to the generator rotor mass m. The inertia of each generator’s synchronous machine is fixed and cannot be changed. Synchronous machines can only provide inertia during operation, meaning inertia is provided only when the system is in operation. The inertia value remains fixed and unchangeable, resulting in a discrete characteristic of system inertia due to start–stop states, as shown in Table 1.
Due to the power shortage causing a decline in system frequency, energy storage employs droop control to mimic the output characteristics of synchronous machines. When the grid frequency deviates from the rated frequency, the energy storage output is determined based on the difference between the measured frequency and the reference frequency. The mathematical expression for the increase in energy storage output, ΔPESS1, is expressed by (4):
Δ P ESS 1 = K ep Δ f
where Kep is the proportionality control coefficient set for the energy storage system.
In addition to droop control, energy storage enhances inertial response capability through additional virtual inertia control, adjusting the active power output to mitigate the system’s power imbalance. In this case, the increase in active power output from energy storage, ΔPESS2, can be expressed as (5):
Δ P ESS 2 = K ed d Δ f d t
where Ked is the virtual inertia control coefficient set for the energy storage system.
The virtual inertia capability of energy storage is related to the coefficient and time constant size and is a designable parameter, thus exhibiting a continuity different from synchronous machine inertia. In summary, the comparison between synchronous machine inertia and virtual inertia is shown in Table 1.

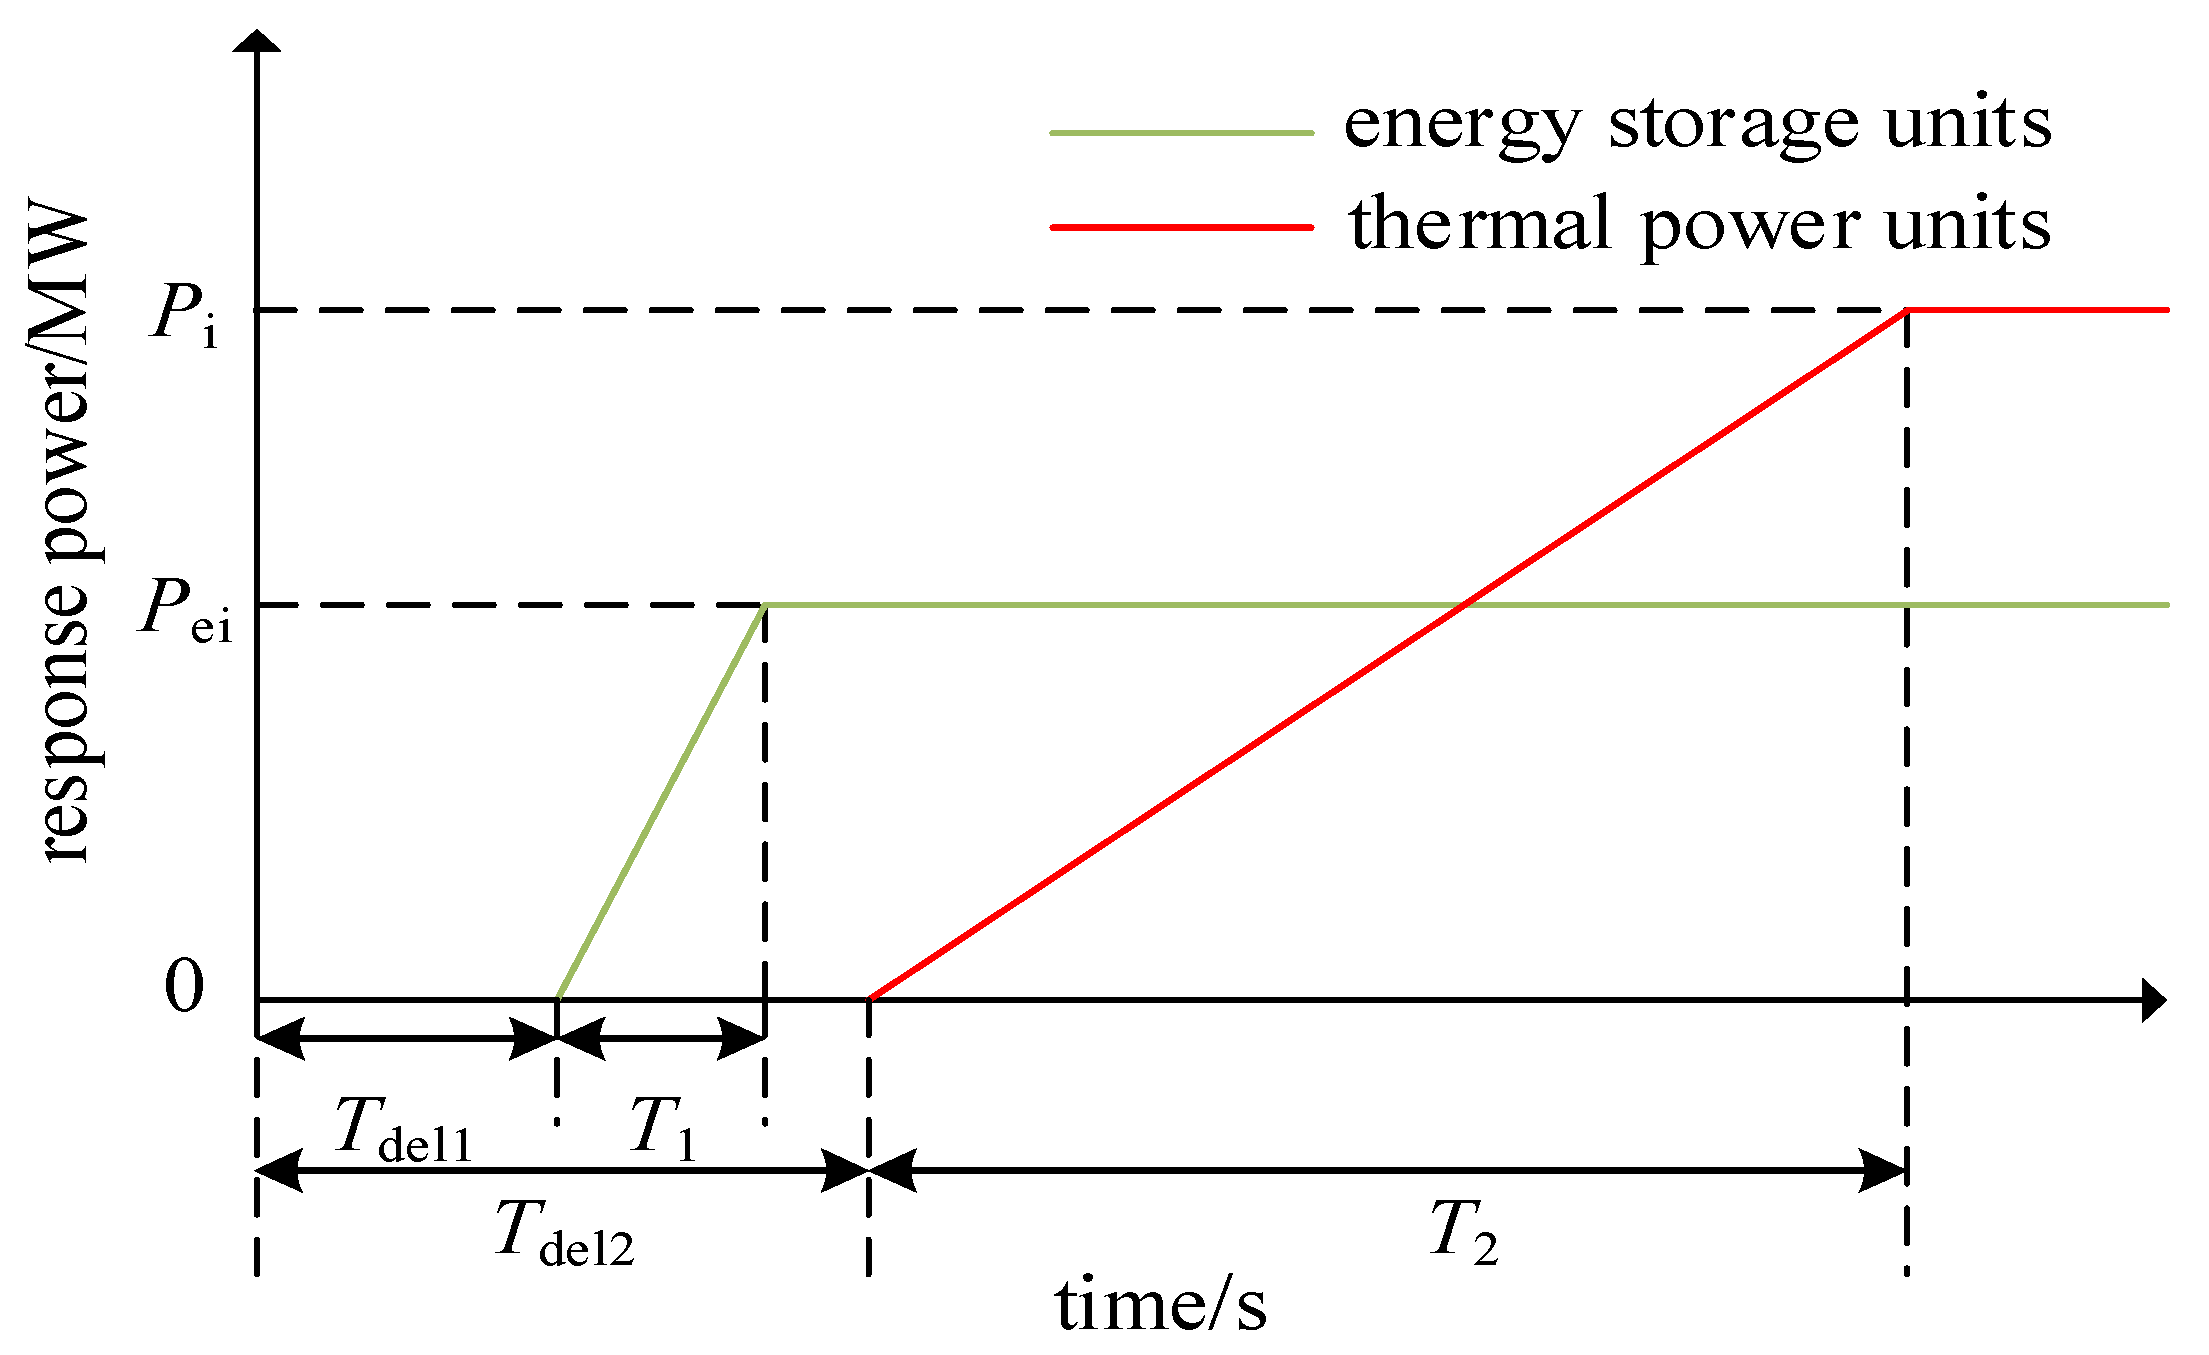
2.1.2. Comparison of Frequency Regulation Capability

To maintain system frequency stability, synchronous generators need to reserve net space for frequency regulation backup. Refs. [28,29] indicate that thermal power units require less than 3 s. In addition to the action delay, the complete response time for synchronous machine frequency regulation is about 10 to 20 s [30,31], no longer able to meet the frequency regulation requirements of current low-inertia systems.
Compared to synchronous generators, energy storage exhibits faster regulation speed, and its output is theoretically adjustable across the full power range, albeit typically with certain amplitude limitations. During the frequency response process, energy storage devices also experience some delay. The comparison of their frequency regulation capabilities is illustrated in Figure 1. T1 and T2 are the times used to increase the output of the storage unit and the thermal unit, respectively; Tdel1 and Tdel2 are the control delays of the storage unit and the thermal unit, respectively.
According to [32], energy storage can output active power to the grid within 140 ms after triggering, and the UK specifies that the response delay of energy storage under significant disturbances is generally not more than 0.5 s. Following the triggering action, the complete response time of energy storage does not exceed 2 s [33]. Therefore, energy storage possesses a rapid frequency regulation characteristic, enabling it to provide stable and swift support in low-inertia systems. A comparison of the frequency regulation-related characteristics between synchronous generators and energy storage is presented in Table 2.
Based on the aforementioned characteristic analysis, the proposed controllable resource hierarchical coordinated control strategy in this study utilizes energy storage as the primary support for rapid power adjustment, supplemented by thermal power support, and derives relevant constraints.

2.1.3. Emergency Load Shedding Based on the Differential Evolution Algorithm

In emergency conditions, when other emergency control resources act rapidly but cannot prevent a rapid frequency decline, load-shedding measures are needed for emergency power support in the system [34].
With the objective of minimizing the cost of load shedding, the cost factor of the load is set as a function that increases with the load-shedding ratio. The final objective function for emergency load shedding is expressed as (6):
{ min F = j = 1 N L c j ρ j P L j , 0 c j = φ ( ρ j ) = k j ρ j + b j
where F is the total cost of load shedding; NL is the number of load-shedding stations; cj is the load-shedding cost factor for each station; φ is the function representing the variation of the cost factor with the load-shedding ratio, approximating the cost factor as a linear function; kj is the growth coefficient of the cost factor; bj is the base cost factor; pj is the shedding ratio; and PLj,0 is the active load of the shedding station at steady state before direct current (DC) blocking.
The research on the emergency load-shedding model is relatively mature, and its constraint conditions can be summarized by (7):
η f ζ f η v ξ v η I ζ I η δ ξ δ 0 ρ j ρ j , m a x
where ŋf, ŋv, ŋI, and ŋδ are transient frequency, voltage security index, line current security index, and rotor angle security index; ξf, ξv, ξI, and ξδ are the set limits for transient frequency, voltage, current, and rotor angle constraints; and ρj,max is the maximum load-shedding ratio.
The differential evolution algorithm (DE) is more suitable for real-valued optimization problems. The main operations of the DE algorithm include the generation of the initial population, mutation, crossover, and selection, with the main parameters being the population size N, evolution generation T, mutation factor K, and crossover factor C. The optimization process is described as follows.
Generate a population randomly within the range of control variables, as shown in (8):
X 0 = { x 1 , x 2 , x 3 , , x N } x i = ( x i , 1 , x i , 2 , x i , 3 , x i , L ) , x i , j [ 0 , ρ j , max ]
where N is the number of individuals within the population, L is the number of genes, i.e., the number of cut-loading control variables, and each individual x within the population corresponds to a cut-loading scheme.
In the mutation stage, the parent individuals generate mutated individuals through a mutation strategy, as shown in (9):
v i g + 1 = x r 1 g + K ( x r 2 g x r 3 g )
where g is the current generation; i, r1, r2, and r3 are distinct random integers within the [1, N] interval; vi is the generated mutated individual; and K is the mutation factor. Equation (9) is commonly referred to as random mutation, and another faster converging optimal mutation method is expressed by (10):
v i g + 1 = x b e s t g + K ( x r 1 g x r 2 g )
where x b e s t g is the optimal individual of the g-th generation population.
The crossover operation involves pairwise crossover between the generated mutated individuals and the parent individuals, as shown in (11):
u i , j g + 1 = v g + 1 , if   r a n d j C R   or   j = r a n d ( j ) x g , otherwise
where CR is the crossover factor, ranging between [0, 1]; ui is the individual after crossover; randj is a random number within [0, 1]; and rand(j) is a random integer between 1 and L, ensuring that at least one control variable is updated.
The selection operation involves pairwise comparison between the individuals generated after crossover and the parent individuals. The more optimal individual is selected to proceed to the next generation of evolution, as shown in (12):
x i g + 1 = u i g + 1 , i f f ( u i g + 1 ) f ( x i g ) x i g , otherwise
where f is the individual evaluation function, i.e., the final established objective function for emergency load-shedding Equation (6).

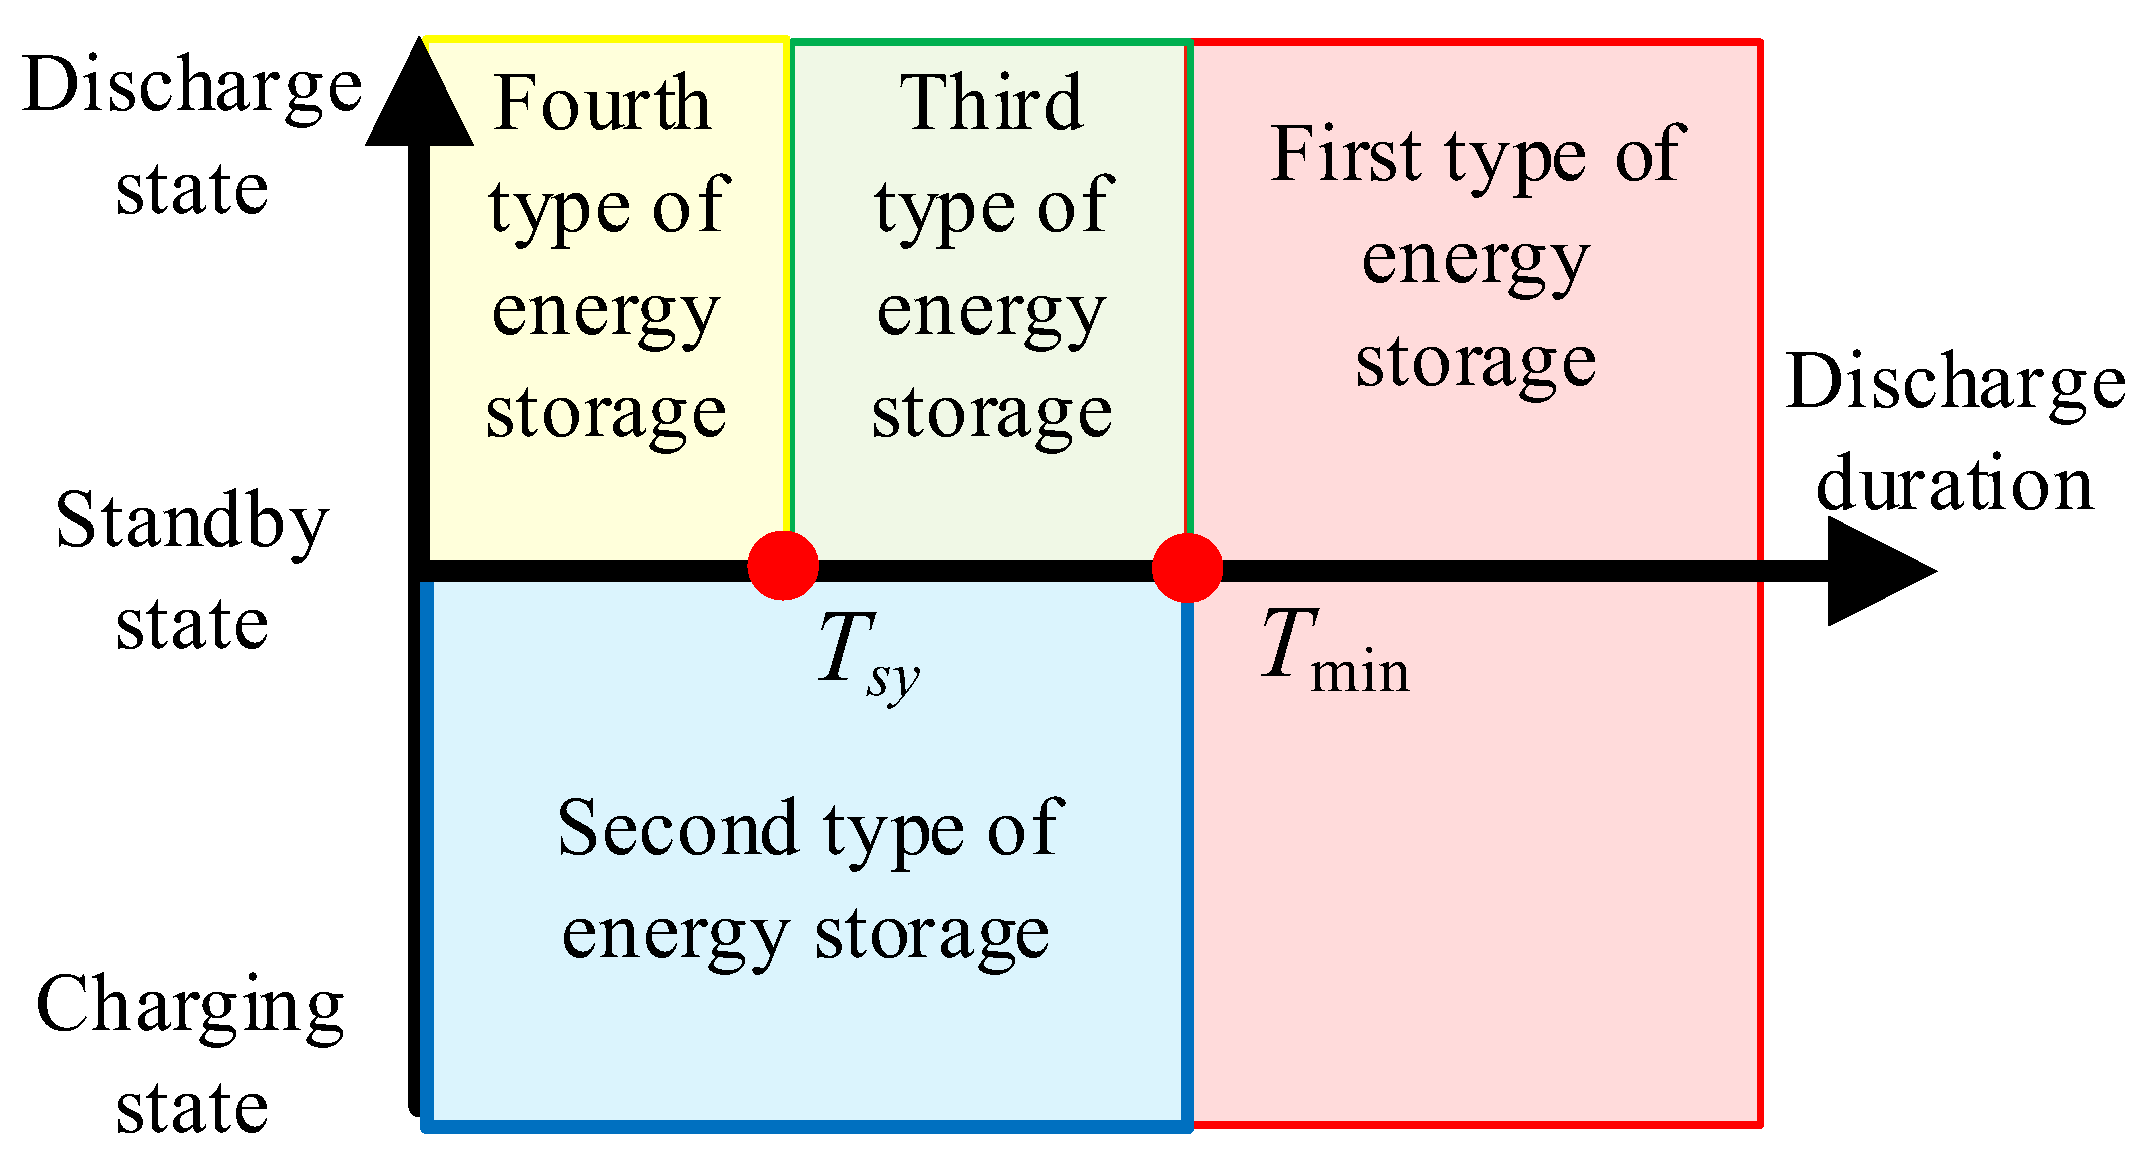
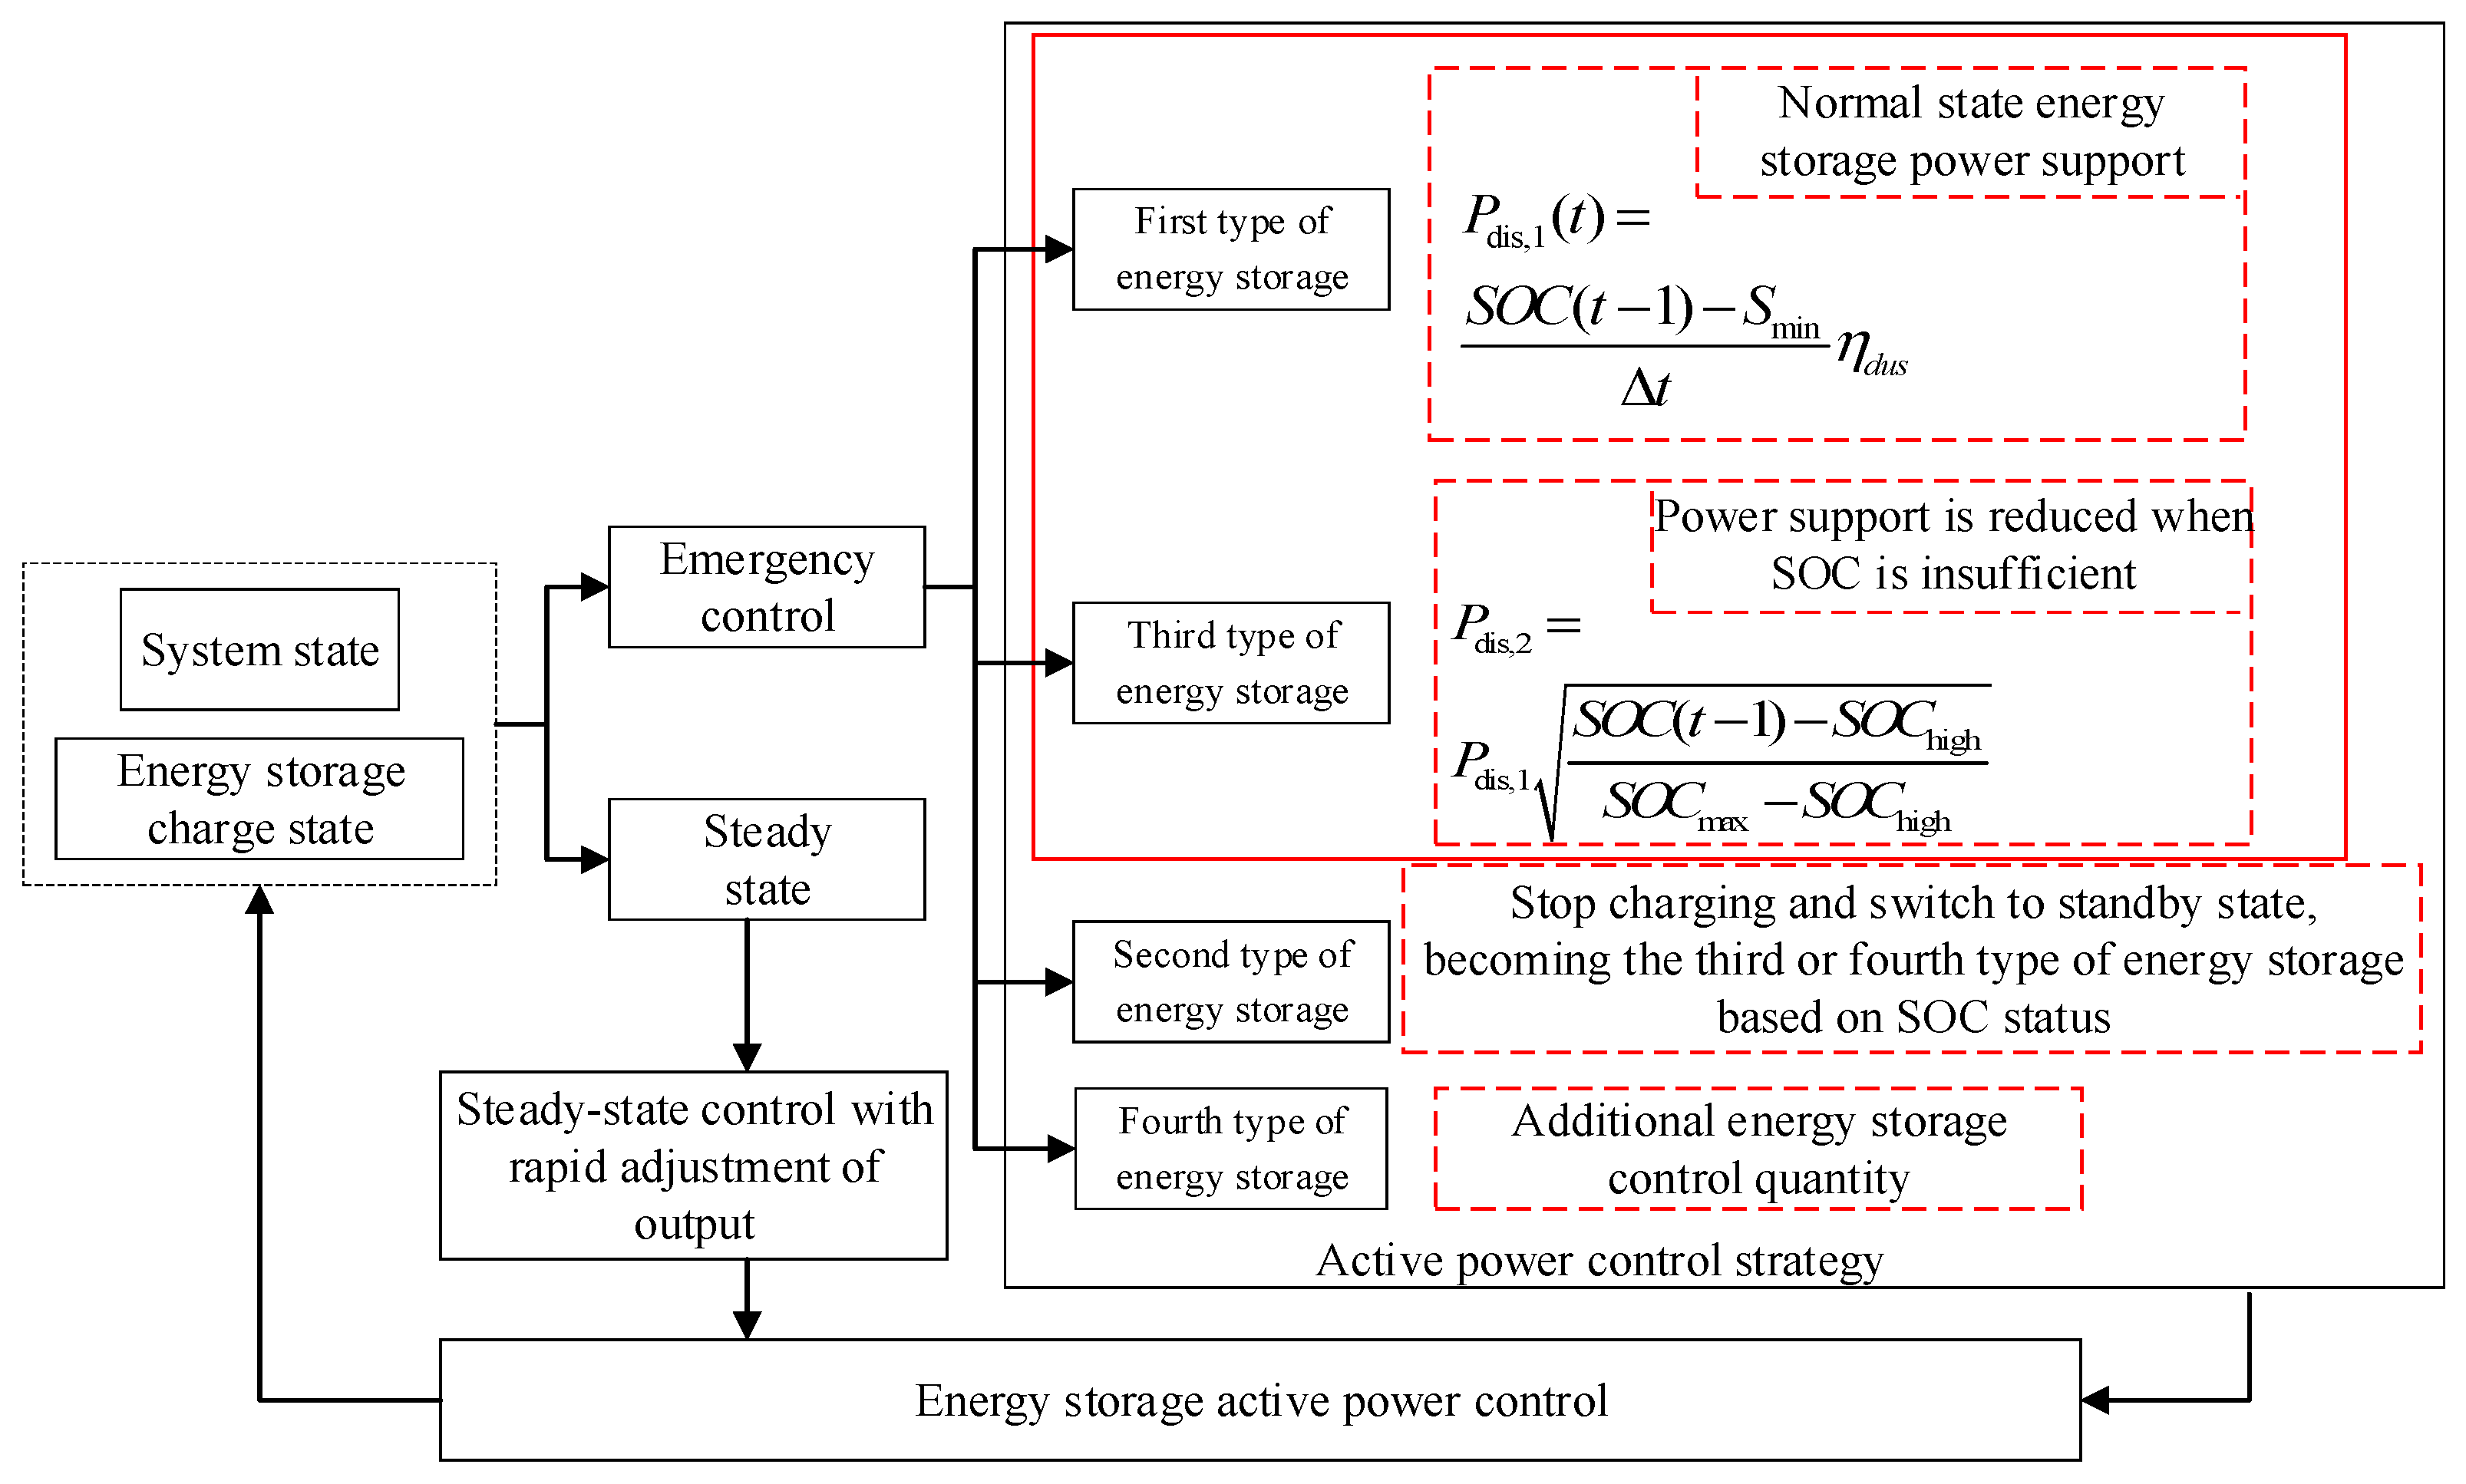
2.2. Considering Different Operating States of Energy Storage Control Strategies

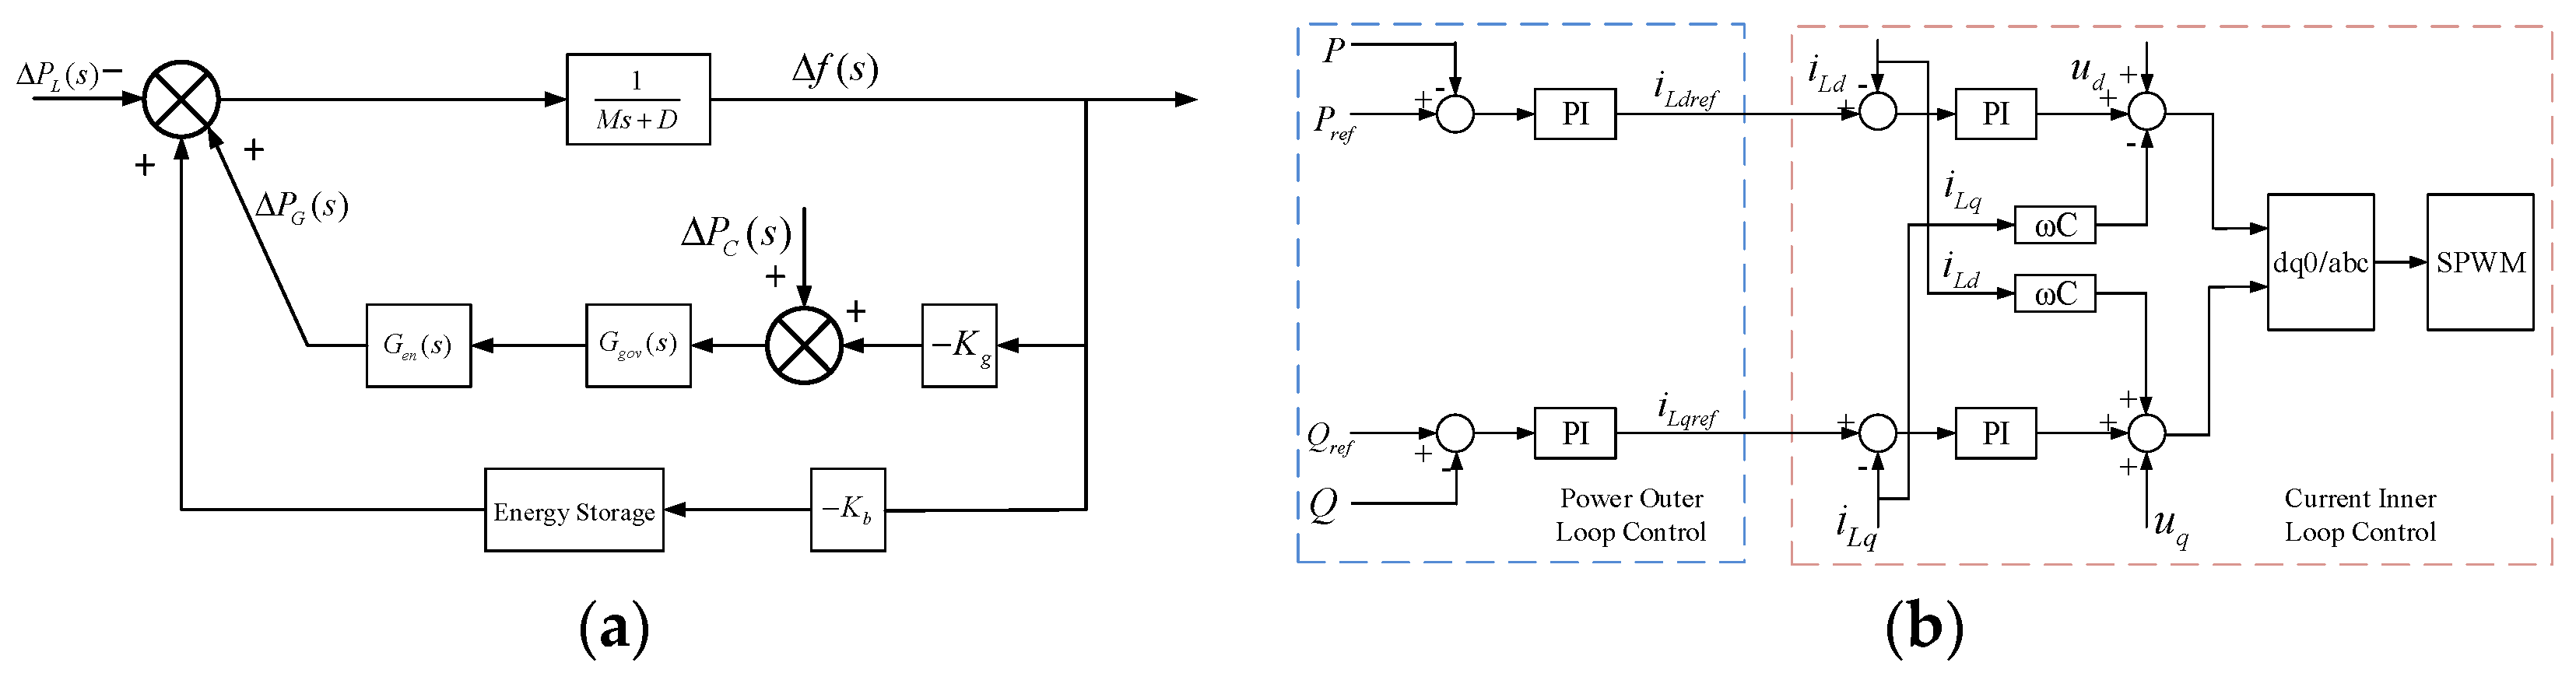
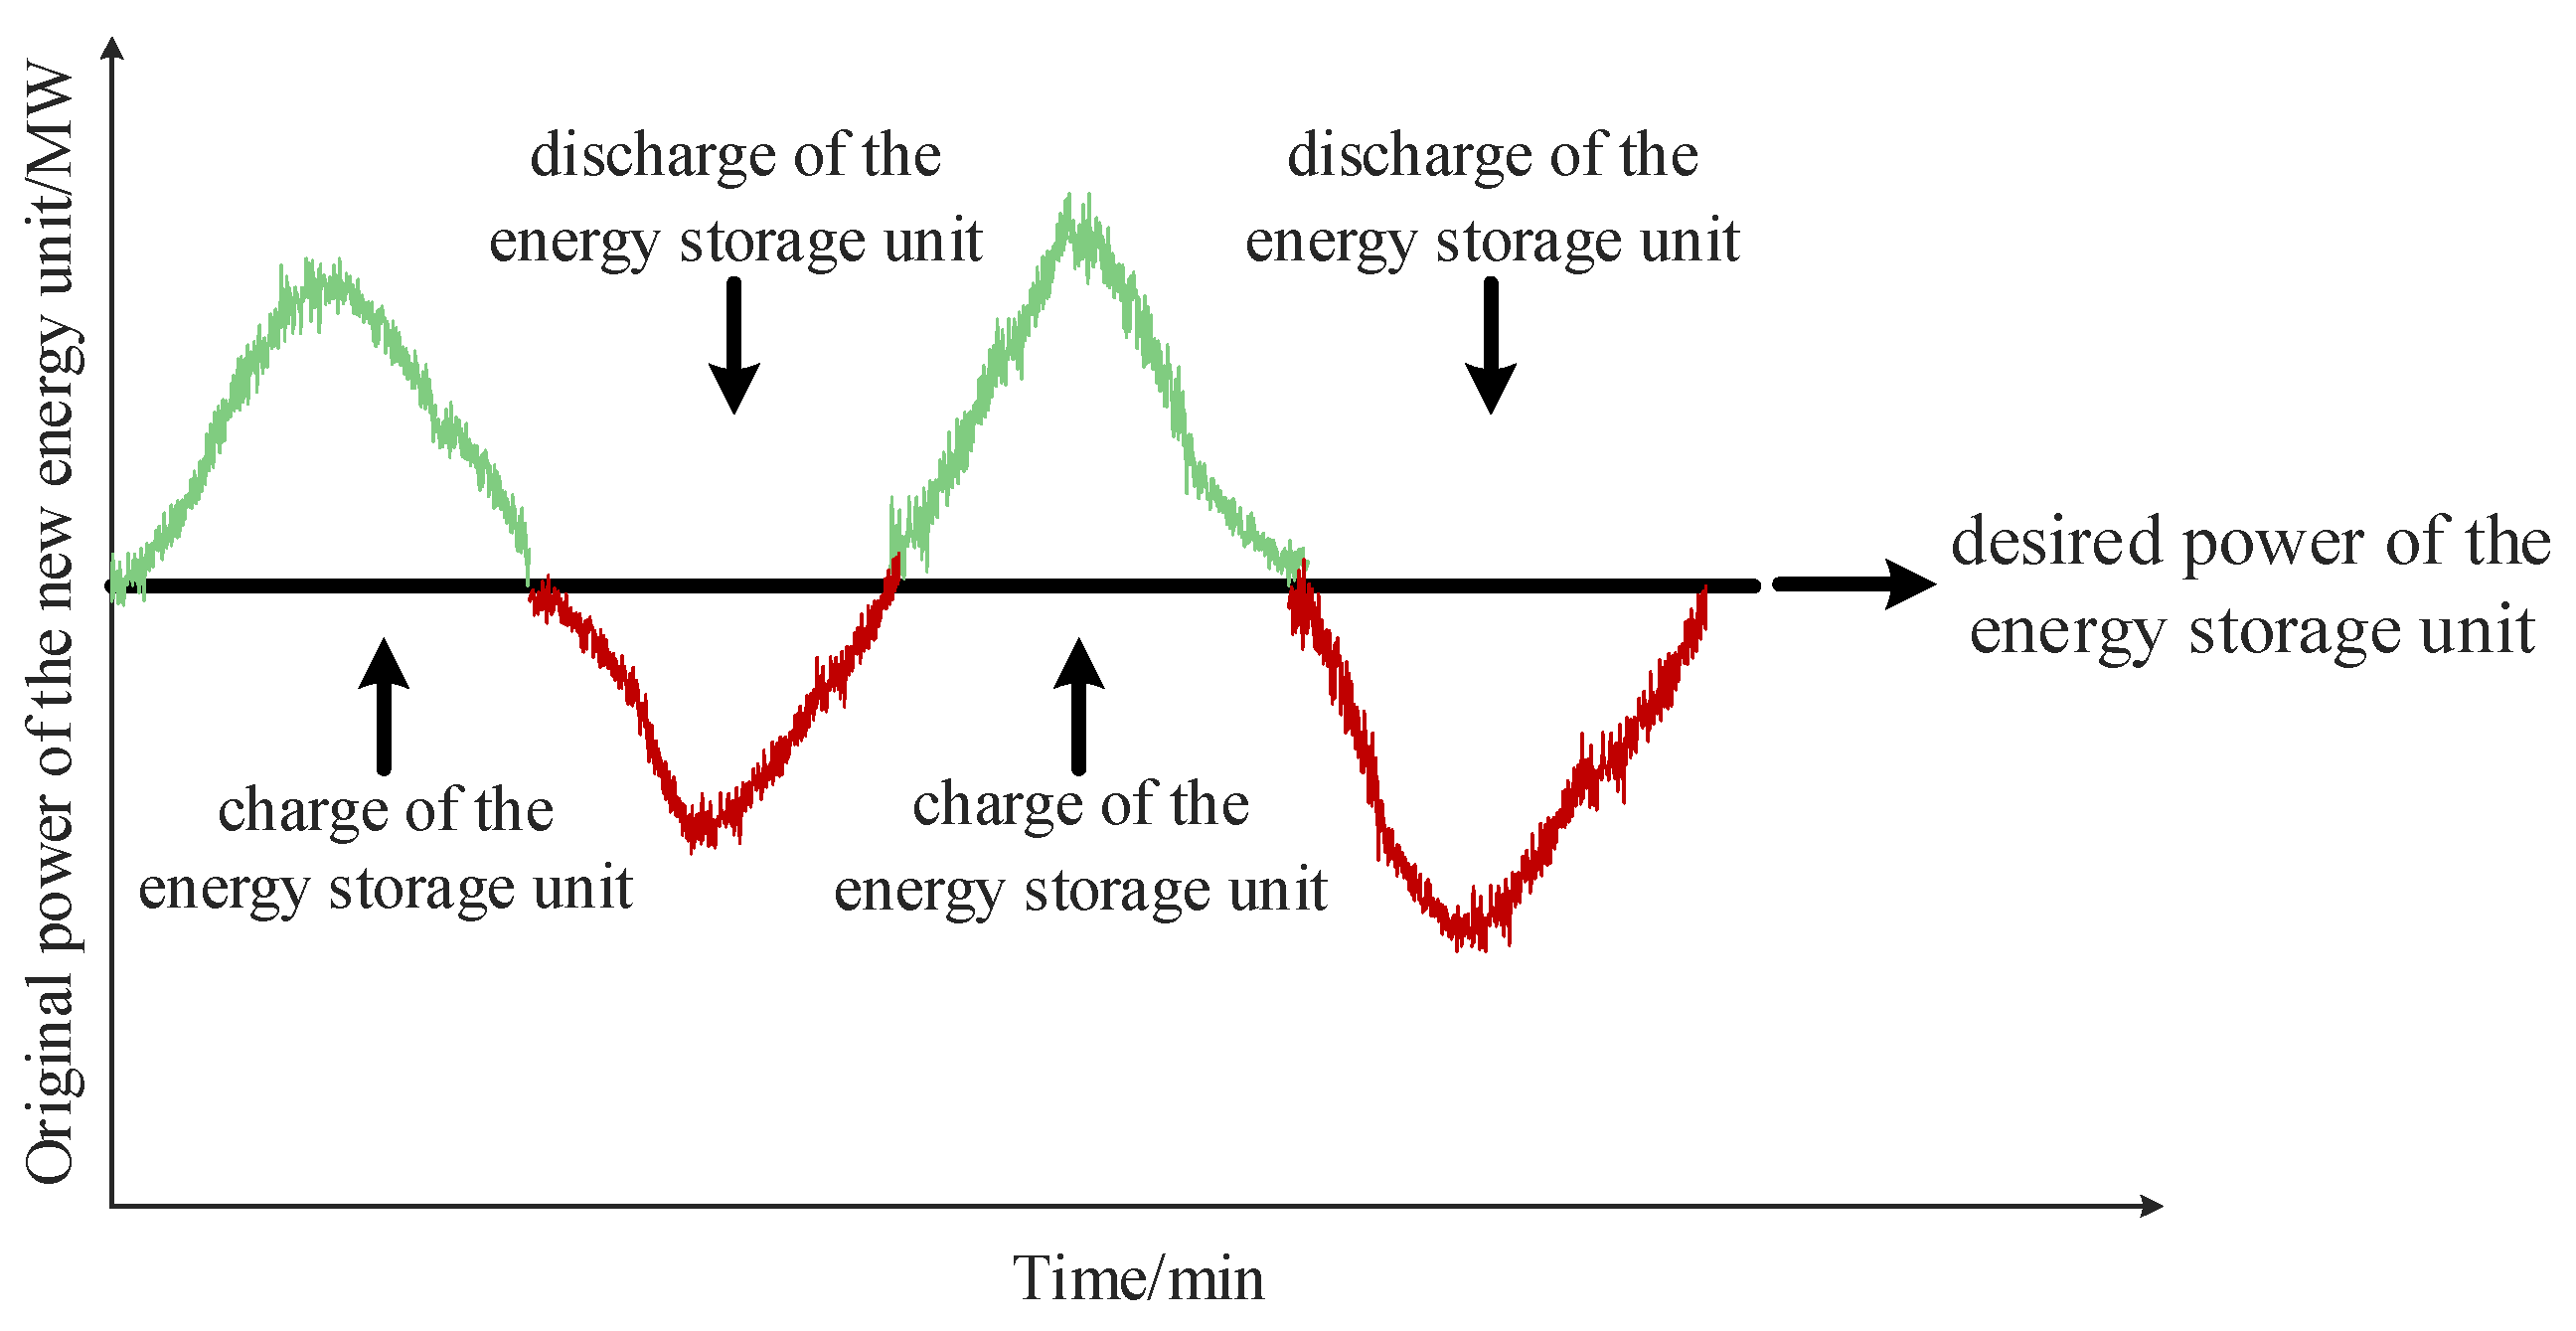
2.2.1. Energy Output Control Strategies

Currently, commonly used methods for energy storage participating in power system frequency control include virtual inertia control and virtual droop control. Both control methods simulate the role played by traditional generators in the grid. In the event of a sudden change in system frequency, increasing system inertia and adjusting active power in proportion to frequency deviation can achieve the goal of frequency control. The energy storage unit adopts constant-power double-loop control, which achieves the effect of quickly adjusting the charging and discharging power by adjusting the reference value. The two controls with transfer functions are shown in Figure 2.
The transfer functions of traditional frequency control units’ active power output ΔPG(s) in relation to frequency deviation Δf(s), energy storage system’s active power output ΔPb(s) in relation to frequency deviation Δf(s), and the disturbance of load ΔPL(s), ΔPG(s), ΔPb(s), Δf(s) are expressed by (13).
Δ P G s = K g G e n ( s ) G g o v s Δ f s Δ P b s = K b G b s Δ f s Δ f s = Δ P G s + Δ P b s Δ P L s M s + D
The relationship between load and frequency fluctuations can be summarized as (14).
Δ f s = Δ P L s M s + D + K b G b s + K g G e n s G g o v s
In the novel power system with coordinated control of multiple resources, the advantage of rapid charging and discharging of energy storage is utilized to mitigate the fluctuations of wind and photovoltaic fields, as shown in (15):
P e s s = P r e f P w P P V
where Pref is the expected grid-connected power of the renewable energy generation system, and Pw and PPV are the uncontrollable original power of the wind and photovoltaic fields. When Pref > Pw + PPV, the energy storage system releases its stored energy to make up the difference between them. When Pref < Pw + PPV, the energy storage system absorbs excess power. The principle is illustrated in Figure 3.
With the increasing proportion of renewable energy, the system’s inertia level decreases, and there is a higher probability of major power deficits or faults such as DC blocking. In the face of a rapid decline in frequency during major fault events, it is necessary for energy storage to transition to operating modes that rapidly increase output for power support.
In emergency situations, it is common practice to immediately adjust energy storage to its maximum output for power support. While this control strategy supports the system’s power deficit in milliseconds, it does not consider the state of each energy storage unit. This oversight can lead to a decrease in power due to insufficient SOC after the unit’s action, resulting in new power deficits and worsening the system’s frequency stability.
To address this issue, we propose a classification control strategy for energy storage under emergency conditions, categorizing energy storage into four classes based on its state, as illustrated in Figure 4.
First, set the indices for the shortest discharge time (Tmin) and remaining discharge time (Tsy). The shortest discharge time (Tmin) represents the minimum time required for energy storage to provide power support in emergency situations. The remaining discharge time (Tsy) indicates the sustainable time that energy storage can output power at the maximum rate.
In emergency situations, grid operators are more concerned about the supporting power and supporting time of the units, hence the establishment of two indicators, Tmin and Tsy. Under this setup, for an energy storage unit corresponding to the shortest discharge time tmin, SOCmin is shown in Equation (16):
S O C min = P d i s , t t min η d u s
where Pdis,t is the unit output required by the operator and ŋdus is the discharge efficiency of energy storage. Similarly, corresponding to the remaining discharge time tsy, SOCsy is shown in Equation (17).
S O C s y = P d i s , t t s y η d u s
Different degrees of power deficits require energy storage units to provide varying levels of output support. Under different conditions, even for the same energy storage unit at the same SOC state, the corresponding Tmin and Tsy may vary.
If the energy storage capacity is sufficient, and the Tsy is longer than Tmin, it falls into the first category of energy storage. If the Tsy is shorter than Tmin, indicating insufficient SOC, and the system is in a charging state, it is categorized as the second type of energy storage. If the system is in a standby or discharge state and the SOC is too low to provide power support, it falls into the fourth category of energy storage, and charging or discharging is stopped. Otherwise, it is categorized as the third type of energy storage, providing power support by reducing output.
For the first type of energy storage, discharge at the maximum output to support the power deficit is required by the system within a specified time, as is shown in (18):
P dis , 1 ( t ) = S O C ( t 1 ) S min Δ t η d u s
where Pdis,1(t) is the output power of the first type of energy storage, SOC(t − 1) is the remaining energy at time t − 1, and Smin is the minimum remaining charge allowed when energy storage outputs at the current power.
For the second type of energy storage, when it is in the charging state, it is considered as a load. It should immediately switch to standby mode to reduce power demand, and based on its SOC, it transitions to the third or fourth type of energy storage.
For the third type of energy storage, the power output should be reduced to support until the shortest discharge time. Equation (19) designs the attenuation coefficient based on the SOC state and power support requirements to derive the output power:
P dis , 3 ( t ) = P dis , 1 S O C ( t 1 ) S O C high S O C max S O C high = λ P dis , 1
where Pdis,3(t) is the output power of the third type of energy storage, SOChigh is the minimum charge corresponding to the allowable power support of energy storage, SOCmax is the maximum charge of energy storage, and λ is the attenuation coefficient.
In summary, the energy storage control strategy is illustrated in Figure 5.

2.2.2. Adaptive Constraint Handling in Under-Frequency Load Shedding Optimization Strategy

The optimal solution to the emergency load-shedding optimization problem lies on the boundary of the feasible region. Evaluating individuals based on feasibility rules may overlook some better individuals near the boundary, hindering the discovery of optimal solutions.
By adopting the ε-adaptive constraint-handling method, we consider superior but infeasible solutions in the optimization process, building upon the feasibility rules. Let xi and xj be two individuals under consideration, with xi > xj indicating that xi is superior to xj. Setting ε as the threshold for constraint violation, the specific comparison criteria are as follows:
Criterion 1: If both solutions meet the constraint requirements, select the one with lower control cost, as shown in (20).
x i > x j F ( x i ) F ( x j )
Criterion 2: If one solution satisfies the constraints while the other does not, first calculate the constraint violation degree G(x) for each solution. If the constraint violation degree is less than ε, choose the load-shedding plan with lower control cost. If the violation degree exceeds ε, select the solution that satisfies the constraint requirements according to (21).
x i > x j G ( x i ) < ε , G ( x j ) = 0 , F ( x i ) F ( x j ) G ( x i ) = 0 , G ( x j ) > ε
The degree of violation of the constraint is defined as (22):
G ( x ) = Δ g g ξ
where Δg is the constraint violation value of the cut-load scheme and gζ is the constraint limit value.
Criterion 3: If both solutions fail to satisfy the constraints, and the constraint violation degrees for both are less than ε, choose the individual with lower cost. In other cases, select the individual with a smaller constraint violation degree, as shown in (23).
x 1 > x 2 G ( x 1 ) ε , G ( x 2 ) ε , F ( x 1 ) F ( x 2 ) G ( x 1 ) ε , G ( x 2 ) > ε ε < G ( x 1 ) < G ( x 2 )
Compared to the feasibility rule, criteria 2 and 3 retain the load-shedding plans with small constraint violation degrees and low control costs, thereby increasing the exploration of the feasible domain boundaries. ε is adaptively adjusted based on the overall violation of constraints, incorporating infeasible individuals in the early stages and setting ε to 0 in the later stages of evolution, as shown in (24):
E ( t ) = E ( 0 ) e α t / T e , t T e 0 , t > T e
where α is the decreasing coefficient and Te is the truncation algebra, which is transformed to the feasibility law when taking 0.
In summary, the load-shedding optimization process based on the improved differential evolution algorithm is outlined as follows:
(1)
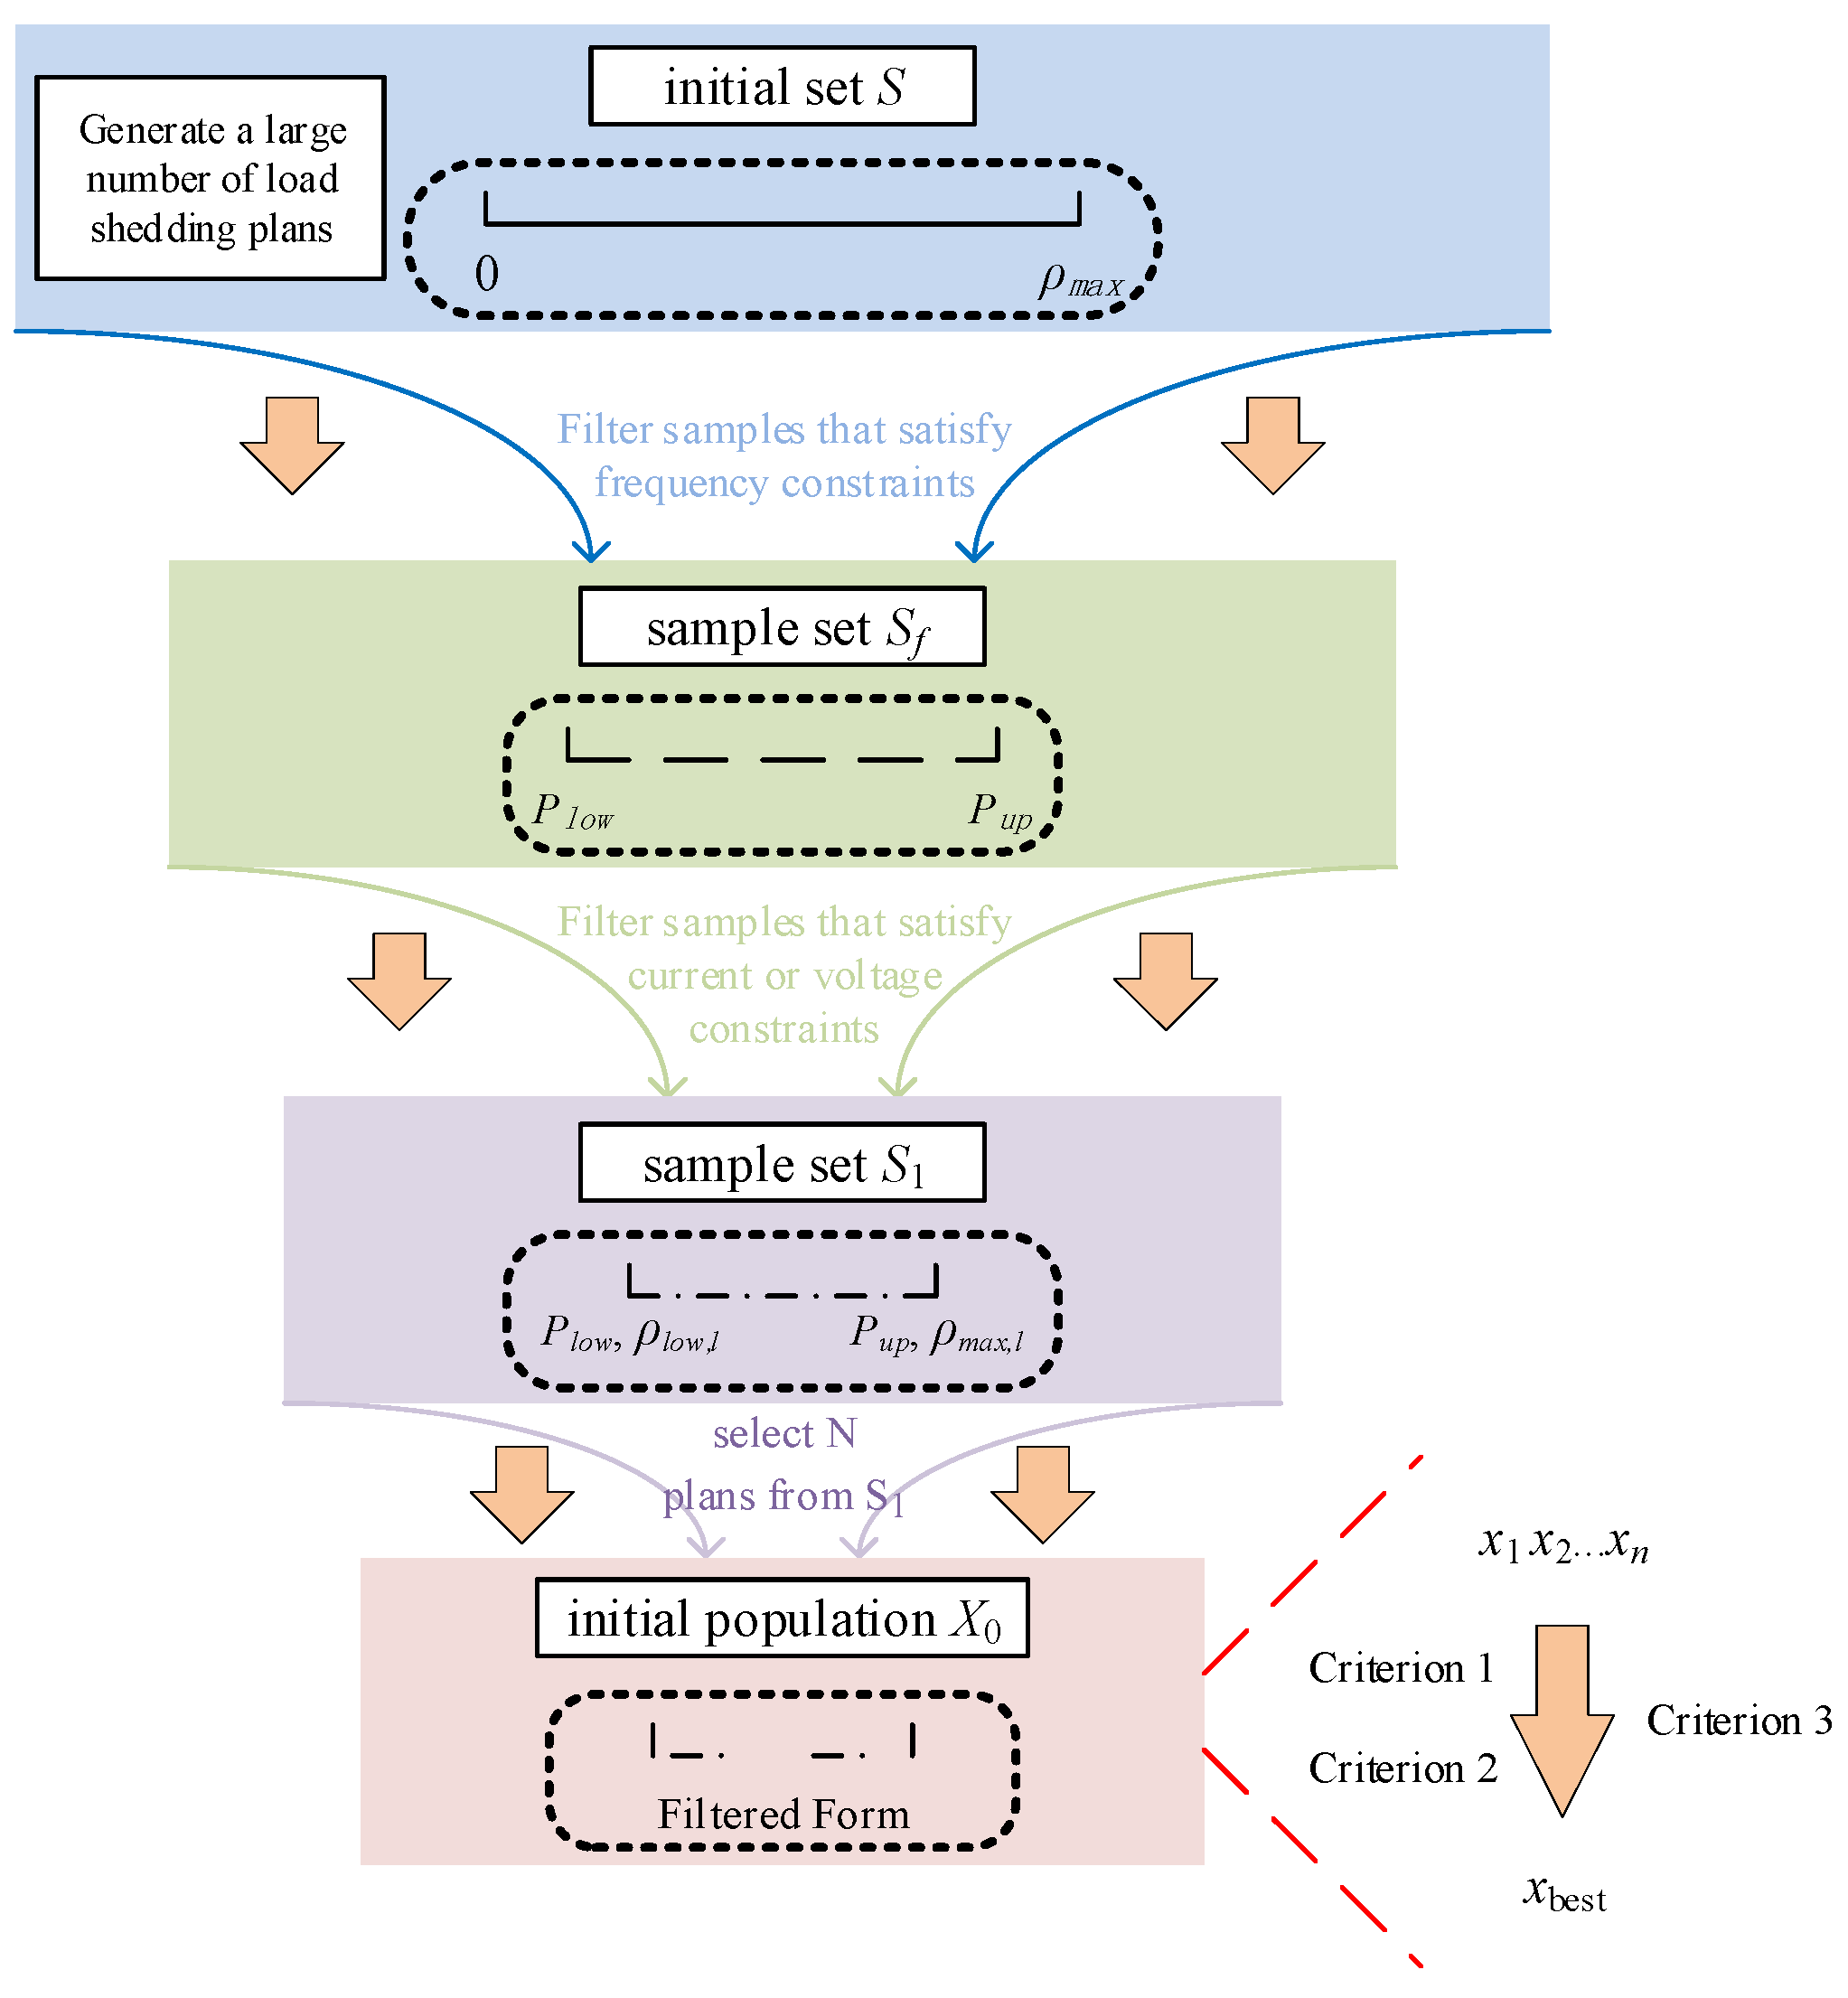
Generate a large number of load-shedding plans randomly within the [0, ρmax] space, serving as the initial set S.
(2)
Filter samples that satisfy frequency constraints. Utilize a uniform removal approach to explore and determine approximate lower (Plow) and upper (Pup) limits of load-shedding amounts. Choose plans in S that meet Plow < Pup to compose the sample set Sf.
(3)
Filter samples that satisfy current or voltage constraints. Calculate the sensitivity of all load-shedding stations and identify the station Ls with the maximum sensitivity. Explore and determine its approximate lower limit with the maximum sensitivity. Explore and determine its approximate lower limit (Plow,L). Choose plans in the sample set Sf that meet the requirements to form the sample set S1.
(4)
Randomly select N plans from S1 to form the initial population X0.
The diagram of adaptive constraint handling in under-frequency load-shedding optimization strategy is shown in Figure 6.

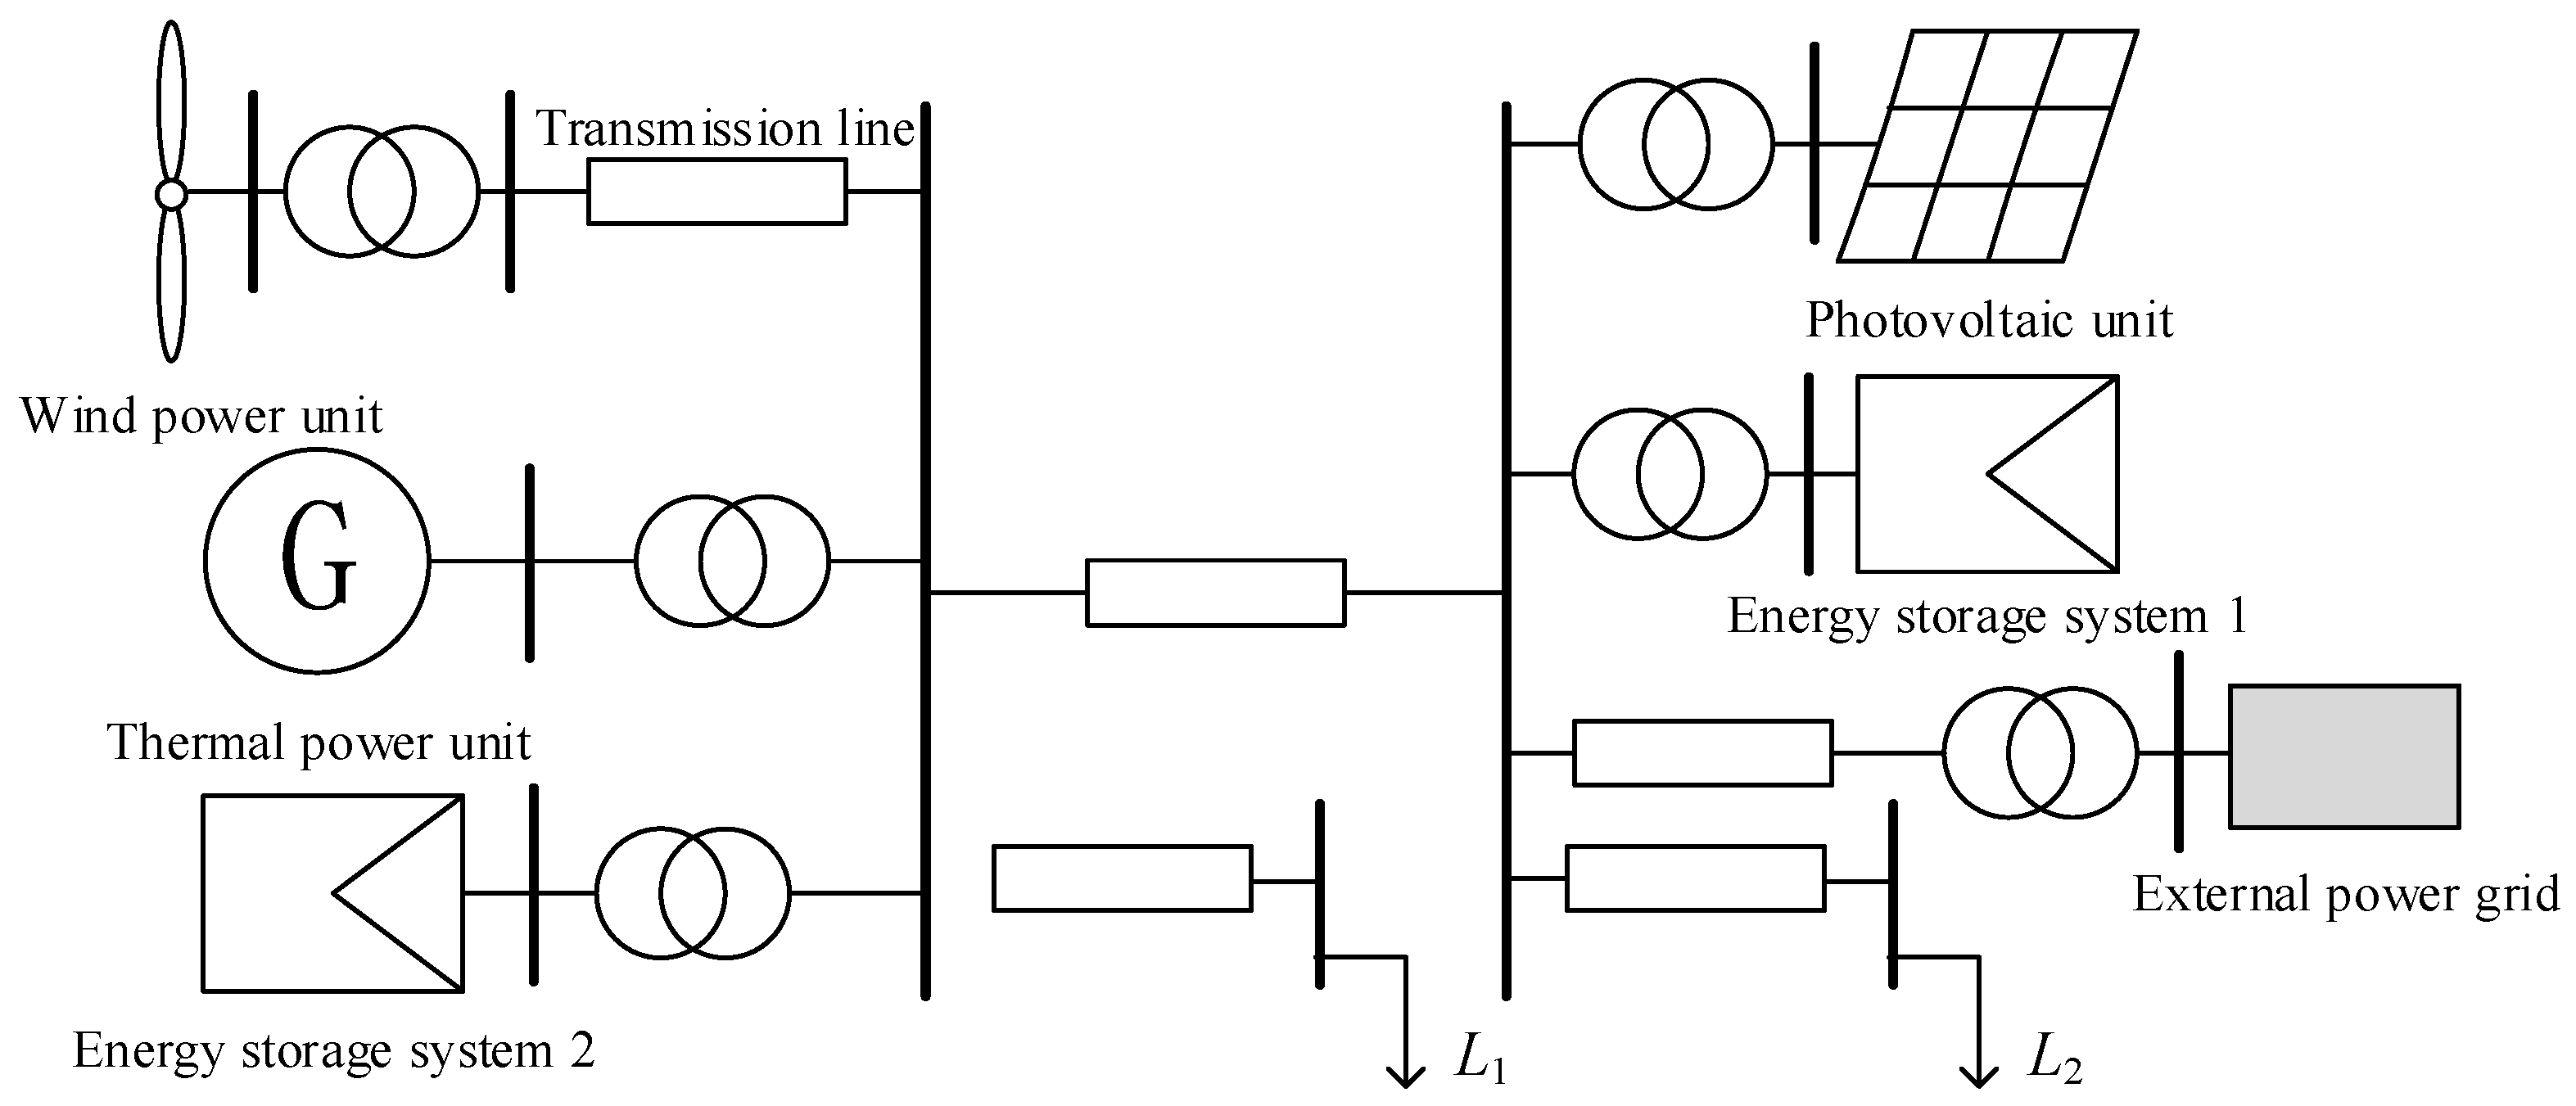
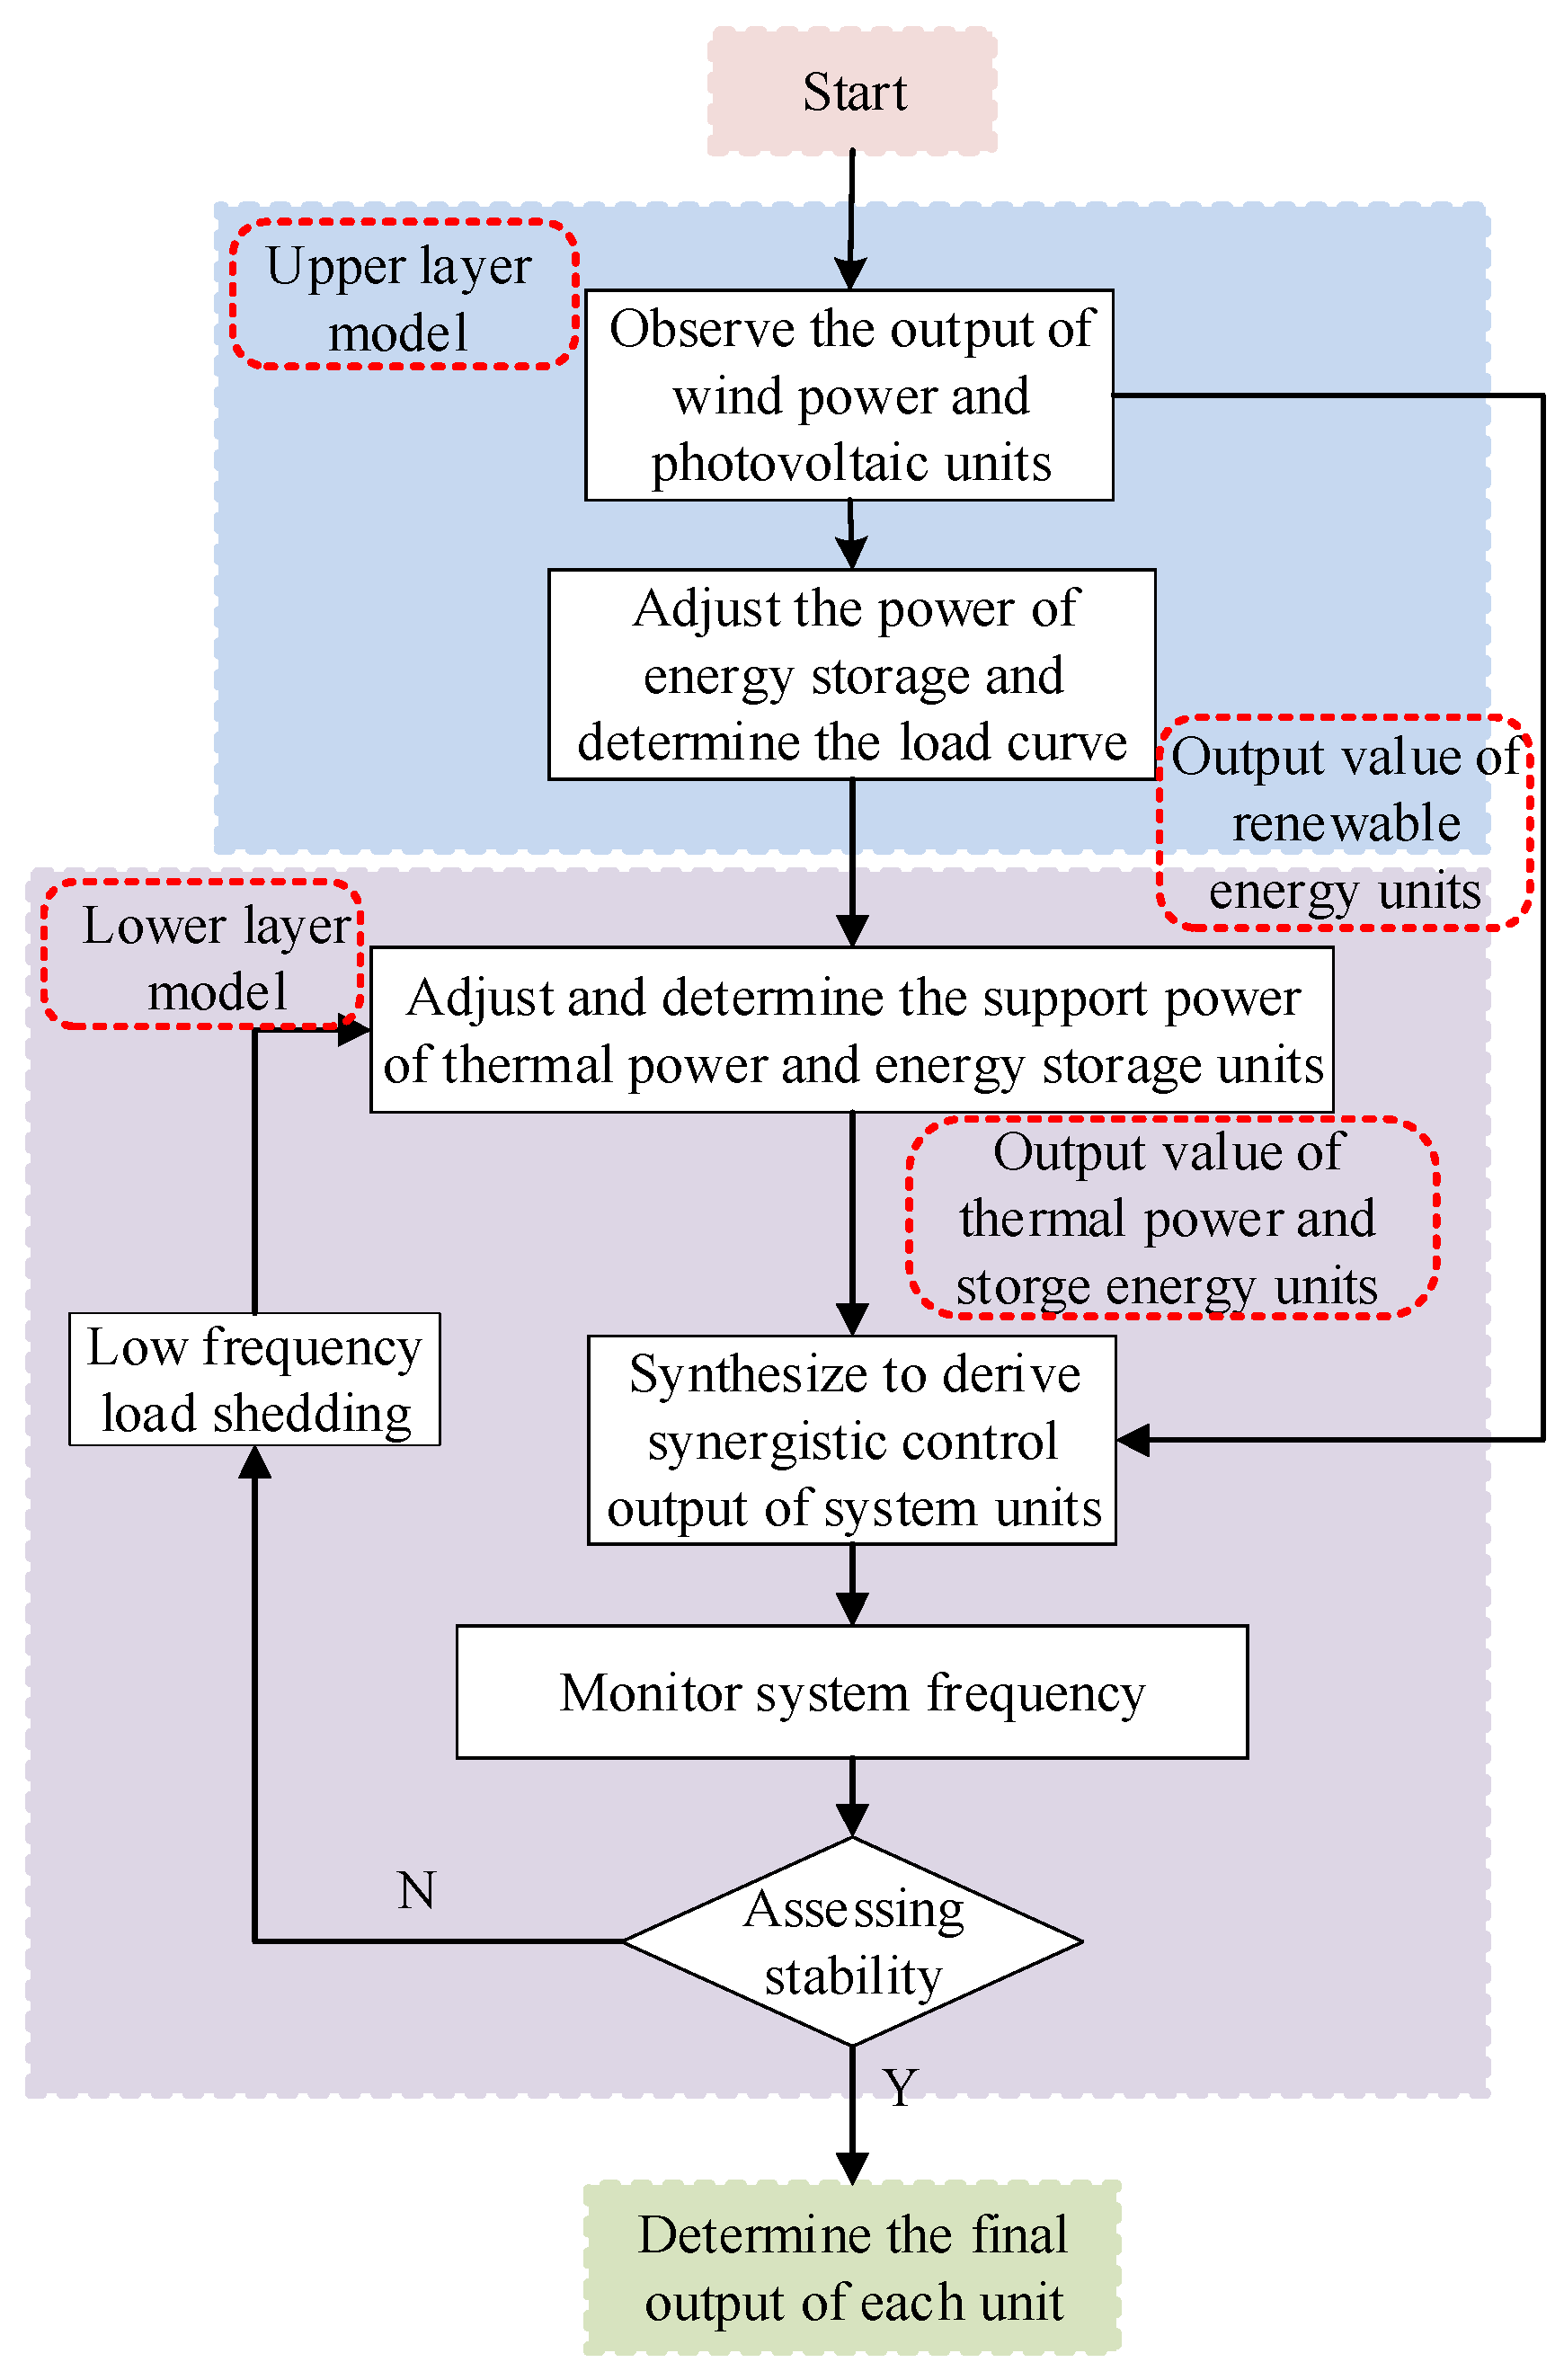
2.3. Hierarchical Coordinated Control Method for Systems with a High Proportion of Renewable Energy Sources

After the large-scale integration of renewable energy sources into the power grid, it is necessary to conduct research on the hierarchical coordinated control of various controllable resources for more intelligent control. The goal is to fully leverage the advantages of different types of resources. During normal operation, when a certain type of resource is affected, other resources can quickly coordinate and complement, thereby improving the economic efficiency and reliability of the power system.
Compared to traditional systems, the coordinated control problem in multi-energy systems exhibits complex nonlinear characteristics. To fully utilize the power support from thermal power generators and the flexibility of energy storage systems, a coordinated control scheme is proposed. This scheme divides the system into two hierarchical levels, each containing different energy resources.
Figure 7 illustrates the coordinated control block diagram after the introduction of load shedding. In each unit, wind and photovoltaic units, unable to support reactive power, adopt fixed DC voltage and reactive power control to maintain zero reactive power output. Active power support is adjusted based on the daily wind and solar conditions.
Currently, widely used wind and photovoltaic generation models are expressed by (25) and (26) [35]:
P p v = P S T C G C G S T C [ 1 + k T C T S T C ]
P W t = 0 , v t v i n , v t v o u t P r ν t v i n v r v m , v i n v t v r P r , v r ν t v o u t
where PPV is the actual output power of the photovoltaic panels; k is the power temperature coefficient, commonly set to −0.3%/°C [36]; GC and TC denote real-time solar radiation intensity and surface temperature of the photovoltaic modules, respectively; PW(t) is the actual output power of the wind turbine at time t; vr is the rated wind speed; vin and vout are the cut-in and cut-out wind speeds of the wind turbine, respectively; and Pr is the rated power of the wind turbine.
The core of the upper-level model is to determine the wind and solar output. The energy storage unit adopts constant-power dual-loop control to achieve rapid adjustment of charging and discharging power by adjusting reference values. Under steady-state conditions, the rapid response capability of energy storage is utilized to follow the fluctuations of wind, solar, and load, with the goal of optimizing the output of the wind–solar–storage integrated system to minimize net load fluctuations. Based on this, the output of the energy storage unit is set to (27):
P B E S S = P e s s = P r e f P w P P V
where Pess is the power deviation value, Pref is the expected grid-connected power of the renewable energy unit system, and Pw and PPV are the uncontrollable original power of the wind and photovoltaic fields. When Pref > Pw + PPV, indicating insufficient output from the renewable energy unit, PBESS takes a positive value, representing discharging power, releasing stored energy to compensate for the gap between them. When Pref < Pw + PPV, indicating excess output from the renewable energy unit, PBESS takes a negative value, representing charging power, absorbing the surplus power.
The lower-level system is primarily responsible for the power support of thermal power and energy storage units. Under steady-state conditions, it provides output support for thermal power units based on the equivalent load curve transmitted from the upper-level system. The output of participating controlled thermal power units is determined, yielding the final results.
In emergency situations, the power deficit is determined based on frequency response. Utilizing the emergency output control strategy of energy storage under different classifications as described in Section 2.2.1, the output of the energy storage system is determined. This involves a rapid response to adjust charging and discharging power to achieve successful power support, serving the purpose of swiftly providing power assistance. Thermal power, constrained by its response time, participates in primary frequency control power restoration.
If, after reaching maximum output from the energy storage system, a significant power deficit persists, load shedding is implemented. Simultaneously, the output of the energy storage is adjusted, allowing the system to continue stabilizing. The amount of load shedding is expressed by (28):
Δ P s h o . r e a l ( t ) = t = 1 n P L ( t ) P G ( t ) P p , w ( t ) P B E S S ( t )
where PL(t), PG(t), Pp,w(t), and PBESS(t) are the power at time t for load, thermal power, renewable energy, and the energy storage system, respectively. The power supported by the energy storage is expressed by (29):
P B E S S ( t ) = P dis , 1 ( t ) + P dis , 3 ( t )
where Pdis,1(t) and Pdis,3(t) are the output of the energy storage units for the first and third categories.
The system proposed coordinates control based on the flexible output of energy storage. The performance is closely related to the SOC of the energy storage. Using the emergency load-shedding amount to measure the performance of the system, let the index be denoted as D, which can be expressed as (30):
D = Δ P s h o . r e a l ( t ) Δ P max = Δ P e P dis , 1 ( t ) P dis , 3 ( t ) Δ P max = = Δ P e ( 1 + λ ) S O C ( t 1 ) S min Δ t Δ P max η d u s
where ΔPmax is the maximum load-shedding capacity, ΔPe is the power deficit of the entire system excluding energy storage units, and λ is the attenuation coefficient. It can be observed that as the SOC decreases, the value of D increases. When D is negative, the system quickly adjusts output through energy storage to achieve stability control without the need for load shedding, thus maintaining system stability. When D is a positive number less than 1, the system initiates emergency load shedding for coordinated control to achieve stability. When D is greater than 1, indicating that the power deficit exceeds the maximum load-shedding capacity and SOC is too low to support stable control, the system becomes unstable.

3. Case Studies

3.1. Introduction to the Algorithm

To validate the proposed strategy, a simulation model is constructed as illustrated in Figure 8, where L1 and L2 represent active loads, and the distribution network operates at a voltage of 10 kV and a frequency of 50 Hz, consisting of wind, solar, storage, and synchronous generator units.
Multiple scenarios were set up for comparative analysis to validate the effectiveness of the proposed method.
Scenario 1: Load surge. Set load 2 to increase by 600 kW at 4 s into the simulation.
Scenario 2: Illumination perturbation. Introduce irradiance disturbance by setting irradiance to decrease from 1000 to 500 at 4 s into the simulation, and then increase from 500 to 800 at 6 s.
Scenario 3: Wind speed disturbance. Introduce wind speed disturbance by setting wind turbine speed to decrease from 11 m/s to 8 m/s at 4 s into the simulation.
Scenario 4: Insufficient storage. Set the initial SOC of the storage system to 30%. When the simulation reaches 4 s, decrease SOC to below 26%, simulating insufficient energy storage and reducing output power.
Scenario 5: Continuous load increase, insufficient power support. Simulate a continuous increase in load, resulting in insufficient power support and the system frequency dropping below the lower limit.
Scenario 6: Load fluctuation (similar to Scenario 5), with coordinated control of controllable loads.

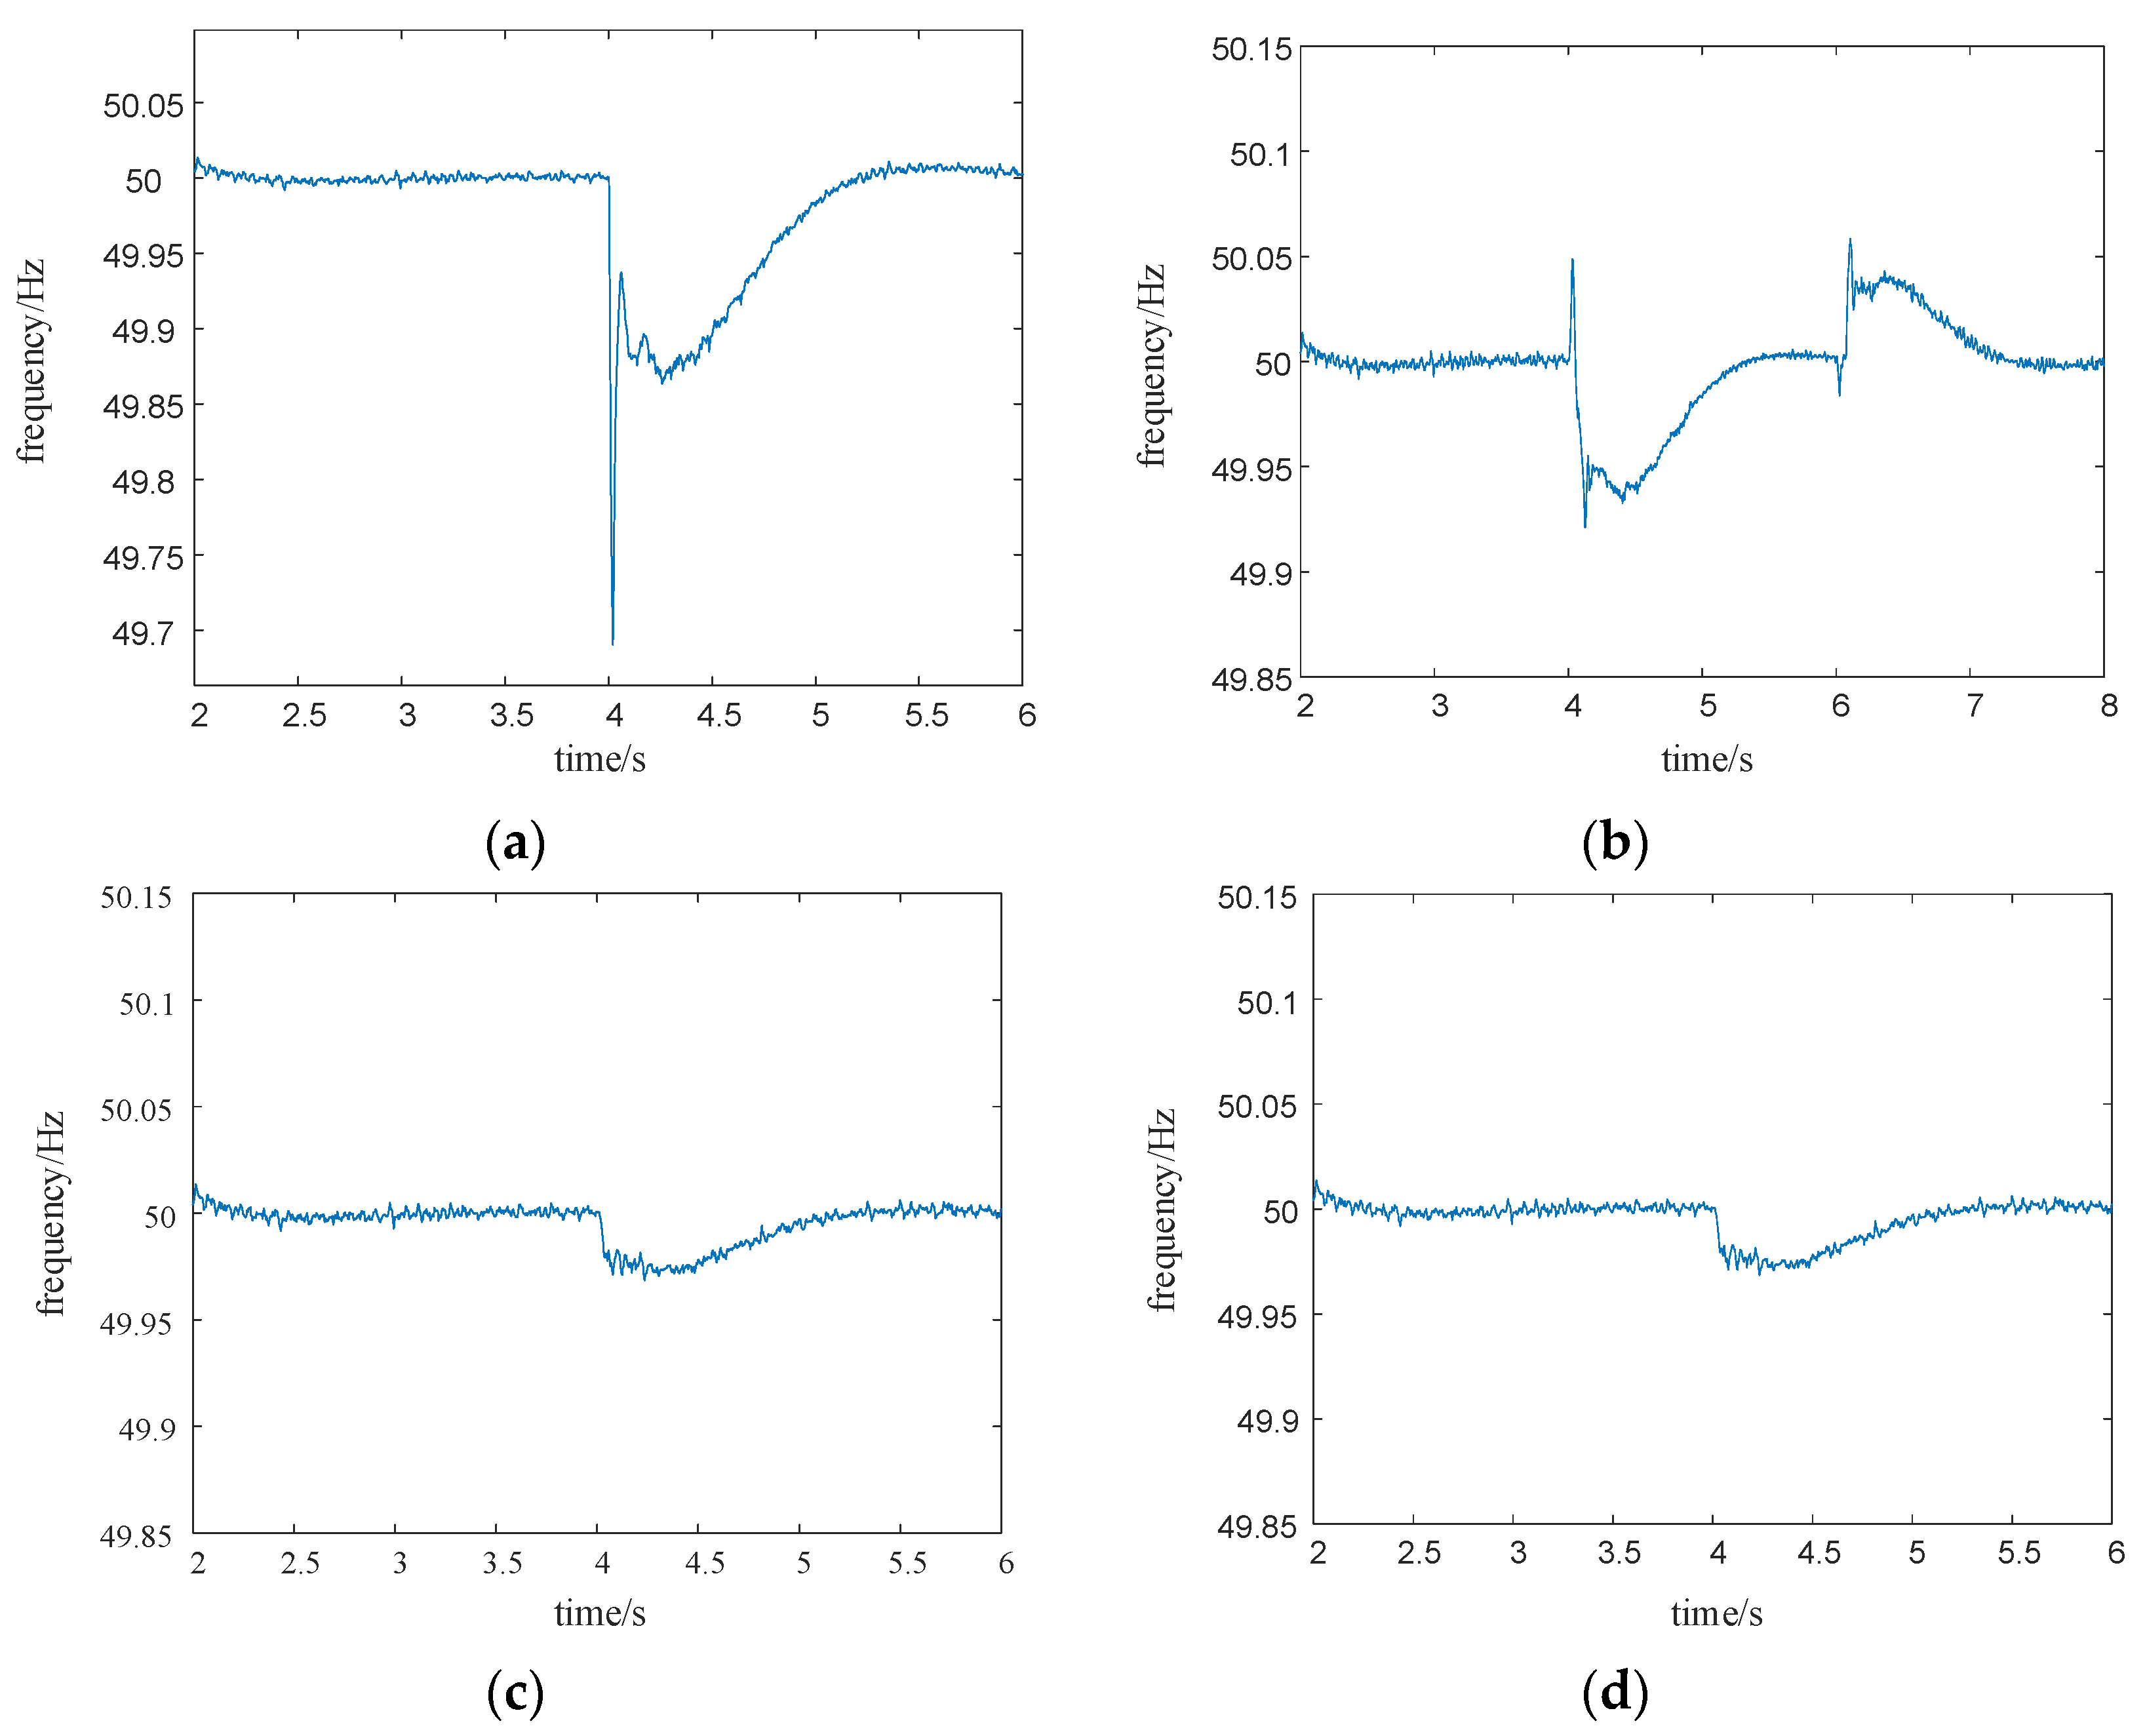
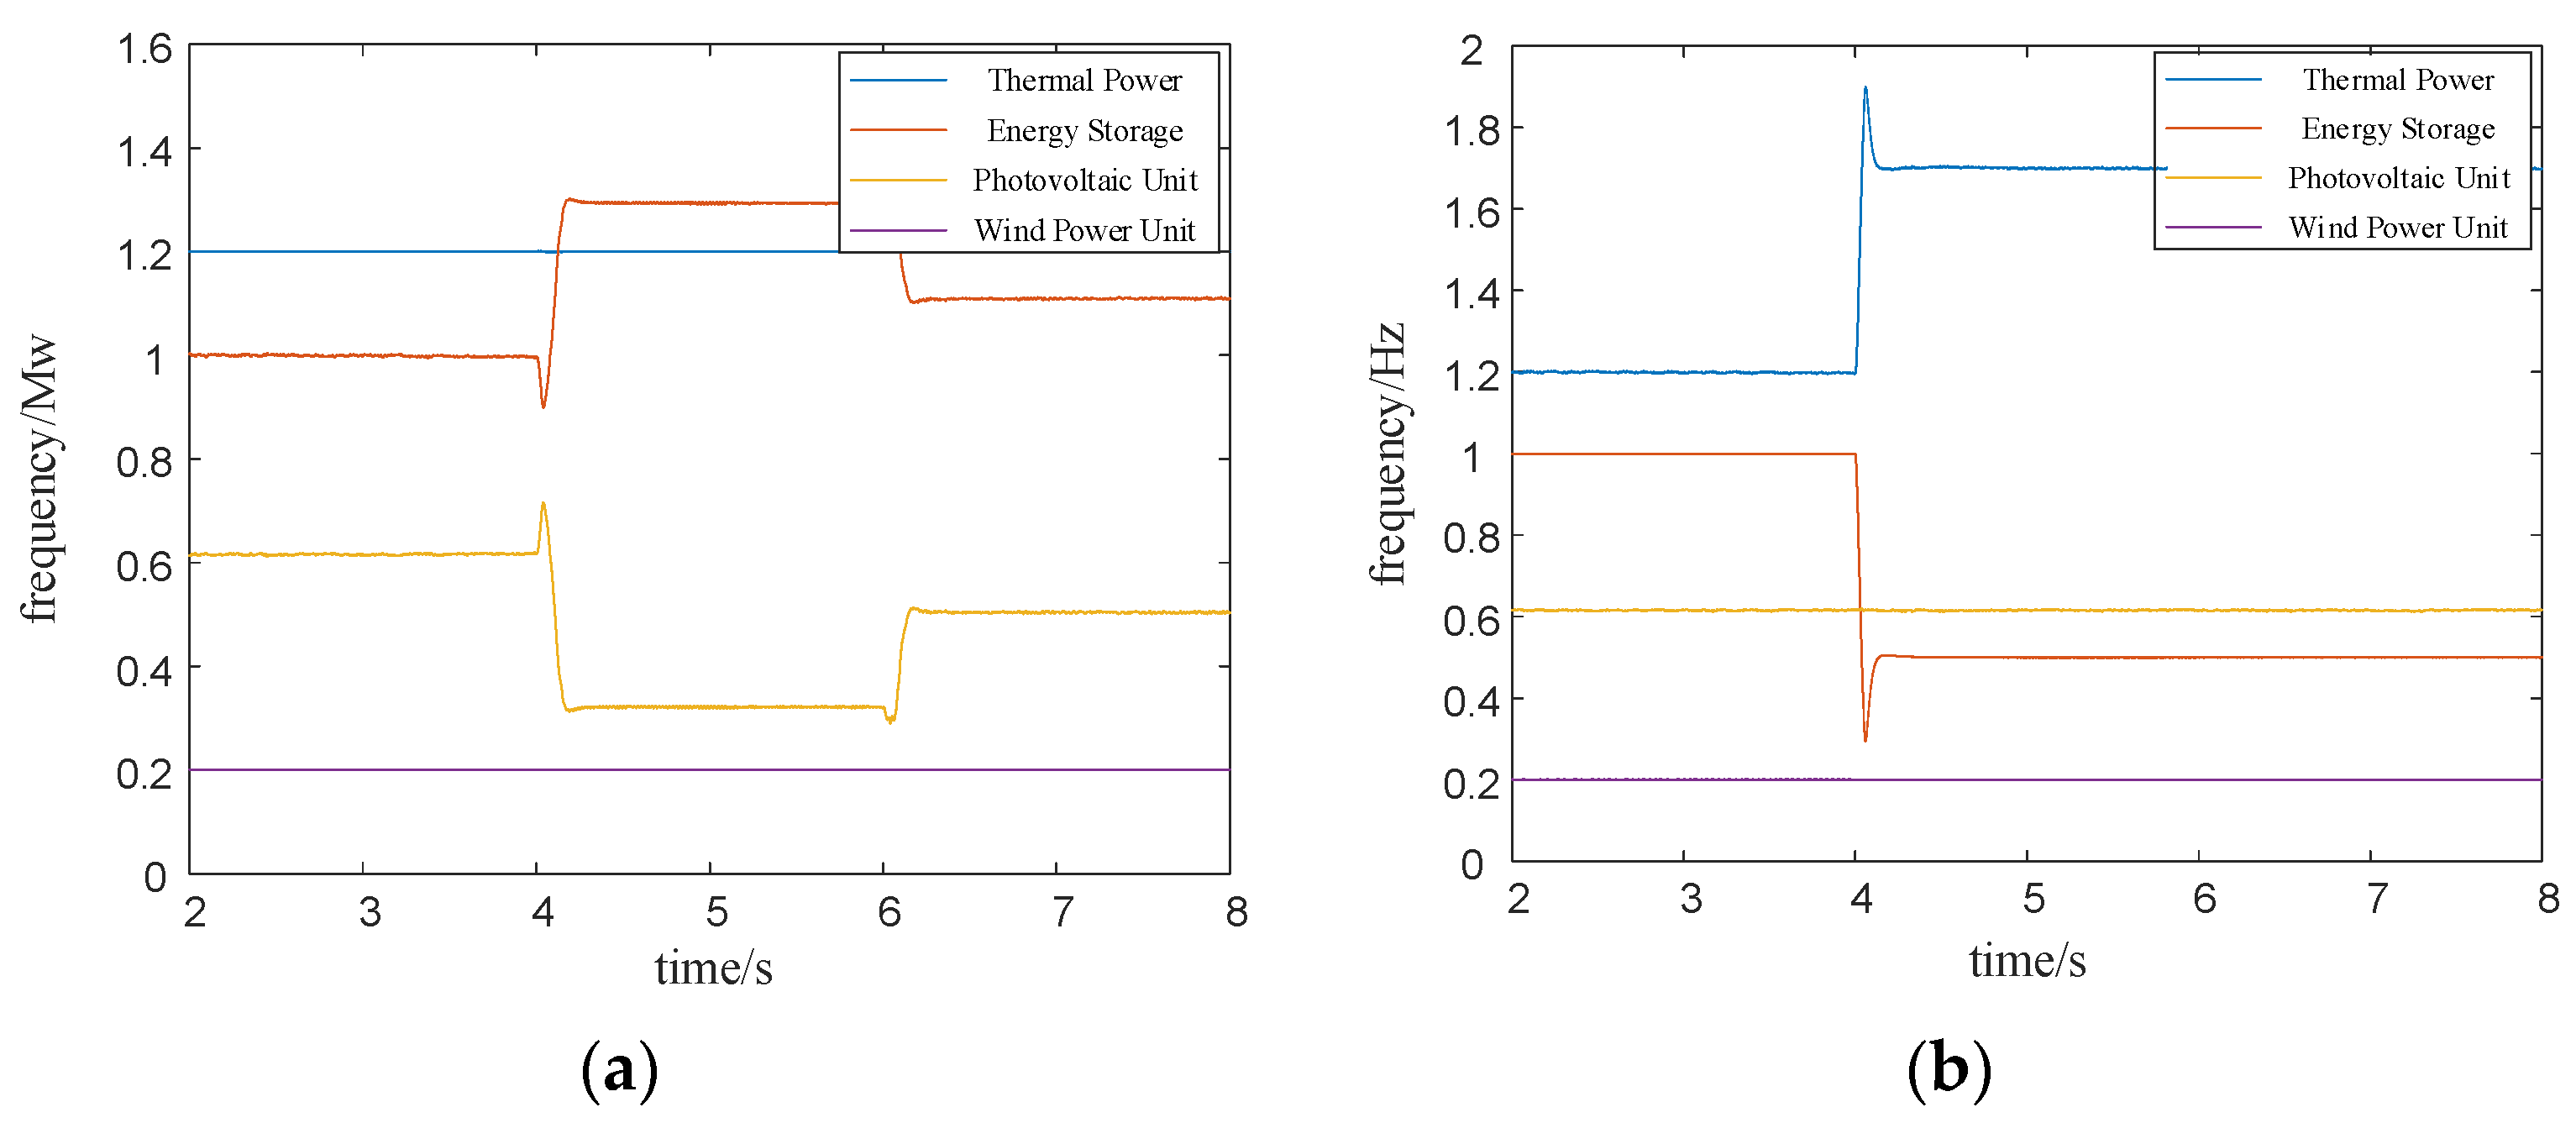
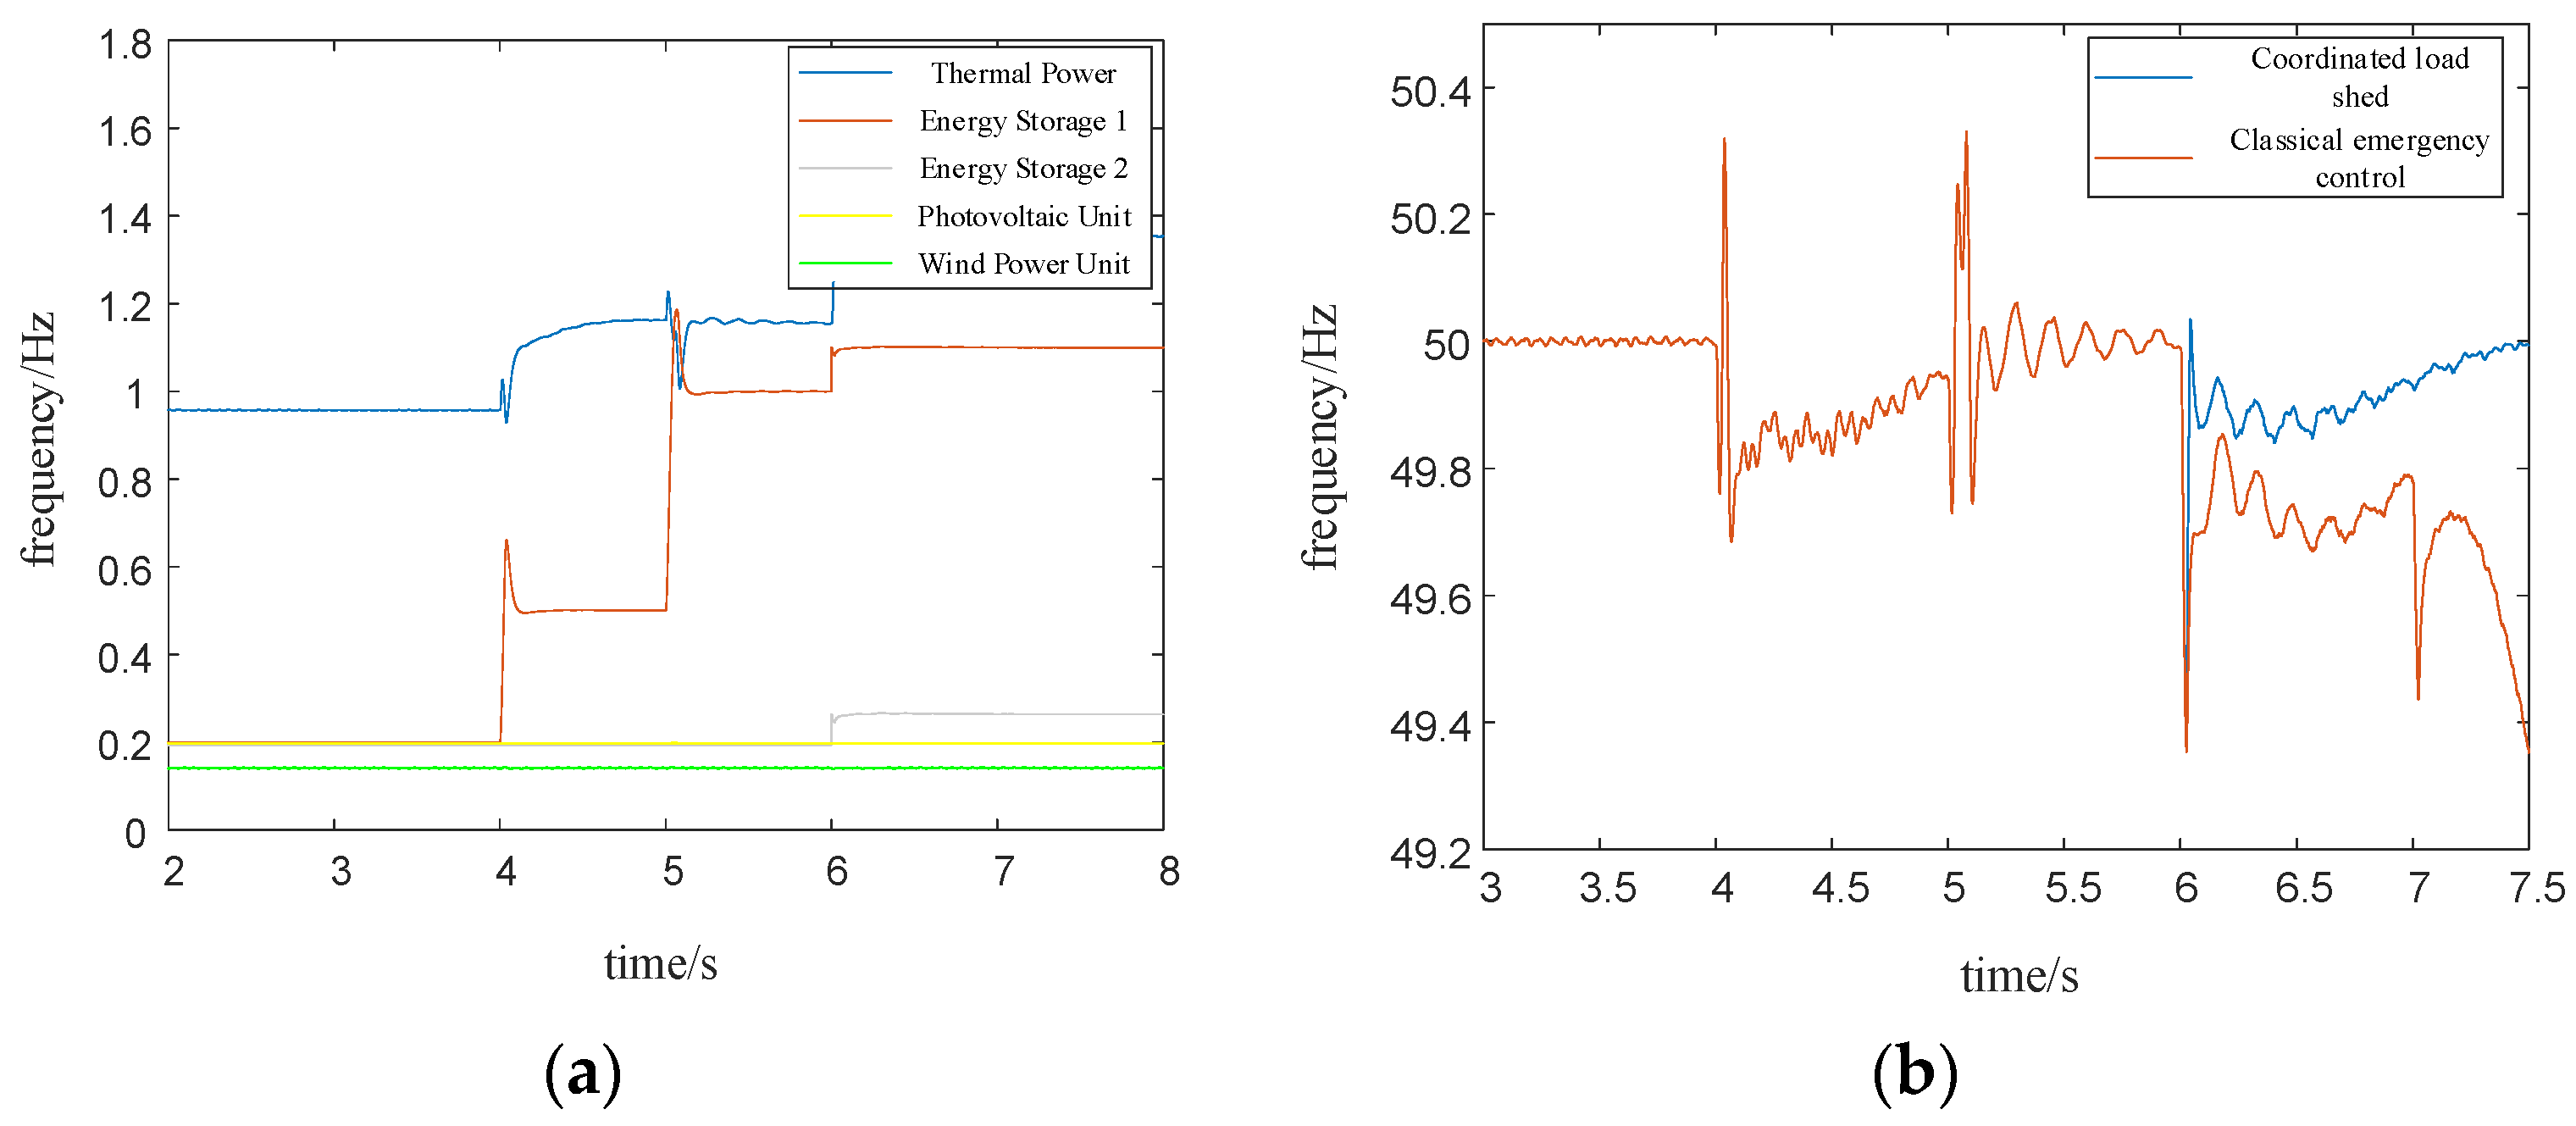
3.2. Analysis of Different Scenarios

The frequency fluctuations of the system under the first four disturbance scenarios are depicted in Figure 9. It can be observed that, in the face of different fluctuation scenarios, the proposed strategy can effectively achieve coordination among various units in a short period. This involves controlling energy storage tracking and thermal power support, enhancing the integration of renewable energy sources, and stabilizing the system frequency. Taking the scenarios of irradiance fluctuation and insufficient SOC in energy storage as examples, the control strategies of different units under layered coordinated control are analyzed based on their respective power outputs.
The output variations of each unit are shown in Figure 10. It can be observed that, under the scenario of fluctuating sunlight, the output curve of the photovoltaic unit changes with the sunlight variation. The dual-loop controlled energy storage unit adjusts the constant power output by changing the reference value, while the wind power unit shows no fluctuations. The upper-level model optimizes the entire system to achieve the minimum net load. In this case, the lower-level model does not require adjustments to the thermal power unit.
In the scenario of insufficient energy storage SOC, the energy storage unit is forced to reduce its output power and cannot support the power deficit in the system. In this case, the thermal power unit in the lower-level model receives instructions to increase power support, with a response time slightly slower than that of the energy storage unit, but still maintaining system frequency stability.
Figure 11 illustrates the system response during an emergency situation when the power support of units is insufficient due to a sudden load increase. In this scenario, for rapid support, priority is given to the energy storage units to act first, slowing down the frequency drop and raising the minimum frequency point. The wind and solar units remain unchanged, followed by the thermal power units providing power support for primary frequency regulation. From the power output variations of each unit Figure 11a, it can be observed that during the three load spikes at 4 s, 5 s, and 6 s, the energy storage units can quickly increase their output power to achieve the expected results. Energy storage unit 1, with a higher SOC, rapidly increases power support during each disturbance. Energy storage unit 2 operates in the third-class state, only increasing power support when the system power support is insufficient, ensuring the supply time. This validates the effectiveness of the proposed strategy. The thermal power unit responds slightly slower than the energy storage unit when participating in power support. At 6 s, facing another load increase, both types of energy storage cannot further increase power support as they have reached their maximum discharge power. At this point, when the frequency drops below 49.5 Hz, load-shedding measures are implemented, and the thermal power unit subsequently provides power support. The load-shedding value is determined according to Section 2.2, and in this study, nearly 0.4 MW is shed. Compared with the control without load cutting measures, the stability of system is maintained at the cost of 0.4 MW.
Considering the scenario where the overall maximum output power of the units cannot support the power deficit, load shedding is a crucial control measure for system stability. From the frequency comparison chart Figure 11b, it can be observed that after considering load shedding, the original control method provides more stable system support in the emergency situation after 6 s, highlighting the necessity of load shedding as a coordinated control strategy.

4. Discussion

In the trend of growing active distribution networks, this paper presents an innovative study aimed at solving the layered coordinated control of controllable resources with automatic load shedding in power systems. The characteristics of various controllable resources are analyzed in order to employ adaptive control methods, and a layered coordinated control strategy is proposed. Simulation results show that the controllable resources are effectively coordinated and controlled in various scenarios.
Significantly, this paper highlights the critical role of energy storage systems in active distribution networks. Classification of energy storage based on power support time and the corresponding control strategy are developed, which finally realizes the output control of the energy storage unit. The proposed method exploits the rapid response characteristics of energy storage systems, enhancing the stability of the overall control strategy.
Lastly, this study introduces coordinated control with load shedding on the basis of coordinated control, providing a feasible solution for frequency dropping again. This comprehensive research framework not only proposes effective solutions for the coordinated control of power systems but also provides innovative insights to cope with challenges like recurrent frequency drops. These research findings are promising to provide robust support for the stability and reliability of power systems.

Author Contributions

Conceptualization, J.Z. and Y.C.; methodology, J.W.; software, J.Z.; writing—original draft preparation, J.Z. and B.L.; writing—review and editing, Y.C. and C.L.; supervision, Y.C. and C.L. All authors have read and agreed to the published version of the manuscript.

Funding

This research was funded by Shandong Provincial Natural Science Foundation, grant number No. ZR2021QE133.

Data Availability Statement

Data are available upon reasonable request to the corresponding author.

Conflicts of Interest

Author Jiaying Wang was employed by the company State Grid Zhejiang Marketing Service Center. The remaining authors declare that the research was conducted in the absence of any commercia or financial relationships that could be construed as a potential conflict of interest.

Nomenclature

The main symbols appearing in this paper are defined below.
SOCState of charge
AGCAutomatic generation control
ESEnergy storage
BESSBattery energy storage system
PVPhotovoltaic system
DEDifferential evolution
DC Direct current
TminShortest discharge time
TsyRemaining discharge time

References

  1. Wu, M.; Ma, D.; Xiong, K.; Yuan, L. Deep Reinforcement Learning for Load Frequency Control in Isolated Microgrids: A Knowledge Aggregation Approach with Emphasis on Power Symmetry and Balance. Symmetry 2024, 16, 322. [Google Scholar] [CrossRef]
  2. Cao, Y.; Zhang, H.; Shi, X.; Xu, Q.W.; Li, C.G.; Li, W. Preliminary Study on Participation Mechanism of Large-scale Distributed Energy Resource in Security and Stability Control of Large Power Grid. Autom. Electr. Power Syst. 2021, 18, 1–8. [Google Scholar]
  3. Wu, D.; Wu, L.; Wen, T.; Li, L. Microgrid Operation Optimization Method Considering Power-to-Gas Equipment: An Improved Gazelle Optimization Algorithm. Symmetry 2024, 1, 83. [Google Scholar] [CrossRef]
  4. Cao, Y.; Wu, Q.; Zhang, H.; Li, C. Optimal Sizing of Hybrid Energy Storage System Considering Power Smoothing and Transient Frequency Regulation. Int. J. Electr. Power Energy Syst. 2022, 142, 108227. [Google Scholar] [CrossRef]
  5. Li, Q.; Wang, D.; Liang, X.; Qin, Y.; Zhang, Y.; Ma, C. An Iteratively-Nested Modeling Method for Stability Analysis of the Multirate Power System. IEEE Trans. Ind. Inform. 2024, 3, 3070–3081. [Google Scholar] [CrossRef]
  6. Zhou, Y.; Zhao, J.; Wu, Z. A Review of Symmetry-Based Open-Circuit Fault Diagnostic Methods for Power Converters. Symmetry 2024, 2, 204. [Google Scholar] [CrossRef]
  7. Cao, Y.; Wu, Q.; Zhang, H.; Li, C. Multi-Objective Optimal Siting and Sizing of BESS Considering Transient Frequency Deviation and Post-Disturbance Line Overload. Int. J. Electr. Power Energy Syst. 2023, 144, 108575. [Google Scholar] [CrossRef]
  8. Li, B.; Sun, Y.; Li, Y.; Lu, T.; Yu, T.; Pang, Y. Research on coordinated control of AC/DC system considering energy storage power limitation. Energy Rep. 2022, 8, 1168–1175. [Google Scholar] [CrossRef]
  9. Nimalsiri, N.; Ratnam, E.; Smith, D.; Mediwaththe, C.; Halgamuge, S. A Distributed Coordination Approach for the Charge and Discharge of Electric Vehicles in Unbalanced Distribution Grids. IEEE Trans. Ind. Inform. 2024, 3, 3551–3562. [Google Scholar] [CrossRef]
  10. Alpízar-Castillo, J.; Ramirez-Elizondo, L.; Bauer, P. Assessing the Role of Energy Storage in Multiple Energy Carriers toward Providing Ancillary Services: A Review. Energies 2023, 1, 379. [Google Scholar] [CrossRef]
  11. Tushar, M.; Zeineddine, A.; Assi, C. Demand-Side Management by Regulating Charging and Discharging of the EV, ESS, and Utilizing Renewable Energy. IEEE Trans. Ind. Inform. 2018, 1, 117–126. [Google Scholar] [CrossRef]
  12. Petrollese, M.; Cascetta, M.; Tola, V.; Cocco, D.; Cau, G. Pumped thermal energy storage systems integrated with a concentrating solar power section: Conceptual design and performance evaluation. Energy 2022, 247, 123516. [Google Scholar] [CrossRef]
  13. Hunt, J.D.; Nascimento, A.; Zakeri, B.; Jurasz, J.; Dąbek, P.B.; Barbosa, P.S.F.; Brandão, R.; de Castro, N.J.; Filho, W.L.; Riahi, K. Lift Energy Storage Technology: A solution for decentralized urban energy storage. Energy 2022, 254, 124102. [Google Scholar] [CrossRef]
  14. Rekioua, D. Energy Storage Systems for Photovoltaic and Wind Systems: A Review. Energies 2023, 9, 3893. [Google Scholar] [CrossRef]
  15. Zhang, H.; Li, Y.; Gao, D.W.; Zhou, J. Distributed Optimal Energy Management for Energy Internet. IEEE Trans. Ind. Inform. 2017, 6, 3081–3097. [Google Scholar] [CrossRef]
  16. Dowling, J.-A.; Lewis, N.-S. Long-duration energy storage for reliable renewable electricity: The realistic possibilities. Bull. At. Sci. 2021, 6, 281–284. [Google Scholar] [CrossRef]
  17. Sarker, M.R.; Saad, M.H.M.; Riaz, A.; Lipu, M.S.H.; Olazagoitia, J.L. Micro Energy Storage Systems in Energy Harvesting Applications: Analytical Evaluation towards Future Research Improvement. Micromachines 2022, 4, 512. [Google Scholar] [CrossRef] [PubMed]
  18. Zhao, J.; Wen, F.; Dong, Z.Y.; Xue, Y.; Wong, K.P. Optimal Dispatch of Electric Vehicles and Wind Power Using Enhanced Particle Swarm Optimization. IEEE Trans. Ind. Inform. 2012, 8, 889–899. [Google Scholar] [CrossRef]
  19. Lin, H.; Liang, T.; Chen, S.M. Estimation of Battery State of Health Using Probabilistic Neural Network. IEEE Trans. Ind. Inform. 2013, 2, 679–685. [Google Scholar] [CrossRef]
  20. Cao, Y.; Wu, Q.; Zhang, H.; Li, C.; Zhang, X. Chance-Constrained Optimal Configuration of BESS Considering Uncertain Power Fluctuation and Frequency Deviation Under Contingency. IEEE Trans. Sustain. Energy 2022, 13, 2291–2303. [Google Scholar] [CrossRef]
  21. Khan, M.-I.; Asfand, F.; Al-Ghamdi, S.-G. Progress in research and technological advancements of thermal energy storage systems for concentrated solar power. J. Energy Storage 2022, 55, 105860. [Google Scholar] [CrossRef]
  22. Majidi, M.; Parvania, M.; Byrne, R. Risk-based stochastic scheduling of centralised and distributed energy storage systems. IET Smart Grid 2023, 6, 596–608. [Google Scholar] [CrossRef]
  23. Adewumi, O.B.; Fotis, G.; Vita, V.; Nankoo, D.; Ekonomou, L. The Impact of Distributed Energy Storage on Distribution and Transmission Networks’ Power Quality. Appl. Sci. 2022, 13, 6466. [Google Scholar] [CrossRef]
  24. Serra, F.; Lucariello, M.; Petrollese, M.; Cau, G. Optimal Integration of Hydrogen-Based Energy Storage Systems in Photovoltaic Microgrids: A Techno-Economic Assessment. Energies 2020, 16, 4149. [Google Scholar] [CrossRef]
  25. Kubankova, E.-A.; Arkharov, I.-A. A Review of Energy Storage Systems. Chem. Pet. Eng. 2023, 11, 936–942. [Google Scholar] [CrossRef]
  26. Trahey, L.; Brushett, F.R.; Balsara, N.P.; Ceder, G.; Cheng, L.; Chiang, Y.-M.; Hahn, N.T.; Ingram, B.J.; Minteer, S.D.; Moore, J.S.; et al. Energy storage emerging: A perspective from the Joint Center for Energy Storage Research. Proc. Natl. Acad. Sci. USA 2020, 23, 12550–12557. [Google Scholar] [CrossRef] [PubMed]
  27. Liu, T.; Yang, Z.; Duan, Y. Short- and long-duration cooperative energy storage system: Optimizing sizing and comparing rule-based strategies. Energy 2023, 281, 128273. [Google Scholar] [CrossRef]
  28. Luerssen, C.; Verbois, H.; Gandhi, O.; Reindl, T.; Sekhar, C.; Cheong, D. Global sensitivity and uncertainty analysis of the levelised cost of storage (LCOS) for solar-PV-powered cooling. Appl. Energy 2021, 286, 116533. [Google Scholar] [CrossRef]
  29. Dai, R.; Esmaeilbeigi, R.; Charkhgard, H. The Utilization of Shared Energy Storage in Energy Systems: A Comprehensive Review. IEEE Trans. Smart Grid 2021, 4, 3163–3174. [Google Scholar] [CrossRef]
  30. Gabbar, H.-A.; Othman, A.-M.; Abdussami, M.R. Review of Battery Management Systems (BMS) Development and Industrial Standards. Technologies 2021, 2, 28. [Google Scholar] [CrossRef]
  31. Lai, C.-S.; Locatelli, G. Economic and financial appraisal of novel large-scale energy storage technologies. Energy 2021, 214, 118954. [Google Scholar] [CrossRef]
  32. Kandari, R.; Neeraj, N.; Micallef, A. Review on Recent Strategies for Integrating Energy Storage Systems in Microgrids. Energies 2023, 1, 317. [Google Scholar] [CrossRef]
  33. Lin, Y.; Lin, W.; Wu, W.; Zhu, Z. Optimal Scheduling of Power Systems with High Proportions of Renewable Energy Accounting for Operational Flexibility. Energies 2023, 14, 5537. [Google Scholar] [CrossRef]
  34. Ai, C.; Zhang, L.; Gao, W.; Yang, G.; Wu, D.; Chen, L.; Chen, W.; Plummer, A. A review of energy storage technologies in hydraulic wind turbines. Energy Convers. Manag. 2022, 264, 115584. [Google Scholar] [CrossRef]
  35. Bakirci, K.; Yuksel, B. Simulation study of solar-source heat pump system with sensible energy storage. J. Therm. Anal. Calorim. 2021, 4, 1853–1864. [Google Scholar] [CrossRef]
  36. Guo, J.; Chen, T.; Chaudhuri, B.; Hui, S.Y.R. Stability of Isolated Microgrids with Renewable Generation and Smart Loads. IEEE Trans. Sustain. Energy 2020, 11, 2845–2854. [Google Scholar] [CrossRef]
Figure 1. Comparison of frequency regulation capability between energy storage units and thermal power units.
Symmetry 16 00479 g001
Figure 2. The control scheme diagram of energy storage: (a) Virtual droop control; (b) PQ double-loop control.
Symmetry 16 00479 g002
Figure 3. The schematic diagram of minimum output fluctuation based on energy storage.
Symmetry 16 00479 g003
Figure 4. The classification of energy storage based on different discharge times.
Symmetry 16 00479 g004
Figure 5. The control strategies for different states of energy storage.
Symmetry 16 00479 g005
Figure 6. The diagram of adaptive constraint handling in under-frequency load-shedding optimization strategy.
Symmetry 16 00479 g006
Figure 7. The hierarchical coordinated control system framework for systems with a high proportion of renewable energy sources.
Symmetry 16 00479 g007
Figure 8. The structural diagrams with multiple types of energy systems.
Symmetry 16 00479 g008
Figure 9. The frequency response under different perturbations: (a) Load surge; (b) Illumination perturbation; (c) Wind speed disturbance; (d) Insufficient storage.
Symmetry 16 00479 g009
Figure 10. The change in output of each unit: (a) Illumination perturbation; (b) Insufficient storage.
Symmetry 16 00479 g010
Figure 11. System response under power deficit: (a) The change in output of each unit; (b) The comparison of frequency curve.
Symmetry 16 00479 g011
Table 1. Comparison between synchronous inertia and virtual inertia.
AspectSynchronous Machine InertiaEnergy Storage Virtual Inertia
Inertia ContinuityFixed and discreteContinuous and designable
Inertial Response TimeInstantaneous actionSome inherent delay
Source of Response EnergyMechanical energy from synchronous machinesElectrical energy from energy storage
Table 2. Comparison of synchronous machines and energy storage frequency regulation capabilities.
AspectSynchronous Machine Frequency RegulationEnergy Storage Frequency Regulation
Response DelayNot more than 3 sNot more than 0.5 s
Complete Response Time10~20 sNot more than 2 s
Output Power CouplingMechanical energy from synchronous machines should not exceed governor response limitsTheoretically full power range adjustment, generally with certain limits
Disclaimer/Publisher’s Note: The statements, opinions and data contained in all publications are solely those of the individual author(s) and contributor(s) and not of MDPI and/or the editor(s). MDPI and/or the editor(s) disclaim responsibility for any injury to people or property resulting from any ideas, methods, instructions or products referred to in the content.

