Article

The Tectonic Framework of Parecis Basin: Insights from a Multiphysics Interpretation Workflow

by
Elaine M. L. Loureiro
1,
Paulo T. L. Menezes
2,*,
Pedro V. Zalán
3 and
Monica Heilbron
4
1
Agência Nacional do Petróleo (ANP), Rio de Janeiro 20090-003, Brazil
2
Departamento de Geologia Aplicada, Faculdade de Geologia, Universidade do Estado do Rio de Janeiro, Rua São Francisco Xavier, 524, sala 2009, Bioco A, Rio de Janeiro 20550-013, Brazil
3
ZAG Consulting, Rio de Janeiro 20040-003, Brazil
4
TEKTOS-Grupo de Pesquisa em Geotectônica, Faculdade de Geologia, Universidade do Estado do Rio de Janeiro, Rio de Janeiro 20550-013, Brazil
*
Author to whom correspondence should be addressed.
Minerals 2024, 14(8), 783; https://doi.org/10.3390/min14080783
Submission received: 28 May 2024 / Revised: 29 July 2024 / Accepted: 29 July 2024 / Published: 31 July 2024
(This article belongs to the Section Mineral Exploration Methods and Applications)

Abstract

:
The Parecis Basin, one of Brazil’s most extensive intracratonic basins, holds significant potential for hydrocarbon exploration. Despite its vast size, Parecis has yet to be extensively explored, with only five wildcat wells drilled. So far, no commercial discoveries have been announced. Regional studies have suggested Paleozoic sedimentation, while recent analyses have revealed a Neoproterozoic infill. Its tectonic model is still a matter of debate, and to date, no detailed structural map for the whole basin has been published. The present work proposes a new detailed structural map of the Parecis Basin based on a four-step interpretation workflow integrating seismic and gravimetric data. The first step includes converting the public 2D seismic lines to the depth domain. The second step is estimating the residual Bouguer anomaly, where the computed residual anomalies should relate to the basin’s tectonic features. The third step comprises the 2D forward modeling of the gravimetric anomalies using the 2D seismic interpretation as a constraint. The final step compiled all the interpreted features into our new structural map. This map reveals the top of the basement, forming a complex framework of horsts and grabens. Normal faults define the main structural style in the basin. Further, we could recognize thick, high-density bodies embedded in the crystalline basement. These bodies consist of Orosian–Calimian (1.8–1.6 Ga) mafic and ultramafic rocks, which may be a potential source for hydrogen exploration in the basin. Subsequent geophysical and geochemical surveys will assess the hydrogen potential in the area.

1. Introduction

The Parecis Basin (PB) is one of the largest Brazilian intracratonic basins. Its Mesozoic cover spreads over an area of 352,077 km2. The Parecis Basin is rectangular and elongated in the W-E direction. Its borders are as follows: to the south, the Alto Xingu Arc; to the west, the Rio Guapore Arc; to the north, rocks of the Ventuari-Tapajós and Rio Negro-Solimões Provinces of the Amazon Craton; to the east, the Bananal Basin [1]. The Parecis Basin is divided into several grabens and high compartments. They are Pimenta Bueno, Colorado, Caiabis and Xingu grabens and Rio Branco and Brasnorte highs [2,3]. Serra Formosa and Vilhena Arcs subdivided the Parecis Basin into three sub-basins: Alto do Xingu, Juruena, and Rondonia. The sedimentary infilling goes up to 10 km in the grabens [4].
The initial research suggests a tectonostratigraphic correlation between the Parecis Basin and the Paleozoic basins of South America. These articles utilized data from shallow wells (less than 1000 m in depth), geological mapping, and gravity analysis. They developed a geological and structural map of the Parecis Basin, evaluated the depths of basement structures through gravimetric and magnetic data, and, finally, proposed a structural map [2,3,5] (Figure 1).
Concerning the comprehension of lithology, two stratigraphic wells, 2 FI 001 MT and 2 SM 001 MT, were drilled during the 1990s. Their analysis led to the presentation of a new stratigraphic chart and the description of the tectonic–sedimentary evolution of the Parecis Basin, reinforcing the predominantly Paleozoic age of most sediments. More recently, research has suggested that the tectonic evolution of Parecis Basin occurred from the Neoproterozoic to the Quaternary period, characterized by the predominance of a thick package of Neoproterozoic sediments [6,7].
Herein, we develop the findings by developing a multiphysics interpretation workflow to propose a new structural map for the Parecis Basin [8]. The workflow is based on the gravimetric interpretation of all currently available regional datasets, constrained by seismic and well-log data. This approach led to a more detailed definition of the basin structural framework, including identifying a new regional arc and defining a new set of grabens and horsts. Additionally, it allowed the interpretation of thick, high-density bodies ingrained in the basin’s basement as mafics and ultramafics rock bodies, known generating rocks for hydrogen.

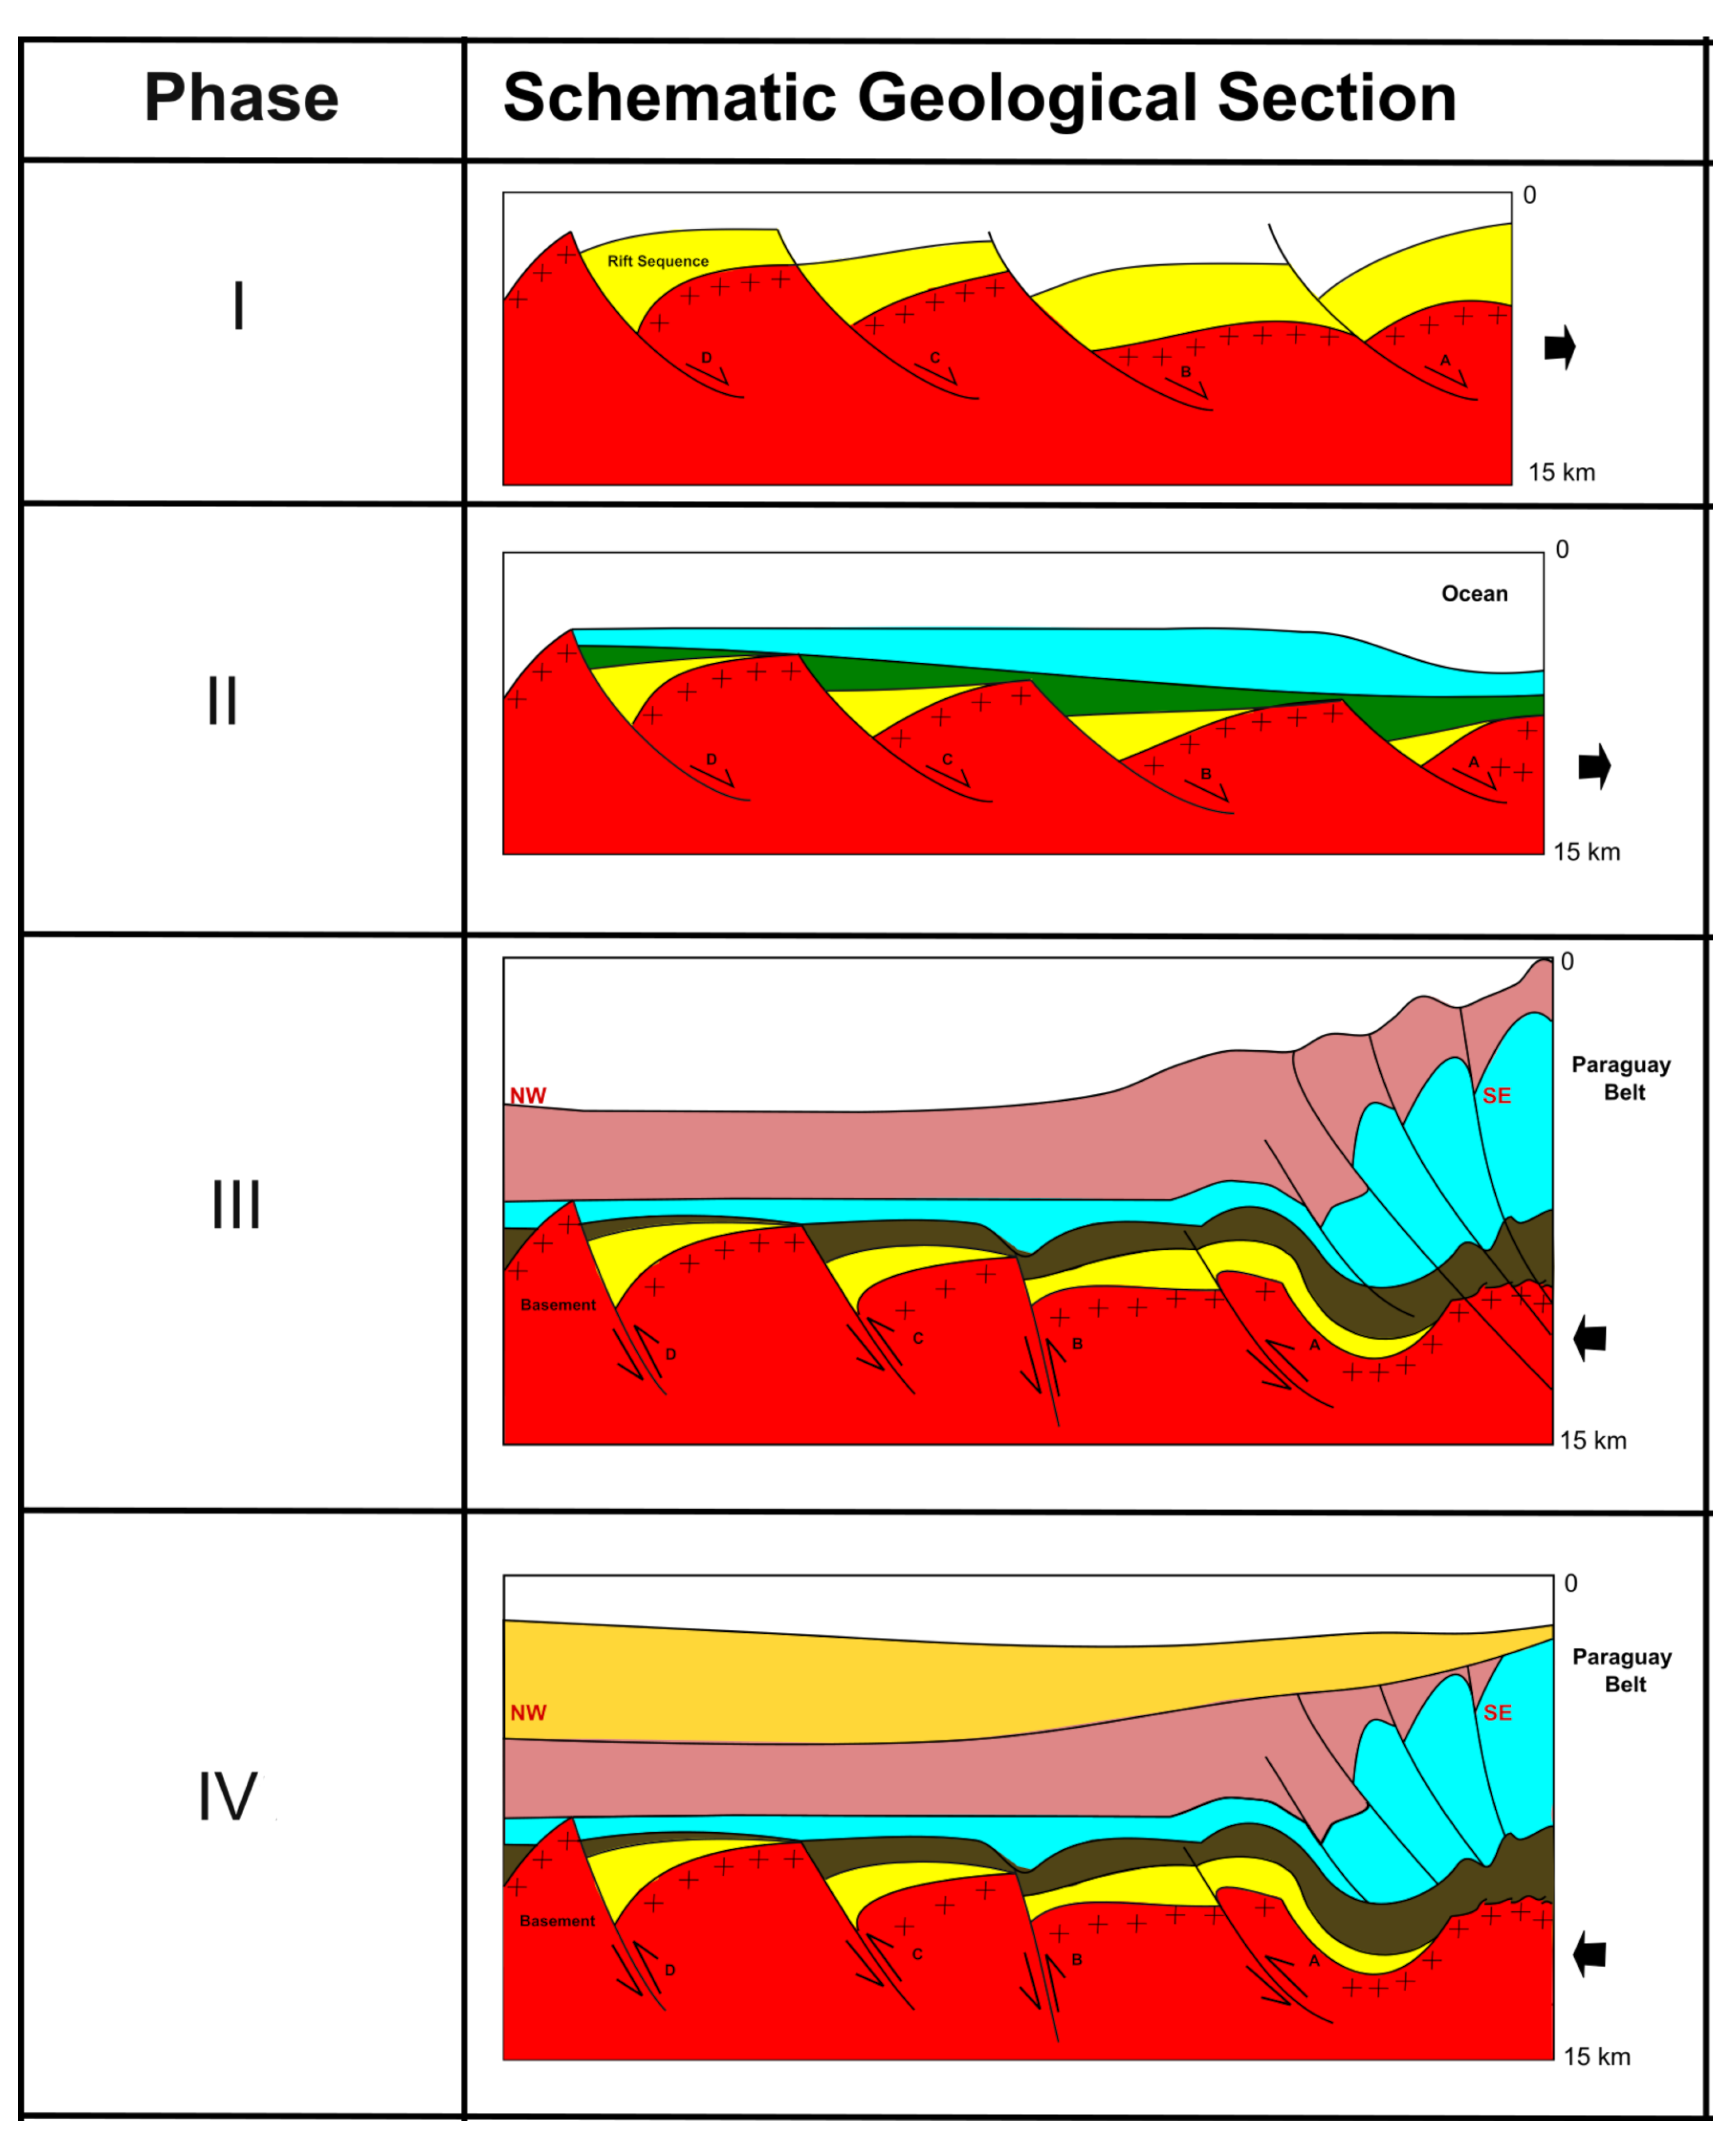
2. Tectonostratigraphic Setting and Tectonic Evolution

The Amazon Craton that composes the basement of Parecis Basin has been affected by several tectonic events from the Archean to the Mesoproterozoic [9]. The main geological units for Parecis Basin are represented by granitoid and supracrustal rocks related to the amalgamation of the Ventuari–Tapajós (VT) and Rio Negro–Juruena (RNJ) Blocks [9]. The older VT block collided with the RNJ Block between 1.8 and 1.6 Ga ago, resulting in an extensive belt 2700 km long and 1000 km wide, composed of granitic, gneissic, and migmatitic rocks [10,11].
Following the cratonization of the Ventuari–Tapajós province, a subsequent accretionary phase commenced between 1780 and 1550 Ma. Intra-oceanic magmatic arcs amalgamated during this period, giving rise to numerous rifts, aulacogens, and cratonic volcanic–sedimentary basins [12]. The Grevillian Orogeny represents the closure of oceanic spaces and the amalgamation of these blocks. The initial pulse of ca. 1.55 to 1.3 Ga [13], known locally as the Rondônia–San Ignácio event, was followed by the second pulse of the Grenvillian Orogeny, the Sunsás stage, which developed between ca. 1.3 and 1 Ga years ago. These tectonic pulses led to a major agglutination period responsible for building the Rodinia supercontinent between 1250 and 960 Ma [14].
The Breakup of Rodinia resulted in the diachronous rupture of the Amazon and Laurentia Cratons between 1100 and 700 Ma ago [14,15]. This rift initiation led to the development of passive margin basins in the region [13,16,17] and opened the Goias and Pharusian seas [10,18].
During the Neoproteozoic, when the rift process of Rodinia started, the deposition started the siliciclastic sediments of the Cuiaba Group and lower Carbonatic Sequence in Salto Magessi Formation [6], followed by the Bauxi Formation, a siliciclastic sequence [6] and by the glacial Puga Formation, correlated with the Marinoan-Ghaub glaciation (ca. 635 Ma). The last one is characterized by diamictites associated with conglomerates, sandstones, and shales, which are the principal rock types of this sequence; both of them are from Jangada Group [6,7,19,20].
The Araras group displays platform carbonate sequences from 100 to 1300 m thick. It highlights distinct geological features and comprises three formations—Mirassol D’Oeste, Nobres, and Guia [7,19,20]. The Lower Mirassol D’Oeste Formation comprises stromatolites with tube-like structures, breccias, and giant wave ripples. The sequence displays aragonite pseudomorphs, of which 20 to 32 m is considered a cap carbonate [19,20]. The Guia Formation contains limestone, mud–limestone, and mudstones developed in the middle shelf. At the top, the Nobre Formation has shallower-water breccias, grainstones, and packstone dolomites [6,16].
The subsequent tectonic event is the result of the Western Gondwana amalgamation, involving the Congo–São Francisco, Kalahari–CMG, West Africa, Amazonia, and Rio de la Plata Blocks, with diachronic collisions between ca. 650 and 570 Ma. This major tectonic event closed the Adamastor and Goianide–Pharusian Oceans [21,22]. The final tectonic episode resulted in a Foreland continental environment in the studied region, with the deposition of the Alto Paraguay Group subdivided into four continental sequences.
The basal sequence is the Serra Azul Formation, and its deposition started with two sedimentary sequences: diamictites and laminated mudstones, siltstones, and fine sandstones at the top [23]. A cap carbonate layer was identified overlying this formation. This cap carbonate foregoes the Paleozoic sediments of the Parecis Basin, representing a post-glacial event correlated to the Marinoan glaciation [24]. The Serra Azul Formation also correlates with the Gaskier Glaciation during the Ediacaran period [23]. The top of the Paraguai Group is made of sandstones and pebble ortho-conglomerates of the Raizama Formation [6], followed by an interdigitation of sands and shales of the Sepotuba Formation [6,25], and, at the top, by red shales, siltstones, and arkoses of the Diamantino Formation [6,16].
In the Paleozoic, the amalgamation of exotic terrains contributed to building the Andean Belt, and the development of retro-arc foreland basins influenced the region. During this period, several progressive marine incursions reached the cratonic area. Because of that, sediments were deposited in a large area of the southern margin of the western Gondwana, in a sandy platform to reworked fluvial deposits [13,26], characterized by deposition of sandstones and conglomerates of the Furnas Formation and pelitic sediments of the Ponta Grossa Formation. Any sample of this sequence was identified well in the study; however, there are outcrops in the Alto Xingu Sub-basin [27,28].
The combination of active tectonism and climatic factors resulted in a sedimentation gap of about 45 Ma in South America. The tectonic style changed from extensional to compressional in the Late Carboniferous [29].
The tholeiitic basalts of Anari represent an important magmatic episode [30,31] and Tapirapuã Formation [32] with ages around 197 Ma (Sinemurian/Late Jurassic). They were identified in the northwestern and central-south sectors of the studied region and could be correlated with the basalts of the Mosquito Formation of Parnaiba Basin [33]. This magmatic event happened in the Late Jurassic before the Serra Geral extensive igneous event of the Paraná Basin [30].
The subsidence of Parecis Basin continued in the basins until the lake fluvial and eolic sediment depositions under the contribution of wave effects of the Parecis Group in the Late Cretaceous [2,6]. This group comprises eolic sandstones and conglomerates of Salto das Nuvens and the Utiariti Formation. Figure 2 illustrates a revised previous stratigraphic chart of the Parecis Basin [6,7].

3. The Multiphysics Dataset

The Brazilian National Petroleum, Gas, and Biofuels Agency (ANP) provided the multiphysics dataset interpreted herein. The public-domain dataset comprises over 1400 linear km of 2D seismic lines and gravity data acquired from several regional gravity surveys. ANP also provided checkshots, stratigraphy, and composite well logs (density, gamma-ray, porosity, resistivity, and sonic) of two wells, 2 FI 001 MT and 2 SM 001 MT, drilled at the ends of seismic lines (Figure 1).
The seismic data were acquired in 0295-2010 from the 0295_ANP_2D_PARECIS project. ANP provided the pre-stack time-migrated (PSTM) time-domain in the SEG-Y format. The PSTM technique better attenuates the S-wave effect, reducing overall noise [34]. The processor of the seismic dataset takes on a 2500 m/s replacement velocity and a 500 m above mean sea level reference datum. The 2D lines and well-log data were loaded into commercial seismic interpretation software.
The gravity data includes surveys with different setups and parameters. This study used two airborne surveys (Figure 3). Both were acquired in 1995 and flown at a constant altitude of 1060 m. The app314 has flight lines along the N–S direction with a line spacing of 18 km and E-W tie lines at 36 km. The app311 has flight lines along the NNW–SSE direction with a line spacing of 6 km and ENE-WSW tie lines with an 18 km line spacing.
We merged our airborne datasets with a compilation of ground surveys acquired along the seismic lines (survey 0295_GRAV_ANP_2D_PARECIS in Figure 3) and regional profiles along the available roads (BNDG in Figure 3).
All gravity stations were tied to the 1971 International Gravity Standardization Network (IGSN-1971) and processed through a standard workflow, with the gravity data being corrected for instrumental drift and tide effect. The latitude effect was calculated by adopting the 1967 International Gravity Formula:
g l = 978.03185 ( 1 + 0.005278895 s i n 2 ϕ + 0.000023462 s i n 4 ϕ ) ,
where g l is the latitude correction in Gals, and ϕ is the latitude. The Bouguer correction was applied using the following equation:
δ g B = 0.4193 ρ h ,
where δ g B is the Bouguer correction, ρ is the Bouguer slab constant density of 2.67 g/cm3, and h is the height difference between the local and reference stations.
ANP provided each dataset in the XYZ ASCII format with five gravity station channels: latitude, longitude, topography, Free-Air anomaly, and the Bouguer anomaly. Next, we reprocessed all datasets to provide a single merged and leveled Bouguer anomaly map [35]. To that end, we upward-continued the ground data to a 1060 m height, the same as the base level of the airborne surveys. Then, the leveled data were gridded into a 12 × 12 km cell to produce the Parecis Basin’s Bouguer gravity anomaly shown in Figure 4.

4. Interpretation Workflow

We present a novel approach for generating a structural map of the Parecis Basin. This approach involves a four-step interpretation workflow: (1) integrating seismic data with well-log information and converting seismic lines from time to depth, (2) calculating the residual gravity anomaly, (3) performing quantitative interpretation using 2D forward modeling of gravity anomalies along the depth-converted seismic lines, and (4) conducting structural interpretation.

4.1. Seismic to Well-Tie and Time-to-Depth Conversion

Seismic to well-tie conversion is essential to the interpreter’s work. The primary goal is to correlate the stratigraphic markers depicted in the wells with the seismic reflections, aiming to determine the horizons to pick correctly. Obtaining a well-tie is relatively straightforward: synthetic seismograms calculated from acoustic impedance well-log curves are matched to the actual seismic traces, so the features of the well in the depth domain are coupled to the seismic data in the time domain. As a result, we obtain a time-to-depth table that can be used in the depth conversion of the seismic lines. Two main 2D stratigraphic horizons were mapped in all seismic lines: the Top of the Neoproterozoic (ToN) and the Top of the Rift (ToR) (Figure 5). Then, these 2D horizons were gridded to generate a surface covering the studied area for the time-to-depth (T–D) conversion stage.
There are several strategies for performing T–D conversions [36]. We used the velocity model building option and constructed a 3D three-layer cake velocity model for all 2D seismic lines (Figure 6). From top to bottom, Layer 1 corresponds to Mesozoic and Paleozoic sediments (Groups Parecis and Paraná, respectively), Layer 2 corresponds to late Neoproterozoic sediments (Groups Alto Paraguai, Araras, and Jangada), and Layer 3 is associated with the early Neoproteroic syn-rift sediments (Group Cuiabá) and basement rocks.
On top of Layer 1, we considered the seismic datum reference (SDR) surface, where, at time zero, we used the replacement velocity of 2500 m/s. Layers 2 and 3 are bounded by two steering horizons, the Top of the Neoproterozoic and the Top of Rift.
By applying the Dix formula, we calculated the interval ( V i ) (Equation (3)) and average velocities ( V a v e ) (Equation (4)) using the RMS (root mean square) velocities V R M S [34]. Then, the average velocities were smoothed, interpolated, and steered along the interpreted horizons along the studied area. As a result, we produced the velocity model (Figure 5) used in the T-D conversion.
υ i n t 2 = υ R M S n 2 t n υ R M S n 1 2 t n 1 t n t n 1
υ a v g = i = 1 N υ i Δ t i i = 1 N Δ t i

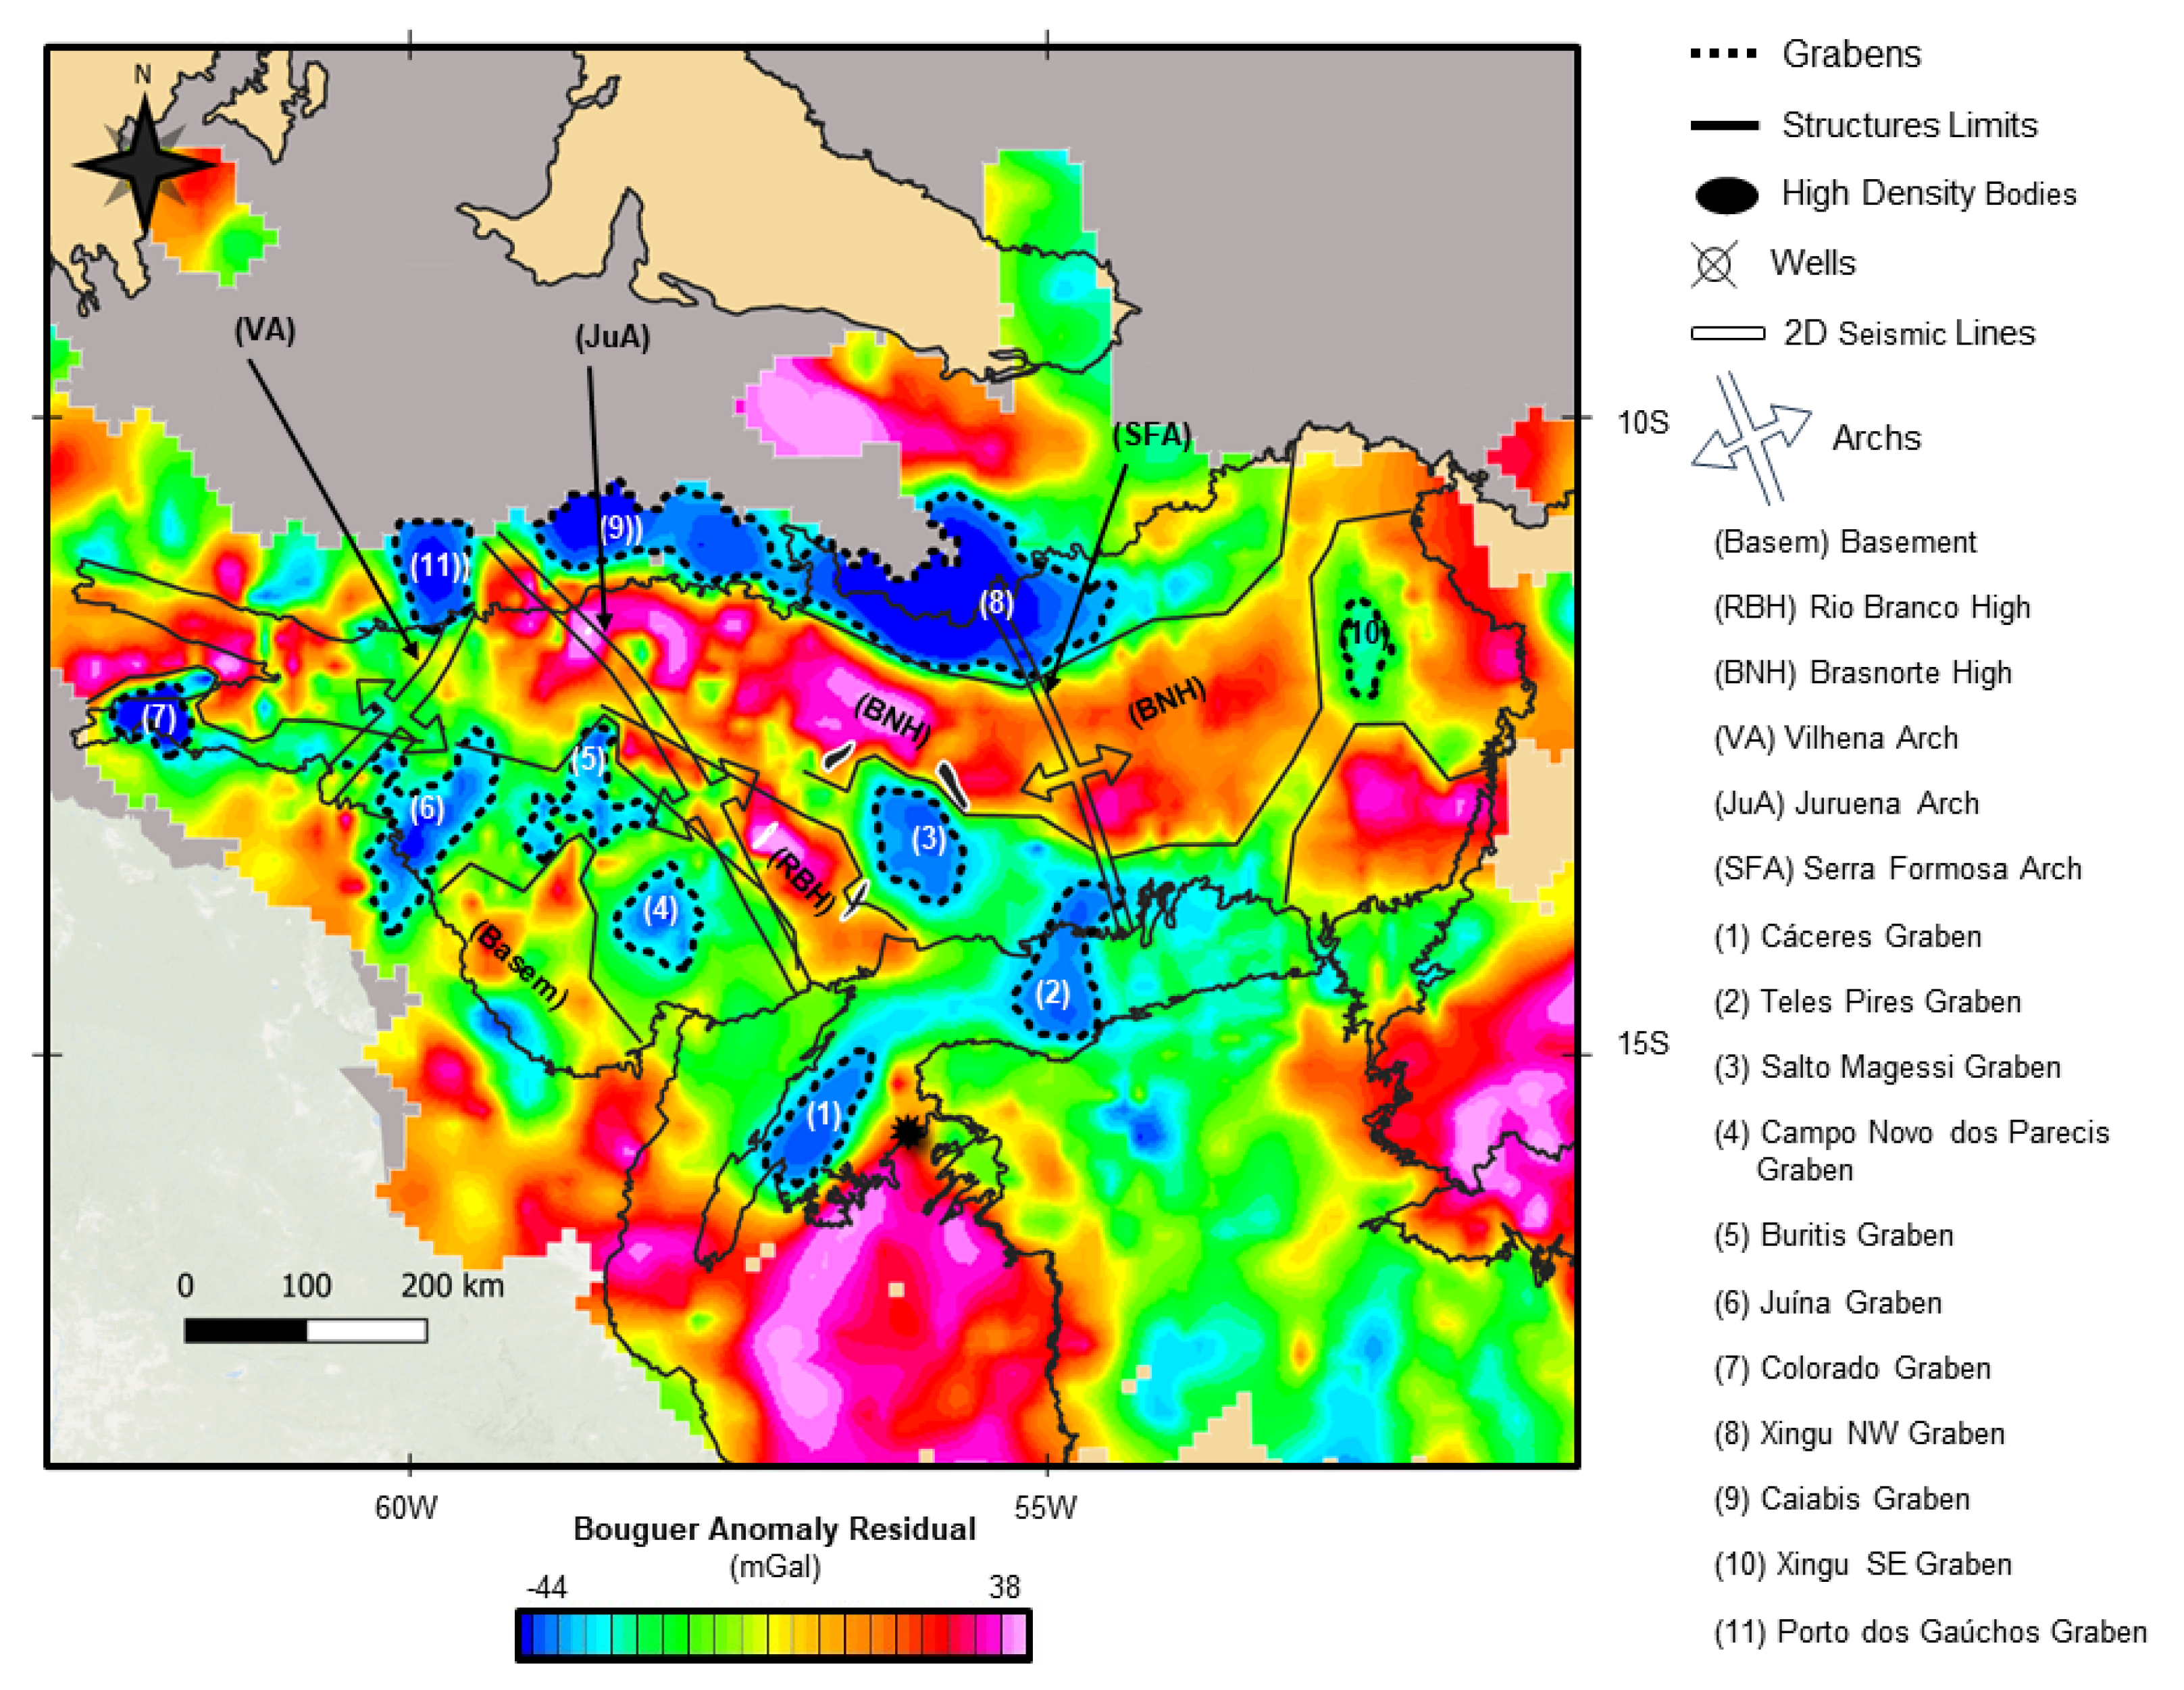
4.2. Residual Gravity Anomaly

Separating gravity anomalies into their respective regional (deep) and residual (shallow) components is necessary for quantitative interpretation. There are various strategies for regional–residual separation. Ref. [37] applied the upward-continuation technique to interpret the Sudbury structure in Canada; ref. [35] used robust polynomials to represent the regional field and better recover the residual gravity anomaly of the Barra de São João Graben, Campos Basin Brazil; and ref. [38] removed the regional anomaly derived from a global crustal model [39] to isolate the gravity effects of the basement of Jequitinhonha Basin, Brazil.
To separate the gravity effects of the Parecis Basin sediments and basement topography from the Moho interface and deep-seated sources, we used the upward-continuation (UC) method. The UC attenuates the contribution of high-frequency anomalies of near-surface shallow sources in the regional anomaly. Thus, the remaining smooth low-frequency anomalies reflect the deeper causative bodies. A limitation of UC is the overlap of the gravity effects from several closely spaced high-frequency anomalies, resulting in the merger of the separate features forming a single “apparent” broader anomaly. A benefit of the UC method is the noise reduction in the original data as the continuation height increases. Additionally, the effect of widely irregular density distribution is reduced [37].
To estimate the regional anomaly, the Bouguer gravity anomaly was upward-continued to several height levels: 20, 90, 110, 120, 130, 140, 150, and 180 km (Figure 6). The choice of the correct regional level is based on a priori information of a known geological that can be correlated with a given gravimetric anomaly [40]. At the first continuation level of 20 km, tracking a prominent SW-NE short-wavelength positive anomaly associated with the Transbrasiliano Lineament, a shallow upper crustal structure [41] is possible. The short-wavelength anomaly is attenuated and smeared as the continuation level increases (Figure 6). We have chosen the 140 km level where almost all short-wavelength anomalies are attenuated, with only the deep-seated source signals remaining. Above 140 km, the low-frequency anomalies are similar to the chosen upward-continuation level, indicating that the high-frequency spectral content was adequately attenuated at the 140 km level [40]. The upward-continued anomaly indicates a west-to-east crustal thickening in the studied area.
Figure 7 shows the residual anomaly over the Parecis Basin, corrected for profound crustal effects. The correction consisted of subtracting the upward-continued gravity field to the 140 km height (Figure 6) from the Bouguer gravity anomaly (Figure 4).
As expected, the residual anomaly (Figure 7) shows several internal small gravity highs and lows within the Parecis Basin that were hidden or partially masked in the Bouguer anomaly (Figure 4) due to the gravity effect caused by the deep sources. These smaller anomalies, if correlated with basement features, indicate a more complicated tectonic framework than mapped previously [2,3] (Figure 1).

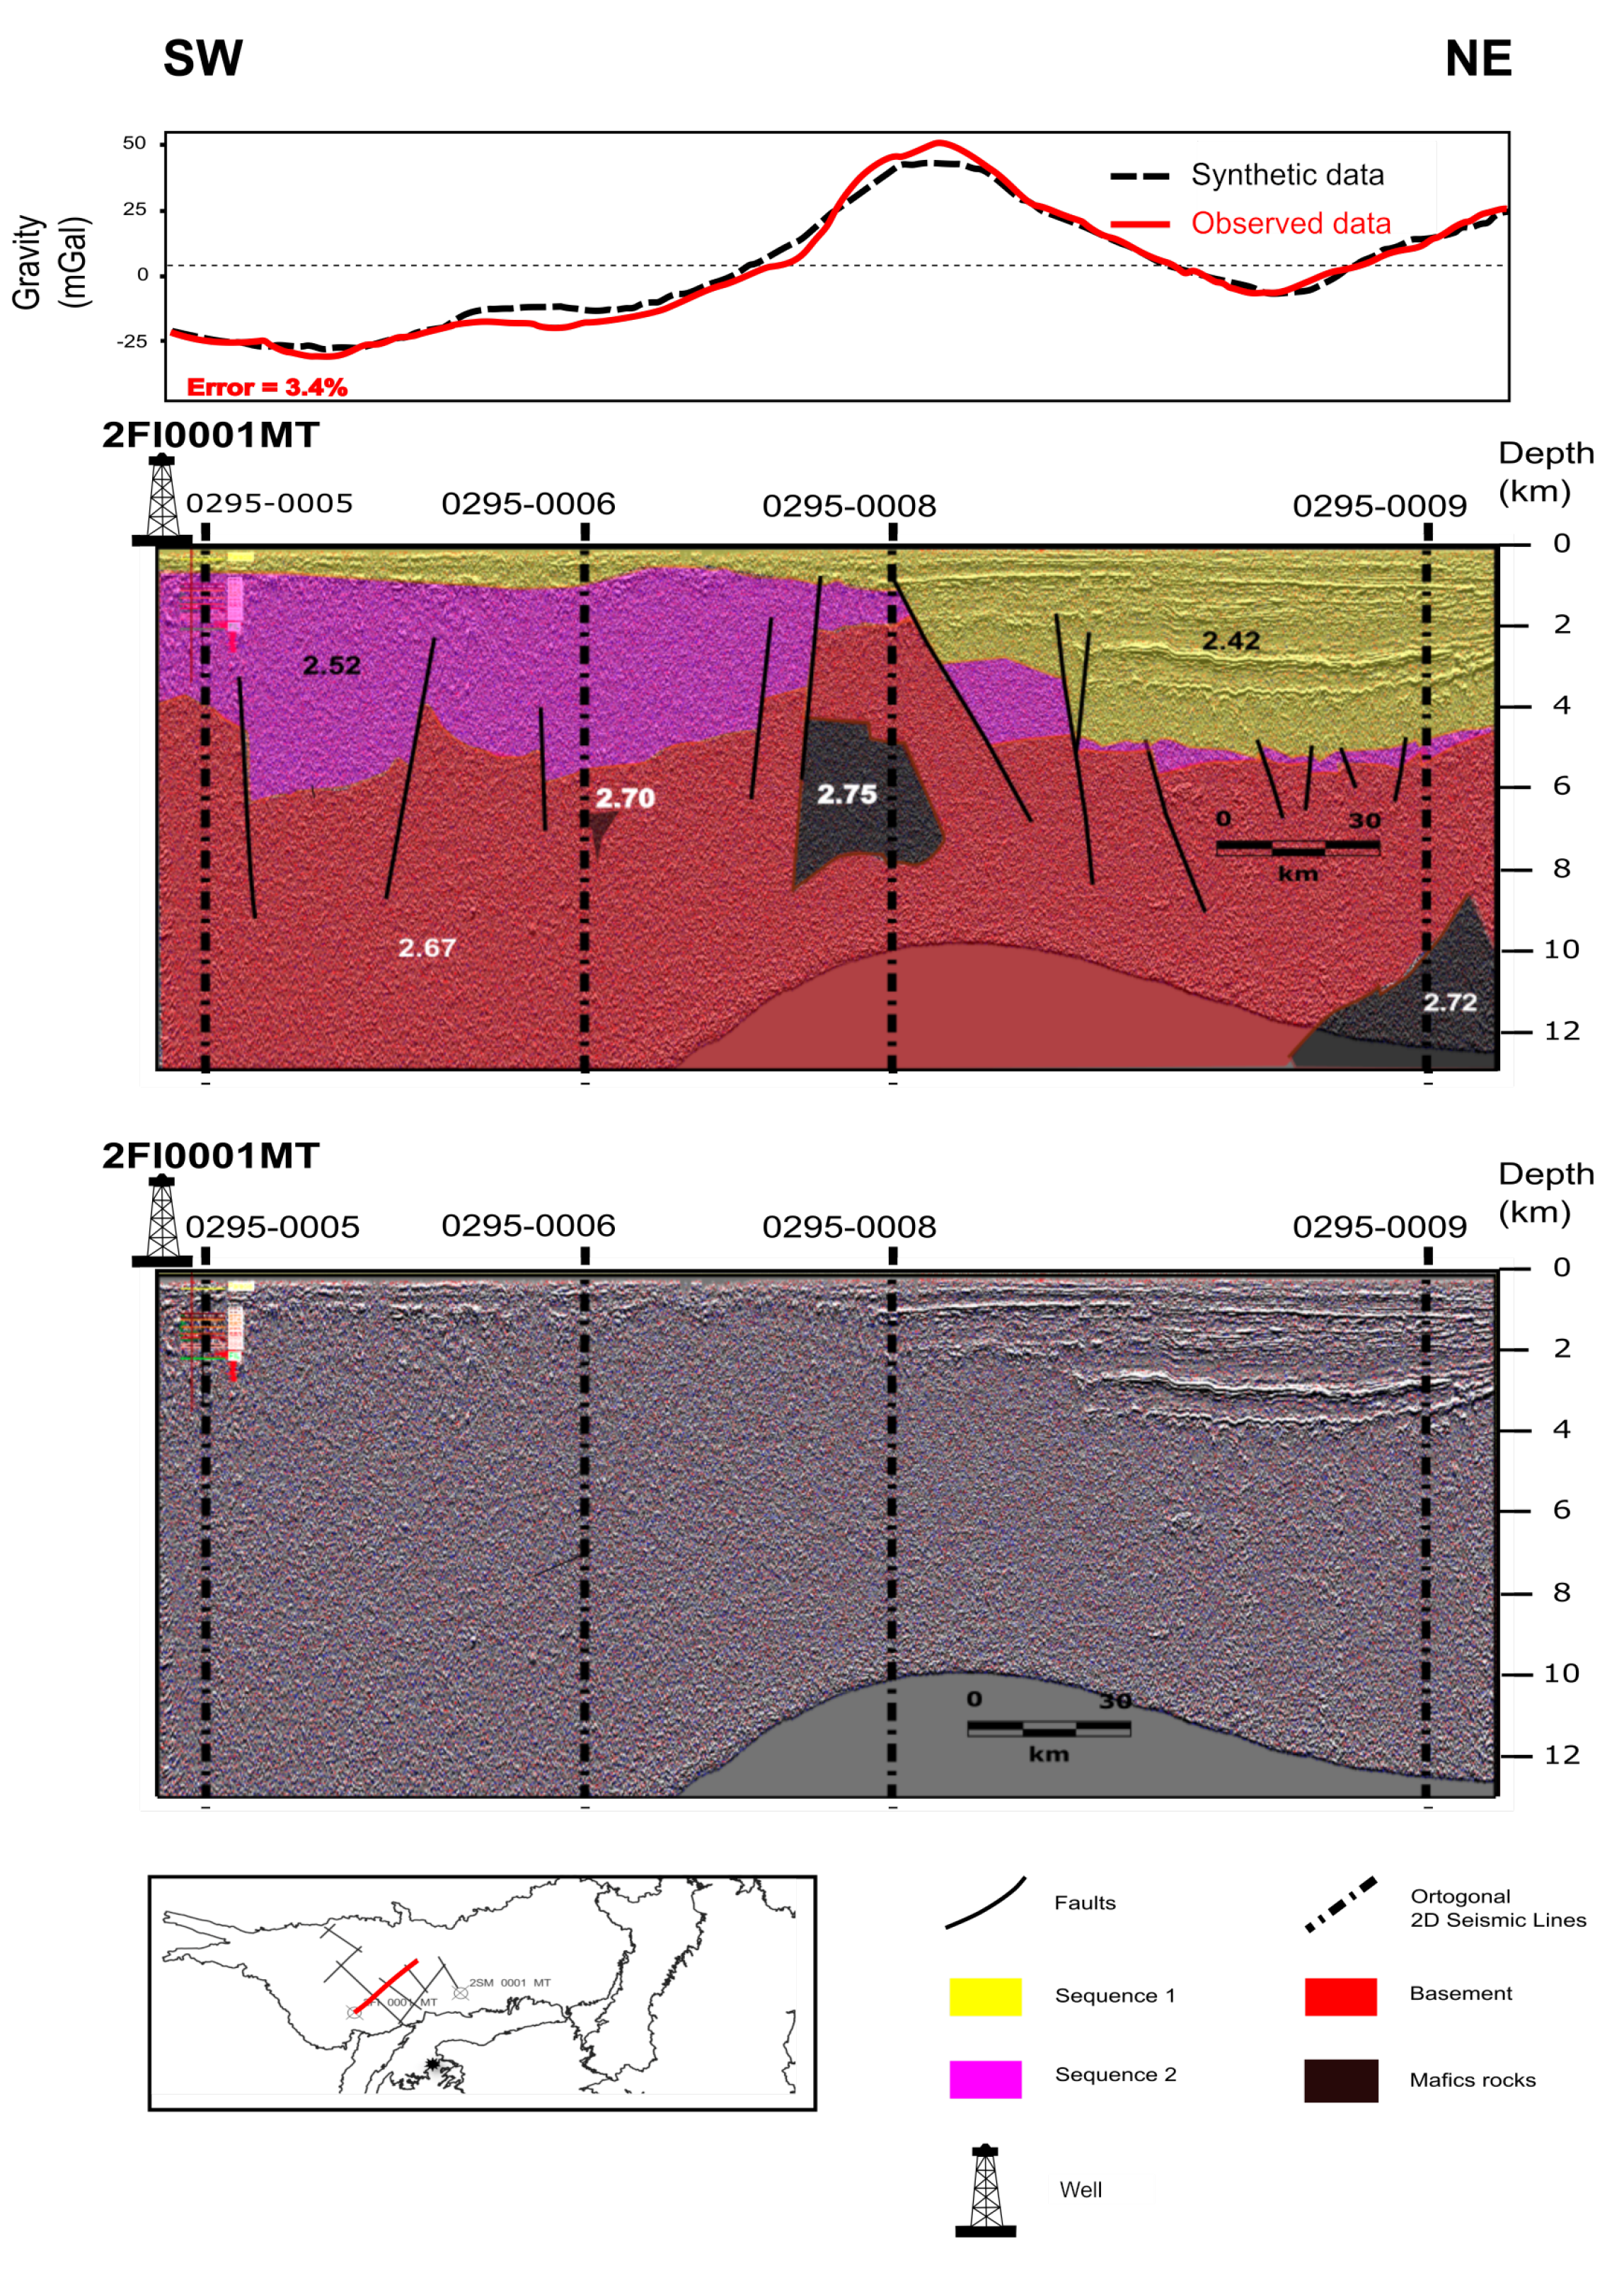
4.3. 2D Forward Modeling

Non-uniqueness is a central subject in geophysical interpretation. To reduce this issue, geophysicists often combine two or more geophysical methods with any available geologic data to constrain the interpretation attempting to encounter the most suitable geological model that fits the geophysical data [38,42,43,44].
We have modeled all seismic lines using the residual gravity anomaly in the present work. For the sake of brevity, we show the selected results of two lines, L295-0001 and L295-0002 (Figure 8 and Figure 9), which are representative of the studied group. Moreover, they are the most extensive lines within the studied group and cross several gravimetric anomalies throughout the study area.
We have used commercial software to conduct the forward modeling. The algorithm is based on the classical Talwani methodology [45]. Its principal advantage is building 2D gravimetric models from seismic lines available in the standard SEG-Y format or geo-referenced image files. Additionally, interpreted seismic horizons, provided in the XYZ–ASCII format, can be uploaded into the software.
Density-log data from the two available wells (Figure 1) were used to constrain the sediment densities in the modeling exercise. These densities are in the 2.42 to 2.52 g/cm3 range. To the crystalline basement, we have assigned the average 2.67 g/cm3 value, which is standard and representative of the granitic crust [46]. Densities in the 2.70 to 2.75 g/cm3 range were used for mafic and ultramafic bodies.
Figure 8 and Figure 9 show the interpreted final 2D model and the comparison of the observed residual gravity anomaly with calculated data along lines L295-0001 and L295-0002, respectively. As depicted from both figures, there is a good agreement between the residual gravity highs and lows with the basement horsts and grabens features, respectively. This is an indication that the main anomalies of the residual gravity anomaly map (Figure 7) can be associated with the Parecis Basin basement features.
To help in the seismic interpretation task, we have applied the TecVA (amplitude volume technique) attribute [47]. The TecVA converts the seismic amplitude into a pseudo-relief attribute, enabling the interpreter to identify horizons and faults easily. When represented with an appropriate color scale, the TecVA attribute provides seismic-enhanced images with strengthened structural and stratigraphic features, such as unconformities, faults, fractures, and distinct seismofacies. Sub-vertical faults are seen as interruptions in the continuity of the horizontal or sub-horizontal reflections in this context. The TecVA attribute with a –90° phase rotation makes the conventional seismic amplitude sections resemble actual outcropping planes [48].
The TecVa attribute allowed the identification of several faults in the studied sections. Most are considered normal faults, but thrust faults were also observed in the studied area [8].
To produce the good fit of line L295−0002 (Figure 8), it was necessary to define a heterogeneous basement including high-density bodies (2.72–2.75 g/cm3) embedded within the basement. With a single density representing a homogeneous basement, we could not obtain a satisfactory fitting for the data. We will discuss the geological meaning of this body later, which is bounded by normal faults as identified in the TecVa attribute. Similar high-density bodies were also discovered in other seismic lines of the Parecis Basin. These bodies can be interpreted as ophiolites subducted during the Orosian–Calimian (1.8–1.6 Ga) continental compression [8].

4.4. Tectonic Framework

The quantitative seismic gravity-integrated interpretation correlates the Parecis Basin basement features with the main anomalies (gravity highs and lows), which we mapped in the residual gravity map (Figure 7). These mapped features are synthesized in the new structural map presented in Figure 10. Figure 11 presents a three-dimensional perspective showcasing three grabens.
Notably, certain low-value anomalies on the residual Bouguer map extend beyond the currently established limits of the Paleozoic Basin. However, the delineation of the basin has thus far been based on sedimentary cover extending from the Paleozoic to the present. With the recognition that the lithologies of samples found in well 2-SM-0002-MT correlate with recognized outcrops in the Paraguay Belt, the possibility arises of the existence of one or more older sub-basins of Neoproterozoic age or earlier [6,7]. The higher resolution of the gravity residual anomaly compared to the Bouguer anomaly allowed the identification of eleven grabens in the studied area, six more than previously interpreted [3].
Our interpretation indicates the existence of a third regional arc, herein named Juruena Arc (JuA). Situated in between the two previously known arcs, Serra Formosa and Vilhena (VA), the JuA runs sub-parallel to the VA. Trending northwest–northeast, JuA is isolated, in its northern portion, and there are strong residual gravity anomalies associated with the Brasnorte (BNH) and Rio Branco highs (RBHs). In its central portion, JuA separates the Buriti and Campo Novo dos Parecis grabens. JuA is characterized by northwest–northeast trending gravimetric anomalies associated with basement uplift in its southern portion Figure 10.
Our interpretation also demonstrates that the Serra Formosa Arch is more likely to have a north–south trending direction, as demonstrated by the residual anomaly separation along the Brasnorte High in its northern branch and separating Teles do Pires and Salto Magessi grabens in its southern branch. Our modeling results have also shown the existence of high-density enclaves and slivers associated with mafic and ultramafic rocks amidst the 2.67 g/cm3 basement. Plotting these occurrences along with the residual gravity anomalies (Figure 10), we observe these elongated mafic–ultramafic bodies are confined within the Brasnorte and Rio Branco highs, which explains part of the gravimetric anomaly.
Two tectonic hypotheses are possible for the identified mafic–ultramafic bodies within the basement. The first suggests that these bodies as ophiolite fragments subducted during the Orosian–Calimian (1.8–1.6 Ga) continental collision, wherein the Província Ventuari–Tapajós Block (older) collided with the Rio Negro–Juruena Province (younger) [49]. This collision event may have led to the obduction of a portion of the oceanic crust, preserving these ophiolites as relics of the older oceanic crust. The second suggests that denser bodies could have formed due to rifting continental compression or magmatic intrusions associated with the breakup of the Rodinia Supercontinent during the Mesoproterozoic era and correlated by magmatism in Mesoproterozoic (1.2 Ga) [10,50].
Several published studies corroborate our findings. Firstly, it is reported that the Cáceres and Teles Pires grabens are situated within the Paraguay Belt region, indicating a zone of crustal thickening likely attributable to the Brasília, Araguaia, and Paraguay Belt, which emerged during the Brasiliano Orogeny. These grabens are believed to have formed approximately 620 Ma ago through the amalgamation of three cratons: the Amazon, São Francisco, and Paranapanema [51,52,53].
Secondly, the Salto do Magessi and Campo Novo dos Parecis Grabens have been delineated on seismic lines L295-0001 and L295-0002, as depicted in Figure 11. However, according to the Residual Bouguer Map, Campo Novo dos Parecis is situated near the border on line L295-0001. Their existence has been corroborated by [54], which shows a magnetotelluric (MT) model and indicates the existence of two grabens in the vicinity of line L295-0002. The Colorado, Xingu SE, Xingu NW, and Caiabis grabens have also been supported by additional studies [5,55]. Conversely, only the Buritis graben remains postulated. We are planning to acquire additional seismic and magnetotelluric data to provide a complete interpretation of that feature.
Finally, the tectonic evolution of the Parecis Basin can be summarized in four phases (Figure 12):
I. Rift Phase (1000 to 700 Ma): Following the Breakup of Rodinia, the syn-rift phase initiated the formation of normal faults on the Amazon Craton, marking the onset of deposition for the Cuiabá Group. II. Drift Phase (700 to 650 Ma): The Salto Magessi Formation and the Jangada Group were formed after the opening of the Goias Ocean. III. Foreland I (650 to 570 Ma): The formation of the foreland basin south of the Amazon Craton occurred during the Brasiliano Orogeny as part of the Gondwana Amalgamation process. This event initiated continental sedimentation and facilitated the deposition of the Alto Paraguai Group. IV. Foreland II (570 Ma to recent): During the Mesozoic era, retro-arc foreland basins associated with the Andine Orogenies developed. Deposits such as the Furnas and Ponta Grossa formations may have been laid down during this period. Additionally, sedimentation continued with the opening of the South Atlantic Ocean.

4.5. Perspectives on the Existence of Hydrogen in the Parecis Basin

The onset of climate change necessitates the exploration of new energy sources and alternatives with minimal carbon emissions. Hydrogen is emerging as a crucial energy source for decarbonization and plays a central role in the energy transition. Its applications span various sectors, including steelmaking, chemicals, glass, and electronics, and it provides a substitute for fossil fuels [56]. Hydrogen gas combustion produces only heat and pure water, and when combined with oxygen, this fuel yields electricity through the hydrogen fuel cell.
Most hydrogen is produced using fossil fuels, emitting 900 million tons of CO 2 annually [57]. Green hydrogen, produced from renewable sources, is a favorable option but comes at a higher cost than gray hydrogen. Natural hydrogen is expected to be cheaper and more environmentally friendly than manufactured hydrogen [58].
The primary hydrogen sources of these locations comprise the alteration of Fe(II)-containing rocks, the radiolysis of water, magma degassing, reaction of water, and surface free radicals during mechanical fracturing of silica-rich rocks [59]. An evaluation of all the proposed mechanisms concerning the origin of natural hydrogen indicates that a deep-seated origin likely explains its natural abundance [60].
Among all cited sources, the serpentinization of ultramafic rocks is considered the main one. Serpentinization designates a hydrothermal reaction stirred when ultramafic minerals such as olivine and pyroxene interact with water, typically under elevated pressure and temperature conditions prevalent in deep geological settings like ophiolitic context, mid-ocean ridges, transform faults, and subduction zones. Furthermore, some studies document instances of hydrogen enrichment within ophiolitic contexts, mid-ocean ridges, transform faults, and subduction zones [61]. Consequently, cratonic basements housing Proterozoic or older rocks constitute prime targets for hydrogen enrichment due to their frequent iron-rich rock formations. Instances of hydrogen seepages have already been identified within circular depressions and what are commonly referred to as fairy circles. Fairy circles manifest as natural phenomena characterized by circular areas of sparse vegetation encompassed by a rim of denser vegetation [61].
The hydrogen exploration in Brazil is still embryonic, with no commercial discovery. There are some studies evaluating the hydrogen potential in Parana Basin [62], but most of the studies are concentrated along the Proterozoic São Francisco Basin [61,63,64,65,66].
No previous hydrogen study has been performed in the Parecis Basin. Our results interpreting those high-density bodies as ophiolites, a generating rock for hydrogen, open the gate for future works on that theme. We have examined recent ANP internal seismic process confidential reports and observed dim spot features in the studied area. This seismic signal attenuation usually suggests the presence of natural gas filling in fault zones [67]. Furthermore, the Brazilian Governmental Company of Energetic Research (EPE) reported no hydrocarbon gases (helium) in the geochemical analysis performed at 2 FI 001MT and 2 SM 001 MT wells. The EPE assumed that the Parecis Basin could significantly participate in natural hydrogen production [68]. Incidentally, we noted circular depressions in the studied area, which could be described as a fairy circle. Of course, these assumptions are speculative at this point. Hence, we need further investigations integrating geophysical and geochemical follow-up surveys, which are critical to substantiate the presence of hydrogen within the region. That will be the object of an evaluation project we are beginning in the area.

5. Conclusions

In this paper, we interpreted gravity and seismic data to propose a new detailed structural map for the Parecis Basin. The integrated interpretation workflow consisted of converting the seismic lines for the depth domain and removing the gravimetric effects of Moho from the Bouguer anomaly of the Parecis Basin to enhance shallow sources likely related to basement features. Next, we performed a 2D residual gravity map modeling exercise to correlate the gravity anomalies with the sedimentary section and basement features interpreted in the seismic lines. Finally, we extrapolated the findings in the previous steps to the whole Parecis Basin by interpreting the residual gravity anomalies.
Our approach identified a complex structural framework composed of several horsts and grabens. Compared with previous works, an essential aspect of our interpretation is using a higher-resolution residual gravity anomaly that identified several tectonic features. Six new grabens and a new regional arc were described, and we also identified normal extensional faults as the main fault systems associated with these basement features. Identifying these structures will promote the development of new petroleum system modeling studies in the Parecis Basin.
The correlation of gravity and seismic data also allowed us to interpret geologic units embedded in the basement. Intra-basement ultra-dense sources identified in the 2D modeling exercise were interpreted as ophiolite bodies obducted by the time of the continental collision of the Orosian–Calimian (1.8–1.6 Ga). Ophiolites are known globally as generating rocks for hydrogen production, which makes the Parecis Basin a highly promising area for hydrogen exploration. Follow-up geophysical and geochemical surveys have been planned to investigate that hypothesis.

Author Contributions

Conceptualization, E.M.L.L. and P.T.L.M.; methodology, E.M.L.L., P.T.L.M. and P.V.Z.; validation, E.M.L.L. and M.H.; writing—original draft preparation, P.T.L.M.; writing—review and editing, E.M.L.L., P.T.L.M., P.V.Z. and M.H.; supervision, P.T.L.M. and P.V.Z.; project administration, E.M.L.L. All authors have read and agreed to the published version of the manuscript.

Funding

This research received no external funding.

Informed Consent Statement

Not applicable.

Data Availability Statement

Acquisition reports and the data associated with this research are public and can be accessed at https://reate.cprm.gov.br/arquivos/index.php/s/1OivrPY3VNVSoiv (accessed on 30 July 2024).

Acknowledgments

We are thankful to the management of ANP for support and permission to publish this work.

Conflicts of Interest

Pedro V. Zalán was employed by the company ZAG Consulting. The remaining authors declare that the research was conducted in the absence of any commercial or financial relationships that could be construed as a potential conflict of interest.

Abbreviations

The following abbreviations are used in this manuscript:
PBParecis Basin
ANPBrazilian National Petroleum, Gas, and Biofuels Agency
PSTMpre-stack time migration
UCupward continuation
TecVaamplitude volume technique
SDRseismic datum reference
ToNTop of Neoproterozoic
ToRTop of Rift
JuAJuruena Arc
SFA    Serra Forma Arc
VAVilhena Arc

References

  1. Corrêa, J.; Couto, E. Projeto aluviões diamantíferos de Mato Grosso. Relatório Final, Goiânia, DNPM-CPRM, 2v.(Relatório do Arquivo Técnico da DGM, 1940), 1972. [Google Scholar]
  2. Siqueira, L.D. Bacia dos Parecis. Boletim de Geociências da PETROBRÁS 1989, 3, 3–16. [Google Scholar]
  3. Bahia, R.B.C.; Neto, M.A.M.; Barbosa, M.S.C.; Pedreira, A.J. Análise da evolução tectonossedimentar da Bacia dos Parecis através de métodos potenciais. Braz. J. Geol. 2007, 37, 639–649. [Google Scholar] [CrossRef]
  4. de Souza Cunha, A.; Perosi, F.A.; Braga, L.F.; Adriano, L.B.; Hidalgo-Gato, M.C.; do Couto, V.P.; da Silva, D.S. Airborne gravity gradiometry survey in the southeastern portion of pimenta bueno graben in parecis basin: Integrated 2D forward modeling and its implications in defining a new structural framework. Braz. J. Geophys. 2015, 33, 101–118. [Google Scholar] [CrossRef]
  5. Braga, L.F.; Siqueira, L.P. Three Dimensional Modelling of the Basement Topography Beneath Parecis Basin, Brazil, Constrained by Spectral Estimates of Depth to Magnetic Sources. In Proceedings of the Latin American Petroleum Congress, Port-of-Spain, Trinidad, 23–26 April 1996; Volume 5, p. 8. [Google Scholar]
  6. da Silva Haeser, B.; Zalán, P.V.; Ferreira, M.A.; Petersohn, E. Revisão litoestratigráfica da Bacia dos Parecis e implicações para a exploração de petróleo. In Proceedings of the Rio Oil & Gas Expo and Conference, Rio de Janeiro, Brasil, 15–18 September 2014; pp. 1–10. [Google Scholar]
  7. Vasconcelos, C.; Morales, I.; Trosdtorf, I., Jr.; Santos, S.; Figueiredo, M. Revisao da estratigrafia na secao perfurada pelo poco 2-SM-1-MT (Salto Magessi), Bacia dos Parecis-Alto Xingu, MT. Boletim de Geociências da Petrobras 2014, 22, 171–178. [Google Scholar]
  8. Loureiro, E.M.L.; Menezes, P.T.L.; Zalán, P.V.; Heilbron, M. Tectonic Framework of Parecis Basin: A Seismic-Gravity Integrated Interpretation. In Proceedings of the 15th International Congress of the Brazilian Geophysical Society & EXPOGEF, Rio de Janeiro, Brazil, 31 July–3 August 2017; Brazilian Geophysical Society: Rio de Janeiro, Brazil, 2017; pp. 478–482. [Google Scholar]
  9. Teixeira, J.B.G.; Misi, A.; da Silva, M.d.G. Supercontinent evolution and the Proterozoic metallogeny of South America. Gondwana Res. 2007, 11, 346–361. [Google Scholar] [CrossRef]
  10. Cordani, U.G.; Teixeira, W. Proterozoic accretionary belts in the Amazonian Craton. Geol. Soc. Am. Mem. 2007, 200, 297–320. [Google Scholar]
  11. Geraldes, M.C.; Van Schmus, W.R.; Condie, K.C.; Bell, S.; Teixeira, W.; Babinski, M. Proterozoic geologic evolution of the SW part of the Amazonian Craton in Mato Grosso state, Brazil. Precambrian Res. 2001, 111, 91–128. [Google Scholar] [CrossRef]
  12. Cordani, U.G.; Teixeira, W.; D’Agrella-Filho, M.; Trindade, R. The position of the Amazonian Craton in supercontinents. Gondwana Res. 2009, 15, 396–407. [Google Scholar] [CrossRef]
  13. Casquet, C.; Rapela, C.W.; Pankhurst, R.J.; Baldo, E.G.; Galindo, C.; Fanning, C.; Dahlquist, J.A.; Saavedra, J. A history of Proterozoic terranes in southern South America: From Rodinia to Gondwana. Geosci. Front. 2012, 3, 137–145. [Google Scholar] [CrossRef]
  14. Cordani, U.G.; Brito-Neves, B.B.; D’Agrella-Filho, M.S. From Rodinia to Gondwana: A review of the available evidence from South America. Gondwana Res. 2003, 6, 275–283. [Google Scholar] [CrossRef]
  15. de Brito Neves, B.B. A saga dos descendentes de rodínia na construção de Gondwana. Braz. J. Geol. 2003, 33, 77–88. [Google Scholar]
  16. Alvarenga, C.J.; Trompette, R. Evolução tectônica brasiliana da Faixa Paraguai: A estruturação da região de Cuiabá. Braz. J. Geol. 1993, 23, 18–30. [Google Scholar] [CrossRef]
  17. Hasui, Y. A grande colisão pré-cambriana do sudeste brasileiro e a estruturação regional. Geociências 2010, 29, 141–169. [Google Scholar]
  18. Cordani, U.G.; Pimentel, M.M.; De Araújo, C.E.G.; Basei, M.A.S.; Fuck, R.A.; Girardi, V.A.V. Was there an Ediacaran Clymene ocean in central South America? Am. J. Sci. 2013, 313, 517–539. [Google Scholar] [CrossRef]
  19. Nogueira, A.C.R.; Riccomini, C.; Sial, A.N.; Moura, C.A.V.; Fairchild, T.R. Soft-sediment deformation at the base of the Neoproterozoic Puga cap carbonate (southwestern Amazon craton, Brazil): Confirmation of rapid icehouse to greenhouse transition in snowball Earth. Geology 2003, 31, 613–616. [Google Scholar] [CrossRef]
  20. de Alvarenga, C.J.; Santos, R.V.; Dantas, E.L. C–O–Sr isotopic stratigraphy of cap carbonates overlying Marinoan-age glacial diamictites in the Paraguay Belt, Brazil. Precambrian Res. 2004, 131, 1–21. [Google Scholar] [CrossRef]
  21. D’Agrella-Filho, M.S.; Trindade, R.I.; Siqueira, R.; Ponte-Neto, C.F.; Pacca, I.I. Paleomagnetic constraints on the Rodinia supercontinent: Implications for its Neoproterozoic break-up and the formation of Gondwana. Int. Geol. Rev. 1998, 40, 171–188. [Google Scholar] [CrossRef]
  22. Ramos, R.C.; Koester, E.; Vieira, D.T. Sm–Nd systematics of metaultramafic-mafic rocks from the Arroio Grande Ophiolite (Brazil): Insights on the evolution of the South Adamastor paleo-ocean. Geosci. Front. 2020, 11, 2287–2296. [Google Scholar] [CrossRef]
  23. de Alvarenga, C.J.; Figueiredo, M.F.; Babinski, M.; Pinho, F.E. Glacial diamictites of Serra Azul Formation (Ediacaran, Paraguay belt): Evidence of the Gaskiers glacial event in Brazil. J. S. Am. Earth Sci. 2007, 23, 236–241. [Google Scholar] [CrossRef]
  24. de Souza Gaia, V.d.C.; Nogueira, A.C.R.; Domingos, F.H.G.; Sans-Jofre, P.; Junior, J.C.d.S.B.; De Oliveira, J.G.F.; Sial, A.N. The new occurrence of Marinoan cap carbonate in Brazil: The expansion of snowball Earth events to the southwesternmost Amazon Craton. J. S. Am. Earth Sci. 2017, 76, 446–459. [Google Scholar] [CrossRef]
  25. Júnior, J.B.C.S. Fácies e Estratigrafia da Formação Sepotuba: Registro da última Incursão Marinha na Transição Neoproterozóico-Cambriano da Faixa Paraguai Norte, Mato Grosso. Master’s Thesis, Universidade Federal do Amazonas, Manaus, Brazil, 2006. [Google Scholar]
  26. de Brito Neves, B.B.; Fuck, R.A. Neoproterozoic evolution of the basement of the South-American platform. J. S. Am. Earth Sci. 2013, 47, 72–89. [Google Scholar] [CrossRef]
  27. Rubert, R.R.; Mizusaki, A.M.P.; Martinelli, A.G.; Urban, C. Paleoenvironmental reconstruction and evolution of an Upper Cretaceous lacustrine-fluvial-deltaic sequence in the Parecis Basin, Brazil. J. S. Am. Earth Sci. 2017, 80, 512–528. [Google Scholar] [CrossRef]
  28. Rubert, R.R.; Mizusaki, A.M.P.; Martinelli, A.G. Mesozoic tectonic in the deposition and evolution of Cretaceous sedimentary packages of the Parecis Basin, center-western Brazil. J. S. Am. Earth Sci. 2019, 93, 140–154. [Google Scholar] [CrossRef]
  29. Milani, E.; Assine, M.; Soares, P.; Daemon, R. A seqüência ordovíciosiluriana da Bacia do Paraná. Boletim de Geociências da PETROBRÁS 1995, 9, 301–320. [Google Scholar]
  30. Montes-Lauar, C.R.; Pacca, I.; Melfi, A.J.; Piccirillo, E.; Bellieni, G.; Petrini, R.; Rizzieri, R. The Anari and Tapirapuã Jurassic formations, western Brazil: Paleomagnetism, geochemistry and geochronology. Earth Planet. Sci. Lett. 1994, 128, 357–371. [Google Scholar] [CrossRef]
  31. Quadros, M.; Rizzotto, G. Geologia e Recursos Minerais do Estado de Rondônia. Texto Explicativo do Mapa Geológico e de Recursos Minerais do Estado de Rondônia, Escala 1: 1.000. 000; CPRM: Porto Velho, Brazil, 2007. [Google Scholar]
  32. Almeida, F.d. Evolução tectônica do Craton do Guaporé comparada com a do Escudo Báltico. Braz. J. Geol. 1974, 4, 191–204. [Google Scholar] [CrossRef]
  33. Marzoli, A.; Renne, P.R.; Piccirillo, E.M.; Ernesto, M.; Bellieni, G.; De Min, A. Extensive 200-million-year-old continental flood basalts of the Central Atlantic Magmatic Province. Science 1999, 284, 616–618. [Google Scholar] [CrossRef] [PubMed]
  34. Yilmaz, Ö. Seismic Data Analysis; Society of Exploration Geophysicists: Tulsa, OK, USA, 2001; Volume 1. [Google Scholar]
  35. Adriano, L.B.; Menezes, P.T.L.; Cunha, A.S. Tectonic framework of the barra de são joão graben, campos basin, brazil: Insights from gravity data interpretation. Interpretation 2014, 2, SJ65–SJ74. [Google Scholar] [CrossRef]
  36. Etris, E.L.; Crabtree, N.J.; Dewar, J.; Pickford, S. True depth conversion: More than a pretty picture. CSEG Rec. 2001, 26, 11–22. [Google Scholar]
  37. Hearst, R.B.; Morris, W.A. Regional gravity setting of the Sudbury Structure. Geophysics 2001, 66, 1680–1690. [Google Scholar] [CrossRef]
  38. Adriano, L.B.; Menezes, P.T.L.; Adriano, M.S.; Cunha, A.S.; Cabrera, M.H.; Silva, D.S.; Moura, L.P. Jequitinhonha Basin: Structural aspects, relationship with igneous activity, and hydrocarbon exudations. Interpretation 2018, 6, T51–T60. [Google Scholar] [CrossRef]
  39. Laske, G.; Masters, G.; Ma, Z.; Pasyanos, M. Update on CRUST1. 0—A 1-degree global model of Earth’s crust. In Proceedings of the Geophysical Research Abstracts, EGU General Assembly, Vienna, Austria, 7–12 April 2013; Volume 15, p. 2658. [Google Scholar]
  40. Leão, J.W.D.; Menezes, P.T.L.; Beltrão, J.F.; Silva, J.B.C. Gravity inversion of basement relief constrained by the knowledge of depth at isolated points. Geophysics 1996, 61, 1702–1714. [Google Scholar] [CrossRef]
  41. Curto, J.B.; Vidotti, R.M.; Fuck, R.A.; Blakely, R.J.; Alvarenga, C.J.; Dantas, E.L. The tectonic evolution of the Transbrasiliano Lineament in northern Paraná Basin, Brazil, as inferred from aeromagnetic data. J. Geophys. Res. Solid Earth 2014, 119, 1544–1562. [Google Scholar] [CrossRef]
  42. Paulo de Tarso, L.M.; Travassos, J.M. EM modeling of the central–northern portion of Ponta Grossa Arch, Paraná Basin, Brazil. Phys. Earth Planet. Inter. 2005, 150, 145–158. [Google Scholar]
  43. Lyrio, J.C.S.; Menezes, P.T.L.; Correa, J.L.; Viana, A.R. Multiphysics anomaly map: A new data fusion workflow for geophysical interpretation. Interpretation 2020, 8, B35–B43. [Google Scholar] [CrossRef]
  44. Rocha, N.M.; Coelho, A.C.M.Q.; Menezes, P.T.L. A high-resolution fault assessment workflow for unconventional reservoirs exploration: A case study on the onshore Sergipe-Alagoas Basin, Brazil. J. S. Am. Earth Sci. 2022, 113, 103641. [Google Scholar] [CrossRef]
  45. Talwani, M.; Worzel, J.L.; Landisman, M. Rapid gravity computations for two-dimensional bodies with application to the Mendocino submarine fracture zone. J. Geophys. Res. 1959, 64, 49–59. [Google Scholar] [CrossRef]
  46. Hinze, W.J. Bouguer reduction density, why 2.67? Geophysics 2003, 68, 1559–1560. [Google Scholar] [CrossRef]
  47. Bulhões, É.M.; de Amorim, W.N. Princípio da sismocamada elementar e sua aplicação à técnica volume de amplitudes (tecva). In Proceedings of the 9th International Congress of the Brazilian Geophysical Society, Salvador, Brazil, 11–14 September 2005. [Google Scholar]
  48. Coelho, A.C.Q.M.; Menezes, P.T.L.; Mane, M.A. Gravity data as a faulting assessment tool for unconventional reservoirs regional exploration: The Sergipe–Alagoas Basin example. J. Nat. Gas Sci. Eng. 2021, 94, 104077. [Google Scholar] [CrossRef]
  49. Kusky, T.; Li, J.; Santosh, M. The Paleoproterozoic north Hebei orogen: North China Craton’s collisional suture with the Columbia supercontinent. Gondwana Res. 2007, 12, 4–28. [Google Scholar] [CrossRef]
  50. Fuck, R.A.; Neves, B.B.B.; Schobbenhaus, C. Rodinia descendants in south America. Precambrian Res. 2008, 160, 108–126. [Google Scholar] [CrossRef]
  51. Pimentel, M.M.; Fuck, R.A.; de Alvarenga, C.J. Post-Brasiliano (Pan-African) high-K granitic magmatism in Central Brazil: The role of Late Precambrian-early Palaeozoic extension. Precambrian Res. 1996, 80, 217–238. [Google Scholar] [CrossRef]
  52. Pimentel, M.M.; Fuck, R.A.; Gioia, S.M.C.L. The Neoproterozoic Goiás magmatic arc, central Brazil: A review and new Sm-Nd isotopic data. Rev. Bras. GeociÊNcias 2000, 30, 35–39. [Google Scholar] [CrossRef]
  53. Laux, J.H.; Pimentel, M.M.; Dantas, E.L.; Armstrong, R.; Junges, S.L. Two neoproterozoic crustal accretion events in the Brasília belt, central Brazil. J. S. Am. Earth Sci. 2005, 18, 183–198. [Google Scholar] [CrossRef]
  54. Fontes, S.; Meju, M.; Maurya, V.; La Terra, E.; Miquelutti, L. Deep structure of Parecis Basin, Brazil from 3D magnetotelluric imaging. J. S. Am. Earth Sci. 2019, 96, 102381. [Google Scholar] [CrossRef]
  55. Flexor, J.M.; Braga, L.F.; Fontes, S.L.; La Terra, E.F.; Germano, C.R. Estudo geofísico integrado da Bacia dos Parecis: Contribuição do método magnetotelúrico. In Proceedings of the 8th International Congress of the Brazilian Geophysical Society, Rio de Janeiro, Brazil, 14–18 September 2003. [Google Scholar]
  56. Osman, A.I.; Mehta, N.; Elgarahy, A.M.; Hefny, M.; Al-Hinai, A.; Al-Muhtaseb, A.H.; Rooney, D.W. Hydrogen production, storage, utilisation and environmental impacts: A review. Environ. Chem. Lett. 2022, 20, 1–36. [Google Scholar] [CrossRef]
  57. Zhou, H.; Dai, J.; Chen, X.; Hu, B.; Wei, H.; Cai, H.H. Understanding innovation of new energy industry: Observing development trend and evolution of hydrogen fuel cell based on patent mining. Int. J. Hydrog. Energy 2024, 52, 548–560. [Google Scholar] [CrossRef]
  58. Prinzhofer, A.; Tahara Cissé, C.S.; Diallo, A.B. Discovery of a large accumulation of natural hydrogen in Bourakebougou (Mali). Int. J. Hydrog. Energy 2018, 43, 19315–19326. [Google Scholar] [CrossRef]
  59. Wang, L.; Jin, Z.; Chen, X.; Su, Y.; Huang, X. The Origin and Occurrence of Natural Hydrogen. Energies 2023, 16, 2400. [Google Scholar] [CrossRef]
  60. Zgonnik, V. The occurrence and geoscience of natural hydrogen: A comprehensive review. Earth-Sci. Rev. 2020, 203, 103140. [Google Scholar] [CrossRef]
  61. Prinzhofer, A.; Moretti, I.; Françolin, J.; Pacheco, C.; d’Agostino, A.; Werly, J.; Rupin, F. Natural hydrogen continuous emission from sedimentary basins: The example of a Brazilian H2-emitting structure. Int. J. Hydrog. Energy 2019, 44, 5676–5685. [Google Scholar] [CrossRef]
  62. Serratt, H.; Cupertino, J.A.; Cruz, M.F.; Girelli, T.J.; Lehn, I.; Teixeira, C.D.; Oliveira, H.O.S.; Chemale, F., Jr. Southern Brazil hydrogen systems review. Int. J. Hydrog. Energy 2024, 69, 347–357. [Google Scholar] [CrossRef]
  63. Cathles, L.; Prinzhofer, A. What Pulsating H2 Emissions Suggest about the H2 Resource in the Sao Francisco Basin of Brazil. Geosciences 2020, 10, 149. [Google Scholar] [CrossRef]
  64. Donzé, F.V.; Truche, L.; Shekari Namin, P.; Lefeuvre, N.; Bazarkina, E.F. Migration of Natural Hydrogen from Deep-Seated Sources in the São Francisco Basin, Brazil. Geosciences 2020, 10, 346. [Google Scholar] [CrossRef]
  65. Myagkiy, A.; Brunet, F.; Popov, C.; Krüger, R.; Guimarães, H.; Sousa, R.S.; Charlet, L.; Moretti, I. H2 dynamics in the soil of a H2-emitting zone (São Francisco Basin, Brazil): Microbial uptake quantification and reactive transport modelling. Appl. Geochem. 2020, 112, 104474. [Google Scholar] [CrossRef]
  66. Geymond, U.; Ramanaidou, E.; Lévy, D.; Ouaya, A.; Moretti, I. Can Weathering of Banded Iron Formations Generate Natural Hydrogen? Evidence from Australia, Brazil and South Africa. Minerals 2022, 12, 163. [Google Scholar] [CrossRef]
  67. Brown, A.R. GC Dim Spots in Seismic Images as Hydrocarbon Indicators. Search Discov. V 1, 1-3 2010. [Google Scholar]
  68. EPE. Relatório Subcomitê Potencial de Petróleo e Gás Onshore; Arquivos Publications: Sao Paolo, Brasil, 2022.
Figure 1. Location map of the Parecis Basin with the previous structural map, adapted from [2,3,5] superimposed. The figure also displays enclosing sedimentary basins.
Minerals 14 00783 g001
Figure 2. Stratigraphic chart of the Parecis Basin (PB), modified from [6].
Minerals 14 00783 g002
Figure 3. Gravity datasets used in this study. Land datasets are the BNDG (acquisition along roads) and the 0295_GRAV_ANP_2D_Parecis (acquisition along the seismic lines). Airborne datasets are the app311 and app312.
Minerals 14 00783 g003
Figure 4. Bouguer anomaly map of the Parecis Basin with the previous structural map [6] superimposed.
Minerals 14 00783 g004
Figure 5. Velocity model used in the T-D conversion. SDR corresponds to the seismic depth reference surface, ToN and ToR are, respectively, the Top of the Neoproterozoic and the Top of Rift steering horizons. Layer 1 corresponds to Mesozoic and Paleozoic sediments, Layer 2 is associated with late Neoproterozoic sediments, and Layer 3 is associated with early Neoproterozoic sediments and basement rocks.
Minerals 14 00783 g005
Figure 6. Upward continuation of the gravity field at several levels: 20, 90, 110, 120, 130, 140, 150, and 180 km. The Transbrasiliano lineament is a shallow upper crustal feature superimposed to the gravity anomalies.
Minerals 14 00783 g006
Figure 7. Map of the residual gravity anomaly of the Parecis Basin. Compare with the original Bouguer gravity anomaly of Figure 4.
Minerals 14 00783 g007
Figure 8. The 2D forward modeling of the seismic line L295−0001. Upper panel: comparison between the observed residual gravity anomaly and calculated data. Middle panel: 2D model with the density properties of each layer superimposed to the TecVA attribute and interpreted faults. Lower panel: non-interpreted TecVA attribute.
Minerals 14 00783 g008
Figure 9. The 2D forward modeling of the seismic line L295-0002. Upper panel: comparison between the observed residual gravity anomaly and calculated data. Middle panel: 2D model with the density properties of each layer superimposed to the TecVA attribute and interpreted faults. Lower panel: non-interpreted TecVA attribute.
Minerals 14 00783 g009
Figure 10. The new structural map of the Parecis Basin superimposed on the residual gravity anomaly. Several new tectonic features are described in this map.
Minerals 14 00783 g010
Figure 11. Block diagram depicting three distinct grabens identified and inferred from Bouguer residual anomalies and seismic imaging.
Minerals 14 00783 g011
Figure 12. Four schematic geological with sections illustrating different Parecis Basin tectonic phases across its geological history.
Minerals 14 00783 g012
Disclaimer/Publisher’s Note: The statements, opinions and data contained in all publications are solely those of the individual author(s) and contributor(s) and not of MDPI and/or the editor(s). MDPI and/or the editor(s) disclaim responsibility for any injury to people or property resulting from any ideas, methods, instructions or products referred to in the content.

