Abstract
In order to accurately simulate the actual road driving resistance of four-wheel drive motor vehicles based on the chassis dynamometer and efficiently test the vehicle performance, it is necessary to analyze the influencing factors of the additional loss resistance and the loading resistance of the chassis dynamometer bench system. In this paper, the effects of the drum speed, the sampling speed interval, and basic inertia on the test results of the additional loss resistance are tested and analyzed based on the self-developed chassis dynamometer of a four-wheel drive motor vehicle. The static and dynamic components of the additional loss resistance are defined by linear regression through ordinary least squares, and the additional loss resistance of the four-axis eight-drum chassis dynamometer and mainstream chassis dynamometer system for four-wheel drive motor vehicles are compared. In addition, the effects of the dynamometer type and the control strategy on the loading resistance are discussed, and the transient condition, steady-state condition, and overall operating condition deviation coefficient of loading force are defined, according to which the advantages and disadvantages of the control strategy of the chassis dynamometer system for four-wheel drive motor vehicles are evaluated. The analysis of the influencing factors and laws of the resistance of the four-wheel drive motor vehicle chassis dynamometer bench system can provide a reference basis for accurately simulating the resistance of vehicle road driving based on the bench testing.
1. Introduction
As stipulated in the Transportation Industry Standards of the People’s Republic of China, JT/T 445-2021, “Automobile Chassis Dynamometer” [1], a motor vehicle chassis dynamometer is an indoor bench tester used to simulate actual road driving and detect and test the nominal power of the driving wheels, emission pollutants, fuel consumption, and other performance parameters of a car. According to the current National Standard of the People’s Republic of China, GB 18285-2018, “Limits and Measurement Methods for Emissions from Gasoline Vehicles Under Two-speed Idle Conditions and Simple Driving Mode Conditions” [2], the chassis dynamometer used in the motor vehicle periodic emissions inspection is a double-drum type for testing two-wheel drive motor vehicles, which features a front and rear drum synchronization accuracy of ±0.5 km/h and a test speed of ≥60 km/h, etc. However, it cannot effectively detect emissions by the simple transient conditions method (gasoline vehicles) [2] or the loaded deceleration method (diesel vehicles) [3] because of the vehicle’s inability to manually switch from a full-time four-wheel and timely four-wheel drive motor vehicle into a two-wheel drive mode; the anti-skid control cannot be removed, and it can only be carried out online without a load (i.e., gasoline vehicles in a two-speed idle and diesel cars in free acceleration) [4]. But this type of detection method cannot truly and reliably reflect emissions, dynamics, and other types of vehicle performance on the actual road. It must be based on the chassis dynamometer to simulate the real vehicle road driving resistance during the test to obtain effective characterization [5]. However, based on the use of the chassis dynamometer in vehicle performance testing [6,7], the dynamic system resistance exists in real time during the vehicle testing process, and its consumption of the vehicle’s power affects the vehicle performance testing results. Therefore, it is essential to analyze the factors of the resistance of the four-wheel drive motor vehicle chassis dynamometer bench system.
In recent years, some researchers have conducted relevant studies on the chassis dynamometer and its own resistance. As the only part connecting the vehicle with the ground, the contact deformation between the tire and the ground is an important factor affecting the driving resistance and the passing performance of the vehicle. In order to analyze the difference between the rolling resistance of the bench test and the road test, Wang Jianqiang et al. [8] established a correlation model of the rolling resistance of the bench test and the road test. The test shows that the difference between the rolling resistance of the tire in the bench test and the road test is 4.2%. Czaban [9] presented the concept of a device enabling the performance of dynamic drive tests on the roller dynamometer. The system developed is capable of conducting the performance of standardized tests as well as individual speed tests. In order to investigate the feasibility of using the chassis dynamometer method for a road test, Yang Cong et al. [10] compared the emissions inspection results of the road method and the chassis dynamometer method by taking a heavy-duty vehicle as the object. The analysis of emission result deviations indicated that the chassis dynamometer method had a certain feasibility on the condition of the half-loading of the vehicle, but the feasibility was poor due to large deviations under full-load conditions. Li Binghuan [11] analyzed and compared the forces of a car driving on a real road and on a chassis dynamometer and proposed a set of chassis dynamometer resistance simulation methods. Li Qiang et al. [12] developed a mathematical model for the electrical simulation of the resistance of the chassis dynamometer loading device. Zhang Shanghao et al. [13,14] used the coasting method to collect data of the internal resistance of the bench with the coasting speed of the drum with an alternating current (AC) chassis dynamometer, established a mathematical model of the target loading force of the AC chassis dynamometer, and constructed an AC chassis dynamometer system based on the virtual prototype by combining the technology of three-dimensional modeling, virtual prototypes, and control system simulation. After analyzing and comparing the difference between the resistance received by the vehicle running on the road and the resistance received by the vehicle running on the chassis dynamometer, Zheng Xiaoxiang [15] put forward the research scheme of rolling resistance loading technology based on the dynamic change of the drive shaft load in order to correct this deviation. According to the experiment results, the optimized resistance loading scheme can reduce the simulation deviation of road resistance dramatically under acceleration and deceleration sliding conditions. Gong Zhiyuan et al. [16] obtained a parasitic friction resistance value at each measuring speed point using the no-load sliding method in order to calculate the parasitic friction resistance of a single-drum chassis dynamometer. The results show that the calculation model of dynamometer parasitic resistance obtained by this method meets the experiment requirements and is highly accurate. Wen Yi et al. [17] carried out multiple internal resistance measurements on the chassis dynamometer using the constant velocity resistance method in time segments. The analysis showed that the value of the internal resistance of the bench became larger with the increase of the use time, and the change of the internal resistance was different in different speed regions and time segments. Lourenco et al. [18] proposed a chassis dynamometer that takes into consideration the tire–bench contact and a vehicle model describing vehicle longitudinal dynamics. Considering tire interaction force, rolling resistance, and system losses for this model, the sliding simulation experiments were carried out in Matlab/Simulink (R2019a) at speeds of 60 km/h and 100 km/h. The results show that the average error of total motion resistance analysis is 6.71%. To address the issue of a relatively small display value of the dynamometer due to endogenous friction resistance loss during the operation of the drum chassis dynamometer, Ouyang Aiguo et al. [19] obtained relevant test data through secondary loading sliding and no-load sliding experiments, according to the law of energy conservation, and established the mathematical model of endogenous friction resistance during the operation of a single-roller chassis dynamometer without a vehicle. As shown by the results, the endogenous friction resistance of the chassis dynamometer can be obtained by the secondary loading force value and the sliding distance under secondary loading and no load. The endogenous friction resistance increases with the increase of speed, and the friction resistance produced by air at normal speed is far less than its mechanical resistance.
However, all of the above studies were conducted on the additional loss resistance of two-wheel drive motor vehicle chassis dynamometers, and they did not investigate the resistance of the four-wheel drive motor vehicle chassis dynamometer bench system. Moreover, the two-wheel drive motor vehicle is different in terms of the force area between the drive wheels and the drums, the magnitude and direction of the force, and the value of the loaded resistance required for the entire vehicle when the four-wheel drive motor vehicle is on the bench. At the same time, the recent national standard “Code of Practice for New Energy Vehicles Operation Safety Inspection” [20], under review on the chassis dynamometer type, established a clear requirement, namely, if a small, micro passenger car-testing chassis dynamometer is used in the form of a four-axis eight-drum combination of the front and rear axle spacing that can be adjusted, the range of adjustment should not be less than 1 m, the speed of each axis should be synchronized, and the synchronization error should not be greater than 2 km/h. It can be predicted that the chassis dynamometer of four-axis and eight-drums for four-wheel drive motor vehicles will have a broad application prospect in the future periodic inspection of motor vehicles.
At present, the most widely used chassis dynamometer brands on the market are HORIBA in Japan and MAHA in Germany. MAHA’s MSR 500/2 CAR 4WD is a four-wheel drive single roller dynamometer for cars with an axle load of up to 2.4 t, and it includes an eddy-current brake and an electric motor per roller set ideally suited for performance measurements, tuning, and diagnostic work in very powerful vehicles.
For this paper, a set of four-axis eight-drum chassis dynamometers for four-wheel drive motor vehicles was independently developed. It has good stability and high safety, and the electromechanical dual-inertia coupling technology is used to simulate the translational inertia of the car body, which reduces the time delay and improves the detection accuracy. Therefore, the influences of the drum speed, the sampling speed interval, and the basic inertia on the additional loss of resistance were tested and analyzed based on this dynamometer. In addition, the influence of the dynamometer and the loading control strategy on the braking resistance was measured. This research provides a reference basis for simulating the actual road driving resistance of four-wheel drive motor vehicles based on the chassis dynamometer, effectuating the performance effective detection of the vehicles’ inability to manually switch the two-wheel drive mode of full-time four-wheel, timely four-wheel drive motor vehicles and anti-skid control.
2. A Resistance Analysis of the Bench System of a Four-Wheel Drive Motor Vehicle Chassis Dynamometer
It must be ensured that the chassis dynamometer can simulate four-wheel drive motor vehicles on actual road operating conditions in line with the safety performance, power performance, emission performance, and other non-disassembly testing for four-wheel drive motor vehicles. During the testing, the tested vehicle must overcome the drive train resistance from the vehicle itself, the inertial resistance of the rotating parts converted to the driving wheels, the mechanical resistance generated by the friction between the wheels and the drums, and also the resistance of the chassis dynamometer’s bench system [19,21,22], which is calculated by the following equation:
where Fr is the loading resistance of the dynamometer, Fm is the mechanical resistance inside the dynamometer caused by the presence of friction, Fw is the wind resistance of the dynamometer cooling fan operation, and Fq is the inertial resistance of the dynamometer’s rotating parts (basic inertia) under transient working conditions. The internal additional loss resistance of the dynamometer (including bearing friction loss, etc.) can be expressed as the resistance of the chassis dynamometer’s bench system for four-wheel drive motor vehicles minus the loading resistance of the dynamometer, that is,
The additional loss resistance at speed V is
where DIW is the equivalent inertia of the rotating parts of the dynamometer (kg), V+∆V is the vehicle speed V+∆V (m/s), V−∆V is the vehicle speed V−∆V (m/s), and ACDT is the actual time required for the dynamometer to coast from V+∆V to V−∆V (s).
From Equation (3), it can be seen that the drum speed and basic inertia are the main factors affecting the additional loss resistance of the chassis dynamometer bench, and the loading resistance of the chassis dynamometer power-absorbing device will also act on the wheels. Therefore, it is of great significance to analyze the influencing factors and laws of the resistance of the chassis dynamometer bench system for four-wheel drive motor vehicles to accurately reproduce the vehicles’ actual road driving resistance and effectively test the vehicles’ performance.
3. Experimental Scheme
3.1. Experimental Design
The four-wheel drive motor vehicle chassis dynamometer used in this test is shown in Figure 1; the front and rear drum groups can be linked, and the main and assistant drum power transfers through the chain. The front and rear drum groups realize the synchronous rotation of each shaft through the suction of the roller clutch and retractable transmission shaft so as to output the load torque of the power absorbing device of the chassis dynamometer to each drum group. The spacing between the front and rear drum groups can be adjusted to detect vehicles with a different wheelbase. The center distance of the main and assistant drums is adjustable, and the different drum center distance can form different placement angles in the vehicle inspection process, which are used to simulate the change of the road surface adhesion coefficient. The real vehicle test is shown in Figure 2.
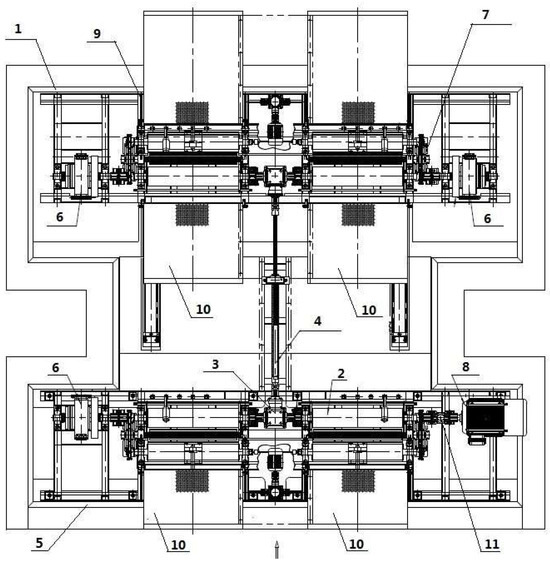
Figure 1.
Schematic diagram of a four-wheel drive motor vehicle chassis dynamometer: 1. front drum set frame, 2. drum set, 3. T-type reducer, 4. retractable drive shaft, 5. rear drum set frame, 6. mechanical flywheel, 7. main and assistant drum synchronizing chain, 8. AC dynamometer or eddy-current dynamometer, 9. moving guide, 10. axle weighing instrument, 11. HBM speed and torque transducer.
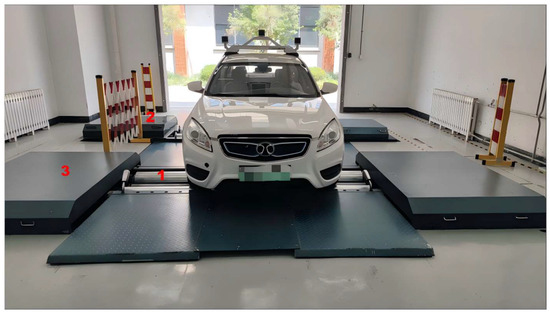
Figure 2.
Real vehicle testing based on the four-wheel drive motor vehicle chassis dynamometer: 1. front drum set, 2. AC dynamometer or eddy-current dynamometer, 3. mechanical flywheel.
As shown in Equation (3), the basic inertia of the dynamometer is an important parameter when the chassis dynamometer is used for the determination of the bench system resistance, and its size directly affects the internal additional loss resistance of the dynamometer. In order to more accurately obtain the bench system resistance, the basic inertia of the bench was first determined before measuring the additional loss resistance inside the dynamometer in the no-load skidding and then the determination of the additional loss resistance was carried out. As can be seen from Equation (1), the accuracy of the dynamometer loading resistance directly affects the table system resistance. Finally, the loading resistance of the dynamometer was tested and analyzed. The main equipment used in the experiment is shown in Table 1.

Table 1.
Major test equipment.
3.2. Measurement of the Basic Inertia of the Bench
The basic inertia test was performed by the method of two loading tests. Firstly, using the AC power dynamometer counter drag, the drum speed of the four-wheel drive motor vehicle chassis dynamometer was raised to 65 km/h, and the loading constant force was set to 550 N for the coasting test from 48 to 16 km/h while recording the speed, time, and measured loading force. The above procedure was repeated three times. Once again, all the steps above in the first process were repeated, but the loading constant force was changed to 1200 N [22]. In the next two loading tests, the loading constant forces were sequentially changed to 550 N and 950 N, 550 N and 750 N, and 350 N and 550 N. Finally, the basic inertia tests were completed.
3.3. The Measurement of the Additional Loss Resistance
Firstly, the dynamometer was preheated for 5 min, and the drum speed of the four-wheel drive motor vehicle chassis dynamometer was driven at 65 km/h using the AC power dynamometer’s reverse drag. Subsequently, the driving output of the AC power dynamometer was stopped, and the front and rear drum groups, relying on their own inertia, gradually decelerated and glided until the drum stopped running. The sampling period of the gliding speed was 10 ms, and the additional loss resistance was calculated according to Equation (3). The measurement process was repeated three times. In this state, the drum is only gliding because of the action of the internal additional loss of resistance of the chassis dynamometer, and the external forces would not have any effect on the gliding process.
3.4. The Measurement of the Dynamometer Loading Resistance
Through the AC power dynamometer reverse drag, the drum speed of the four-wheel drive motor vehicle chassis dynamometer was driven to 65 km/h. At this point, the load applied by the AC power dynamometer was zero; subsequently, the driving force was cut off, and the four-wheel drive motor vehicle chassis dynamometer was gliding freely. When the speed decelerated to 40 km/h, the step constant forces of 350 N, 550 N, 750 N, 950 N, and 1200 N were applied to the chassis dynamometer power absorbing device. The actual output torque signal of the HBM speed torque sensor was recorded, and the response time of the chassis dynamometer system of the four-wheel drive motor vehicle was analyzed. The sensitivity and accuracy of the loading resistance of the same dynamometer in different control strategies was compared and analyzed in accordance with the test running cycle of GB 18285-2018’s simple transient condition method.
4. An Analysis of the Influencing Factors of the Additional Loss Resistance Testing Results
Referring to GB 18285-2018, “Pollutant Emission Limits and Measurement Methods for Gasoline Vehicles (Double Idling Method and Simple Condition Method)”, the additional loss power test speed of the dynamometer should be conducted in the range of 10–60 km/h, and the relationship curve between the speed and the additional loss resistance is obtained, which is then used for correcting the load applied by the power absorbing device of the chassis dynamometer. The additional loss resistance test is an important technical indicator, and its correctness will directly affect the performance approval inspection and emission detection loading of the chassis dynamometer. Therefore, analyzing the influencing factors of the additional loss resistance test is of great significance. The analysis of the influencing factors of the additional loss resistance is shown in Figure 3. The experimental site is located in Building G, Engineering Research Center, Shandong Jiaotong University.
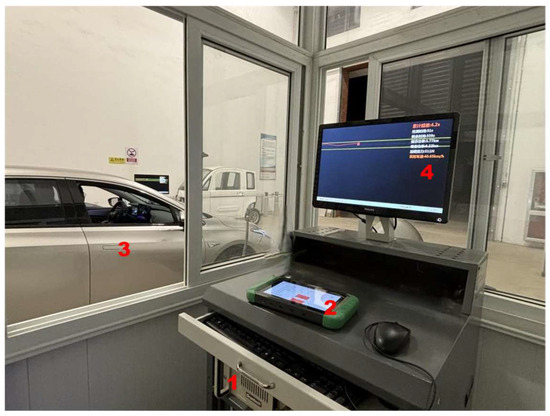
Figure 3.
The analysis of the influencing factors of the additional loss resistance: 1. industrial personal computer, 2. decoder (It supports in-depth detection of battery packs including fault information and data streams reading to quickly determine battery pack failures for new energy vehicles.), 3. testing vehicle, 4. display screen.
4.1. The Influence of Drum Speed on the Additional Loss Resistance Testing Results
In the additional loss resistance of the four-wheel drive motor vehicle chassis dynamometer testing, the mechanical flywheel suction was controlled by the electromagnetic clutch, and all the rotating parts of the chassis dynamometer were rotating, the method of idle deceleration gliding from 65 km/h was adopted, and the additional loss resistance was calculated according to Equation (3), with the basic inertia of the bench taken to be 1681 kg. The relationship between the additional loss resistance of the four-wheel drive motor vehicle chassis dynamometer system and the drum speed is shown in Figure 4.
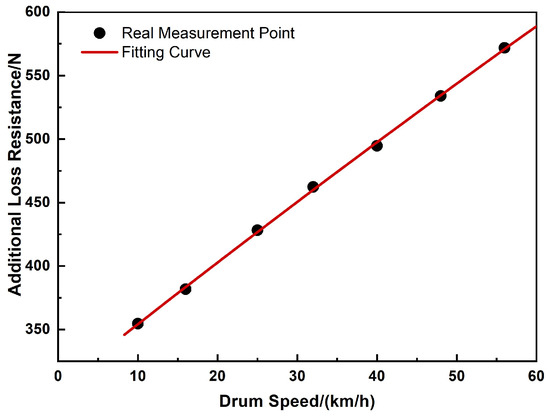
Figure 4.
The additional loss resistance of the bench system at different drum speeds.
As can be seen from Figure 4, the additional loss resistance of the bench system is a variable quantity related to the drum speed rather than a constant value, and it increases with the drum speed. This is because, with the increase in the angular velocity of the drum, the friction between the various components of the bench continues to intensify, causing relative sliding between the fluid lubrication layer molecules on the contact surface of various rotating systems (synchronous chains, roller bearings, and other mechanisms), resulting in viscous friction, which has a linear relationship with the flow velocity in laminar flows and the relative sliding contact area (that is, the mechanical resistance Fm = aua + b). When the chassis dynamometer was running, the friction between each rotor system and the surrounding air, as well as the operation of the dynamometer cooling fan (that is, the air resistance Fy = kua2), led to a consequent rise in the additional loss resistance of the bench system with the increase in drum speed.
The relationship between the additional loss resistance of the bench system and the drum speed was based on the measured idle deceleration gliding data, as shown in Equation (4), which was calculated to obtain the additional loss resistance at each speed point. Furthermore, it can be loaded through the power absorbing device after deducting the additional loss resistance from the total load in the vehicle performance test as follows:
where ua is the drum speed (km/h).
The coefficient of ua2 in Equation (4) is much smaller than ua and the constant term, indicating that the air resistance of the four-wheel drive motor vehicle chassis dynamometer bench system had less influence on the additional loss resistance relative to its mechanical resistance. The coefficient of ua is much smaller than the constant term, indicating that the four-wheel drive motor vehicle chassis dynamometer had a larger inherent mechanical resistance.
4.2. The Effect of Sampling Velocity Intervals on Additional Loss Resistance Testing Results
The additional loss resistance of the four-wheel drive motor vehicle chassis dynamometer was tested using a split velocity interval measurement method with velocity intervals V+12~V−12, V+10~V−10, V+8~V−8, V+6~V−6, V+4~V−4, and V+2~V−2. The relationship curves between the sampling speed interval and the resistance of the bench system are shown in Figure 5. The regression equations and fitted figures are shown in Table 2 and Figure 6.
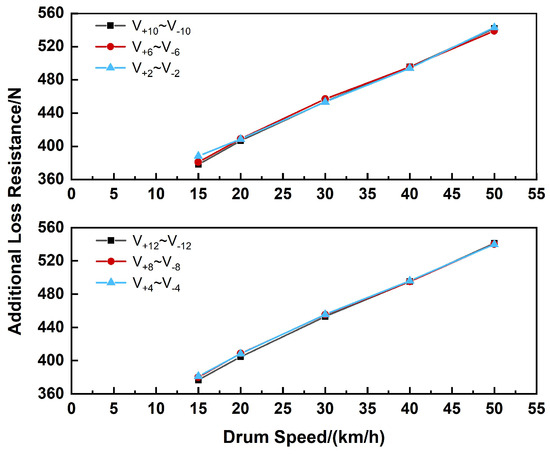
Figure 5.
Additional loss resistance of the bench system at different sampling speed intervals.
Table 2.
The regression equations and coefficients of determination.
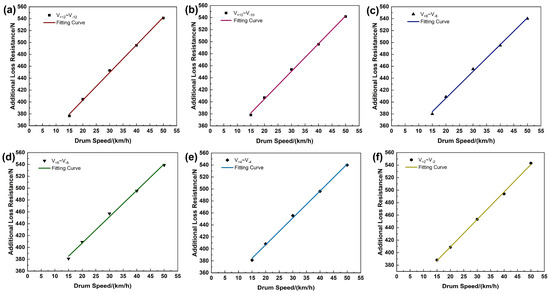
Figure 6.
Fitting curves of additional loss resistance of the bench system at different sampling speed intervals: (a) The speed interval is V+12~V−12. (b) The speed interval is V+10~V−10. (c) The speed interval is V+8~V−8. (d) The speed interval is V+6~V−6. (e) The speed interval is V+4~V−4. (f) The speed interval is V+2~V−2.
It can be seen in Figure 5 that the test results of the additional loss resistance of the bench system under different sampling speed intervals at speeds of 15, 20, 30, 40, and 50 km/h had a slight error, with a maximum error of 3.08% at a speed of 15 km/h, and 1.09%, 0.89%, 0.40%, and 0.77% at speeds of 20 km/h, 30 km/h, 40 km/h, and 50 km/h, respectively. The maximum error exists at a speed of 15 km/h, which is due to the different sampling speed intervals corresponding to the different speed intervals calculated by the additional loss resistance, which are 27–3 km/h, 25–5 km/h, 23–7 km/h, 21–9 km/h, 19–11 km/h, and 17–13 km/h. As shown in Equation (4), the additional loss resistance of the bench system decreases with the descent of the drum speed, but it does not occur linearly, especially at lower speeds, which leads to an increase in the additional loss resistance at 15 km/h, with the increase in speed corresponding to the calculated speed intervals, accompanied by an error of 3.08% in the speed intervals of V+2~V−2, with respect to that in V+12~V−12. In addition, a number of mutually coupled rotating systems, such as the flywheel, main and auxiliary drums, and drive shafts between the front and rear drum sets in the four-wheel drive motor vehicle chassis dynamometer bench system vibrated significantly when the drums rotated at high speed, resulting in fluctuations in the drum speed detection values and affecting the accuracy of the timing of the corresponding speed intervals for different sampling speed intervals. The smaller the speed intervals, the shorter the timing intervals, and the larger the impact, which ultimately affects the testing accuracy of the additional loss resistance.
4.3. The Effect of Basic Inertia on the Additional Loss Resistance Testing Results
The correctness of the basic inertia DIW directly affects the correctness of the test of the additional loss resistance of the chassis dynamometer system when calculating the additional loss resistance within the dynamometer, according to Equation (3). Therefore, it is necessary to investigate the influence of the loading force on the basic inertia test results to further analyze the impact on the additional loss resistance test results.
The loading test was performed twice in the test of basic inertia. The basic inertia of the test bench loading force value under (f1–f2) was calculated by Equation (5):
where and are the average of three times of the first and second actual loading force, and and are the glide times of three times of the first and second actual loading.
The loaded force values f1 and f2 are 0/1200 N, 550/1200 N, 550/950 N, 550/750 N, and 400/550 N. The additional loss resistance measured in the speed interval of V+10~V−10 is shown in Figure 6. The basic inertia of the bench system was measured three times, as shown in Figure 7.
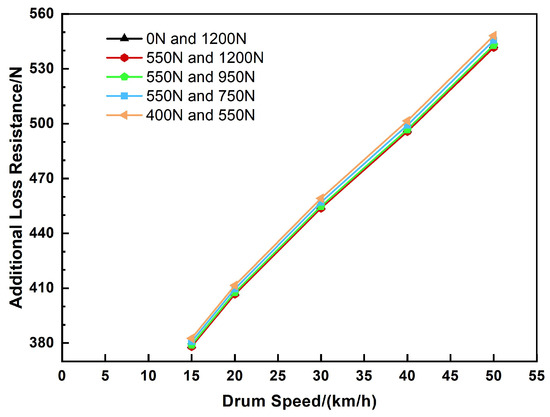
Figure 7.
The additional loss resistance of the bench system for different loading force values.
It can be seen from Figure 7 that the additional loss resistance increases with the drum speed, and it will vary among the loading force values at the same drum speed. The maximum error occurs when the force values are 400 N and 550 N. As shown in Figure 8 and Equation (3), the error was caused by the difference in the basic inertia. They are 1684 kg, 1681 kg, and 1685 kg when the loading force values are 0 and 1200 N, 550 and 1200 N, and 550 and 950 N, respectively, with a small difference. As the loading force interval becomes small, the denominator in Equation (5) becomes significantly smaller. The accuracy of the loading force and the speed fluctuation caused by the drum vibration affects the accuracy of the timing, resulting in a large basic inertia test error, and the basic inertia error becomes larger as the interval of the loading force becomes smaller. However, relative to the minimum basic inertia of 550 N and 1200 N, the maximum error is 1.18%, suggesting that the basic inertia caused by the size of the loading force has a relatively small effect on the results of the test of the additional loss resistance, which can be ignored. The basic inertia is an inherent property of the bench body, and it takes a constant value in the calculation of the additional loss resistance.
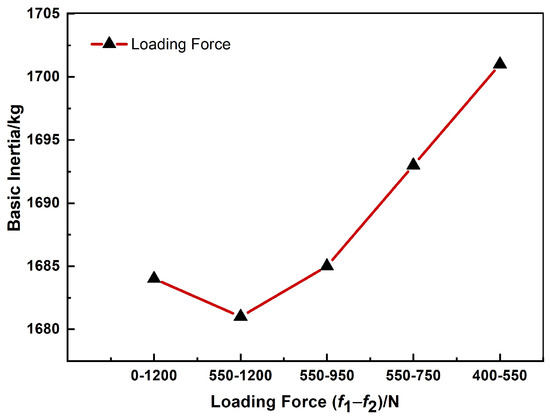
Figure 8.
Basic inertia for different loading force values.
4.4. Experimental Control
According to the technical standard in JT/T 445-2021, “Automobile Chassis Dynamometer”, an automobile chassis dynamometer is divided into a two-axis four-drum chassis dynamometer, including a three-ton, a ten-ton, and a thirteen-ton three-axis six-drum chassis dynamometer. In order to further compare the additional loss resistance of different types of chassis dynamometers, the self-developed four-axis eight-drum chassis dynamometer of a four-wheel drive motor vehicle and the above three mainstream chassis dynamometer systems were used to carry out real vehicle tests in this paper. The test results are shown in Figure 9.
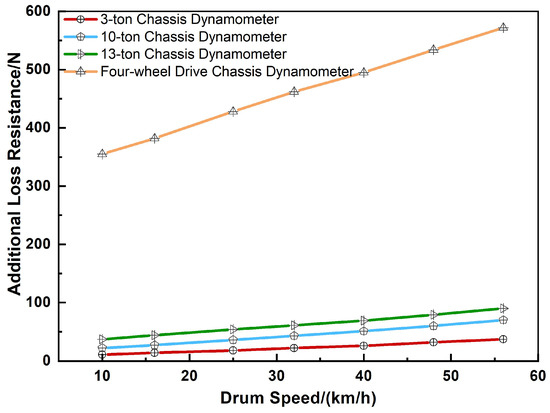
Figure 9.
Additional loss resistance under different drum speeds for different chassis dynamometers.
The chassis dynamometer must overcome the additional loss resistance of its self-bench system during operating. As can be seen from Figure 9, the additional loss resistance of all four kinds of the chassis dynamometer bench systems increased with the increase in drum speed, but there was a great difference in their increased initial value and change rate. A linear regression analysis was performed on the variation curve of the additional loss resistance with drum speeds for all the chassis dynamometer bench systems in Figure 9 via the least squares function. As listed in Table 3, all R2 values are greater than 0.99, close to 1, indicating a good fit for additional loss resistance. Additionally, the p-value is less than 0.0001, implying a highly significant linear connection between the additional loss resistance of the chassis dynamometer and the drum speed.
Table 3.
Linear regression results for the additional loss resistance of four chassis dynamometer bench systems.
In Table 3, the intercepts of the linear regression confirm that the chassis dynamometer must overcome this resistance, which is defined as the static component of the additional loss resistance, in order to operate. The slope reflects the degree of speed at which the additional loss resistance increases with the speed of the vehicle after the operation of the chassis dynamometer. It is defined as the coefficient of the dynamic component of the additional loss resistance, which is multiplied by the speed of the vehicle to obtain the value of the dynamic component.
Further analysis shows that the static and dynamic components of the additional loss resistance of the four-wheel drive motor vehicle chassis dynamometer independently developed in this paper are significantly larger than those of other three chassis dynamometers in JT/T 445-2021. The lager static component is mainly due to the four-wheel drive motor vehicle chassis dynamometer, which has a four-axis eight-drum structure, and a flywheel clutch is added to facilitate the matching of the mechanical inertia. At the same time, when combining the drum clutch and retractable drive shafts, the number of bearings and rollers grow significantly, resulting in an obvious increase in the inherent mechanical resistance. The larger dynamic component is mainly owing to the following three aspects: Firstly, when the four-wheel drive motor vehicle chassis dynamometer is in working condition, the front and rear drum groups rotate synchronously through the retractable transmission shaft, which is connected to a T-type steering box at both ends. The transmission structure between the front and rear drum groups is complex, with low efficiency and large friction loss. Secondly, the four-wheel drive motor vehicle chassis dynamometer bearings increased significantly, leading to a sharp increase in bearing friction losses. Thirdly, the basic inertia of the four-wheel drive motor vehicle chassis dynamometer is 1.681 kg, higher than that of a three-ton chassis dynamometer (902 kg), a ten-ton chassis dynamometer (912 kg), and a thirteen-ton chassis dynamometer (1.461 kg).
5. The Effect of Dynamometer Loading Resistance
It is necessary to control the dynamic load of the chassis dynamometer system according to the actual road resistance of the test vehicle when the cycle test is conducted on the chassis dynamometer to complete the complex working condition cycle. Therefore, the response time and precision of the load directly affect the accuracy of the vehicle performance testing.
5.1. The Effect of the Dynamometer on the Loading Resistance
In order to analyze the response time of the four-wheel drive motor vehicle chassis dynamometer system, tests were carried out on AC power dynamometers and eddy-current dynamometers. The response process of the four-wheel drive motor vehicle chassis dynamometer system is comparatively analyzed when a step loading force is applied at 40 km/h.
As can be seen in Figure 10, the four-wheel drive motor vehicle chassis dynamometer system equipped with an AC electric dynamometer realizes the rapid response of the loading force command when the step constant force is applied to 350 N, 550 N, 750 N, 950 N, and 1200 N; the response times are all within 0.2 s. Referring to Figure 10, the response time of the four-wheel drive motor vehicle chassis dynamometer system equipped with an eddy-current dynamometer when a step constant force is applied increases with the increase of the loaded constant force. The response curve peaked at 0.6 s and 1.2 s when the step constant forces were 350 N and 1.200 N, respectively. As can be seen from the dynamic response process in Figure 10 and Figure 11, both dynamometer systems have a good steady-state control performance. Therefore, when the loading force is dynamically applied to the vehicle by the four-wheel drive motor vehicle chassis dynamometer system, the fluctuation and hysteresis effects of loading under complex and variable driving conditions can be overcome so as to accurately simulate the actual road resistance of the vehicle and effectively test the vehicle’s performance. Additionally, the transient control performance of the chassis dynamometer is required to be high in the performance testing of new vehicles, such as new energy vehicles and intelligent connected vehicles, and the AC power dynamometer with a more rapid response should be used for loading.
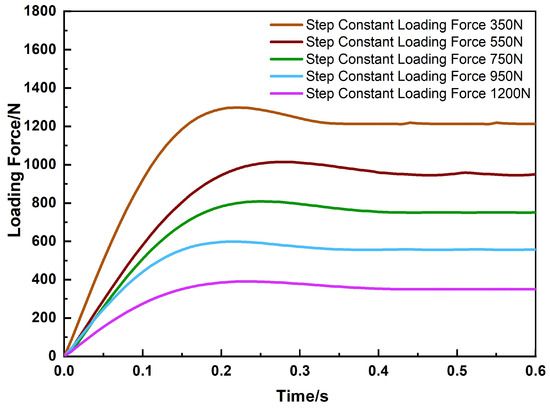
Figure 10.
The dynamic response process of loading force under an AC power dynamometer.
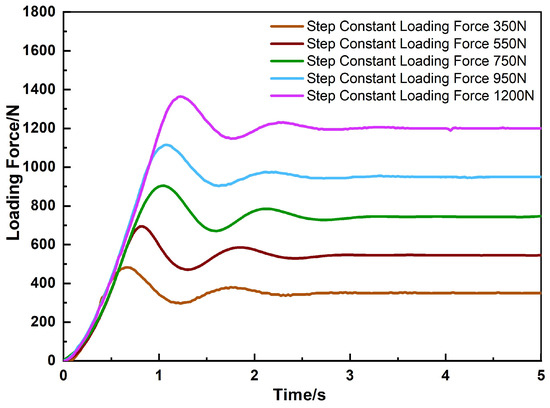
Figure 11.
The dynamic response process of loading force under an eddy-current dynamometer.
5.2. The Effect of the Control Strategy on the Loading Resistance
The running cycle condition test was carried out on the four-wheel drive motor vehicle chassis dynamometer based on the simple transient condition method specified in GB 18285-2018. In order to analyze the effect of the control strategy on the loading resistance of the dynamometer, the speed deviation during the test process of the four-wheel drive motor vehicle chassis dynamometer equipped with an eddy-current dynamometer needs to be controlled, and it cannot exceed the deviation for 2 s continuously (up and down deviations of 3 km/h). The test needs to be interrupted and restarted if the speed deviation exceeds the standard. In addition, the driving distance and the theoretical distance of the vehicle with the four-wheel drive motor vehicle chassis dynamometer should be controlled within 0.05 km during the actual test. The difference of the actual driving distance of the vehicle should be controlled within 0.01 km when testing under different control strategies.
In the simple transient method, the corresponding vehicle speed curves when the loading resistance applied by the control of proportional-integral-differential (PID) and dynamic matrix control (DMC) control strategies are shown in Figure 12. Under the control of PID and DMC strategies, the actual driving distance of the vehicle is 1.027 km and 1.032 km, which differ from the theoretical distance 1.013 km by 0.014 km and 0.019 km, respectively. It can be seen that the difference in driving distance obtained under the two control strategies is very small, only 0.005 km, and the speed control is effective.
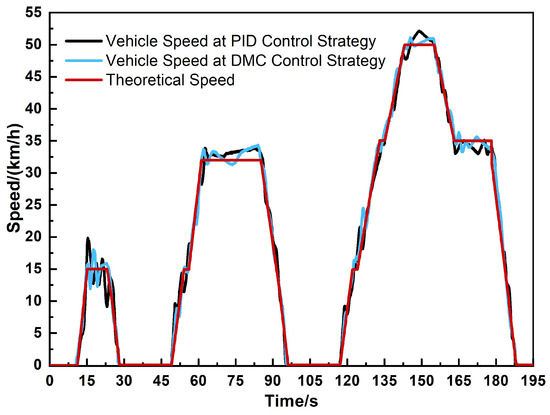
Figure 12.
Real-time vehicle speeds corresponding to different control strategies using the simple transient condition method.
Under the testing conditions shown in Figure 12, the loading resistance is applied and controlled by PID and DMC control strategies, and the loading force curves are as shown in Figure 13. In this paper, in order to effectively evaluate the influence of the control strategy on the loading resistance of the dynamometer, the transient condition deviation coefficient Dto, the steady-state condition deviation coefficient Dso, and the overall condition deviation coefficient Do of the loading force are defined as Equations (6)–(8), respectively. When the deviation coefficient is greater than zero, it can reflect the sensitivity and accuracy of the loading force under different control strategies. Moreover, the closer the deviation coefficient is to zero, the smaller the hysteresis and error of the loading force. Therefore, it can effectively evaluate the advantages and disadvantages of the control strategy of the dynamometer measurement and control system of the four-wheel drive motor vehicle chassis dynamometer.
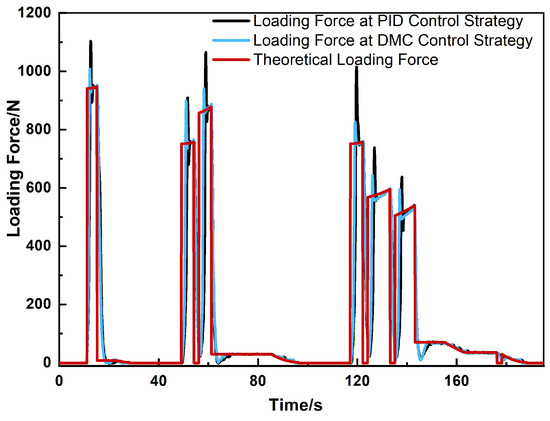
Figure 13.
Loaded force corresponding to different control strategies in the simple transient condition method.
The time-continuous signals Fr(t) and FrR(t) in Equations (6)–(8) in the four-wheel drive motor vehicle chassis dynamometer measurement and control system were transformed into time-discrete signals by sampling, with a sampling interval of 0.1 s. The deviation coefficients were obtained by summing up the discrete signals. They are specifically expressed as follows:
According to Figure 13 and Equations (9)–(11), when the applied loading resistance is controlled by the PID control strategy using the simple transient working condition method, the transient working condition deviation coefficient, steady-state working condition deviation coefficient, and overall working condition deviation coefficient are 0.409, 0.088, and 0.497, respectively. When the DMC control strategy is adopted, the above three coefficients are 0.287, 0.078, and 0.365, respectively. It can be seen that the deviation coefficient of transient working conditions based on the DMC control strategy is reduced by 42.1% compared with the PID control strategy. This indicates that the DMC control strategy could effectively restrain the overshoot and oscillation of the load resistance when the operating condition of the four-wheel drive motor vehicle chassis dynamometer system changed, exhibiting better dynamical following performance to the target value of loading force. Subsequently, compared with the PID control, the steady-state deviation coefficient based on the DMC control strategy decreases from 0.088 to 0.078, which is close to zero, indicating an inconspicuous difference and good performance between the two strategies under steady state conditions.
6. Conclusions
In this paper, the resistance influencing factors of a bench system based on a self-developed chassis dynamometer for four-wheel drive motor vehicle were examined. The main research contents are as follows:
(1) The resistance of the bench system of a four-wheel drive motor vehicle chassis dynamometer was analyzed, and it was found that it mainly consists of the internal additional loss resistance and loading resistance of the dynamometer, where the additional loss resistance is mainly affected by the drum speed and basic inertia.
(2) The effects of the drum speed, the sampling speed interval, and basic inertia on the additional loss resistance of the self-developed chassis dynamometer for a four-wheel drive motor vehicle were experimentally studied. According to the linear regression analysis performed on the measured data, the static and dynamic components of the additional loss resistance were also defined to compare the additional loss resistance of different types of chassis dynamometers.
(3) The effects of the dynamometer type and control strategy on the loading resistance were analyzed. The transient condition deviation coefficient, the steady-state condition deviation coefficient, and the overall operating condition deviation coefficient were defined to reflect sensitivity and accuracy when applying the loading resistance under different control strategies. The real vehicle test results show that the transient working condition deviation coefficients are 0.409 and 0.287 when the loading resistance is applied using PID and DMC control strategies, respectively, under the simple transient working condition method. This indicates that the DMC control strategy has a better dynamic response process than the PID control strategy when the loading resistance is applied.
Author Contributions
Investigation, W.H. and F.Q.; Writing—Original Draft, W.H. and R.C.; Validation, W.H., D.L., R.C., Z.L. and X.J.; Data Curation, W.H., D.L. and R.C.; Funding Acquisition, W.H.; Writing—Review and Editing, R.C. and D.L.; Methodology, D.L., S.J., Z.L. and F.Q.; Conceptualization, R.C., H.Z., Y.W. and F.Q. All authors have read and agreed to the published version of the manuscript.
Funding
This work was supported by funding from the Natural Science Foundation of Shandong Province (No. ZR2022ME096) from Shandong Provincial Natural Science Foundation Committee, the Provincial Science and Technology Innovation Platform Subsidy Project (No. 202333096) from Jinan Science and Technology Bureau, and the Team Project by Excellent Youth Innovation Team Foundation of Shandong Higher School (No. 2021KJ039) from Shandong Provincial Department of Education.
Data Availability Statement
Data are contained within the article.
Conflicts of Interest
The authors declare no conflicts of interest.
References
- JT/T 445-2021; Automobile Chassis Dynamometer. People’s Republic of China Ministry of Transport: Beijing, China, 2021.
- GB 18285-2018; Pollutant Emission Limits and Measurement Methods for Gasoline Vehicles (Double Idling Method and Simple Working Condition Method). The Ministry of Ecology and Environment of the People’s Republic of China and the State Administration for Market Regulation: Beijing, China, 2019.
- GB 3847-2018; Pollutant Emission Limits and Measurement Methods for Diesel Vehicles (Free Acceleration Method and Loaded Deceleration Method). The Ministry of Ecology and Environment of the People’s Republic of China and the State Administration for Market Regulation: Beijing, China, 2019.
- JJF 1221-2009; Calibration Specification of Chassis Dynamometer for Automobile Exhaust Pollutant Testing. General Administration of Quality Supervision, Inspection and Quarantine of the People’s Republic of China: Beijing, China, 2009.
- Zhuo, Y.; Deng, B.Q. An overview of chassis dynamometer in the testing of vehicle emission. MATEC Web Conf. 2018, 175, 02015. [Google Scholar]
- Zhang, X.; Zhou, Z. Research on development of vehicle chassis dynamometer. J. Phys. Conf. Ser. 2020, 1626, 12150. [Google Scholar] [CrossRef]
- Sun, G.X.; Meng, Y.P. Research on the influencing factors of driving resistance simulated by chassis dynamometer. China Soc. Automot. Eng. 2020, 023933. [Google Scholar]
- Wang, J.Q.; Gao, W. Study on the correlation between the rolling resistance of tires in the bench test and the road test. Automot. Eng. 2003, 6, 613–616. [Google Scholar]
- Czaban, J.; Szpica, D. Drive test system to be used on roller dynamometer. Mechanics 2013, 19, 600–605. [Google Scholar] [CrossRef]
- Yang, C.; Xu, D. Comparative study of pollutant emissions from heavy-duty vehicles based on roadway method and chassis dynamometer method. Automot. Sci. Technol. 2021, 4, 48–53. [Google Scholar]
- Li, B.H.; Liu, A.J. Research on the simulation method of automobile chassis dynamometer resistance. Eng. Test. 2020, 60, 3–6. [Google Scholar]
- Li, Q.; Zhao, X.P. A rapid prototype-based electrical simulation study of chassis dynamometer resistance. Agric. Equip. Veh. Eng. 2019, 57, 7–10. [Google Scholar]
- Zhang, S.H. Research on Dynamic Loading System of AC Chassis Dynamometer. Master’s Thesis, Henan University of Science and Technology, Luoyang, China, 2022. [Google Scholar]
- Zhang, S.H.; Zhang, X.R. Research on AC chassis dynamometer system based on virtual prototype. Mod. Manuf. Eng. 2022, 9, 123–131. [Google Scholar]
- Zheng, X.X. Research on Chassis Dynamometer Test Technology Based on Rolling Resistance Dynamic Loading and Motion Parameter Prediction. Master’s Thesis, Zhejiang University, Hangzhou, China, 2018. [Google Scholar]
- Gong, Z.Y.; Liu, Z.X. Research on the measurement method of parasitic friction resistance of single-drum chassis dynamometer. China Test 2016, 42, 5–8. [Google Scholar]
- Wen, Y.; Tian, Y. Characterization of internal resistance of durable chassis dynamometer with usage time. China Test 2013, 39, 121–124. [Google Scholar]
- Lourenço, M.A.M.; Eckert, J.J. Vehicle and twin-roller chassis dynamometer model considering slip tire interactions. Mech. Based Des. Struct. Mach. 2023, 51, 6166–6183. [Google Scholar] [CrossRef]
- Ouyang, A.G.; Lu, J.F. Compensated numerical modeling of endogenous frictional resistance in chassis dynamometer operation. China Test 2017, 43, 124–126+137. [Google Scholar]
- Code of Practice for New Energy Vehicles Operation Safety Inspection (Draft for Comments). State Administration for Market Regulation, Standardization Administration of China: Beijing, China, 2022.
- Han, R. Factor analysis of rolling resistance of whole vehicle drive wheels based on orthogonal test. Automob. Pract. Technol. 2022, 47, 114–118. [Google Scholar]
- Gorelov, V.A.; Komissarov, A.I. A control algorithm for simulation of real-world operating conditions for the drivetrain of an all-wheel drive vehicle with individually driven wheels on a chassis dynamometer. Cogent Eng. 2020, 7, 1737449. [Google Scholar] [CrossRef]
Disclaimer/Publisher’s Note: The statements, opinions and data contained in all publications are solely those of the individual author(s) and contributor(s) and not of MDPI and/or the editor(s). MDPI and/or the editor(s) disclaim responsibility for any injury to people or property resulting from any ideas, methods, instructions or products referred to in the content. |
© 2024 by the authors. Licensee MDPI, Basel, Switzerland. This article is an open access article distributed under the terms and conditions of the Creative Commons Attribution (CC BY) license (https://creativecommons.org/licenses/by/4.0/).