Article

Association between Muscle Mass Index and Neurological Outcomes of Patients with Out-of-Hospital Cardiac Arrest

1
Department of Emergency Medicine, Yonsei University College of Medicine, Seoul 03722, Republic of Korea
2
Department of Emergency Medicine, Hanyang University Hospital, Seoul 04763, Republic of Korea
3
Biostatistics Collaboration Unit, Department of Biomedical Systems Informatics, Yonsei University College of Medicine, Seoul 03722, Republic of Korea
*
Author to whom correspondence should be addressed.
These authors contributed equally to this work.
Life 2024, 14(6), 680; https://doi.org/10.3390/life14060680
Submission received: 25 March 2024 / Revised: 13 May 2024 / Accepted: 24 May 2024 / Published: 24 May 2024

Abstract

:
Muscle mass depletion is associated with unfavorable outcomes in many diseases. However, its relationship with cardiac arrest outcomes has not been explored. This retrospective single-center study determined the relationship between muscle mass depletion and the neurological outcomes of patients with out-of-hospital cardiac arrest (OHCA) by measuring muscle mass at various locations. Adult patients with OHCA, who were treated with target temperature management, and who underwent abdominal or chest computed tomography (CT) within 3 months of the cardiac arrest were included. Skeletal muscle index (SMI) was measured at the third lumbar vertebra (L3) level, psoas muscle, fourth thoracic vertebra (T4) level, and pectoralis muscle. The Youden index was used to determine a low SMI based on sex-specific cutoff values. The outcome variables were “good neurological outcome” and “survival” at hospital discharge. Multivariable analyses revealed that patients with low T4 SMI level were significantly associated with good neurological outcomes at hospital discharge (odds ratio = 0.26, 95% confidence interval: 0.07–0.88, p = 0.036). However, no significant differences were observed between good neurological outcomes and low SMI at the L3 level and psoas and pectoralis muscles; SMIs were not associated with survival at hospital discharge. T4 level SMI depletion was inversely associated with good neurological outcomes in patients with OHCA. Thoracic muscle depletion may be crucial for predicting the neurological outcomes in patients with OHCA and further investigation in larger prospective study is warranted.

1. Introduction

Out-of-hospital cardiac arrest (OHCA) is a critical situation presented in emergency departments. OHCA necessitates a substantial utilization of medical resources both during resuscitation and after the return of spontaneous circulation (ROSC). Due to the high prevalence of poor neurological outcomes, early prediction can facilitate decisions regarding the extent of treatment, such as targeted temperature management (TTM) [1,2]. Among various prognostic predictors of OHCA, factors related to metabolic conditions, including body mass index (BMI) and cholesterol, have gained attention [3,4]. However, BMI has several limitations; for example, it does not distinguish between fat and muscle, and disorders such as sarcopenic obesity may be underestimated or missed [5]. Therefore, an index measuring muscle quantity may be more accurate than BMI. Muscle mass measurement is an indirect method for predicting sarcopenia and can distinguish patients with similar BMIs based on muscle quantities [5,6].
Muscle mass measurement estimates muscle quantity and significantly correlates with muscle strength [7]. Assessment of skeletal muscle area (SMA) based on the cross-sectional area of a specific body location using magnetic resonance imaging and computed tomography (CT) is considered the gold standard [5]. Only one study has analyzed the association between muscle mass depletion and neurological outcomes of cardiac arrest [8]; however, the study was limited to patients with in-hospital cardiac arrest (IHCA), and muscle mass was assessed only at the third lumbar vertebra (L3) level using an abdominal CT. Although the skeletal muscle index (SMI) at the L3 level is the most common method for predicting sarcopenia, abdominal CT scanning, an essential part of this method, is not frequently used in patients with cardiac arrest. Accordingly, SMI at the pectoralis muscle and fourth thoracic vertebra (T4) level have been used in predicting other diseases, such as chronic obstructive pulmonary disease [9,10,11,12]. However, such studies on cardiac arrests are lacking.
Therefore, this study aimed to investigate the relationship between muscle mass depletion and neurological outcomes in patients with OHCA by measuring SMI at various locations and to determine the SMI that most accurately describes this relationship.

2. Materials and Methods

2.1. Settings and Study Population

This retrospective single-center study was conducted at a tertiary care hospital in the Republic of Korea. Adult patients (>18 years old) with OHCA who had undergone TTM between May 2012 and December 2021 were enrolled. Patients with available chest or abdominal CT scans within 3 months of cardiac arrest were included in the study, based on a previous study involving patients with IHCA [8]. Patients for whom TTM was discontinued, such as those with do-not-resuscitate orders or those with uncontrolled bleeding, were excluded. Additionally, patients who were transferred from the emergency department to another hospital were excluded, owing to missing outcome data, those with a cerebral performance category (CPC) score of 3–5 before cardiac arrest, and those with conditions affecting image clarity, such as muscle hematoma, were also excluded.

2.2. Post-Cardiac Arrest Care and TTM

All adult patients with OHCA and ROSC who were eligible for TTM underwent the standardized protocol of our institution. Patients who were unconscious and not able to follow verbal commands with more than 20 consecutive minutes of spontaneous circulation were considered eligible for the protocol. The target temperature was 33 °C before 2014 and chosen between 33 °C to 36 °C based on physician’s discretion after 2014. Cooling was discontinued after 24 h, followed by rewarming at a rate of 0.25 °C/h to achieve normothermia (37.0 °C). Normothermia was maintained for 48 h after the end of rewarming. TTM was conducted using Artic Sun® Energy Transfer Pads™ (Medivance Corp, Louisville, KY, USA).
Ventilator settings were adjusted to maintain SaO2 from 94% to 96% and PaCO2 from 40 to 45 mmHg to avoid hyperoxemia, hypocarbia, and hypercarbia. Blood pressure was corrected if systolic blood pressure was less than 90 mmHg. All patients received sedative and analgesic treatments. Bedside physical therapy was prescribed at admission.

2.3. Data Collection

Data including the patient age, sex, smoking status, weight, height, and comorbidities were collected from the electronic medical records. The Charlson Comorbidity Index (CCI) was calculated, and BMI was calculated as weight (kg) divided by height squared (m2). Resuscitation variables, such as witnessed collapse, location of arrest, bystander response, shockable rhythm, etiology of arrest, time from cardiac arrest to ROSC, application of percutaneous coronary intervention (PCI), and extracorporeal membrane oxygenation, were extracted from the emergency medical records [13,14]. Regarding unwitnessed cardiac arrest, the arrest time was calculated from the time of emergency call.
The primary outcome was a good neurological outcome, defined by a CPC score of 1 or 2 at hospital discharge [15,16]. Survival at hospital discharge was investigated as a secondary outcome. Ventilator-free days were also assessed for potential association between SMI and weaning of mechanical ventilation, which may have affected the outcomes of the study.

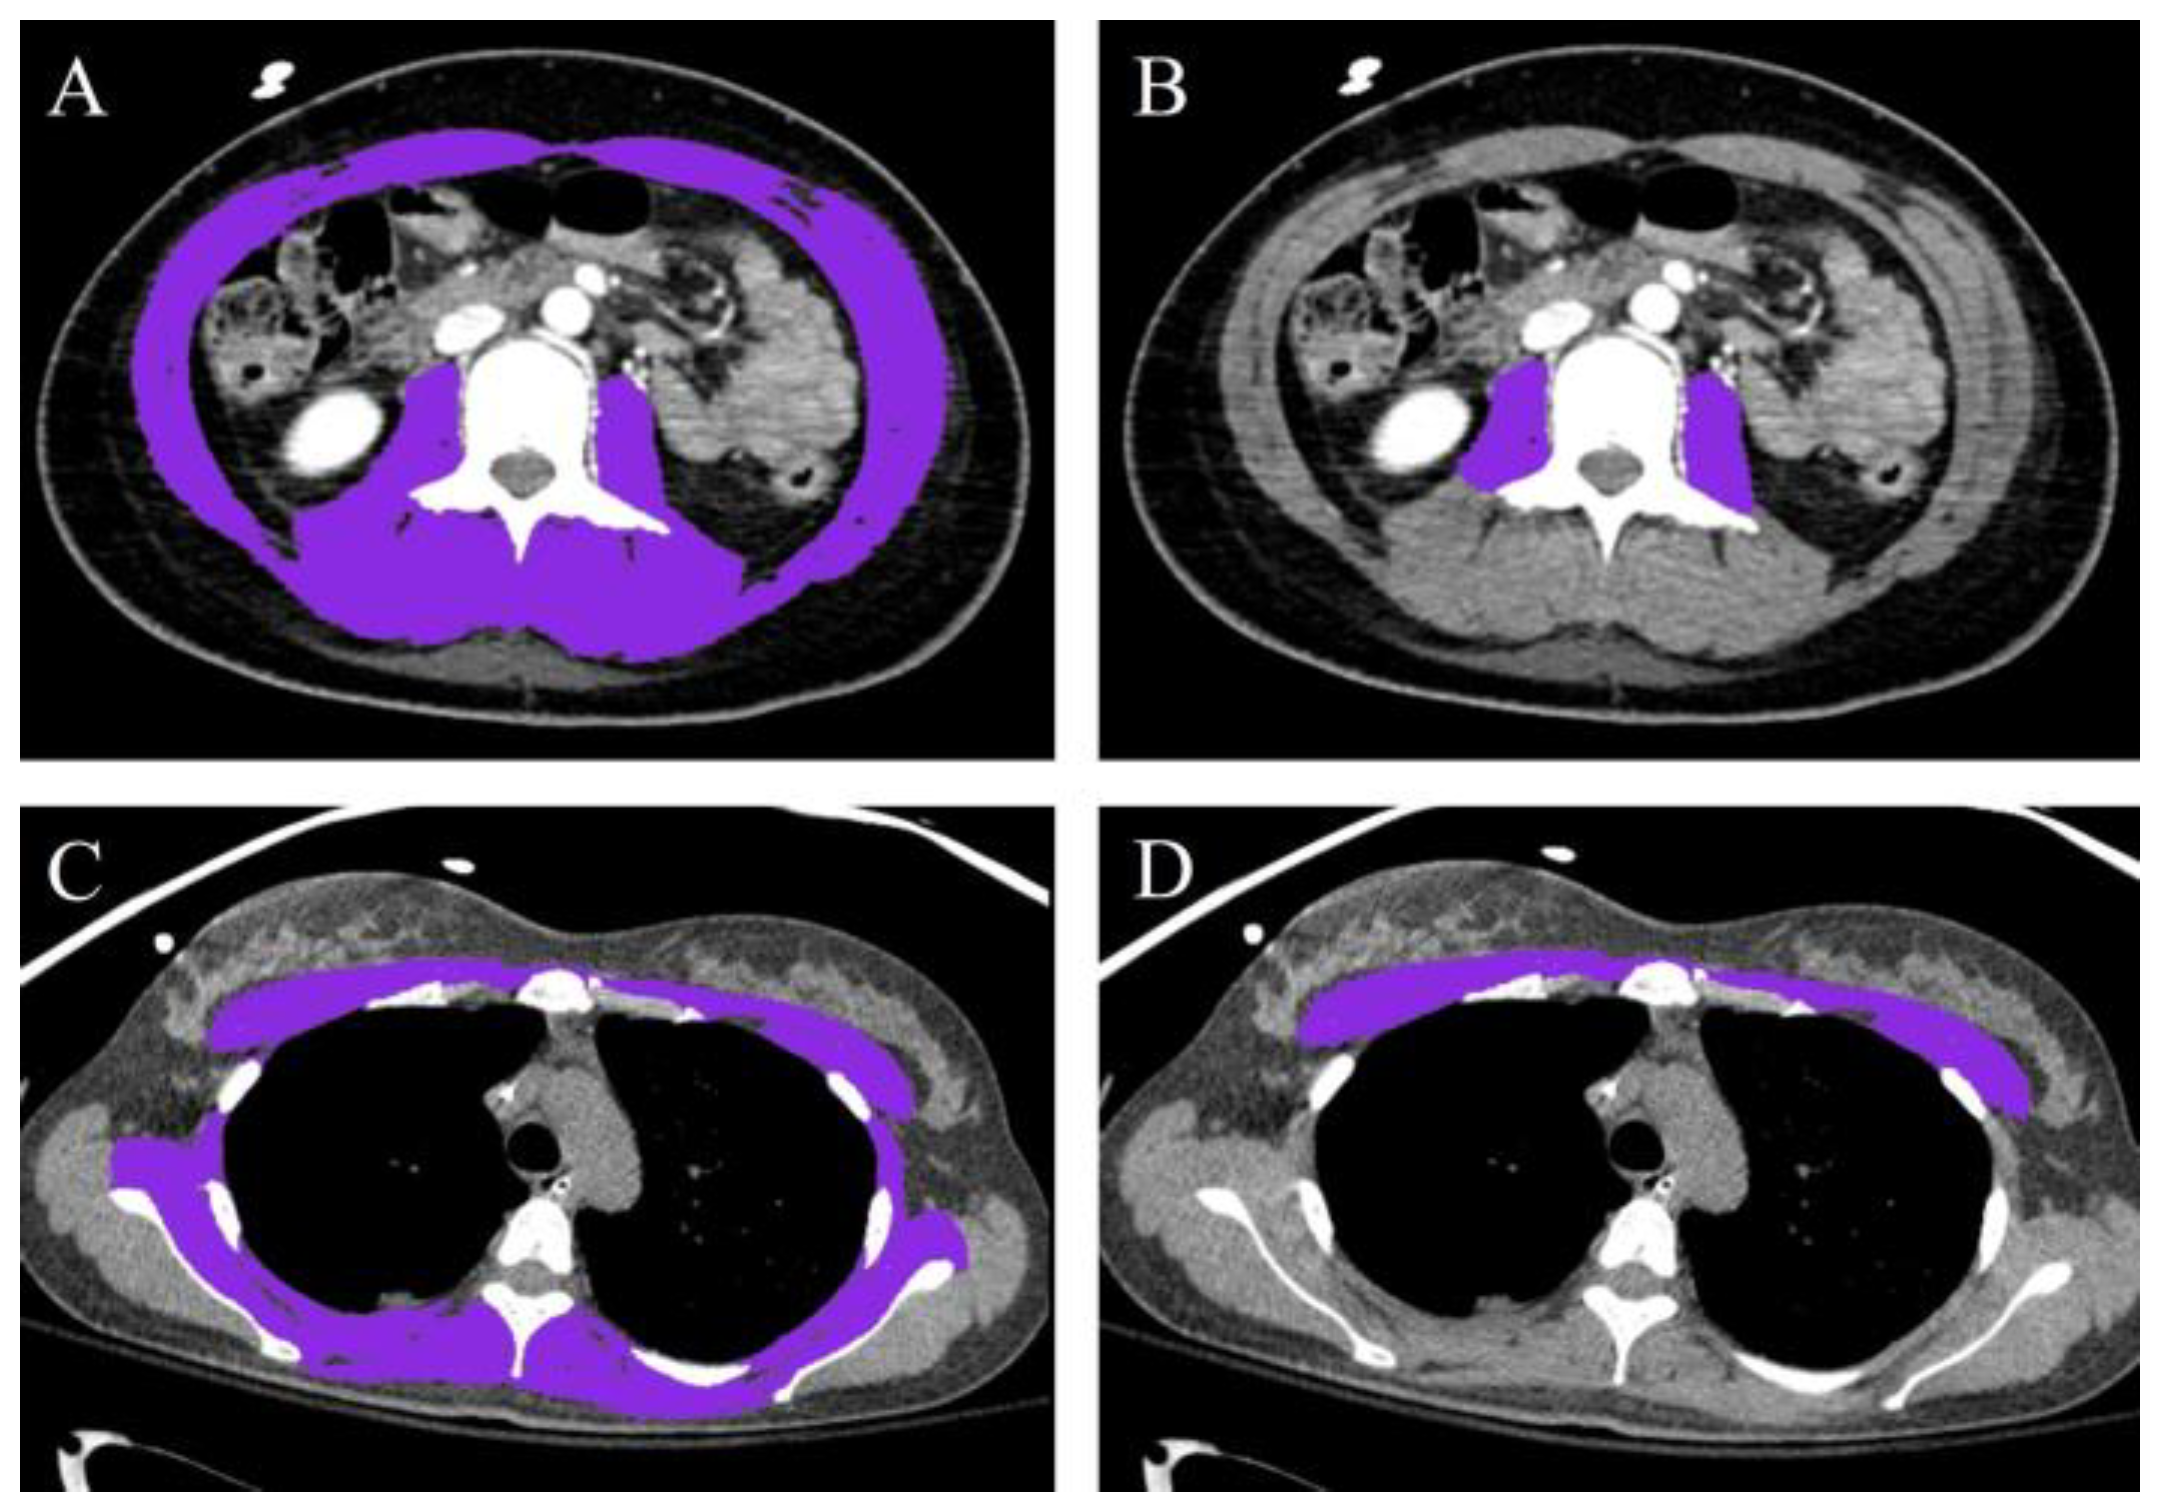
2.4. Muscle Mass Measurement

CT scans were acquired with a multidetector CT scanner (SOMATOM Force, SIMENS Healthneers, Germany). CT technical parameters included syngo CT VB20A (Software Versions), 120 kV (tube voltage), 0.6 mm, 192 rows (detector configuration), tube current modulation, 0.25 s/rotation (gantry rotation), and a 3 mm reconstruction thickness. Chest CT was performed from the lung apex to the diaphragm, and abdominal CT was performed from the diaphragmatic dome to the symphysis pubis. The following four skeletal muscles were assessed: L3 level SMA, psoas muscle area, T4 level SMA, and pectoralis muscle area. SMA at the L3 level is the sum of muscles identified on CT scans at the L3 inferior endplate level, including the paraspinal, abdominal wall, and psoas muscles [5,10,17]. The psoas muscle area was measured at the same level as that of the L3 SMA [5,18,19]. The T4 level SMA included the pectoralis, intercostalis, paraspinal, serratus, and latissimus muscles measured at the middle of the fourth vertebral body [5,20,21,22]. The pectoralis muscle area was defined as the sum of the bilateral pectoralis major and minor muscles at the level just above the aortic arch [5,23,24]. Skeletal muscles were demarcated using Hounsfield units, ranging from −29 to 150 [25]. All images were semi-automatically analyzed using the Aview® system (v 1.1.38.6, Coreline Soft Inc., Seoul, Republic of Korea) and reviewed by two emergency medicine doctors (Figure 1). SMI was calculated as SMA (cm2)/BMI (kg/m2) and normalized to the BMI [5,26,27,28].

2.5. Statistical Analyses
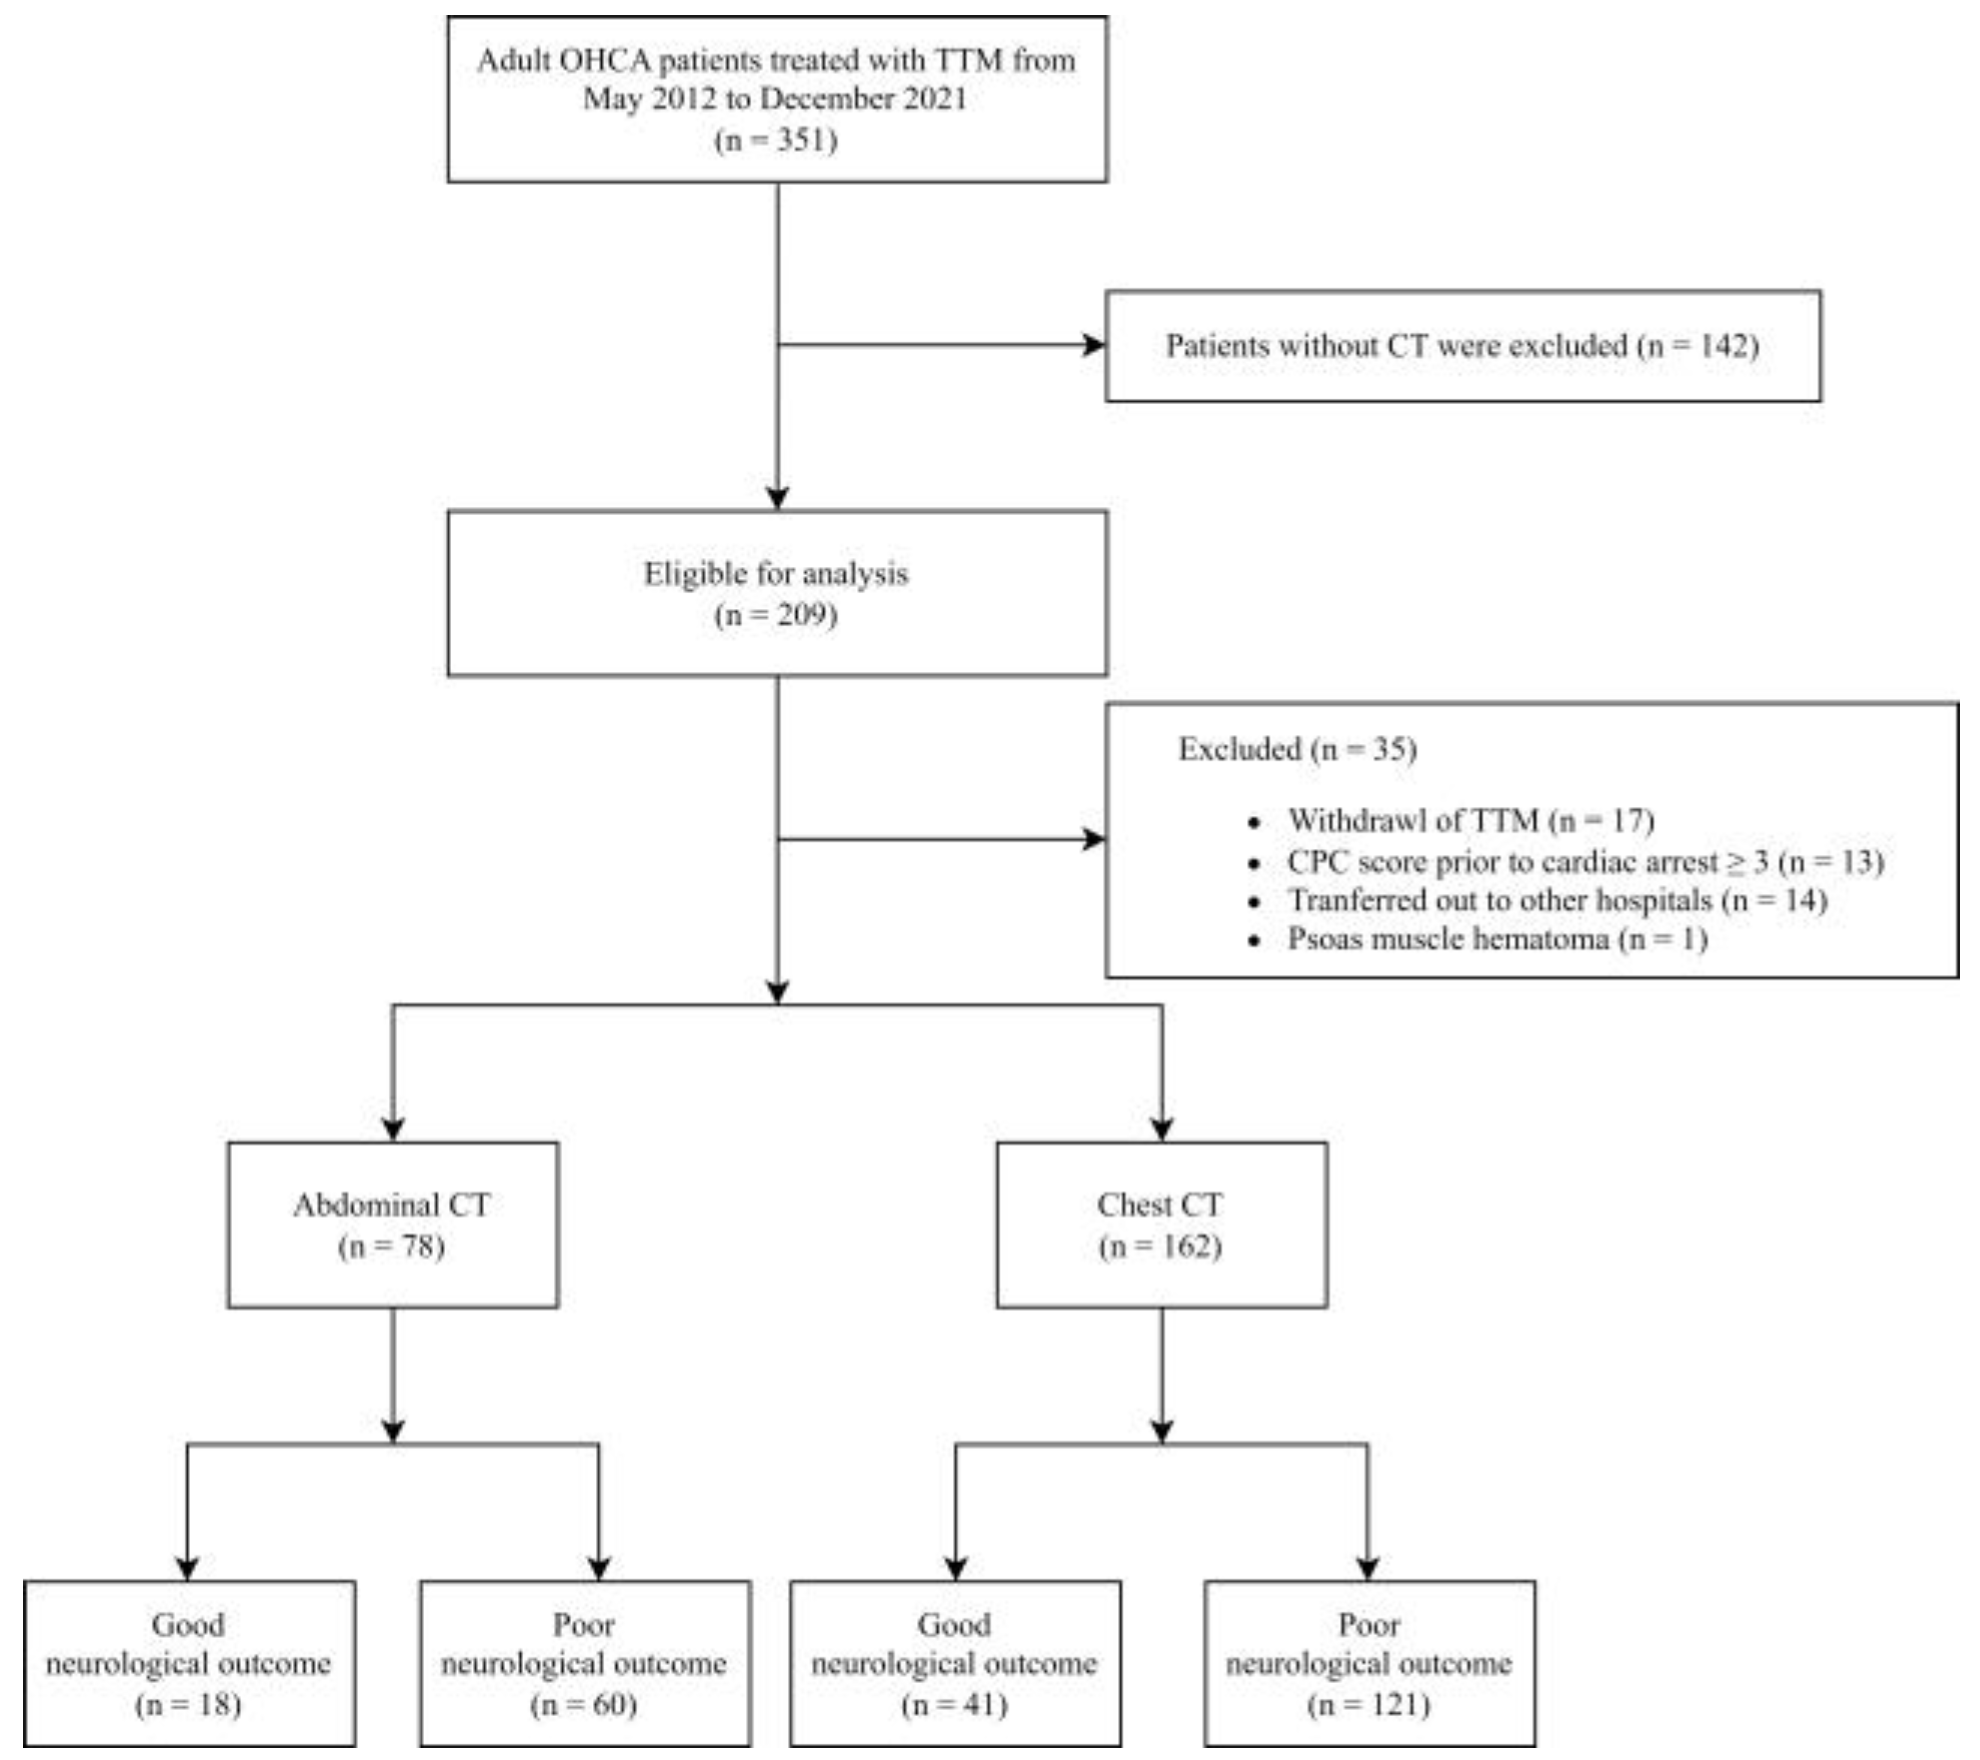
Categorical variables are presented as frequency (%), while continuous variables are presented as mean ± standard deviation or median with an interquartile range. The normality of the distribution was examined using the Shapiro–Wilk test. Baseline characteristics were compared between good and bad neurological outcome groups using the Mann–Whitney U test or Student’s t-test for continuous variables and the chi-squared test or Fisher’s exact test for categorical variables, as appropriate. To assess the relationship between the outcomes and SMI, each sex-specific cutoff value of SMI was set for good neurological outcome and survival. Although the recommended cutoff value for sarcopenia is usually set at −2 standard deviations in healthy young adults, a universal cutoff value for SMI normalized by BMI has not been established [5]. Therefore, to select the optimal cutoff values with the best discriminative performance for predicting outcomes, a receiver operating characteristic analysis was performed. Based on the Youden index, each sex-specific cutoff value for SMI was selected where the Youden index was defined as sensitivity + specificity of −1. A univariate logistic regression analysis was performed using demographic variables, resuscitation variables, and SMI to evaluate the risk factors associated with the primary or secondary outcomes. Next, a multivariable logistic regression analysis was performed using variables that had a p value < 0.1 in the univariate logistic regression. Multicollinearity was eliminated using a generalized variance inflation factor. The correlation between ventilator-free days and SMI was analyzed using Kendall’s tau. All reported p values were two-sided, and statistical significance was set at p < 0.05. Statistical analyses were performed using R software (version 4.3.0, http://www.R-project.org, accessed on 3 March 2023).

3. Results

Between May 2012 and December 2021, 351 patients with OHCA were treated with TTM in the emergency department. After excluding patients without CT scans, 209 patients were eligible for analysis, among whom abdominal and chest CT scans were performed in 78 and 162 patients, respectively, within 3 months of cardiac arrest. Of the 78 patients who underwent abdominal CT, 18 exhibited good neurological outcomes at discharge, whereas among the 162 patients who underwent chest CT, 41 exhibited good neurological outcomes (Figure 2).
Baseline characteristics of patients who underwent abdominal and chest CT compared according to their neurological outcomes and survival at hospital discharge are presented in Table 1. Among the patients who underwent abdominal CT, those with good neurological outcomes had differences in the location of cardiac arrest (p = 0.007), shockable rhythm (p < 0.001), cardiogenic arrest (p < 0.001), and PCI (p = 0.012). Patients who survived until discharge showed statistically significant differences only in witnessed arrest (p = 0.013) and shockable rhythm (p = 0.038). Baseline characteristics of total patients with OHCA are presented in Appendix A.
Among the patients who underwent chest CT, the good neurological outcome group was significantly associated with male sex (p = 0.007) and a lower CCI score (p = 0.013). Additionally, they had differences in resuscitation variables compared with the bad neurological outcomes group in witnessed arrest (p = 0.031), location of arrest (p = 0.002), bystander cardiopulmonary resuscitation (CPR) (p = 0.014), shockable rhythm (p < 0.001), cardiogenic arrest (p < 0.001), arrest time (p = 0.001), and PCI (p < 0.001). The patients who survived until discharge were younger (p = 0.040) and had lower CCI scores (p = 0.004). The survival group had a higher incidence of witnessed cardiac arrest (p = 0.001), bystander CPR (p = 0.013), shockable rhythm (p < 0.001), and cardiogenic arrest (p = 0.005). The arrest time was significantly shorter in the survival group (p = 0.005).
Kendall’s tau correlation analysis on the relationship between ventilator-free days and SMIs showed weak or no correlations for L3/BMI (τ = 0.267, p = 0.002), psoas/BMI (τ = 0.260, p = 0.003), T4/BMI (τ = 0.113, p = 0.059), and pectoralis/BMI (τ = 0.133, 0.026).
The sex-specific cutoff values for good neurological outcomes and survival are presented in Table 2. The patients were divided into low- or high-SMI groups based on these values. Among the four evaluated SMIs, T4/BMI and pectoralis/BMI were associated with neurological outcomes (p < 0.001 and p = 0.001, respectively). However, the L3/BMI was not associated with survival until discharge (Table 3).
In the multivariable analyses, age and sex were included because of their clinical significance. Age, sex, CCI, witnessed arrest, location of arrest, bystander CPR, shockable rhythm, cardiogenic cause, arrest time, and PCI were included as confounding variables in the multivariable logistic regression analysis for good neurological outcomes in the patients who underwent a chest CT. Bystander CPR (p = 0.018), arrest time (p = 0.023), and low T4/BMI (p = 0.021) were significantly associated with good neurological outcomes in the multivariable analysis. The association between low pectoralis/BMI and good neurological outcome (p = 0.222) was lost after adjusting for the confounding variables. The confounding variables for survival at discharge in the chest CT group were similar to those of the primary outcome, except for the location of arrest and PCI. Both thoracic muscle indices had no predictive value for survival at hospital discharge in the multivariable analysis. A low psoas/BMI, which had statistical significance in the univariable analysis for survival to discharge, failed to show any association after adjusting for the confounding variables (Table 4).

4. Discussion

To the best of our knowledge, this study was the first to investigate the relationship between various muscle measurements at various locations and neurological outcomes in patients with OHCA. The results showed that only T4/BMI was independently associated with neurological outcomes in patients with OHCA. Pectoralis/BMI was statistically significant in the univariable analysis, although not after adjusting for other covariates.
This result differs from that of a previous study involving patients with IHCA, which showed an association between SMI at the L3 level and long-term neurological outcomes [8]. These differences may be due to differences in the OHCA and IHCA characteristics. Patients with IHCA may have more comorbidities and a poor nutritional status, which can be observed in the prevalence of patients with cancer, 53.2% in the study by Hong et al. [8] and 4.5% in this study. Overall, 27% of patients with OHCA who were treated with TTM had good neurological outcomes at hospital discharge. These results were not significantly different from those of a previous study (approximately 30.5%) for patients with OHCA in the Republic of Korea [28]. Regarding cardiac arrest characteristics, bystander CPR and arrest time were associated with good neurological outcomes. The association of BMI with cardiac arrest outcomes remains debatable and was not observed in this study [3].
The European Working Group on Sarcopenia in Older People proposed a revised definition of sarcopenia in 2018, using low muscle strength as the primary parameter. Probable sarcopenia is identified by low muscle strength and diagnosed when muscle quantity or quality is low [5]. However, muscle strength measurements are difficult in clinical settings, particularly in the emergency department. In previous studies, skeletal muscle mass measurements have been used to indirectly diagnose sarcopenia, owing to its positive correlation with muscle strength [29,30]. Considering that muscle mass is related to body size, BMI was used in this study to mitigate the association between SMA and body size. Due to its positive correlation with body size, previous studies have proposed muscle mass indices to be adjusted for height squared, weight, or BMI [5]. Since the proposal of the SMA/BMI index by the Foundation for the National Institutes of Health Sarcopenia Project, it has gained much interest [26]. Although studies have used height squared to normalize muscle mass, several studies have suggested that muscle mass normalized by height squared can underestimate sarcopenia prevalence in individuals with obesity and that BMI is a better metric [27,28]. Therefore, BMI was used in this study.
Our findings suggest that the thoracic muscles may have more important functional and predictive values than those of other cross-sectional areas in patients with OHCA; however, the underlying mechanism remains unclear. Previous studies have shown that patients with greater thoracic muscle area have better lung function and physical activity in respiratory diseases [23,31]. Furthermore, the importance of respiratory muscles in the outcomes of COVID-19 and idiopathic pulmonary fibrosis has been investigated [21,32]. This suggests the need for a disease-specific approach in muscle mass assessment. For example, fat-free mass in the limbs does not correlate with that of the entire body [33]. Additionally, a recent study reported a significant association between SMI at the L3 level and survival in patients with multiple traumas but not with SMI at the T4 level [34]. Although previous studies have suggested strong correlations between total muscle mass and the L3, T4, and pectoralis muscles, caution should be exercised when determining the level of cross-sectional area to be used [20,33,35]. Further studies are needed to investigate the role of thoracic muscles in patients with cardiac arrest.
Our study revealed conflicting results between the T4/BMI and pectoralis/BMI, although both consist of the thoracic muscles. This may be due to the fact that the pectoralis muscles are not fully representative of the respiratory muscles; they only consist of pectoralis major and minor muscles, while the T4/SMI includes other important breathing muscles such as the intercostalis muscles. Given its primary role in upper arm exercises, the pectoralis major muscle, which contributes to the majority of the pectoralis muscle areas, may have not reflected the outcomes of patients with OHCA as well as the T4 level SMI [20,36]. However, the relationship between ventilator weaning and respiratory muscles of patients with OHCA should be further investigated, considering that our results did not show any strong relationship between SMIs and ventilator-free days.
The time window of 3 months was determined based on a similar study involving patients with IHCA [8]. However, due to its relatively long duration, some patients may have accurately reflected pre-cardiac arrest muscle mass, while for others, the CT scans could have been significantly influenced by post-arrest conditions. Nonetheless, considering that the majority of patients underwent the examination shortly after arrest, it can still be assumed that most scans predominantly represent pre-cardiac arrest muscle mass. Nevertheless, there may be a need for prospective studies conducted at more standardized times to measure muscle mass.

Limitations

This study has several limitations. First, this was a single-center retrospective study with possible bias. However, a consistent protocol was followed throughout the treatment, owing to the single-center design. Second, the outcomes were analyzed at hospital discharge without long-term data, although studies have reported that outcomes at discharge do not differ from long-term outcomes [37,38]. Third, CT images were not reviewed by a specialized radiologist. Two experienced emergency medicine doctors reviewed all images to minimize potential errors. Fourth, the post-cardiac arrest management protocol may differ in aspects such as target temperature within the study population, which could have influenced the results. However, due to the retrospective nature of the study, it was difficult to control this parameter, and the sample size was too small to conduct subgroup analysis. Moreover, post-cardiac arrest conditions may have influenced muscle mass due to the relatively long-time window between arrest and CT scan. Finally, we used cutoff values based on our study population. The cutoff values for sarcopenia should be calculated based on a healthy population; however, no optimal cutoff values for these indices have been established. Therefore, the cutoff values presented in this study should be implemented cautiously in the general population.

5. Conclusions

SMI at the T4 level was associated with neurological outcomes in patients with OHCA. However, SMIs at the L3 level and psoas and pectoralis muscles showed no associations with OHCA outcomes. Thus, low thoracic muscle may be associated with neurological outcomes in patients with OHCA and should be further investigated in a large prospective study.

Author Contributions

Y.S.P. is the guarantor of the paper, taking responsibility for the integrity of the work as a whole from inception to published article. Y.C.: conceptualization, acquisition, analysis, and interpretation of data, writing—original draft, and funding acquisition. E.N.K.: study design, data acquisition and interpretation, and writing—original draft. J.S.Y.: data interpretation, and writing—critically revising the article for important intellectual content. M.H.: analysis and interpretation of data. Y.S.P.: conceptualization, analysis, and interpretation of data, and writing—critically revising the article for important intellectual content. All authors have read and agreed to the published version of the manuscript.

Funding

This research was supported by the 2022 Science Research Program of the Korean Association of Cardiopulmonary Resuscitation (KACPR) (No. 2022-007). The sponsor had no role in the design of the study, collection and analysis of the data, or preparation of the manuscript.

Institutional Review Board Statement

This study was conducted in accordance with the amended Declaration of Helsinki. The Institutional Review Board of Severance hospital, Yonsei University (No-4-2022-1157) approved the study and waived the requirement for obtaining informed consent.

Informed Consent Statement

The institutional review board of Severance hospital, Yonsei University waived the requirement for obtaining informed consent.

Data Availability Statement

The datasets used during the current study are available from the corresponding author upon reasonable request.

Conflicts of Interest

The authors declare that the research was conducted in the absence of any commercial or financial relationships that could be construed as a potential conflict of interest.

Appendix A

Table A1. Baseline characteristics of total patients with OHCA.
Total
(n = 174)
Good Neurological Outcome
(n = 101)
Poor Neurological Outcome
(n = 73)
p Value
Age63.0 [48.0–72.0]59.0 [45.0–70.0]65.0 [55.0–74.0]0.019
Men123 (70.7)77 (76.2)46 (63.0)0.085
BMI (kg/m2)23.4 [21.3–25.9]23.7 [21.4–26.3]22.9 [21.0–25.3]0.517
Smoking 0.222
Current47 (27.0)32 (31.7)15 (20.5)
Ex-smoker27 (15.5)16 (15.8)11 (15.1)
Non-smoker100 (57.5)53 (52.5)47 (64.4)
CCI3.0 [1.0–5.0]3.0 [0.0–5.0]4.0 [2.0–7.0]0.004
Witnessed arrest115 (66.1)38 (52.1)77 (76.2)0.002
Location 0.153
Residence76 (43.7)39 (38.6)37 (50.7)
Other98 (56.3)62 (61.4)36 (49.3)
Bystander CPR115 (66.1)74 (73.3)41 (56.2)0.029
Shockable rhythm54 (31.0)45 (44.6)9 (12.3)<0.001
Cardiogenic cause84 (48.3)59 (58.4)25 (34.2)0.003
Arrest time a (mins)28.5 [17.0–43.0]26.0 [15.0–40.0]37.0 [20.0–45.0]0.014
PCI28 (16.1)21 (20.8)7 (9.6)0.076
ECMO 0.475
ECPR2 (1.1)2 (2.0)0 (0.0)
after ROSC10 (5.7)6 (5.9)4 (5.5)
No ECMO162 (93.1)93 (92.1)69 (94.5)
a For unwitnessed cardiac arrest, arrest time was calculated from the time of the emergency call. Data are presented as the mean ± standard deviation, median [interquartile range], or number (percentage). Percentages may not total 100 due to rounding. Abbreviations: BMI, body mass index; CCI, Charlson Comorbidity Index; CPR, cardiopulmonary resuscitation; ECMO, extracorporeal membrane oxygenation; ECPR, extracorporeal cardiopulmonary resuscitation; OHCA, out-of-hospital cardiac arrest; PCI, percutaneous coronary intervention; ROSC, return of spontaneous circulation.

References

  1. Holzer, M.; Bernard, S.A.; Hachimi-Idrissi, S.; Roine, R.O.; Sterz, F.; Müllner, M.; Collaborative Group on Induced Hypothermia for Neuroprotection After Cardiac Arrest. Hypothermia for neuroprotection after cardiac arrest: Systematic review and individual patient data meta-analysis. Crit. Care Med. 2005, 33, 414–418. [Google Scholar] [CrossRef]
  2. Kim, Y.-J.; Ahn, S.; Sohn, C.H.; Seo, D.-W.; Lee, Y.-S.; Lee, J.H.; Oh, B.J.; Lim, K.S.; Kim, W.Y. Long-term neurological outcomes in patients after out-of-hospital cardiac arrest. Resuscitation 2016, 101, 1–5. [Google Scholar] [CrossRef]
  3. Lee, H.; Shin, H.; Oh, J.; Lim, T.-H.; Kang, B.-S.; Kang, H.; Choi, H.-J.; Kim, C.; Park, J.-H. Association between Body Mass Index and Outcomes in Patients with Return of Spontaneous Circulation after Out-of-Hospital Cardiac Arrest: A Systematic Review and Meta-Analysis. Int. J. Environ. Res. Public Health 2021, 18, 8389. [Google Scholar] [CrossRef]
  4. Lee, J.; Lee, H.; Oh, J.; Lim, T.H.; Kang, H.; Ko, B.S.; Cho, Y.; Korean Cardiac Arrest Research Consortium (KoCARC) Investigators. Association between Initial Serum Cholesterol Levels and Outcomes of Patients Hospitalized after Out-of-Hospital Cardiac Arrest: A Retrospective Multicenter Registry Study. J. Pers. Med. 2022, 12, 233. [Google Scholar] [CrossRef]
  5. Cruz-Jentoft, A.J.; Bahat, G.; Bauer, J.; Boirie, Y.; Bruyère, O.; Cederholm, T.; Cooper, C.; Landi, F.; Rolland, Y.; Sayer, A.A.; et al. Sarcopenia: Revised European consensus on definition and diagnosis. Age Ageing 2019, 48, 16–31. [Google Scholar] [CrossRef]
  6. Lee, B.M.; Cho, Y.; Kim, J.W.; Jeung, H.C.; Lee, I.J. Prognostic Significance of Sarcopenia in Advanced Biliary Tract Cancer Patients. Front. Oncol. 2020, 10, 1581. [Google Scholar] [CrossRef]
  7. Cawthon, P.M.; Peters, K.W.; Shardell, M.D.; McLean, R.R.; Dam, T.-T.L.; Kenny, A.M.; Fragala, M.S.; Harris, T.B.; Kiel, D.P.; Guralnik, J.M.; et al. Cutpoints for Low Appendicular Lean Mass That Identify Older Adults with Clinically Significant Weakness. J. Gerontol. Ser. A 2014, 69, 567–575. [Google Scholar] [CrossRef]
  8. Hong, S.-I.; Kim, K.W.; Ko, Y.; Kim, Y.-J.; Huh, J.W.; Hong, S.-B.; Kim, W.Y. Long-Term Outcomes After In-Hospital Cardiac Arrest: Does Pre-arrest Skeletal Muscle Depletion Matter? Front. Physiol. 2021, 12, 692757. [Google Scholar] [CrossRef]
  9. Bak, S.H.; Kwon, S.O.; Han, S.-S.; Kim, W.J. Computed tomography-derived area and density of pectoralis muscle associated disease severity and longitudinal changes in chronic obstructive pulmonary disease: A case control study. Respir. Res. 2019, 20, 226. [Google Scholar] [CrossRef]
  10. Prado, C.M.M.; Lieffers, J.R.; McCargar, L.J.; Reiman, T.; Sawyer, M.B.; Martin, L.; Baracos, V.E. Prevalence and clinical implications of sarcopenic obesity in patients with solid tumours of the respiratory and gastrointestinal tracts: A population-based study. Lancet Oncol. 2008, 9, 629–635. [Google Scholar] [CrossRef]
  11. Go, S.-I.; Park, M.J.; Song, H.-N.; Kim, H.-G.; Kang, M.H.; Lee, H.R.; Kim, Y.; Kim, R.B.; Lee, S.I.; Lee, G.-W. Prognostic impact of sarcopenia in patients with diffuse large B-cell lymphoma treated with rituximab plus cyclophosphamide, doxorubicin, vincristine, and prednisone. J. Cachexia Sarcopenia Muscle 2016, 7, 567–576. [Google Scholar] [CrossRef]
  12. Cosquéric, G.; Sebag, A.; Ducolombier, C.; Thomas, C.; Piette, F.; Weill-Engerer, S. Sarcopenia is predictive of nosocomial infection in care of the elderly. Br. J. Nutr. 2006, 96, 895–901. [Google Scholar] [CrossRef]
  13. Perkins, G.D.; Jacobs, I.G.; Nadkarni, V.M.; Berg, R.A.; Bhanji, F.; Biarent, D.; Bossaert, L.L.; Brett, S.J.; Chamberlain, D.; Caen, A.R.d.; et al. Cardiac Arrest and Cardiopulmonary Resuscitation Outcome Reports: Update of the Utstein Resuscitation Registry Templates for Out-of-Hospital Cardiac Arrest. Circulation 2015, 132, 1286–1300. [Google Scholar] [CrossRef]
  14. Hirlekar, G.; Jonsson, M.; Karlsson, T.; Hollenberg, J.; Albertsson, P.; Herlitz, J. Comorbidity and survival in out-of-hospital cardiac arrest. Resuscitation 2018, 133, 118–123. [Google Scholar] [CrossRef]
  15. Jennett, B.; Bond, M. Assessment of Outcome After Severe Brain Damage: A Practical Scale. Lancet 1975, 305, 480–484. [Google Scholar] [CrossRef]
  16. Langhelle, A.; Nolan, J.; Herlitz, J.; Castren, M.; Wenzel, V.; Soreide, E.; Engdahl, J.; Steen, P.A. Recommended guidelines for reviewing, reporting, and conducting research on post-resuscitation care: The Utstein style. Resuscitation 2005, 66, 271–283. [Google Scholar] [CrossRef]
  17. Derstine, B.A.; Holcombe, S.A.; Goulson, R.L.; Ross, B.E.; Wang, N.C.; Sullivan, J.A.; Su, G.L.; Wang, S.C. Quantifying Sarcopenia Reference Values Using Lumbar and Thoracic Muscle Areas in a Healthy Population. J. Nutr. Health Aging 2018, 22, 180–185. [Google Scholar] [CrossRef]
  18. Daniel, M.Z.; Caleb Everett, C.; Mark John, M. Radiographic assessment of sarcopenia in the trauma setting: A systematic review. Trauma Surg. Acute Care Open 2020, 5, e000414. [Google Scholar] [CrossRef]
  19. Englesbe, M.J.; Patel, S.P.; He, K.; Lynch, R.J.; Schaubel, D.E.; Harbaugh, C.; Holcombe, S.A.; Wang, S.C.; Segev, D.L.; Sonnenday, C.J. Sarcopenia and Mortality after Liver Transplantation. J. Am. Coll. Surg. 2010, 211, 271–278. [Google Scholar] [CrossRef]
  20. Moon, S.W.; Lee, S.H.; Woo, A.; Leem, A.Y.; Lee, S.H.; Chung, K.S.; Kim, E.Y.; Jung, J.Y.; Kang, Y.A.; Park, M.S.; et al. Reference values of skeletal muscle area for diagnosis of sarcopenia using chest computed tomography in Asian general population. J. Cachexia Sarcopenia Muscle 2022, 13, 955–965. [Google Scholar] [CrossRef]
  21. Moon, S.W.; Choi, J.S.; Lee, S.H.; Jung, K.S.; Jung, J.Y.; Kang, Y.A.; Park, M.S.; Kim, Y.S.; Chang, J.; Kim, S.Y. Thoracic skeletal muscle quantification: Low muscle mass is related with worse prognosis in idiopathic pulmonary fibrosis patients. Respir. Res. 2019, 20, 35. [Google Scholar] [CrossRef]
  22. Mathur, S.; Rodrigues, N.; Mendes, P.; Rozenberg, D.; Singer, L.G. Computed Tomography–Derived Thoracic Muscle Size as an Indicator of Sarcopenia in People With Advanced Lung Disease. Cardiopulm. Phys. Ther. J. 2017, 28, 99–105. [Google Scholar] [CrossRef]
  23. McDonald, M.-L.N.; Diaz, A.A.; Ross, J.C.; San Jose Estepar, R.; Zhou, L.; Regan, E.A.; Eckbo, E.; Muralidhar, N.; Come, C.E.; Cho, M.H.; et al. Quantitative Computed Tomography Measures of Pectoralis Muscle Area and Disease Severity in Chronic Obstructive Pulmonary Disease. A Cross-Sectional Study. Ann. Am. Thorac. Soc. 2014, 11, 326–334. [Google Scholar] [CrossRef]
  24. Tanimura, K.; Sato, S.; Fuseya, Y.; Hasegawa, K.; Uemasu, K.; Sato, A.; Oguma, T.; Hirai, T.; Mishima, M.; Muro, S. Quantitative Assessment of Erector Spinae Muscles in Patients with Chronic Obstructive Pulmonary Disease. Novel Chest Computed Tomography–derived Index for Prognosis. Ann. Am. Thorac. Soc. 2015, 13, 334–341. [Google Scholar] [CrossRef] [PubMed]
  25. Kim, D.W.; Ha, J.; Ko, Y.; Kim, K.W.; Park, T.; Lee, J.; You, M.W.; Yoon, K.H.; Park, J.Y.; Kee, Y.J.; et al. Reliability of Skeletal Muscle Area Measurement on CT with Different Parameters: A Phantom Study. Korean J. Radiol. 2021, 22, 624–633. [Google Scholar] [CrossRef]
  26. Studenski, S.A.; Peters, K.W.; Alley, D.E.; Cawthon, P.M.; McLean, R.R.; Harris, T.B.; Ferrucci, L.; Guralnik, J.M.; Fragala, M.S.; Kenny, A.M.; et al. The FNIH Sarcopenia Project: Rationale, Study Description, Conference Recommendations, and Final Estimates. J. Gerontol. Ser. A 2014, 69, 547–558. [Google Scholar] [CrossRef]
  27. Guralnik, J.M.; Simonsick, E.M.; Ferrucci, L.; Glynn, R.J.; Berkman, L.F.; Blazer, D.G.; Scherr, P.A.; Wallace, R.B. A Short Physical Performance Battery Assessing Lower Extremity Function: Association with Self-Reported Disability and Prediction of Mortality and Nursing Home Admission. J. Gerontol. 1994, 49, M85–M94. [Google Scholar] [CrossRef]
  28. Scott, D.; Park, M.S.; Kim, T.N.; Ryu, J.Y.; Hong, H.C.; Yoo, H.J.; Baik, S.H.; Jones, G.; Choi, K.M. Associations of low muscle mass and the metabolic syndrome in Caucasian and Asian middle-aged and older adults. J. Nutr. Health Aging 2016, 20, 248–255. [Google Scholar] [CrossRef] [PubMed]
  29. Rosenberg, I.H. Sarcopenia: Origins and Clinical Relevance1. J. Nutr. 1997, 127, 990S–991S. [Google Scholar] [CrossRef]
  30. Newman, A.B.; Haggerty, C.L.; Goodpaster, B.; Harris, T.; Kritchevsky, S.; Nevitt, M.; Miles, T.P.; Visser, M.; The Health, Aging, and Body Composition Research Group. Strength and Muscle Quality in a Well-Functioning Cohort of Older Adults: The Health, Aging and Body Composition Study. J. Am. Geriatr. Soc. 2003, 51, 323–330. [Google Scholar] [CrossRef]
  31. Fabiano Di, M.; Silvia, T.; Maria Adelaide, R.; Alice, C.R.; Giulia, M.P.; Anna, V.; Pierachille, S.; Antonio, E.P.; Stefano, C. Physical Activity Impairment in Depressed COPD Subjects. Respir. Care 2014, 59, 726. [Google Scholar] [CrossRef]
  32. Koehler, J.; Boirie, Y.; Bensid, L.; Pereira, B.; Ghelis, N.; Dupuis, C.; Tournadre, A.; Boyer, L.; Cassagnes, L. Thoracic sarcopenia as a predictive factor of SARS-CoV2 evolution. Clin. Nutr. 2022, 41, 2918–2923. [Google Scholar] [CrossRef]
  33. Mourtzakis, M.; Prado, C.M.M.; Lieffers, J.R.; Reiman, T.; McCargar, L.J.; Baracos, V.E. A practical and precise approach to quantification of body composition in cancer patients using computed tomography images acquired during routine care. Appl. Physiol. Nutr. Metab. 2008, 33, 997–1006. [Google Scholar] [CrossRef]
  34. Belger, E.; Truhn, D.; Weber, C.D.; Neumann, U.P.; Hildebrand, F.; Horst, K. The Impact of Body Mass Composition on Outcome in Multiple Traumatized Patients—Results from the Fourth Thoracic and Third Lumbar Vertebrae: A Single-Center Retrospective Observational Study. J. Clin. Med. 2023, 12, 2520. [Google Scholar] [CrossRef]
  35. Kim, Y.S.; Kim, E.Y.; Kang, S.M.; Ahn, H.K.; Kim, H.S. Single cross-sectional area of pectoralis muscle by computed tomography–correlation with bioelectrical impedance based skeletal muscle mass in healthy subjects. Clin. Physiol. Funct. Imaging 2017, 37, 507–511. [Google Scholar] [CrossRef]
  36. Yokosuka, R.; Imai, R.; Ro, S.; Murakami, M.; Okafuji, K.; Kitamura, A.; Tomishima, Y.; Jinta, T.; Nishimura, N.; Tamura, T.; et al. Pectoralis Muscle Mass on Chest CT at Admission Predicts Prognosis in Patients with Pneumonia. Can. Respir. J. 2021, 2021, 3396950. [Google Scholar] [CrossRef]
  37. Herlitz, J.; Ekström, L.; Wennerblom, B.; Axelsson, Å.; Bång, A.; Holmberg, S. Prognosis Among Survivors of Prehospital Cardiac Arrest. Ann. Emerg. Med. 1995, 25, 58–63. [Google Scholar] [CrossRef]
  38. López-Herce, J.; García, C.; Rodríguez-Núñez, A.; Domínguez, P.; Carrillo, A.; Calvo, C.; Delgado, M.A. Long-term outcome of paediatric cardiorespiratory arrest in Spain. Resuscitation 2005, 64, 79–85. [Google Scholar] [CrossRef]
Figure 1. Cross-sectional CT images of the SMA indicated in purple. (A) L3 level SMA, (B) psoas muscle area, (C) T4 level SMA, and (D) pectoralis muscle area. Abbreviations: CT, computed tomography; L3, the third lumbar vertebra; SMA, skeletal muscle area; T4, the fourth thoracic vertebra.
Life 14 00680 g001
Figure 2. Patient flow diagram. Abbreviations: CPC, cerebral performance category; CT, computed tomography; OHCA, out-of-hospital cardiac arrest; TTM, targeted temperature management.
Life 14 00680 g002
Table 1. Baseline characteristics of patients with OHCA.
Abdominal CT Group (n = 78)
Good Neurological Outcome
(n = 18)
Poor Neurological Outcome
(n = 60)
p ValueSurvival
(n = 41)
Death
(n = 37)
p Value
Age58.5 [48.0–66.0]65.0 [52.0–74.0]0.26762.0 [47.0–69.0]65.0 [60.0–75.0]0.064
Men15 (83.3)39 (65.0)0.23532 (78.0)22 (59.5)0.126
BMI (kg/m2)23.0 ± 3.924.1 ± 4.10.31023.4 ± 4.024.3 ± 4.20.336
Smoking 0.357 0.710
Current6 (33.3)12 (20.0) 11 (26.8)7 (18.9)
Ex-smoker3 (16.7)7 (11.7) 5 (12.2)5 (13.5)
Non-smoker9 (50.0)41 (68.3) 25 (61.0)25 (67.6)
CCI2.5 [1.0–4.0]3.5 [2.0–6.5]0.1463.0 [1.0–5.0]4.0 [2.0–8.0]0.146
Witnessed arrest14 (77.8)38 (63.3)0.39233 (80.5)19 (51.4)0.013
Location 0.007 0.376
Residence3 (16.7)34 (56.7) 17 (41.5)20 (54.1)
Other15 (83.3)26 (43.3) 24 (58.5)17 (45.9)
Bystander CPR14 (77.8)35 (58.3)0.22326 (63.4)23 (62.2)1.000
Shockable rhythm11 (61.1)9 (15.0)<0.00115 (36.6)5 (13.5)0.038
Cardiogenic cause14 (77.8)17 (28.3)<0.00119 (46.3)12 (32.4)0.307
Arrest time a (mins)22.5 [13.0–41.0]35.5 [22.5–44.0]0.10032.0 [21.0–42.0]33.0 [18.0–44.0]0.984
PCI7 (38.9)6 (10.0)0.0129 (22.0)4 (10.8)0.311
ECMO 0.114 0.272
ECPR0 (0.0)1 (1.7) 1 (2.4)0 (0.0)
after ROSC3 (16.7)2 (3.3) 4 (9.8)1 (2.7)
No ECMO15 (83.3)57 (95.0) 36 (87.8)36 (97.3)
Target body temperature 0.545 0.955
33 °C4 (22.2)20 (33.3) 12 (29.3)12 (32.4)
36 °C14 (77.8)40 (66.7) 29 (70.7)25 (67.6)
NSE37.7 [17.0–50.9]198.5 [55.4–300.0]0.00161.0 [37.7–300.0]198.5 [47.6–300.0]0.350
Initial PaO2
(mmHg)
137.7 [62.8–235.6]102.5 [72.5–162.1]0.294106.4 [75.7–187.4]105.6 [64.8–177.5]0.503
PaO2 after 4 h (mmHg)159.2 [73.6–179.5]121.7 [89.1–241.8]0.631164.2 [94.0–238.5]116.0 [83.0–217.0]0.376
Initial PaCO2 (mmHg)46.0 ± 19.572.4 ± 28.7<0.00157.3 [41.1–80.6]67.0 [52.5–84.8]0.596
PaCO2 after 4 h (mmHg)37.4 [33.7–43.2]47.9 [36.8–56.6]0.02941.0 [33.7–51.9]45.4 [39.3–55.6]0.211
Time from arrest to CT (days)0.0 [0.0–0.0]0.0 [0.0–0.0]0.0770.0 [0.0–0.0]0.0 [0.0–0.0]0.625
Chest CT Group (n = 162)
Good Neurological Outcome
(n = 41)
Poor Neurological Outcome
(n = 121)
pValueSurvival
(n = 91)
Death
(n = 71)
pValue
Age59.0 [47.0–66.0]64.0 [49.0–74.0]0.08559.0 [43.5–70.5]65.0 [55.0–74.0]0.040
Men36 (87.8)77 (63.6)0.00768 (74.7)45 (63.4)0.165
BMI (kg/m2)23.3 [22.0–26.0]23.5 [21.1–26.2]0.76723.9 ± 4.123.3 ± 4.60.357
Smoking 0.317 0.174
Current14 (34.1)29 (24.0) 29 (31.9)14 (19.7)
Ex-smoker7 (17.1)17 (14.0) 14 (15.4)10 (14.1)
Non-smoker20 (48.8)75 (62.0) 48 (52.7)47 (66.2)
CCI2.0 [1.0–4.0]4.0 [1.0–6.0]0.0133.0 [0.5–5.0]4.0 [2.0–7.5]0.004
Witnessed arrest33 (80.5)73 (60.3)0.03170 (76.9)36 (50.7)0.001
Location 0.002 0.115
Residence9 (22.0)63 (52.1) 35 (38.5)37 (52.1)
Other32 (78.0)58 (47.9) 56 (61.5)34 (47.9)
Bystander CPR34 (82.9)73 (60.3)0.01468 (74.7)39 (54.9)0.013
Shockable rhythm29 (70.7)19 (15.7)<0.00140 (44.0)8 (11.3)<0.001
Cardiogenic cause33 (80.5)43 (35.5)<0.00152 (57.1)24 (33.8)0.005
Arrest time a (mins)20.0 [13.0–28.0]33.0 [20.0–44.0]0.00125.0 [15.0–39.0]37.0 [21.0–45.0]0.005
PCI15 (36.6)9 (7.4)<0.00118 (19.8)6 (8.5)0.073
ECMO 0.278 0.454
ECPR1 (2.4)1 (0.8) 2 (2.2)0 (0.0)
after ROSC4 (9.8)5 (4.1) 5 (5.5)4 (5.6)
No ECMO36 (87.8)115 (95.0) 84 (92.3)67 (94.4)
Target body temperature 0.035 0.960
33 °C7 (17.1)44 (36.4) 28 (30.8)23 (32.4)
36 °C34 (82.9)77 (63.6) 63 (69.2)48 (67.6)
NSE24.6 [17.6–37.7]206.5 [48.5–300.0]<0.00144.8 [27.1–221.1]235.6 [55.4–300.0]0.003
Initial PaO2 (mmHg)106.4 [68.3–212.2]99.4 [64.8–160.8]0.28992.4 [65.8–184.9]115.1 [67.5–178.4]0.510
PaO2 after 4 h (mmHg)134.9 [87.5–193.3]135.8 [88.2–230.4]0.739140.2 [88.0–204.3]123.9 [85.6–229.0]0.939
Initial PaCO2 (mmHg)44.6 [30.3–59.4]71.4 [52.9–86.4]<0.00158.0 [41.4–78.8]68.8 [52.0–87.0]0.038
PaCO2 after 4 h (mmHg)41.0 [34.3–48.7]46.0 [36.7–55.1]0.05145.8 [36.3–52.5]45.1 [35.6–54.9]0.991
Time from arrest to CT (days)0.0 [0.0–0.0]0.0 [0.0–0.0]0.0770.0 [0.0–0.0]0.0 [0.0–0.0]0.625
a For unwitnessed cardiac arrest, arrest time was calculated from the time of the emergency call. Data are presented as the mean ± standard deviation, median [interquartile range], or number (percentage). Percentages may not total up to100 due to rounding. Abbreviations: BMI, body mass index; CCI, Charlson Comorbidity Index; CPR, cardiopulmonary resuscitation; CT, computed tomography; ECMO, extracorporeal membrane oxygenation; ECPR, extracorporeal cardiopulmonary resuscitation; OHCA, out-of-hospital cardiac arrest; PCI, percutaneous coronary intervention; ROSC, return of spontaneous circulation.
Table 2. Cutoff values for the SMI of L3/BMI, psoas/BMI, T4/BMI, and pectoralis/BMI.
Good Neurological OutcomeSurvival
Cutoff ValueCutoff Value
MenWomenMenWomen
L3/BMI5.89943.55126.4894.6331
Psoas/BMI0.77030.31520.77030.5832
T4/BMI5.46584.97395.77174.9545
Pectoralis/BMI2.16481.5312.27671.7563
Abbreviations: L3/BMI, the third lumbar vertebra level muscle area/body mass index; pectoralis/BMI, pectoralis muscle area/body mass index; psoas/BMI, psoas muscle area/body mass index; SMI, skeletal muscle index; T4/BMI, the fourth thoracic vertebra level muscle area/body mass index.
Table 3. Low SMI outcomes.
Good Neurological Outcome (n = 18)Poor Neurological Outcome (n = 60)p ValueSurvival
(n = 41)
Death
(n = 37)
p Value
Low L3/BMI6 (33.3)28 (46.7)0.46625 (61.0)29 (78.4)0.156
Low psoas/BMI6 (33.3)29 (48.3)0.39422 (53.7)30 (81.1)0.020
Good Neurological Outcome (n = 41)Poor Neurological Outcome (n = 121)p ValueSurvival
(n = 91)
Death
(n = 71)
p Value
Low T4/BMI6 (14.6)68 (56.2)<0.00135 (38.5)48 (67.6)<0.001
Low pectoralis/BMI14 (34.1)78 (64.5)0.00149 (53.8)53 (74.6)0.011
Values are expressed as numbers (percentages). Percentages may not total up to 100 due to rounding. Abbreviations: L3/BMI, the third lumbar vertebra level muscle area/body mass index; pectoralis/BMI, pectoralis muscle area/body mass index; psoas/BMI, psoas muscle area/body mass index; SMI, skeletal muscle index; T4/BMI, the fourth thoracic vertebra level muscle area/body mass index.
Table 4. Multivariable logistic analysis for good neurological outcomes and survival at hospital discharge.
Good Neurological OutcomeSurvival
Adjusted OR
(95% CI)
p ValueAdjusted OR
(95% CI)
p ValueAdjusted OR
(95% CI)
p ValueAdjusted OR
(95% CI)
p ValueAdjusted OR
(95% CI)
p Value
Low psoas/BMI 0.38 (0.11–1.19)0.102
Low T4/BMI0.22 (0.05–0.76)0.021 0.56 (0.24–1.31)0.182
Low pectoralis/
BMI
0.49 (0.15–1.55)0.222 0.80 (0.33–1.96)0.620
Age1.00 (0.95–1.04)0.9371.00 (0.96–1.05)0.9260.98 (0.95–1.01)0.3001.00 (0.97–1.03)0.7951.00 (0.97–1.03)0.886
Men1.15 (0.28–5.09)0.8451.94 (0.55–7.82)0.3181.79 (0.58–5.71)0.3150.99 (0.41–2.36)0.9811.13 (0.49–2.64)0.769
CCI0.97 (0.72–1.28)0.8180.91 (0.68–1.19)0.498 0.84 (0.68–1.02)0.0890.81 (0.66–0.99)0.039
Witnessed arrest1.85 (0.51–7.37)0.3591.93 (0.57–7.14)0.3023.42 (1.18–10.68)0.0273.13 (1.38–7.38)0.0073.40 (1.52–7.94)0.004
Location (Residence)0.47 (0.14–1.44)0.1930.46 (0.14–1.40)0.182
Bystander CPR5.15 (1.46–22.66)0.0184.76 (1.40–19.97)0.020 2.09 (0.94–4.71)0.0712.02 (0.92–4.53)0.082
Shockable rhythm3.31 (0.93–12.70)0.0683.20 (0.91–12.09)0.0742.34 (0.70–8.71)0.1793.72 (1.15–12.95)0.0323.77 (1.18–12.94)0.029
Cardiogenic cause2.72 (0.65–11.57)0.1662.82 (0.69–11.51)0.142 1.29 (0.50–3.34)0.5971.28 (0.50–3.28)0.603
Arrest time0.96 (0.93–0.99)0.0230.96 (0.93–0.99)0.020 0.97 (0.95–0.99)0.0110.97 (0.95–0.99)0.011
PCI4.20 (1.04–19.75)0.0533.84 (0.96–17.76)0.067
This table presents the results of multivariable logistic analysis of SMIs with clinical significance to the outcomes in the univariable analysis. Column 1 represents the results of low T4/BMI and covariates, and column 2 represents the results of low pectoralis/BMI and covariates to good neurological outcome. Columns 3–5 represent the results of low psoas/BMI, low T4/BMI, and low pectoralis/BMI with covariates to survival, respectively. Abbreviations: BMI, body mass index; CCI, Charlson Comorbidity Index; CI, confidence interval; CPR, cardiopulmonary resuscitation; OR, odds ratio; PCI, percutaneous coronary intervention; pectoralis/BMI, pectoralis muscle area/body mass index; psoas/BMI, psoas muscle area/body mass index; SMI, skeletal muscle index; T4/BMI, the fourth thoracic vertebra level muscle area/body mass index.
Disclaimer/Publisher’s Note: The statements, opinions and data contained in all publications are solely those of the individual author(s) and contributor(s) and not of MDPI and/or the editor(s). MDPI and/or the editor(s) disclaim responsibility for any injury to people or property resulting from any ideas, methods, instructions or products referred to in the content.

