Abstract
Obesity is linked to the increasing prevalence of metabolic syndrome (MetS), even among the pediatric population. Some inflammatory and cardioembolic indexes derived from routine laboratory tests have captivated the attention of the medical community. Objectives: The aim of our study was to evaluate whether these markers are effective in distinguishing varying degrees of obesity and MetS in children and adolescents. Methods: We conducted a retrospective study. A total of 71 children and adolescents, aged between 6 and 16, were included in the study. Among them, 5 were overweight, 35 had obesity, and 31 had severe obesity. According to the NCEP ATP III criteria, 32 individuals had Metabolic Syndrome (MetS), while 39 did not have MetS. Results: The MetS positive group had higher values of TG/HDL-C (p < 0.001), TC/HDL-C (p < 0.001), MHR (p = 0.015), LHR (p = 0.001), NHR (p = 0.001), atherogenic index of plasma (p < 0.001), and PHR (p < 0.001). ESR, NLR, PLR, and SII did not progressively increase with the number of MetS criteria. The ROC curve analysis demonstrated that markers such as TG/HDL-C, the atherogenic index of plasma, TC/HDL-C, LHR, NHR, and PHR were effective in identifying MetS in children and adolescents with obesity. Conclusions: In conclusion, we determined that some novel inflammatory and cardioembolic indexes are useful in assessing MetS and obesity in children and adolescents.
1. Introduction
For many decades, the topic of weight dysregulation in the pediatric population has had its atten tion set on the spectrum of malnutrition [1]. Many programs have been focusing on ending it, especially for children in low-income countries [2]. Currently, with urbanization [3] and the increase in the prevalence of processed food and its availability all over the world [4], a new enemy is rapidly emerging in the form of overweight and obesity, with a devastating impact on the general health of both adult and pediatric populations [5]. In both middle-income and low-income countries, the percentage of children and adolescents with excess weight builds up every year according to statistics [6], with a coexistence of malnutrition in the same populations, a phenomenon called “the double burden of nutrition” [2,7].
According to the Centers for Disease Control and Prevention (CDC), before the COVID-19 pandemic, the prevalence of obesity among the pediatric population was on an ascending slope [8]. Epidemiologic reports of obesity prevalence in various countries are showing a rapid increase in weight gain across all age groups and socioeconomic categories [9,10,11,12]. As some studies report, children that are affected by obesity tend to become adults not only with obesity, but with morbid obesity, which considerably raises predisposition to chronic medical issues over the years [13]. Also, exposure to obesogenic factors during early childhood predisposes one to an increased risk for metabolic syndrome (MetS) in adults [14].
Obesity is mainly characterized by excessive fat accumulation, with a complex ethology, involving genetic and environmental factors [15]. Its link with MetS, a pathology defined by central obesity, hypertension, insulin resistance, and dyslipidemia, is well known [16]. Even though there is a direct association, not all children with obesity develop MetS, with the literature describing these persons as metabolically healthy obese [17].
Even though the fact that MetS is affecting more and more children and adolescents, is undeniable [18,19], the criteria used to diagnose this pathology in the pediatric population is still controversial because it is not clear yet which definition is better used, which are the right cutoff points for each criterion, what is the clinical significance, and how accurate it is in determining the risk of developing cardiovascular diseases (CVD) and type 2 diabetes mellitus (T2DM) [20].
Both simple obesity and MetS have been associated with a degree of low-grade inflammation [21,22]. The clear physiopathology behind MetS is not yet fully understood, but more and more reports show an increase in proinflammatory cytokines [23,24] due to the fact that metabolic disturbances lead to immune activation especially in the adipose tissue [25,26,27,28] and individuals often present with elevated plasma markers of chronic low-grade inflammation [29,30], which can lead to a lot of serious consequences in the future [31,32,33,34,35,36].
Studies indicate that the atherosclerotic process can start during childhood, with atherogenic dislipidemia becoming more prevalent in the younger population affected by obesity. Also, the presence of atherogenic dislipidemia, along with MetS, significantly elevates the risk of developing CVD sooner or later [37].
In the adult population, good predictors of cardiovascular risk assessment are lipid ratios, such as the triglyceride (TG) to high-density lipoprotein cholesterol (HDL-C) ratio (TG/HDL-C) and total cholesterol (TC) to HDL-C ratio (TC/HDL-C) [38]. Also, the TG/HDL-C ratio was used to identify individuals with insulin resistance [39] and to detect carotid artery intima–media thickness in both adults and children [40,41]. The non-HDL-C showed a strong association with MetS risk for CVD [42,43].
Many studies have investigated the best inflammatory markers to detect the low-grade inflammation associated with obesity and MetS. However, in clinical practice, these markers must be widely available, reproducible, and, very importantly, affordable for routine use in most healthcare settings. When a child or adolescent with overweight or obesity is examined, basic paraclinical tests also include a complete blood count (CBC), TG, TC, and HDL-C, as they are mandatory for sustaining the diagnosis. Therefore, novel inflammatory and cardioembolic markers such as the neutrophils to lymphocytes ratio (NLR), platelets to lymphocytes ratio (PLR), neutrophils to HDL-C ratio (NHR), monocytes to HDL-C ratios (MHR), lymphocyte to HDL-C ratio (LHR), platelets to HDL-C ratio (PHR), Systemic Immune-Inflammation Index (SII), and the Atherogenic index of plasma are interesting tools used by clinicians [44].
The aim of our study was to investigate if these markers are reliable in differentiating between children and adolescents with obesity with different grades of obesity and MetS.
2. Materials and Methods
2.1. Study Design
We conducted a retrospective study, in which we assessed children and adolescents aged between 6 and 16 years, diagnosed with obesity or overweight. A systematic search was conducted in the archives of the Clinical Emergency County Hospital of Craiova, and patient data were collected from the medical records. The inclusion criterion for the initial search was represented by the presence of overweight or obesity, determined by a body mass index (BMI) ≥ 85th percentile, calculated in accordance with the CDC criteria in relation to age and gender. Our search was restricted to the last three and a half years (January 2021 to July 2024). The International Classification of Diseases, Tenth Revision (ICD-10) codes for the diagnosis of obesity (E66.0, E66.3, E66.8, and E66.9) and a manual search in the patient’s record were used to identify the subjects eligible for our study.
After that, we excluded the patients that were younger than 6 years of age and older than 16 years of age. Also, patients with T2DM, secondary obesity (genetic syndromes, monogenic obesity, endocrine pathology), chronic disease or history of acute infection in the last 3 months (including COVID-19), children with leukopenia (<4 × 10⁹/L), leukocytosis (>13 × 109/L), anemia or thrombocytopenia (<150 × 109/L), a history of drug use that could affect the CBC parameters or bodyweight were not taken into consideration. From the remaining patients, we only extracted the data from the patients that had all the parameters needed for our analysis.
The parameters of interest were age, gender, weight, height, abdominal perimeter or mention about the percentile of the abdominal perimeter, systolic blood pressure (SBP), diastolic blood pressure (DBP), fasting blood glucose (referred as glycemia), triglycerides, total cholesterol (TC), high-density lipoprotein cholesterol (HDL-C), erythrocyte sedimentation rate (ESR), hemoglobin, leucocytes (absolute value), lymphocytes (absolute value), neutrophils (absolute value), platelets (absolute value), basophiles (absolute value) and, where it was available, C-reactive protein (CRP), which was only used as a double check for acute disorders, and not used as a parameter for the current research.
The data were extracted by the investigators in a predefined Excel worksheet. No personal data of the patients was stored. For each individual, a random code was assigned instead of name in order to keep order, but it served no purpose in the further processing of data.
2.2. Subjects Included in the Study
The final lot of study was composed of 71 children and adolescents with overweight and obesity and a waist circumference greater than the 90th percentile for age and sex. In this group, there were 48 boys and 23 girls.
None of the children and adolescents included in the study were on any medication or diagnosed with any other acute or chronic condition, including COVID-19, at the moment of the examination according to the data stated in their medical file. All patients were Caucasians (Non-Hispanic Whites) and originated from the south-west of Romania (Oltenia region).
Subjects were divided into groups according to the presence or absence of MetS (MetS− and MetS+ group), the category of BMI according to age and sex using the CDC criteria (overweight, obesity, and severe obesity) and according to the number of MetS diagnosis criteria (1 MetS diagnosis criteria, 2 MetS diagnosis criteria, 3 MetS diagnosis criteria, 4 MetS diagnosis criteria, and 5 MetS diagnosis criteria).
2.3. Clinical Assessment and Anthropometric Measurements
The patient’s history was assessed in order to identify the eligible cases, and the epidemiological data represented by age and gender were recorded.
The weight and height were important anthropometric data that we collected, which was performed using standardized measurement methods. For height measurement, a thaliometer with a scale of 1 mm, and for weight, a dedicated monitor for determining weight (gradation of 100 g) was used.
BMI was calculated using Excel, for the minimization of human errors, using the formula: BMI = Weight/Height2. Weight was measured in kilograms (kg) and height was measured in meters (m).
The percentile for BMI was calculated on the official website of the CDC and required data regarding the measurement units (we used the metric units), the gender, age, height and weight of every subject [45]. The BMI and the corresponding percentile and BMI category were automatically displayed. Obesity and overweight were defined according to BMI as it follows:
- Overweight: 85th to 94th percentile;
- Obesity: 95th to 99th percentile or BMI > 30 kg/m2;
- Severe obesity: >120 percent of the 95th percentile or BMI > 35 kg/m2.
Blood pressure was measured with an electronic tensiometer after a period of 5 to 10 min of rest. In order to determine the percentile for blood pressure, we used an online platform widely used for this purpose [46,47]. This software uses the guidelines of the CDC and takes into account the gender, height, and systolic and diastolic blood pressure. The 90th percentile of blood pressure was considered the threshold between normal and high blood pressure. Even though a value between the 90th and 95th percentile is defined as prehypertension, between 95th and 99th as grade I hypertension, and over 99th as grade II hypertension, for the current study, and in concordance with the diagnostic NCEPT-ATP III criteria for MetS in children and adolescents [48], we considered all the values above the 90th percentile as hypertension.
2.4. Laboratory Analysis
A blood sample was obtained after a minimum of 8 h of fasting, in the morning, by phlebotomy by a qualified nurse. All the probes were processed by automatic, standardized laboratory techniques.
2.5. Definitions Used and Formulas
For the definition of MetS, we used the NCEP-ATP III adapted for children and adolescents. For a positive diagnosis, at least 3 out of 5 of the following criteria should be met:
- Central obesity with WC ≥ 90th percentile for age and sex,
- TG ≥ 110 mg/dL,
- HDL-C ≤ 40 mg/dL,
- Blood pressure (systolic or diastolic) ≥ 90th percentile for age and sex,
- Fasting blood glucose ≥ 100 mg/dL [48].
In our study, all the participants met the criteria for central obesity. For a positive MetS diagnosis, participants needed to meet at least two additional criteria, other than central obesity.
All the children and adolescents with BMI modifications included in the study were divided into 2 groups according to the presence and absence of MetS (MetS− and MetS+ groups). Additionally, to assess the cumulative impact of the severity MetS on the inflammatory and cardioembolic indexes, we divided the subjects into groups based on the number of MetS diagnostic criteria they met, ranging from 1 to 5.
The following formulas were used for the calculation of the inflammatory indexes:
- Neutrophil to lymphocyte ratio (NLR) = neutrophil count (109/L)/lymphocyte count (109/L);
- Platelets to lymphocytes ratio (PLR) = platelets count (109/L)/lymphocyte count (109/L);
- Systemic inflammatory index (SII) = neutrophils (109/L) × platelets (109/L)/lymphocytes (109/L);
- Neutrophil to HDL-C ratio (NHR) = neutrophil count (109/L)/HDL-C (mg/dL);
- Lymphocyte to HDL-C ratio (LHR) = lymphocyte count (109/L)/HDL-C (mg/dL);
- Monocytes to HDL-C ratio (MHR) = monocytes count (109/L)/HDL-C (mg/dL);
- Platelets to HDL-C ratio (PHR) = platelets count (109/L)/HDL-C (mg/dL).
For the cardioembolic risk indexes, we used the formulas stated bellow:
- TG/HDL-C ratio = total triglycerides (mg/dL)/HDL-C (mg/dL);
- TC/HDL-C ratio = total cholesterol (mg/dL)/HDL-Cholesterol (mg/dL);
- non-HDL-C = total cholesterol (mg/dL) − HDL-C (mg/dL);
- Atherogenic index of plasma = log10(TG/HDL-C).
2.6. Statistical Analysis
For the initial data gathering, Microsoft® Excel® 2021 MSO (Version 2406 Build 16.0.17726.20078) was used. Statistical analysis of the data were conducted with SPSS 26.0 (SPSS Inc., Chicago, IL, USA).
When in need, English editing was performed using ChatGPT version 4o (OpenAI, San Francisco, CA, USA).
Due to the small size of the group, we used the Shapiro–Wilk test to assess the normality and linearity of the data. This test is a reliable method for determining whether a sample follows a normal distribution, a fundamental assumption for many statistical analyses [49]. Most of the variables did not meet the normality assumptions, likely due to the wide age range of the subjects and the relatively small sample size. Therefore, we employed non-parametric methods to summarize and describe the relationships between the variables.
The following variables were normally distributed: BMI (p = 0.052), SBP (p = 0.106), DBP (p = 0.758), TC (p = 0.067), and HDL-C (p = 0.181). However, glycemia, triglycerides, all CBC markers except for basophils (p = 0.063), and the inflammatory indexes, except for the atherogenic index of plasma (p = 0.085) were not normally distributed, with p-values less than 0.05.
Continuous variables were represented as mean ± standard deviation (SD), median and interquartile range were expressed as 25th percentile (corresponding to the 1st Quartile) and 75th percentile (corresponding to the 3rd Quartile), while categorical variables were expressed in terms of frequencies or percentages.
All the tables and figures included in the present article were generated and edited using the SPSS software.
3. Results
A total of 71 children and adolescents aged between 6 and 16, with a median age of 10.96 ± 2.653 years were included in the study, out of which 67.6% (n = 48) were male and 32.4% (n = 23) were female. All of the included subjects had a waist circumference > the 90th percentile for age and sex. According to the CDC’s classification, 7% (n = 5) of individuals were diagnosed with overweight, 49.3% (n = 35) with obesity, and 43.7% (n = 31) with severe obesity. The medium BMI of all children and adolescents included in the study was 28.15 ± 3.81 kg/m2 (Minimum = 21.08 kg/m2 and Maximum = 38.982 kg/m2). As weight and height are closely dependent on age, we have chosen to use BMI as a more appropriate marker for obesity, being a reliable indicator across different ages. By using BMI, we assess and compare obesity levels more accurately, with no restrictions of the age-related variations of weight and height.
According to the NCEP ATP III criteria adapted for children and adolescents, a positive diagnosis of MetS requires meeting at least three out of five criteria. We found that 45.1% (n = 32) of the subjects in the study met three or more criteria for MetS, placing them in the MetS+ group, while the remaining 54.9% (n = 39) were categorized in the MetS− group. The groups of children and adolescents meeting four or five MetS criteria had the fewest members, with seven (9.9%) and five (7%) individuals, respectively. The best-represented groups, totaling 50.6%, included those who met two criteria (n = 23, 32.4%) and those who met three criteria (n = 20, 28.2%). The group with one MetS criterion included 16 individuals, representing 22.5% of the total. Overall, 45.1% (n = 32) subjects had DBP > 90th percentile, 43.7% (n = 31) had SBP > 90th percentile, 14.1% (n = 10) had basal glucose (glycemia) > 100 mg/dL, and 31% (n = 22) had triglycerides > 110 mg/dL. The most encountered abnormal paraclinical parameter was HDL-C that was found to be less than 40 mg/dL in 45.1% (n = 32) of children and adolescents with overweight or obesity, and, also, in the MetS group it was modified in 25 out of 32 subjects (78.12%). In Table S1, the mean and median values are presented, along with 25th and 75th percentiles of every parameter according to the presence of the MetS diagnostic criteria.
We determined that gender has no impact on MetS prevalence by using Fisher’s exact test (p = 0.802).
We used a Mann–Whitney U test and determined that the MetS+ group had significantly higher values in terms of DBP (p = 0.035), SBP (p = 0.028), and triglycerides (p < 0.001) than those found in the MetS− group, while the HDL-C values (p < 0.001) were significantly lower. No significant differences were found in fasting blood glucose (p = 0.295) and total cholesterol (p = 0.972) between the two groups. For a comprehensive overview of the data, please refer to Table S1, which provides detailed information and insights, enabling a deeper understanding of the results discussed.
The BMI value in the MetS+ group is a little bit higher but, when it comes to BMI distribution among MetS+ and MetS− groups, there was no statistical difference (p = 0.716), as can be observed in Figure 1 and Table S2.
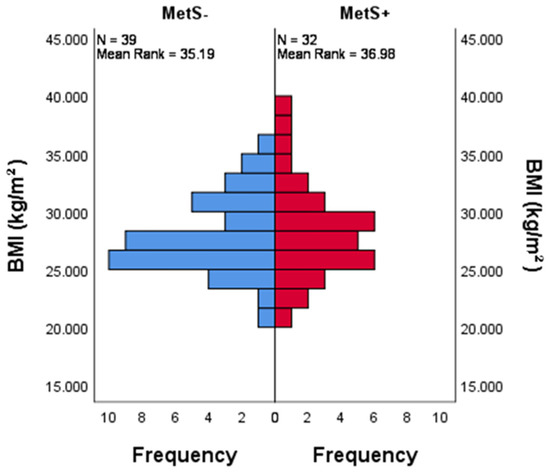
Figure 1.
The distribution of BMI across categories of MetS. Bar chart showing there is an even distribution of BMI among the MetS+ and MetS− groups, which was determined using the non-parametric Mann–Whitney U test. p = 0.716.
In Table S3 we presented the mean values of clinical and paraclinical parameters associated with MetS divided by the number of MetS criteria. We can observe there is an unequivocal increase in BMI, DBP, SBP, glycemia, and triglycerides and a decrease in HDL-C values with every increase in the MetS criteria number and, respectively, severity.
A Mann–Whitney U test was performed to evaluate if the distribution of CBC parameters, ESR, inflammatory and cardioembolic indexes in the MetS+ group are different from the ones in the MetS− group. The distribution of leukocytes, lymphocytes, neutrophils, monocytes, platelets, basophiles, NLR, PLR, SII, non-HDL-C, and ESR is the same across categories of MetS, with a p > 0.05. On the other hand, the atherogenic index of plasma, TG/HDL-C, TC/HDL-C, MHR, LHR, NHR, and PHR is not evenly distributed among MetS+ and MetS− groups. More details can be found in Table S4.
Also, children and adolescents with MetS+ had higher values of TG/HDL-C (p < 0.001), TC/HDL-C (p < 0.001), MHR (p = 0.015), LHR (p = 0.001), NHR (p = 0.001) atherogenic index of plasma (p < 0.001), and PHR (p < 0.001). The graphical representation can be found in Figure 2.
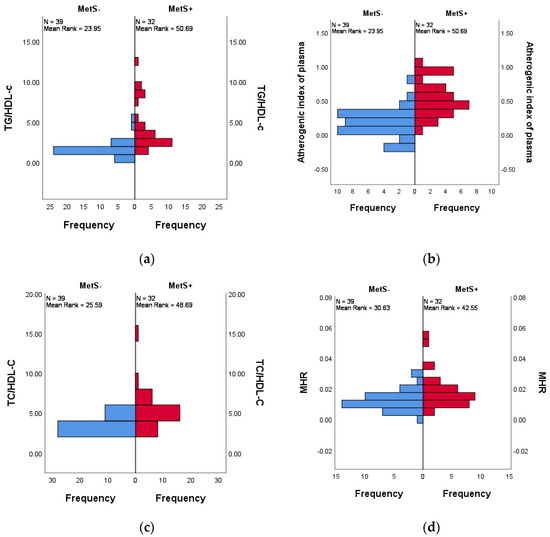
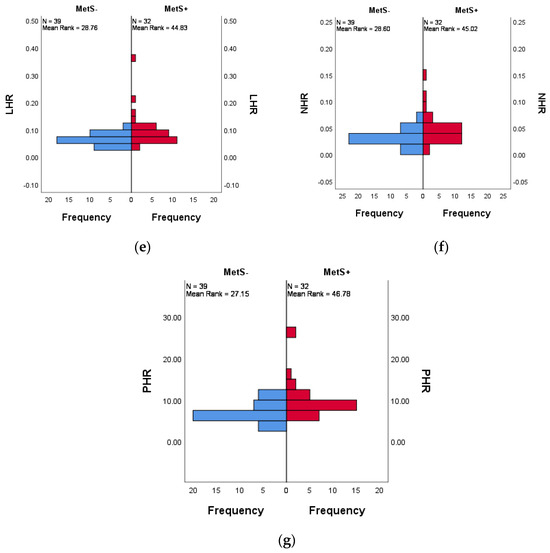
Figure 2.
Distribution across MetS+ and MetS− groups of (a) TG/HDL-C (p < 0.001), (b) atherogenic inflammatory indexes (p < 0.001), (c) TC/HDL-C (p < 0.001), (d) MHR (p = 0.015.), (e) LHR (p = 0.001), (f) NHR (p = 0.001), (g) PHR (p < 0.001). The difference between the MetS groups for each index was determined using the non-parametric Mann–Whitney U test, with a statistical significance at p < 0.05.
The Kruskal–Wallis test was conducted to evaluate differences in inflammatory and cardioembolic indexes across groups divided by number of MetS criteria. The findings suggest that the atherogenic index of plasma, TG/HDL-C, TC/HDL-C, MHR, LHR, NHR, and PHR varies significantly across these groups. While, on the other hand, ESR, NLR, PLR, and SII, are not significantly different (p > 0.05), when divided according to the number of MetS criteria met.
The pairwise comparison of number of MetS criteria was analyzed and the significance values have been adjusted by the Bonferroni correction for multiple tests. The TG/HDL-C (p < 0.001), atherogenic index of plasma (p < 0.001), TG/HDL-C (p < 0.001), TC/HDL-C (p < 0.001), MHR (p = 0.003), LHR (p = 0.001), NHR (p = 0.004), and PHR (p < 0.001) were progressively increased with the number of MetS components, as shown in Figure 3.
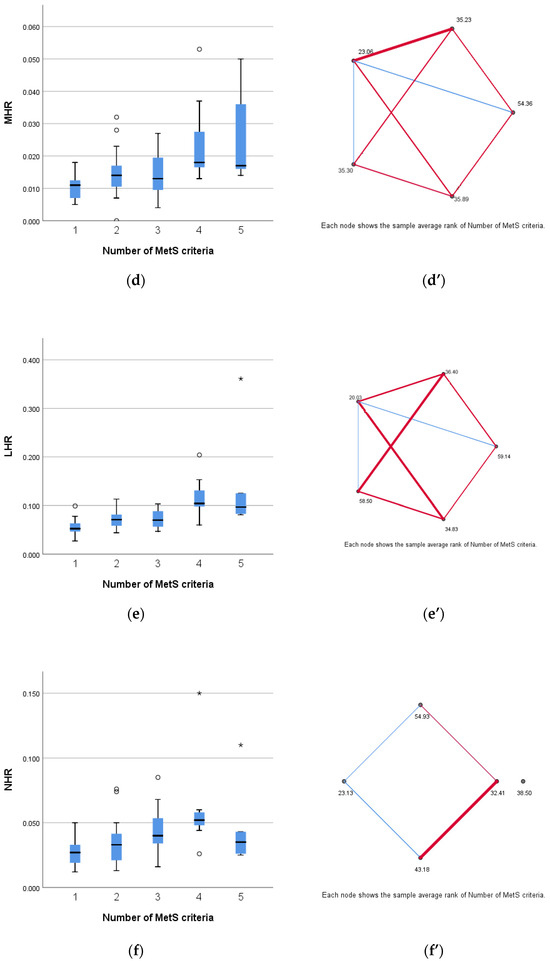
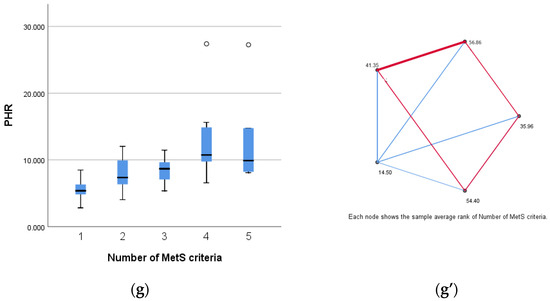
Figure 3.
Distribution according to number of MetS number of criteria of (a) TG/HDL-C (p < 0.001), (b) atherogenic inflammatory index (p < 0.001), (c) TC/HDL-C (p < 0.001), (d) MHR (p = 0.003), (e) LHR (p = 0.001), (f) NHR (p = 0.004), and (g) PHR (p < 0.001). (a’–g’) Pairwise comparison of number of MetS criteria for each parameter. The nodes connected by red lines suggest a stronger association between the parameters assessed and the categories divided according to number of MetS criteria, while the blue lines indicate a weaker association between the before mentioned groups. The difference between the MetS groups for each index was determined using the non-parametric Mann–Whitney U test, with a statistical significance at p < 0.05.
ROC curve analysis (Figure 4) shows that TG/HDL-C (AUC = 0.877 [95% CI 0.795 to 0.959], p < 0.001), the atherogenic index of plasma (AUC = 0.877 [95% CI 0.795 to 0.959], p < 0.001), TC/HDL-C (AUC = 0.825 [95% CI 0.726 to 0.924], p < 0.001), LHR (AUC = 0.726 [95% CI 0.608 to 0.844], p = 0.001), NHR (AUC = 0.731 [95% CI 0.612 to 0.851], p = 0.001), and PHR (AUC = 0.776 [95% CI 0.669 to 0.884], p < 0.001) had a significant discriminative ability in correctly identify MetS in children and adolescents with obesity, while MHR (AUC = 0.668 [95% CI 0.540 to 0.796], p = 0.015) and non-HDL-C (AUC = 0.625 [95% CI 0.492 to 0.758], p < 0.071) had a better specificity at higher values.
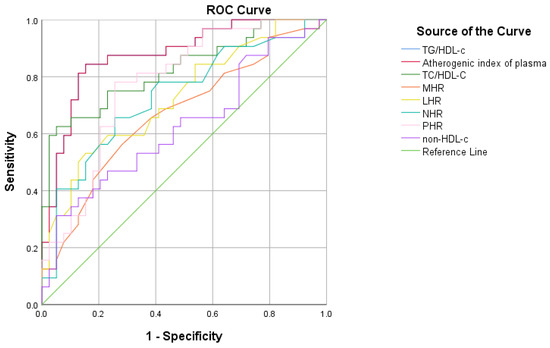
Figure 4.
ROC curve analysis to evaluate the diagnostic performances of inflammatory and cardioembolic indexes in MetS in children and adolescents with obesity.
4. Discussion
In this retrospective study, we aimed to evaluate the practicality of using new inflammation and cardioembolic indexes derived from basic paraclinical analysis to distinguish between children and adolescents with different degrees of obesity and MetS. Additionally, we sought to determine the effectiveness of these markers in detecting the low-grade inflammation associated with these conditions. Our goal is to provide clinicians with affordable, easy to reproduce, and available-on-large-scale tools that can be used in everyday clinical settings.
One of the non-communicable diseases that is taking over the world today is obesity [50]. Over the years, various methods were used to assess body weight, but, until today, at populational level, the one that proved to be the most efficient was the BMI [51,52]. In our study, BMI was the tool that helped us divide the subjects into categories based on the severity of obesity, according to BMI percentile, as recommended by the CDC.
Several studies have confirmed that in individuals with obesity, the chronic low-grade inflammation of adipose tissue is linked to metabolic disease and organ tissue complications [53]. Lately, adipose tissue has been considered to be an endocrinologically and metabolically active organ, which is capable of producing cytokines and other inflammatory mediators [54]. These cytokines regulate both the starting and the resolution of inflammation, as well as adaptive and reparative angiogenesis [55]. Weight gain and obesity trigger a phenotypic change characterized by inflamed, dysfunctional adipose cells and the infiltration of immune cells into the stromal vascular fraction [53,56]. Adipocytes release proinflammatory cytokines that disrupt the normal functions of adipose tissue and other organs, so, as a result, it acts like an immune and secretory organ, which is making obesity an inflammatory immune disease [56].
A metanalysis published in 2024 assessing the global prevalence of overweight and obesity across children and adolescents which included 2033 studies from 154 countries reported an 8.5% prevalence across these age groups, with one out of five children being affected by this pathology [57]. Also, they determined that numbers have a great variation when the Human Development index was taken into consideration [57,58]. According to the WHO European Childhood Obesity Surveillance Initiative (COSI), between 2018 and 2020, the prevalence of pediatric overweight was 17.5%, while it was 14.2% for obesity, with boys being the most affected [57,59,60] In our study, which included Caucasian children and adolescents from the southern part of Romania, 7% were diagnosed with overweight, 49.3% with obesity, and 43.7% with severe obesity. Also, when looking at the gender, we can confirm there is a real preponderance of males. This can maybe be explained by the fact that in Romania, children with excess weight are labeled as “fat and beautiful”, especially when it comes to boys, who are not only allowed, but encouraged to be puffier than their female peers, regardless of age.
When it comes to the distribution of gender across the pediatric population with MetS, some studies suggest there is also a greater number of boys with this pathology [61,62], but in the study we conducted, we determined gender had no influence across MetS groups, even if there was a higher number of boys in each category. Research suggests that males may have different genetic predispositions and hormonal responses to obesity, as they tend to accumulate more visceral fat, which is more metabolically active and associated with higher risks of insulin resistance and inflammation [63]. The small sample size and homogeneous population from our study may influence the results we obtained.
Even if the fact that MetS is affecting more and more children and adolescents worldwide, there is not one generally accepted definition for this age group [20], mostly due to the fact that there are controversies regarding the cutoff points [64]. Two of definitions are mostly used in clinical settings: the International Diabetes Federation (IDF) consensus [65] and the National Cholesterol Education Program (NCEP) Adult Treatment Panel-III (ATP-III) criteria modified for children and adolescents [66,67], which we also used in our study as we consider it more fitted for the studied population. The prevalence of MetS in the pediatric population cannot be accurately assessed due to the wide range of diagnostic criteria that can be used [68]. A recent meta-analysis revealed significant differences in the prevalence of MetS among children and adolescents with overweight and obesity that are living in high-income countries, which Romania is also classified as [69]. The prevalence ranged from 25.25% using the IDF criteria to 39.41% using the definition by de Ferranti et al. [70], while the same study gives a 24.47% prevalence when using the NCEP-ATP-III criteria. As expected, due to the fact that we only have included a small number of subjects, which are also diagnosed with obesity, the prevalence of MetS is far greater, with more than half meeting three or more criteria.
As there are five components of MetS, we examined which were the most encountered and determined that HDL-C was by far the most common, not only in the group diagnosed with MetS but also in the non-MetS group. There are some studies in the literature that also spotted this change in cholesterol distribution [66,70]. An explanation for this could be that HDL-C levels are influenced by a poor diet, high in processed foods, and inadequate lifestyle, particularly involving a lack of exercise, which has been shown to be deficient in the pediatric population with weight gain [71,72,73,74].
As expected, and confirmed by other authors too, the levels of blood pressure and triglycerides are higher, and the HDL-C is lower in the MetS group [68,75]. Even though MetS is associated with insulin resistance that in some cases leads to altered blood glucose even to the point of T2DM [76], in our study, there was no statistically significant difference between the two groups. Considering that MetS is defined by five key components, with severity—and therefore cardiovascular risk—likely increasing as more criteria are met [77], we found it valuable to categorize the study subjects according to the number of MetS criteria. The results clearly indicate that as the number of MetS criteria increases, there is a corresponding rise in BMI, DBP, SBP, glycemia, and triglycerides, along with a decrease in HDL-C levels.
Infectious and viral diseases are often underlying causes of chronic illnesses [78,79,80]. Recent data show that systemic low-grade inflammation plays a key role in the development and worsening of chronic diseases [32]. Among the causes of low-grade inflammation are poor dietary habits, particularly those high in processed foods and low in essential nutrients, and lack of physical exercise, that predispose one to obesity [81]. In addition to traditional biomarkers like C-reactive protein [29], CBC derivate indexes are of great value. CBC is the paraclinical investigation that is available everywhere around the world, is cheap and easy to obtain, and the interest of the medical community in its use in detecting cardiovascular risk and inflammation among metabolic diseases, among other things, is obvious [82]. When it comes to other studies on this topic, opinions on CBC parameters and the ratios derived from it, and the ability to detect inflammation or cardiovascular risk in metabolic diseases in adults or children, it is controversial [82,83,84]. When we examined CBC components across MetS groups, as well as within the obesity categories, we found no significant differences in these parameters. Markers such as NLR, PLR, or SII, which were used in other studies on both children and adults and proved to have the capacity to identify the groups at risk [85,86,87], did not perform as well in our study. Regarding the NLR, a recent study determined that this marker is useful in adults but not in children and adolescents [88]. In our opinion, this can be explained by the fact that in the younger population, the inflammatory response is lower than in the adult population. We believe this difference may be due to various factors, including the shorter duration of exposure to metabolic risk factors, differences in immune system function, and the body’s ability to compensate and better adapt in childhood.
On the other hand, some newly introduced inflammatory and cardioembolic indexes used mostly in studies regarding metabolic disorders such as atherogenic index of plasma, TG/HDL-C, TC/HDL-C, MHR, LHR, NHR, and PHR were, in the current research, higher in the group of children and adolescents with MetS, being able to detect a low grade of inflammation and increased risk of developing CVD and T2DM. In a study from a neighboring area of Romania in which children and adolescents with obesity were also evaluated, the researchers highlight the role of these ratios in detecting and monitoring the variation of cardioembolic risk factors [85]. Moreover, regardless of age, these combined inflammatory and cardioembolic indexes proved to be effective in anticipating the dysregulations in the lipid profile and setup of insulin resistance [89,90,91,92].
While low-density lipoprotein cholesterol (LDL-C) is the traditional marker in dyslipidemia management, non-HDL-C has lately been considered a better predictor of cardiovascular disease risk [93,94]. For children with diabetes, the Pediatric NCEP Panel even recommends maintaining non-HDL-C levels below 120 mg/dL [95].
The ROC curve analysis determined the predictive ability and power of TG/HDL-C, the atherogenic index of plasma, TC/HDL-C, LHR, NHR, and PHR when it comes to the presence of MetS. These data are also sustained by other articles recently published with the focus on children and adolescents and also adults [85,96,97]. We determined that LHR rapidly decreases in sensitivity when the thresholds increase, which makes it useful in confirming a MetS positive individual. TC/HDL-C and non-HDL-C are balanced in sensitivity and specificity, a fact that makes them reliable markers for predicting MetS. The recent study by Cura-Esquivel et al. showed that TG/HDL-C and TC/HDL-C significantly increased with the number of MetS criteria. They also found that low-grade inflammation is correlated with MetS in children with excessive weight and that TG, HDL-C, and TG/HDL-C ratio are effective correctly identifying MetS [30].
ESR is an inflammatory marker that is widely used in clinical settings to assess acute conditions as it has a slow increase and remains steady for longer periods of time [98]. Compared to CRP, which is elevated in pediatric patients with MetS [29], ESR is more effective in specific situations like detecting low-grade bone and joint infections and monitoring disease activity in other conditions [98]. Its inability to detect low-grade inflammation in MetS and various stages of obesity was also confirmed in our study, as it showed no correlation with any of the conditions examined.
A limitation of our study is the small sample size. Information about COVID-19 vaccination status was not available in the patients’ files, which is another limitation of our study, as it could influence the immunological parameters. Moreover, the retrospective type is not ideal, as a prospective observational study where the evolution of subjects could be tracked for a longer period of time would add a significant value to the results we obtained. In the future, we plan to increase the number of subjects included. Also, we encourage other researchers to further investigate these inflammatory and cardioembolic indexes, which have proven to be valuable in assessing inflammation and future cardiovascular risk in both MetS and obesity in children and adolescents. It would be interesting to explore the relationship between these markers and dietary patterns and also have a control group of children and adolescents that are healthy.
Ultimately, we wish to emphasize the utility of using inflammatory and cardioembolic indices derived from basic paraclinical tests in assessing patients with obesity and MetS. We also encourage future researchers to explore the utility of these markers in monitoring the progress of patients undergoing both pharmacological and non-pharmacological interventions. These are great tools for clinicians due to their reproducibility, easy access, low-cost, and the possibility to use them regardless of age and sex.
5. Conclusions
In the current study, we indicated that the novel cardioembolic and inflammatory indexes, such as MHR, NHR, LHR, NHR, PHR, TG/HDL-C, the atherogenic index of plasma, and TC/HDL-C, are useful in assessing obesity and metabolic syndrome in children and adolescents. These indexes are particularly valuable due to the fact that they are easy to reproduce and use in clinical settings, widely available, and cost-effective, which makes them ideal for use in clinical settings.
Nonetheless, we found that widely used inflammatory indexes such as NLR, PLR, SII, and ESR—which have shown promising results in adults and in some studies involving the pediatric population—were not useful in differentiating MetS or varying degrees of obesity severity in our studied group.
However, our study is preliminary, and larger-scale studies are needed to further assess these indexes. Given the relatively small size of our cohort, the results are not generalizable to the broader population.
Supplementary Materials
The following supporting information can be downloaded at: https://www.mdpi.com/article/10.3390/life14091206/s1, Table S1: Descriptive statistics of MetS parameters depending on MetS presence and MetS diagnosis criteria; Table S2: Descriptive statistics of the clinical and paraclinical parameters according to the presence or absence of MetS; Table S3: Clinical and paraclinical diagnostic criteria values categorized by the number of MetS criteria met; Table S4: CBC parameters, inflammatory and cardioembolic indexes according to the presence or absence of MetS.
Author Contributions
Conceptualization, M.D.S. and M.-A.P.; methodology, M.-A.P.; software, M.-A.P.; validation, R.E.S. and Ș.B.V.; formal analysis, Ș.B.V. and C.M.I.; investigation, M.-A.P. and C.M.I.; resources, Ș.B.V. and M.D.S.; data curation, M.-M.F. and M.-A.P.; writing—original draft preparation, M.-A.P.; writing—review and editing, C.M.I., M.-M.F. and Ș.B.V.; supervision, R.E.S. and C.E.N.; project administration, C.E.N. and M.D.S. All authors have read and agreed to the published version of the manuscript.
Funding
The Article Processing Charges were funded by the University of Medicine and Pharmacy of Craiova, Romania.
Institutional Review Board Statement
The study was conducted in accordance with the Declaration of Helsinki, and approved by the Ethics Committee of University of Medicine and Pharmacy of Craiova (no. 221/28 September 2023).
Informed Consent Statement
We took all the measures to ensure the protection and confidentiality of the data by following the General Data Protection Regulation (GDPR). Specific attention was given to safeguarding the data of child participants, ensuring that all information collected was anonymized and securely stored. Parental consent was obtained for each child involved in the study at the moment of admission to the hospital (standard form from the patient’s record provided by the hospital), and data access was restricted to authorized personnel only. Our study adhered to the highest ethical standards for data protection and privacy.
Data Availability Statement
The original contributions presented in the study are included in the article; further inquiries can be directed to the corresponding author.
Conflicts of Interest
The authors declare no conflicts of interest.
References
- Govender, I.; Rangiah, S.; Kaswa, R.; Nzaumvila, D. Malnutrition in Children under the Age of 5 Years in a Primary Health Care Setting. South. Afr. Fam. Pract. 2021, 63, a5337. [Google Scholar] [CrossRef]
- World Health Organization. Available online: https://www.who.int/news-room/fact-sheets/detail/malnutrition (accessed on 18 August 2024).
- Pirgon, Ö.; Aslan, N. The Role of Urbanization in Childhood Obesity. J. Clin. Res. Pediatr. Endocrinol. 2015, 7, 163–167. [Google Scholar] [CrossRef]
- Ghattas, H.; Jamaluddine, Z.; Akik, C. Double Burden of Malnutrition in Children and Adolescents in the Arab Region. Lancet Child. Adolesc. Health 2021, 5, 462–464. [Google Scholar] [CrossRef]
- Hampl, S.E.; Hassink, S.G.; Skinner, A.C.; Armstrong, S.C.; Barlow, S.E.; Bolling, C.F.; Avila Edwards, K.C.; Eneli, I.; Hamre, R.; Joseph, M.M.; et al. Clinical Practice Guideline for the Evaluation and Treatment of Children and Adolescents with Obesity. Pediatrics 2023, 151, e2022060640. [Google Scholar] [CrossRef]
- The GBD 2015 Obesity Collaborators. Health Effects of Overweight and Obesity in 195 Countries over 25 Years. N. Engl. J. Med. 2017, 377, 13–27. [Google Scholar] [CrossRef]
- Kiosia, A.; Dagbasi, A.; Berkley, J.A.; Wilding, J.P.H.; Prendergast, A.J.; Li, J.V.; Swann, J.; Mathers, J.C.; Kerac, M.; Morrison, D.; et al. The Double Burden of Malnutrition in Individuals: Identifying Key Challenges and Re-thinking Research Focus. Nutr. Bull. 2024, 49, 132–145. [Google Scholar] [CrossRef]
- Centers of Disease Control and Prevention. Available online: https://www.cdc.gov/obesity/php/data-research/childhood-obesity-facts.html (accessed on 6 August 2024).
- Chung, S.T.; Krenek, A.; Magge, S.N. Childhood Obesity and Cardiovascular Disease Risk. Curr. Atheroscler. Rep. 2023, 25, 405–415. [Google Scholar] [CrossRef]
- Woolford, S.J.; Sidell, M.; Li, X.; Else, V.; Young, D.R.; Resnicow, K.; Koebnick, C. Changes in Body Mass Index Among Children and Adolescents During the COVID-19 Pandemic. JAMA 2021, 326, 1434. [Google Scholar] [CrossRef]
- Kang, H.M.; Jeong, D.C.; Suh, B.-K.; Ahn, M.B. The Impact of the Coronavirus Disease-2019 Pandemic on Childhood Obesity and Vitamin D Status. J. Korean Med. Sci. 2021, 36, e21. [Google Scholar] [CrossRef]
- Lubrecht, J.; Arayess, L.; Reijnders, D.; Hesselink, M.L.; ten Velde, G.; Janse, A.; von Rosenstiel, I.; van Mil, E.G.A.H.; Verweij, M.; Vreugdenhil, A.C.E. Weight Gain in Children during the COVID-19 Pandemic and the Protective Effect of Lifestyle Intervention in Children with Obesity. Obes. Facts 2022, 15, 600–608. [Google Scholar] [CrossRef]
- Thomas-Eapen, N. Childhood Obesity. Prim. Care Clin. Off. Pract. 2021, 48, 505–515. [Google Scholar] [CrossRef]
- Han, T.S.; Lean, M.E. A Clinical Perspective of Obesity, Metabolic Syndrome and Cardiovascular Disease. JRSM Cardiovasc. Dis. 2016, 5, 204800401663337. [Google Scholar] [CrossRef]
- Lin, X.; Li, H. Obesity: Epidemiology, Pathophysiology, and Therapeutics. Front. Endocrinol. 2021, 12, 706978. [Google Scholar] [CrossRef]
- Jankowska, A.; Brzeziński, M.; Romanowicz-Sołtyszewska, A.; Szlagatys Sidorkiewicz, A. Metabolic Syndrome in Obese Children-Clinical Prevalence and Risk Factors. Int. J. Env. Environ. Res. Public. Health 2021, 18, 1060. [Google Scholar] [CrossRef]
- April-Sanders, A.K.; Rodriguez, C.J. Metabolically Healthy Obesity Redefined. JAMA Netw. Open 2021, 4, e218860. [Google Scholar] [CrossRef]
- Magge, S.N.; Goodman, E.; Armstrong, S.C.; Daniels, S.; Corkins, M.; de Ferranti, S.; Golden, N.H.; Kim, J.H.; Magge, S.N.; Schwarzenberg, S.J.; et al. The Metabolic Syndrome in Children and Adolescents: Shifting the Focus to Cardiometabolic Risk Factor Clustering. Pediatrics 2017, 140, e20171603. [Google Scholar] [CrossRef]
- Stepan, M.D.; Vintilescu, Ș.B.; Streață, I.; Podeanu, M.A.; Florescu, D.N. The Role of Vitamin D in Obese Children with Non-Alcoholic Fatty Liver Disease and Associated Metabolic Syndrome. Nutrients 2023, 15, 2113. [Google Scholar] [CrossRef]
- Serbis, A.; Giapros, V.; Galli-Tsinopoulou, A.; Siomou, E. Metabolic Syndrome in Children and Adolescents: Is There a Universally Accepted Definition? Does It Matter? Metab. Syndr. Relat. Disord. 2020, 18, 462–470. [Google Scholar] [CrossRef]
- Tylutka, A.; Morawin, B.; Walas, Ł.; Michałek, M.; Gwara, A.; Zembron-Lacny, A. Assessment of Metabolic Syndrome Predictors in Relation to Inflammation and Visceral Fat Tissue in Older Adults. Sci. Rep. 2023, 13, 89. [Google Scholar] [CrossRef]
- Hildebrandt, X.; Ibrahim, M.; Peltzer, N. Cell Death and Inflammation during Obesity: “Know My Methods, WAT(Son)”. Cell Death Differ. 2023, 30, 279–292. [Google Scholar] [CrossRef]
- Schmidt, F.M.; Weschenfelder, J.; Sander, C.; Minkwitz, J.; Thormann, J.; Chittka, T.; Mergl, R.; Kirkby, K.C.; Faßhauer, M.; Stumvoll, M.; et al. Inflammatory Cytokines in General and Central Obesity and Modulating Effects of Physical Activity. PLoS ONE 2015, 10, e0121971. [Google Scholar] [CrossRef] [PubMed]
- Pal, M.; Febbraio, M.A.; Whitham, M. From Cytokine to Myokine: The Emerging Role of Interleukin-6 in Metabolic Regulation. Immunol. Cell Biol. 2014, 92, 331–339. [Google Scholar] [CrossRef] [PubMed]
- Weisberg, S.P.; McCann, D.; Desai, M.; Rosenbaum, M.; Leibel, R.L.; Ferrante, A.W. Obesity Is Associated with Macrophage Accumulation in Adipose Tissue. J. Clin. Investig. 2003, 112, 1796–1808. [Google Scholar] [CrossRef] [PubMed]
- Reddy, P.; Lent-Schochet, D.; Ramakrishnan, N.; McLaughlin, M.; Jialal, I. Metabolic Syndrome Is an Inflammatory Disorder: A Conspiracy between Adipose Tissue and Phagocytes. Clin. Chim. Acta 2019, 496, 35–44. [Google Scholar] [CrossRef] [PubMed]
- Ouchi, N.; Kihara, S.; Funahashi, T.; Nakamura, T.; Nishida, M.; Kumada, M.; Okamoto, Y.; Ohashi, K.; Nagaretani, H.; Kishida, K.; et al. Reciprocal Association of C-Reactive Protein With Adiponectin in Blood Stream and Adipose Tissue. Circulation 2003, 107, 671–674. [Google Scholar] [CrossRef]
- Dochiţ, C.M.; Stepan, A.E.; Mărgăritescu, C.; Florescu, M.M.; Simionescu, C.E. Immunoexpression of E-, P- and N-Cadherins in Ovarian Serous Malignant Tumors. Rom. J. Morphol. Embryol. 2019, 60, 1215–1219. [Google Scholar]
- Podeanu, M.-A.; Turcu-Stiolica, A.; Subțirelu, M.S.; Stepan, M.D.; Ionele, C.-M.; Gheonea, D.-I.; Vintilescu, B.Ș.; Sandu, R.E. C-Reactive Protein as a Marker of Inflammation in Children and Adolescents with Metabolic Syndrome: A Systematic Review and Meta-Analysis. Biomedicines 2023, 11, 2961. [Google Scholar] [CrossRef]
- Cura–Esquivel, I.; Perales-Quintana, M.M.; Torres-González, L.; Guzmán-Avilán, K.; Muñoz-Espinosa, L.; Cordero-Pérez, P. Metabolic, Inflammatory and Adipokine Differences on Overweight/Obese Children with and without Metabolic Syndrome: A Cross-Sectional Study. PLoS ONE 2023, 18, e0281381. [Google Scholar] [CrossRef]
- Grandl, G.; Wolfrum, C. Hemostasis, Endothelial Stress, Inflammation, and the Metabolic Syndrome. Semin. Immunopathol. 2018, 40, 215–224. [Google Scholar] [CrossRef]
- Pahwa, R.; Goyal, A.; Jialal, I. Chronic Inflammation. In StatPearls; StatPearls Publishing: Treasure Island, FL, USA, 2024. [Google Scholar]
- Stepan, A.E.; Mărgăritescu, C.; Stoica, L.E.; Stepan, M.D.; Simionescu, C.E. Clear Cell Renal Cell Carcinomas—Epithelial and Mesenchymal Immunophenotype. Rom. J. Morphol. Embryol. 2018, 59, 1189–1194. [Google Scholar]
- Minihane, A.M.; Vinoy, S.; Russell, W.R.; Baka, A.; Roche, H.M.; Tuohy, K.M.; Teeling, J.L.; Blaak, E.E.; Fenech, M.; Vauzour, D.; et al. Low-Grade Inflammation, Diet Composition and Health: Current Research Evidence and Its Translation. Br. J. Nutr. 2015, 114, 999–1012. [Google Scholar] [CrossRef] [PubMed]
- Rönnbäck, C.; Hansson, E. The Importance and Control of Low-Grade Inflammation Due to Damage of Cellular Barrier Systems That May Lead to Systemic Inflammation. Front. Neurol. 2019, 10, 533. [Google Scholar] [CrossRef] [PubMed]
- Al Khatib, A.M.; Stepan, A.E.; Margaritescu, C.; Simionescu, C.; Ciurea, R.N. E-Cadherin and Snail Immunoexpression in Colorectal Adenocarcinomas. Curr. Health Sci. J. 2019, 45, 204–209. [Google Scholar] [CrossRef] [PubMed]
- Daniels, S.R.; Greer, F.R. Lipid Screening and Cardiovascular Health in Childhood. Pediatrics 2008, 122, 198–208. [Google Scholar] [CrossRef]
- Chu, S.-Y.; Jung, J.-H.; Park, M.-J.; Kim, S.-H. Risk Assessment of Metabolic Syndrome in Adolescents Using the Triglyceride/High-Density Lipoprotein Cholesterol Ratio and the Total Cholesterol/High-Density Lipoprotein Cholesterol Ratio. Ann. Pediatr. Endocrinol. Metab. 2019, 24, 41–48. [Google Scholar] [CrossRef]
- Cook, S.; Weitzman, M.; Auinger, P.; Nguyen, M.; Dietz, W.H. Prevalence of a Metabolic Syndrome Phenotype in Adolescents. Arch. Pediatr. Adolesc. Med. 2003, 157, 821. [Google Scholar] [CrossRef]
- Giannini, C.; Santoro, N.; Caprio, S.; Kim, G.; Lartaud, D.; Shaw, M.; Pierpont, B.; Weiss, R. The Triglyceride-to-HDL Cholesterol Ratio. Diabetes Care 2011, 34, 1869–1874. [Google Scholar] [CrossRef]
- Pacifico, L.; Bonci, E.; Andreoli, G.; Romaggioli, S.; Di Miscio, R.; Lombardo, C.V.; Chiesa, C. Association of Serum Triglyceride-to-HDL Cholesterol Ratio with Carotid Artery Intima-Media Thickness, Insulin Resistance and Nonalcoholic Fatty Liver Disease in Children and Adolescents. Nutr. Metab. Cardiovasc. Dis. 2014, 24, 737–743. [Google Scholar] [CrossRef]
- Li, C.; Ford, E.S.; McBride, P.E.; Kwiterovich, P.O.; McCrindle, B.W.; Gidding, S.S. Non–High-Density Lipoprotein Cholesterol Concentration Is Associated with the Metabolic Syndrome among US Youth Aged 12–19 Years. J. Pediatr. 2011, 158, 201–207. [Google Scholar] [CrossRef]
- Robinson, J.G.; Wang, S.; Smith, B.J.; Jacobson, T.A. Meta-Analysis of the Relationship Between Non–High-Density Lipoprotein Cholesterol Reduction and Coronary Heart Disease Risk. J. Am. Coll. Cardiol. 2009, 53, 316–322. [Google Scholar] [CrossRef]
- Song, Y.; Zhao, Y.; Shu, Y.; Zhang, L.; Cheng, W.; Wang, L.; Shu, M.; Xue, B.; Wang, R.; Feng, Z.; et al. Combination Model of Neutrophil to High-Density Lipoprotein Ratio and System Inflammation Response Index Is More Valuable for Predicting Peripheral Arterial Disease in Type 2 Diabetic Patients: A Cross-Sectional Study. Front. Endocrinol. 2023, 14, 1100453. [Google Scholar] [CrossRef] [PubMed]
- U.S. Centers for Disease Control and Prevention (CDC). Available online: https://www.cdc.gov/bmi/child-teen-calculator/index.html (accessed on 6 August 2024).
- MSD MANUAL Professional Version. Blood Pressure Percentiles for Boys (2–17 Years). Available online: https://www.msdmanuals.com/professional/multimedia/clinical-calculator/blood-pressure-percentiles-for-boys-2-17-years (accessed on 11 August 2024).
- MDS MANUAL Professional Version. Blood Pressure Percentiles for Girls (2–17 Years). Available online: https://www.msdmanuals.com/professional/multimedia/clinical-calculator/blood-pressure-percentiles-for-girls-2-17-years (accessed on 11 August 2024).
- Lemieux, I.; Després, J.-P. Metabolic Syndrome: Past, Present and Future. Nutrients 2020, 12, 3501. [Google Scholar] [CrossRef] [PubMed]
- Shapiro, S.S.; Wilk, M.B. An Analysis of Variance Test for Normality (Complete Samples). Biometrika 1965, 52, 591. [Google Scholar] [CrossRef]
- Monsalve, F.A.; Delgado-López, F.; Fernández-Tapia, B.; González, D.R. Adipose Tissue, Non-Communicable Diseases, and Physical Exercise: An Imperfect Triangle. Int. J. Mol. Sci. 2023, 24, 17168. [Google Scholar] [CrossRef] [PubMed]
- Wu, Y.; Li, D.; Vermund, S.H. Advantages and Limitations of the Body Mass Index (BMI) to Assess Adult Obesity. Int. J. Env. Environ. Res. Public. Health 2024, 21, 757. [Google Scholar] [CrossRef]
- Khanna, D.; Peltzer, C.; Kahar, P.; Parmar, M.S. Body Mass Index (BMI): A Screening Tool Analysis. Cureus 2022, 14, e22119. [Google Scholar] [CrossRef]
- Kawai, T.; Autieri, M.V.; Scalia, R. Adipose Tissue Inflammation and Metabolic Dysfunction in Obesity. Am. J. Physiol.-Cell Physiol. 2021, 320, C375–C391. [Google Scholar] [CrossRef]
- Chen, T.; Chen, H.; Xiao, H.; Tang, H.; Xiang, Z.; Wang, X.; Wang, X.; Zou, H. Comparison of the Value of Neutrophil to High-Density Lipoprotein Cholesterol Ratio and Lymphocyte to High-Density Lipoprotein Cholesterol Ratio for Predicting Metabolic Syndrome Among a Population in the Southern Coast of China. Diabetes Metab. Syndr. Obes. 2020, 13, 597–605. [Google Scholar] [CrossRef]
- Khanna, D.; Khanna, S.; Khanna, P.; Kahar, P.; Patel, B.M. Obesity: A Chronic Low-Grade Inflammation and Its Markers. Cureus 2022, 14, e22711. [Google Scholar] [CrossRef]
- Clemente-Suárez, V.J.; Redondo-Flórez, L.; Beltrán-Velasco, A.I.; Martín-Rodríguez, A.; Martínez-Guardado, I.; Navarro-Jiménez, E.; Laborde-Cárdenas, C.C.; Tornero-Aguilera, J.F. The Role of Adipokines in Health and Disease. Biomedicines 2023, 11, 1290. [Google Scholar] [CrossRef]
- Zhang, X.; Liu, J.; Ni, Y.; Yi, C.; Fang, Y.; Ning, Q.; Shen, B.; Zhang, K.; Liu, Y.; Yang, L.; et al. Global Prevalence of Overweight and Obesity in Children and Adolescents. JAMA Pediatr. 2024, 178, 800. [Google Scholar] [CrossRef] [PubMed]
- United Nations Development Programme. Human Development Index (HDI). Available online: https://hdr.undp.org/data-center/human-development-index#/indicies/hdi (accessed on 17 August 2024).
- World Health Organization. Regional Office for Europe. Available online: https://www.who.int/europe/publications/i/item/who-euro-2022-6594-46360-67071 (accessed on 17 August 2024).
- Global Obesity Observatory. Available online: https://data.worldobesity.org/country/romania-178/#data_prevalence (accessed on 17 August 2024).
- Alipour, P.; Azizi, Z.; Raparelli, V.; Norris, C.M.; Kautzky-Willer, A.; Kublickiene, K.; Herrero, M.T.; El Emam, K.; Vollenweider, P.; Preisig, M.; et al. Role of Sex and Gender-Related Variables in Development of Metabolic Syndrome: A Prospective Cohort Study. Eur. J. Intern. Med. 2023, 121, 63–75. [Google Scholar] [CrossRef] [PubMed]
- Choi, J.; Yoon, T.W.; Yu, M.H.; Kang, D.R.; Choi, S. Gender and Age Differences in the Prevalence and Associated Factors of Metabolic Syndrome among Children and Adolescents in South Korea. Child. Health Nurs. Res. 2021, 27, 160–170. [Google Scholar] [CrossRef] [PubMed]
- Koceva, A.; Herman, R.; Janez, A.; Rakusa, M.; Jensterle, M. Sex- and Gender-Related Differences in Obesity: From Pathophysiological Mechanisms to Clinical Implications. Int. J. Mol. Sci. 2024, 25, 7342. [Google Scholar] [CrossRef] [PubMed]
- Zong, X.; Kelishadi, R.; Kim, H.S.; Schwandt, P.; Matsha, T.E.; Mill, J.G.; Caserta, C.A.; Medeiros, C.C.M.; Kollias, A.; Whincup, P.H.; et al. A Proposed Simplified Definition of Metabolic Syndrome in Children and Adolescents: A Global Perspective. BMC Med. 2024, 22, 190. [Google Scholar] [CrossRef] [PubMed]
- Zimmet, P.; Alberti, K.G.M.; Kaufman, F.; Tajima, N.; Silink, M.; Arslanian, S.; Wong, G.; Bennett, P.; Shaw, J.; Caprio, S. The Metabolic Syndrome in Children and Adolescents ? An IDF Consensus Report. Pediatr. Diabetes 2007, 8, 299–306. [Google Scholar] [CrossRef]
- Bitew, Z.W.; Alemu, A.; Ayele, E.G.; Tenaw, Z.; Alebel, A.; Worku, T. Metabolic Syndrome among Children and Adolescents in Low and Middle Income Countries: A Systematic Review and Meta-Analysis. Diabetol. Metab. Syndr. 2020, 12, 93. [Google Scholar] [CrossRef]
- Swarup, S.; Goyal, A.; Grigorova, Y.; Zeltser, R. Metabolic Syndrome; StatPearls Publishing: Treasure Island, FL, USA, 2023. [Google Scholar]
- Chung, Y.L.; Rhie, Y.-J. Metabolic Syndrome in Children and Adolescents. Ewha Med. J. 2022, 45, 2234–2591. [Google Scholar] [CrossRef]
- World Bank Group. Available online: https://data.worldbank.org/indicator/ny.gdp.mktp.cd?view=map.&locations=xd-ro (accessed on 16 August 2024).
- Bitew, Z.W.; Alemu, A.; Tenaw, Z.; Alebel, A.; Worku, T.; Ayele, E.G. Prevalence of Metabolic Syndrome among Children and Adolescents in High-Income Countries: A Systematic Review and Meta-Analysis of Observational Studies. Biomed. Res. Int. 2021, 2021, 6661457. [Google Scholar] [CrossRef]
- Williams, P.T.; Stefanick, M.L.; Vranizan, K.M.; Wood, P.D. The Effects of Weight Loss by Exercise or by Dieting on Plasma High-Density Lipoprotein (HDL) Levels in Men with Low, Intermediate, and Normal-to-High HDL at Baseline. Metabolism 1994, 43, 917–924. [Google Scholar] [CrossRef]
- Akbarzadeh, Z.; Nourian, M.; Hovsepian, S.; Kelishadi, R. Dietary Patterns and Metabolic Syndrome in Children and Adolescents: A Systematic Review. J. Pediatr. Rev. 2017, 6, 2–13. [Google Scholar] [CrossRef]
- Tian, Y.; Su, L.; Wang, J.; Duan, X.; Jiang, X. Fruit and Vegetable Consumption and Risk of the Metabolic Syndrome: A Meta-Analysis. Public. Health Nutr. 2018, 21, 756–765. [Google Scholar] [CrossRef] [PubMed]
- Bleich, S.N.; Cutler, D.; Murray, C.; Adams, A. Why Is the Developed World Obese? Annu. Rev. Public. Health 2008, 29, 273–295. [Google Scholar] [CrossRef] [PubMed]
- Hamed, N.; Soliman, A.; De Sanctis, V.; Alaaraj, N.; Alyafei, F.; Shaat, M.; Aljaffali, N.; Itani, M.; Jour, C. The Prevalence of the Different Components of the Metabolic Syndrome (MetS) in Obese Nondiabetic Children and Young Adolescents and Their Anthropometric Data in Relation to Parents. Acta Biomed. 2021, 92, e2021321. [Google Scholar] [CrossRef]
- Cho, J.; Hong, H.; Park, S.; Kim, S.; Kang, H. Insulin Resistance and Its Association with Metabolic Syndrome in Korean Children. Biomed. Res. Int. 2017, 2017, 8728017. [Google Scholar] [CrossRef]
- Vishnu, A.; Gurka, M.J.; DeBoer, M.D. The Severity of the Metabolic Syndrome Increases over Time within Individuals, Independent of Baseline Metabolic Syndrome Status and Medication Use: The Atherosclerosis Risk in Communities Study. Atherosclerosis 2015, 243, 278–285. [Google Scholar] [CrossRef]
- Doron, S.; Gorbach, S.L. Bacterial Infections: Overview. In International Encyclopedia of Public Health; Elsevier: Amsterdam, The Netherlands, 2008; pp. 273–282. [Google Scholar]
- Najafi, M.; Lemon, S.M.; O’Connor, S.; Knobler, S.L. The Infectious Etiology of Chronic Diseases: Defining the Relationship, Enhancing the Research, and Mitigating the Effects: Workshop Summary; The National Academies Press: Washington, DC, USA, 2004; ISBN 978-0-309-08994-4. [Google Scholar] [CrossRef]
- Șurlin, P.; Camen, A.; Stratul, S.I.; Roman, A.; Gheorghe, D.-N.; Herăscu, E.; Osiac, E.; Rogoveanu, I. Optical Coherence Tomography Assessment of Gingival Epithelium Inflammatory Status in Periodontal—Systemic Affected Patients. Ann. Anat. Anat. Anz. 2018, 219, 51–56. [Google Scholar] [CrossRef]
- Hart, M.J.; Torres, S.J.; McNaughton, S.A.; Milte, C.M. Dietary Patterns and Associations with Biomarkers of Inflammation in Adults: A Systematic Review of Observational Studies. Nutr. J. 2021, 20, 24. [Google Scholar] [CrossRef]
- Seo, I.-H.; Lee, Y.-J. Usefulness of Complete Blood Count (CBC) to Assess Cardiovascular and Metabolic Diseases in Clinical Settings: A Comprehensive Literature Review. Biomedicines 2022, 10, 2697. [Google Scholar] [CrossRef]
- Stein, A.; Molero, H.; Hess, D.; Luquette, M.; Pitt, M.B. Tension Pneumothorax with Evolving Cysts in an Infant. Pediatr. Rev. 2020, 41, E42–E45. [Google Scholar] [CrossRef]
- Aypak, C.; Türedi, Ö.; Bircan, M.A.; Yüce, A. Could Mean Platelet Volume among Complete Blood Count Parameters Be a Surrogate Marker of Metabolic Syndrome in Pre-Pubertal Children? Platelets 2014, 25, 393–398. [Google Scholar] [CrossRef] [PubMed]
- Nicoară, D.-M.; Munteanu, A.-I.; Scutca, A.-C.; Mang, N.; Juganaru, I.; Brad, G.-F.; Mărginean, O. Assessing the Relationship between Systemic Immune-Inflammation Index and Metabolic Syndrome in Children with Obesity. Int. J. Mol. Sci. 2023, 24, 8414. [Google Scholar] [CrossRef] [PubMed]
- Liu, K.; Tang, S.; Liu, C.; Ma, J.; Cao, X.; Yang, X.; Zhu, Y.; Chen, K.; Liu, Y.; Zhang, C.; et al. Systemic Immune-Inflammatory Biomarkers (SII, NLR, PLR and LMR) Linked to Non-Alcoholic Fatty Liver Disease Risk. Front. Immunol. 2024, 15, 1337241. [Google Scholar] [CrossRef] [PubMed]
- Buyukkaya, E.; Karakaş, M.F.; Karakaş, E.; Akçay, A.B.; Tanboga, I.H.; Kurt, M.; Sen, N. Correlation of Neutrophil to Lymphocyte Ratio With the Presence and Severity of Metabolic Syndrome. Clin. Appl. Thromb. Hemost. 2014, 20, 159–163. [Google Scholar] [CrossRef] [PubMed]
- Marra, A.; Bondesan, A.; Caroli, D.; Grugni, G.; Sartorio, A. The Neutrophil to Lymphocyte Ratio (NLR) Positively Correlates with the Presence and Severity of Metabolic Syndrome in Obese Adults, but Not in Obese Children/Adolescents. BMC Endocr. Disord. 2023, 23, 121. [Google Scholar] [CrossRef]
- von Bibra, H.; Saha, S.; Hapfelmeier, A.; Müller, G.; Schwarz, P. Impact of the Triglyceride/High-Density Lipoprotein Cholesterol Ratio and the Hypertriglyceremic-Waist Phenotype to Predict the Metabolic Syndrome and Insulin Resistance. Horm. Metab. Res. 2017, 49, 542–549. [Google Scholar] [CrossRef]
- Krawczyk, M.; Rumińska, M.; Witkowska-Sędek, E.; Majcher, A.; Pyrżak, B. Usefulness of the Triglycerides to High-Density Lipoprotein Cholesterol Ratio (TG/HDL-C) in Prediction of Metabolic Syndrome in Polish Obese Children and Adolescents. Acta Biochim. Pol. 2018, 65, 605–611. [Google Scholar] [CrossRef]
- Burns, S.F.; Lee, S.J.; Arslanian, S.A. Surrogate Lipid Markers for Small Dense Low-Density Lipoprotein Particles in Overweight Youth. J. Pediatr. 2012, 161, 991–996. [Google Scholar] [CrossRef]
- Gasevic, D.; Frohlich, J.; Mancini, G.J.; Lear, S.A. Clinical Usefulness of Lipid Ratios to Identify Men and Women with Metabolic Syndrome: A Cross-Sectional Study. Lipids Health Dis. 2014, 13, 159. [Google Scholar] [CrossRef]
- Silverio, R.N.C.; de Aquino Lacerda, E.M.; Fortins, R.F.; de Lima, G.C.F.; Scancetti, L.B.; do Carmo, C.N.; da Cunha, L.V.S.; Luescher, J.L.; de Carvalho Padilha, P. Predictive Factors of Non-HDL Cholesterol in Children and Adolescents with Type 1 Diabetes Mellitius: A Cross-Sectional Study. Diabetes Res. Clin. Pract. 2019, 154, 9–16. [Google Scholar] [CrossRef]
- Raja, V.; Aguiar, C.; Alsayed, N.; Chibber, Y.S.; ElBadawi, H.; Ezhov, M.; Hermans, M.P.; Pandey, R.C.; Ray, K.K.; Tokgözoglu, L.; et al. Non-HDL-Cholesterol in Dyslipidemia: Review of the State-of-the-Art Literature and Outlook. Atherosclerosis 2023, 383, 117312. [Google Scholar] [CrossRef] [PubMed]
- Expert Panel on Integrated Guidelines for Cardiovascular Health and Risk Reduction in Children and Adolescents. Expert Panel on Integrated Guidelines for Cardiovascular Health and Risk Reduction in Children and Adolescents: Summary Report. Pediatrics 2011, 128, S213–S256. [Google Scholar] [CrossRef] [PubMed]
- Marra, A.; Bondesan, A.; Caroli, D.; Sartorio, A. Complete Blood Count-Derived Inflammation Indexes Are Useful in Predicting Metabolic Syndrome in Children and Adolescents with Severe Obesity. J. Clin. Med. 2024, 13, 2120. [Google Scholar] [CrossRef] [PubMed]
- Marra, A.; Bondesan, A.; Caroli, D.; Sartorio, A. Complete Blood Count (CBC)-Derived Inflammation Indexes Are Useful in Predicting Metabolic Syndrome in Adults with Severe Obesity. J. Clin. Med. 2024, 13, 1353. [Google Scholar] [CrossRef]
- Assasi, N.; Blackhouse, G.; Campbell, K.; Hopkins, R.B.; Levine, M.; Richter, T.; Budden, A. Comparative Value of Erythrocyte Sedimentation Rate (ESR) and C-Reactive Protein (CRP) Testing in Combination Versus Individually for the Diagnosis of Undifferentiated Patients with Suspected Inflammatory Disease or Serious Infection: A Systematic Review and Economic Analysis; Canadian Agency for Drugs and Technologies in Health: Ottawa, ON, Canada, 2015. [Google Scholar]


Disclaimer/Publisher’s Note: The statements, opinions and data contained in all publications are solely those of the individual author(s) and contributor(s) and not of MDPI and/or the editor(s). MDPI and/or the editor(s) disclaim responsibility for any injury to people or property resulting from any ideas, methods, instructions or products referred to in the content. |
© 2024 by the authors. Licensee MDPI, Basel, Switzerland. This article is an open access article distributed under the terms and conditions of the Creative Commons Attribution (CC BY) license (https://creativecommons.org/licenses/by/4.0/).